Vitamin D (quantile) - Liver
wesleycrouse
2021-09-09
Last updated: 2021-09-09
Checks: 6 1
Knit directory: ctwas_applied/
This reproducible R Markdown analysis was created with workflowr (version 1.6.2). The Checks tab describes the reproducibility checks that were applied when the results were created. The Past versions tab lists the development history.
The R Markdown file has unstaged changes. To know which version of the R Markdown file created these results, you’ll want to first commit it to the Git repo. If you’re still working on the analysis, you can ignore this warning. When you’re finished, you can run wflow_publish to commit the R Markdown file and build the HTML.
Great job! The global environment was empty. Objects defined in the global environment can affect the analysis in your R Markdown file in unknown ways. For reproduciblity it’s best to always run the code in an empty environment.
The command set.seed(20210726) was run prior to running the code in the R Markdown file. Setting a seed ensures that any results that rely on randomness, e.g. subsampling or permutations, are reproducible.
Great job! Recording the operating system, R version, and package versions is critical for reproducibility.
Nice! There were no cached chunks for this analysis, so you can be confident that you successfully produced the results during this run.
Great job! Using relative paths to the files within your workflowr project makes it easier to run your code on other machines.
Great! You are using Git for version control. Tracking code development and connecting the code version to the results is critical for reproducibility.
The results in this page were generated with repository version 59e5f4d. See the Past versions tab to see a history of the changes made to the R Markdown and HTML files.
Note that you need to be careful to ensure that all relevant files for the analysis have been committed to Git prior to generating the results (you can use wflow_publish or wflow_git_commit). workflowr only checks the R Markdown file, but you know if there are other scripts or data files that it depends on. Below is the status of the Git repository when the results were generated:
Unstaged changes:
    Modified:   analysis/ukb-d-30500_irnt_Liver.Rmd
    Modified:   analysis/ukb-d-30600_irnt_Liver.Rmd
    Modified:   analysis/ukb-d-30610_irnt_Liver.Rmd
    Modified:   analysis/ukb-d-30620_irnt_Liver.Rmd
    Modified:   analysis/ukb-d-30630_irnt_Liver.Rmd
    Modified:   analysis/ukb-d-30640_irnt_Liver.Rmd
    Modified:   analysis/ukb-d-30650_irnt_Liver.Rmd
    Modified:   analysis/ukb-d-30660_irnt_Liver.Rmd
    Modified:   analysis/ukb-d-30670_irnt_Liver.Rmd
    Modified:   analysis/ukb-d-30680_irnt_Liver.Rmd
    Modified:   analysis/ukb-d-30690_irnt_Liver.Rmd
    Modified:   analysis/ukb-d-30700_irnt_Liver.Rmd
    Modified:   analysis/ukb-d-30710_irnt_Liver.Rmd
    Modified:   analysis/ukb-d-30720_irnt_Liver.Rmd
    Modified:   analysis/ukb-d-30730_irnt_Liver.Rmd
    Modified:   analysis/ukb-d-30740_irnt_Liver.Rmd
    Modified:   analysis/ukb-d-30750_irnt_Liver.Rmd
    Modified:   analysis/ukb-d-30760_irnt_Liver.Rmd
    Modified:   analysis/ukb-d-30770_irnt_Liver.Rmd
    Modified:   analysis/ukb-d-30780_irnt_Liver.Rmd
    Modified:   analysis/ukb-d-30790_irnt_Liver.Rmd
    Modified:   analysis/ukb-d-30800_irnt_Liver.Rmd
    Modified:   analysis/ukb-d-30810_irnt_Liver.Rmd
    Modified:   analysis/ukb-d-30820_irnt_Liver.Rmd
    Modified:   analysis/ukb-d-30830_irnt_Liver.Rmd
    Modified:   analysis/ukb-d-30840_irnt_Liver.Rmd
    Modified:   analysis/ukb-d-30850_irnt_Liver.Rmd
    Modified:   analysis/ukb-d-30860_irnt_Liver.Rmd
    Modified:   analysis/ukb-d-30870_irnt_Liver.Rmd
    Modified:   analysis/ukb-d-30880_irnt_Liver.Rmd
    Modified:   analysis/ukb-d-30890_irnt_Liver.Rmd
Note that any generated files, e.g. HTML, png, CSS, etc., are not included in this status report because it is ok for generated content to have uncommitted changes.
These are the previous versions of the repository in which changes were made to the R Markdown (analysis/ukb-d-30890_irnt_Liver.Rmd) and HTML (docs/ukb-d-30890_irnt_Liver.html) files. If you’ve configured a remote Git repository (see ?wflow_git_remote), click on the hyperlinks in the table below to view the files as they were in that past version.
| File | Version | Author | Date | Message |
|---|---|---|---|---|
| Rmd | cbf7408 | wesleycrouse | 2021-09-08 | adding enrichment to reports |
| html | cbf7408 | wesleycrouse | 2021-09-08 | adding enrichment to reports |
| Rmd | 4970e3e | wesleycrouse | 2021-09-08 | updating reports |
| html | 4970e3e | wesleycrouse | 2021-09-08 | updating reports |
| Rmd | dfd2b5f | wesleycrouse | 2021-09-07 | regenerating reports |
| html | dfd2b5f | wesleycrouse | 2021-09-07 | regenerating reports |
| Rmd | 61b53b3 | wesleycrouse | 2021-09-06 | updated PVE calculation |
| html | 61b53b3 | wesleycrouse | 2021-09-06 | updated PVE calculation |
| Rmd | 837dd01 | wesleycrouse | 2021-09-01 | adding additional fixedsigma report |
| Rmd | d0a5417 | wesleycrouse | 2021-08-30 | adding new reports to the index |
| Rmd | 0922de7 | wesleycrouse | 2021-08-18 | updating all reports with locus plots |
| html | 0922de7 | wesleycrouse | 2021-08-18 | updating all reports with locus plots |
| html | 1c62980 | wesleycrouse | 2021-08-11 | Updating reports |
| Rmd | 5981e80 | wesleycrouse | 2021-08-11 | Adding more reports |
| html | 5981e80 | wesleycrouse | 2021-08-11 | Adding more reports |
| Rmd | da9f015 | wesleycrouse | 2021-08-07 | adding more reports |
| html | da9f015 | wesleycrouse | 2021-08-07 | adding more reports |
Overview
These are the results of a ctwas analysis of the UK Biobank trait Vitamin D (quantile) using Liver gene weights.
The GWAS was conducted by the Neale Lab, and the biomarker traits we analyzed are discussed here. Summary statistics were obtained from IEU OpenGWAS using GWAS ID: ukb-d-30890_irnt. Results were obtained from from IEU rather than Neale Lab because they are in a standardard format (GWAS VCF). Note that 3 of the 34 biomarker traits were not available from IEU and were excluded from analysis.
The weights are mashr GTEx v8 models on Liver eQTL obtained from PredictDB. We performed a full harmonization of the variants, including recovering strand ambiguous variants. This procedure is discussed in a separate document. (TO-DO: add report that describes harmonization)
LD matrices were computed from a 10% subset of Neale lab subjects. Subjects were matched using the plate and well information from genotyping. We included only biallelic variants with MAF>0.01 in the original Neale Lab GWAS. (TO-DO: add more details [number of subjects, variants, etc])
Weight QC
TO-DO: add enhanced QC reporting (total number of weights, why each variant was missing for all genes)
qclist_all <- list()

qc_files <- paste0(results_dir, "/", list.files(results_dir, pattern="exprqc.Rd"))

for (i in 1:length(qc_files)){
  load(qc_files[i])
  chr <- unlist(strsplit(rev(unlist(strsplit(qc_files[i], "_")))[1], "[.]"))[1]
  qclist_all[[chr]] <- cbind(do.call(rbind, lapply(qclist,unlist)), as.numeric(substring(chr,4)))
}

qclist_all <- data.frame(do.call(rbind, qclist_all))
colnames(qclist_all)[ncol(qclist_all)] <- "chr"

rm(qclist, wgtlist, z_gene_chr)

#number of imputed weights
nrow(qclist_all)
[1] 10901#number of imputed weights by chromosome
table(qclist_all$chr)
   1    2    3    4    5    6    7    8    9   10   11   12   13   14   15
1070  768  652  417  494  611  548  408  405  434  634  629  195  365  354
  16   17   18   19   20   21   22
 526  663  160  859  306  114  289
#proportion of imputed weights without missing variants
mean(qclist_all$nmiss==0)[1] 0.8366205Load ctwas results
#load ctwas results
ctwas_res <- data.table::fread(paste0(results_dir, "/", analysis_id, "_ctwas.susieIrss.txt"))

#make unique identifier for regions
ctwas_res$region_tag <- paste(ctwas_res$region_tag1, ctwas_res$region_tag2, sep="_")

#compute PVE for each gene/SNP
ctwas_res$PVE = ctwas_res$susie_pip*ctwas_res$mu2/sample_size #check PVE calculation

#separate gene and SNP results
ctwas_gene_res <- ctwas_res[ctwas_res$type == "gene", ]
ctwas_gene_res <- data.frame(ctwas_gene_res)
ctwas_snp_res <- ctwas_res[ctwas_res$type == "SNP", ]
ctwas_snp_res <- data.frame(ctwas_snp_res)

#add gene information to results
sqlite <- RSQLite::dbDriver("SQLite")
db = RSQLite::dbConnect(sqlite, paste0("/project2/compbio/predictdb/mashr_models/mashr_", weight, ".db"))
query <- function(...) RSQLite::dbGetQuery(db, ...)
gene_info <- query("select gene, genename from extra")
gene_info <- query("select gene, genename, gene_type from extra")
RSQLite::dbDisconnect(db)

ctwas_gene_res <- cbind(ctwas_gene_res, gene_info[sapply(ctwas_gene_res$id, match, gene_info$gene), c("genename", "gene_type")])

#add z score to results
load(paste0(results_dir, "/", analysis_id, "_expr_z_gene.Rd"))
ctwas_gene_res$z <- z_gene[ctwas_gene_res$id,]$z

#load(paste0(results_dir, "/", analysis_id, "_expr_z_snp.Rd")) #for new version, stored after harmonization
z_snp <- readRDS(paste0(results_dir, "/", trait_id, ".RDS")) #for old version, unharmonized

z_snp <- z_snp[z_snp$id %in% ctwas_snp_res$id,] #subset snps to those included in analysis, note some are duplicated, need to match which allele was used
ctwas_snp_res$z <- z_snp$z[match(ctwas_snp_res$id, z_snp$id)] #for duplicated snps, this arbitrarily uses the first allele
ctwas_snp_res$z_flag <- as.numeric(ctwas_snp_res$id %in% z_snp$id[duplicated(z_snp$id)]) #mark the unclear z scores, flag=1

#formatting and rounding for tables
ctwas_gene_res$z <- round(ctwas_gene_res$z,2)
ctwas_snp_res$z <- round(ctwas_snp_res$z,2)
ctwas_gene_res$susie_pip <- round(ctwas_gene_res$susie_pip,3)
ctwas_snp_res$susie_pip <- round(ctwas_snp_res$susie_pip,3)
ctwas_gene_res$mu2 <- round(ctwas_gene_res$mu2,2)
ctwas_snp_res$mu2 <- round(ctwas_snp_res$mu2,2)
ctwas_gene_res$PVE <- signif(ctwas_gene_res$PVE, 2)
ctwas_snp_res$PVE <- signif(ctwas_snp_res$PVE, 2)

#merge gene and snp results with added information
ctwas_gene_res$z_flag=NA
ctwas_snp_res$genename=NA
ctwas_snp_res$gene_type=NA

ctwas_res <- rbind(ctwas_gene_res,
                   ctwas_snp_res[,colnames(ctwas_gene_res)])

#store columns to report
report_cols <- colnames(ctwas_gene_res)[!(colnames(ctwas_gene_res) %in% c("type", "region_tag1", "region_tag2", "cs_index", "gene_type", "z_flag", "id", "chrom", "pos"))]
first_cols <- c("genename", "region_tag")
report_cols <- c(first_cols, report_cols[!(report_cols %in% first_cols)])

report_cols_snps <- c("id", report_cols[-1])

#get number of SNPs from s1 results; adjust for thin
ctwas_res_s1 <- data.table::fread(paste0(results_dir, "/", analysis_id, "_ctwas.s1.susieIrss.txt"))
n_snps <- sum(ctwas_res_s1$type=="SNP")/thin
rm(ctwas_res_s1)
Check convergence of parameters
library(ggplot2)
library(cowplot)
********************************************************Note: As of version 1.0.0, cowplot does not change the default ggplot2 theme anymore. To recover the previous behavior, execute:
theme_set(theme_cowplot())********************************************************load(paste0(results_dir, "/", analysis_id, "_ctwas.s2.susieIrssres.Rd"))
df <- data.frame(niter = rep(1:ncol(group_prior_rec), 2),
value = c(group_prior_rec[1,], group_prior_rec[2,]),
group = rep(c("Gene", "SNP"), each = ncol(group_prior_rec)))
df$group <- as.factor(df$group)
df$value[df$group=="SNP"] <- df$value[df$group=="SNP"]*thin #adjust parameter to account for thin argument
p_pi <- ggplot(df, aes(x=niter, y=value, group=group)) +
geom_line(aes(color=group)) +
geom_point(aes(color=group)) +
xlab("Iteration") + ylab(bquote(pi)) +
ggtitle("Prior mean") +
theme_cowplot()
df <- data.frame(niter = rep(1:ncol(group_prior_var_rec), 2),
value = c(group_prior_var_rec[1,], group_prior_var_rec[2,]),
group = rep(c("Gene", "SNP"), each = ncol(group_prior_var_rec)))
df$group <- as.factor(df$group)
p_sigma2 <- ggplot(df, aes(x=niter, y=value, group=group)) +
geom_line(aes(color=group)) +
geom_point(aes(color=group)) +
xlab("Iteration") + ylab(bquote(sigma^2)) +
ggtitle("Prior variance") +
theme_cowplot()
plot_grid(p_pi, p_sigma2)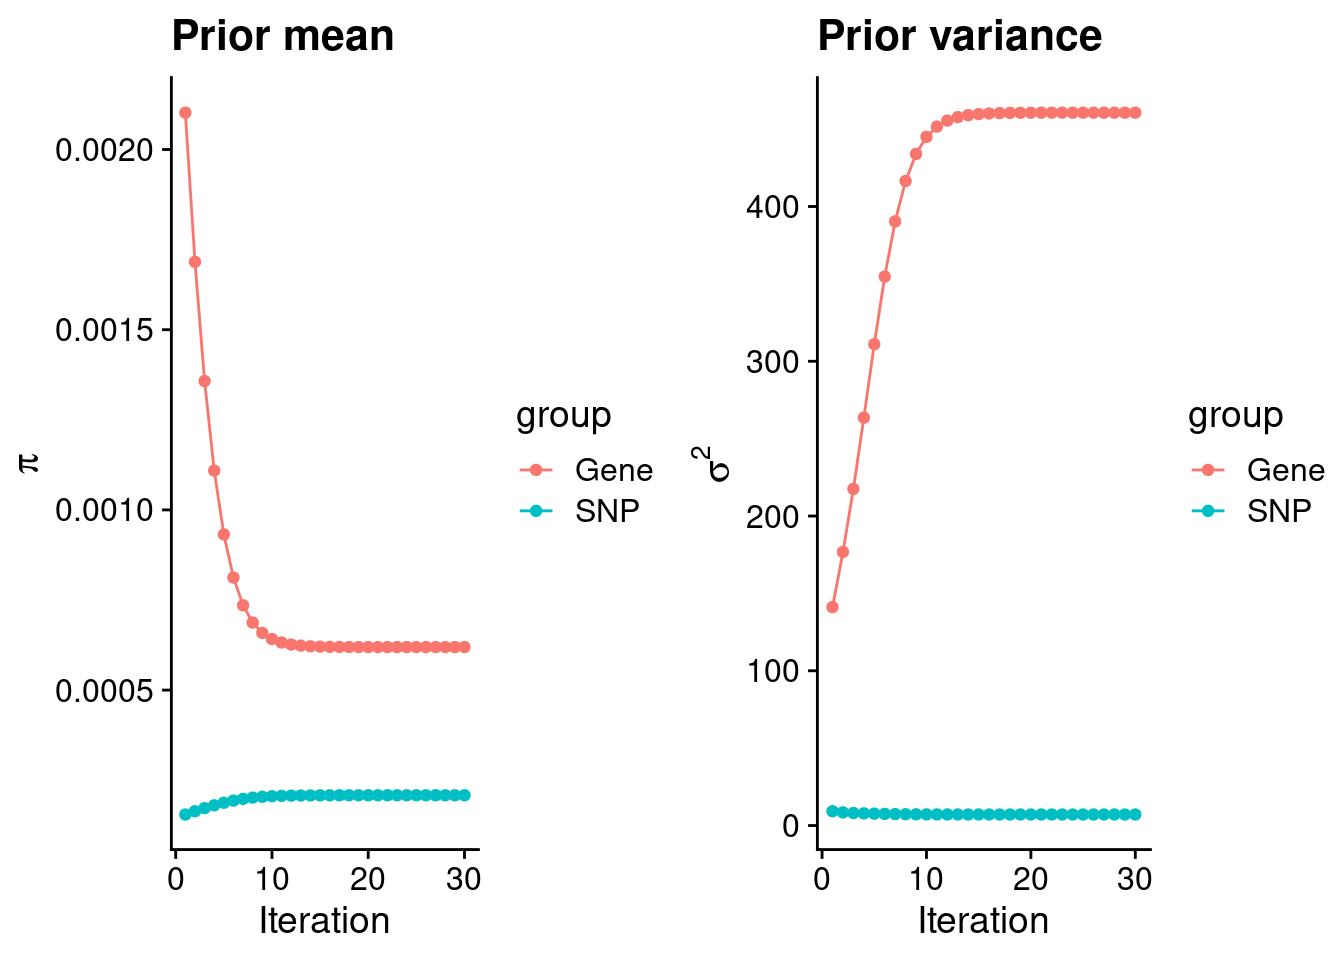
| Version | Author | Date |
|---|---|---|
| dfd2b5f | wesleycrouse | 2021-09-07 |
#estimated group prior
estimated_group_prior <- group_prior_rec[,ncol(group_prior_rec)]
names(estimated_group_prior) <- c("gene", "snp")
estimated_group_prior["snp"] <- estimated_group_prior["snp"]*thin #adjust parameter to account for thin argument
print(estimated_group_prior)
gene snp
0.0006193390 0.0002082376 #estimated group prior variance
estimated_group_prior_var <- group_prior_var_rec[,ncol(group_prior_var_rec)]
names(estimated_group_prior_var) <- c("gene", "snp")
print(estimated_group_prior_var) gene snp
460.626256 7.137193 #report sample size
print(sample_size)[1] 329247#report group size
group_size <- c(nrow(ctwas_gene_res), n_snps)
print(group_size)[1] 10901 8697330#estimated group PVE
estimated_group_pve <- estimated_group_prior_var*estimated_group_prior*group_size/sample_size #check PVE calculation
names(estimated_group_pve) <- c("gene", "snp")
print(estimated_group_pve) gene snp
0.009445427 0.039260035 #compare sum(PIP*mu2/sample_size) with above PVE calculation
c(sum(ctwas_gene_res$PVE),sum(ctwas_snp_res$PVE))[1] 0.01069282 0.33723205Genes with highest PIPs
#distribution of PIPs
hist(ctwas_gene_res$susie_pip, xlim=c(0,1), main="Distribution of Gene PIPs")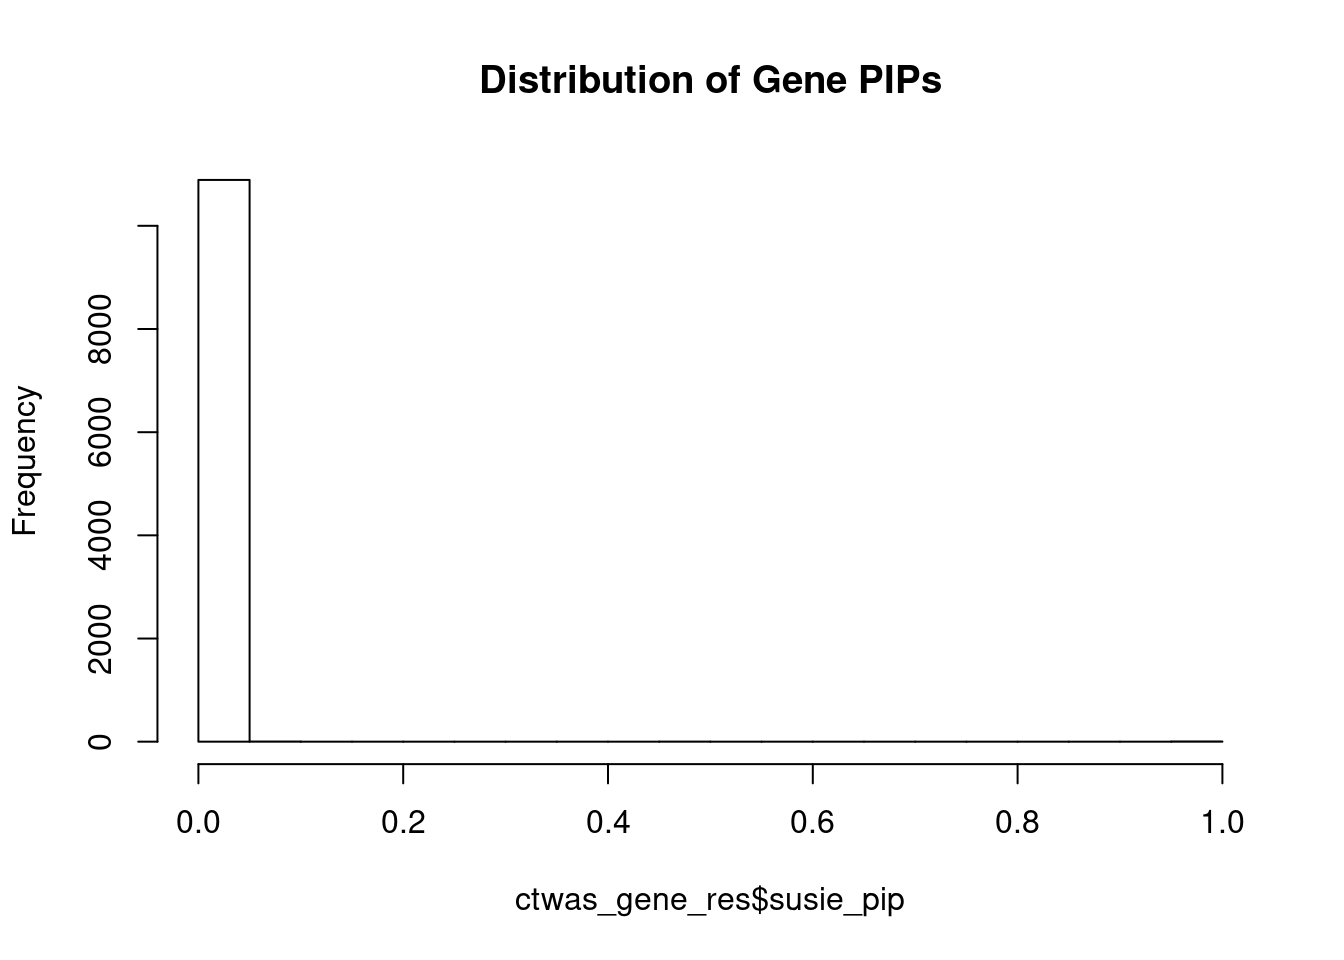
| Version | Author | Date |
|---|---|---|
| dfd2b5f | wesleycrouse | 2021-09-07 |
#genes with PIP>0.8 or 20 highest PIPs
head(ctwas_gene_res[order(-ctwas_gene_res$susie_pip),report_cols], max(sum(ctwas_gene_res$susie_pip>0.8), 20))
genename region_tag susie_pip mu2 PVE z
2021 SULT2A1 19_33 1.000 361.42 1.1e-03 -19.30
1284 GEMIN2 14_11 0.986 147.22 4.4e-04 -11.77
721 WIPI1 17_39 0.976 50.03 1.5e-04 6.75
8487 DHCR7 11_40 0.961 1512.93 4.4e-03 36.46
4435 PSRC1 1_67 0.518 49.37 7.8e-05 6.53
3980 PSMA1 11_11 0.500 1253.87 1.9e-03 -17.47
6179 PDE3B 11_11 0.500 1253.87 1.9e-03 -17.47
7410 ABCA1 9_53 0.407 47.11 5.8e-05 -4.96
6957 USP1 1_39 0.079 78.05 1.9e-05 -8.54
4317 ANGPTL3 1_39 0.076 78.01 1.8e-05 -8.54
3212 CCND2 12_4 0.069 65.07 1.4e-05 3.69
12559 CTD-2240J17.4 15_38 0.050 64.26 9.7e-06 -3.60
8201 NPAS2 2_58 0.049 34.24 5.1e-06 -4.95
11289 AC019186.1 2_95 0.049 60.45 9.0e-06 3.49
4085 JUND 19_14 0.049 30.08 4.5e-06 -4.80
4268 UTP3 4_49 0.048 37.53 5.5e-06 4.63
2341 DDX5 17_37 0.042 61.24 7.8e-06 -3.60
8486 NADSYN1 11_40 0.039 1506.64 1.8e-04 36.38
55 COPZ2 17_28 0.035 30.39 3.2e-06 -4.05
8974 STAP2 19_4 0.034 59.81 6.2e-06 -4.00Genes with largest effect sizes
#plot PIP vs effect size
plot(ctwas_gene_res$susie_pip, ctwas_gene_res$mu2, xlab="PIP", ylab="mu^2", main="Gene PIPs vs Effect Size")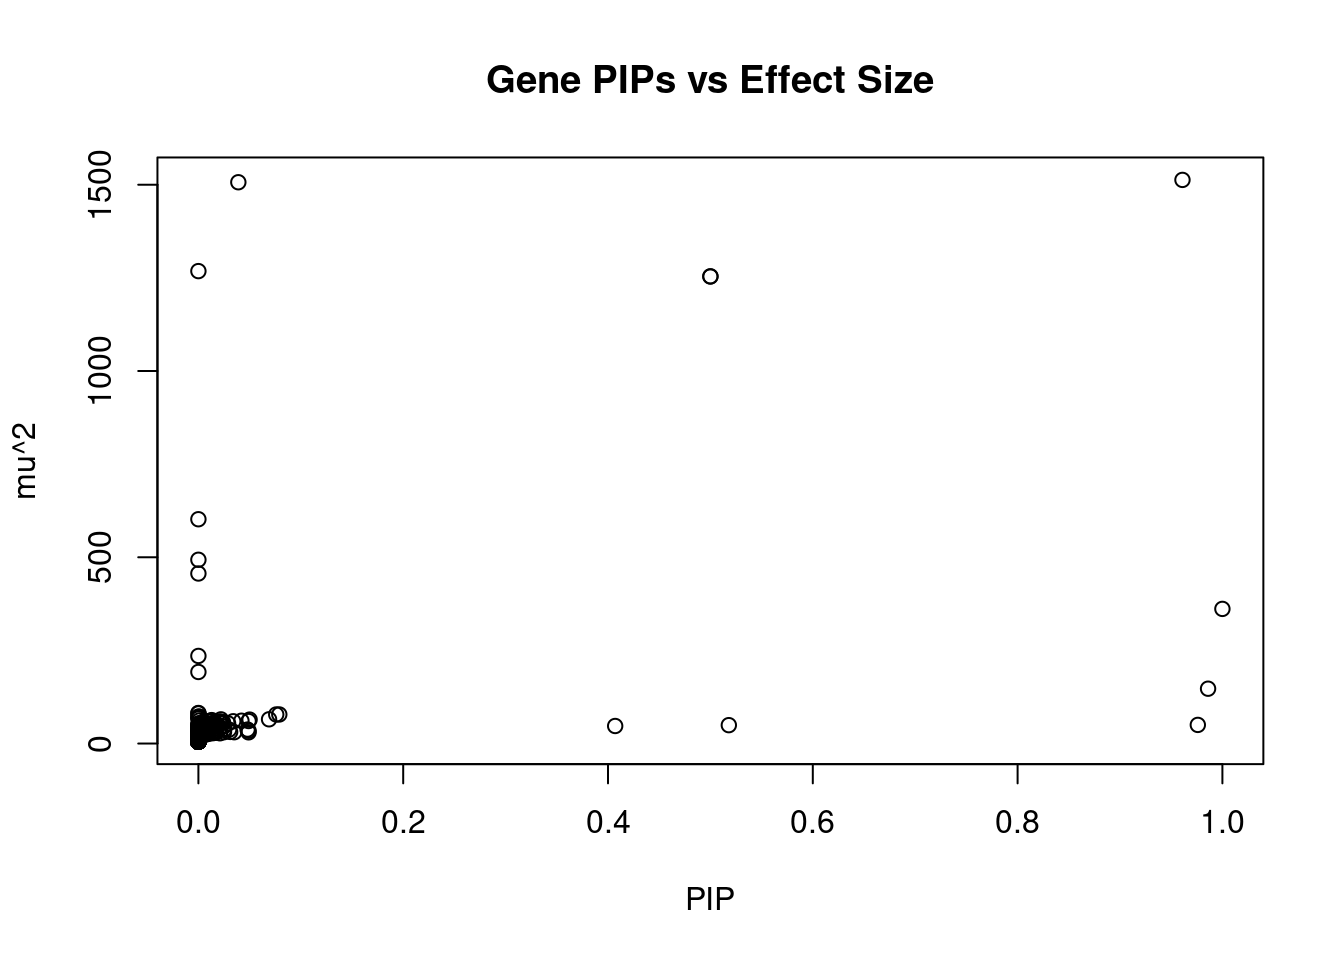
| Version | Author | Date |
|---|---|---|
| dfd2b5f | wesleycrouse | 2021-09-07 |
#genes with 20 largest effect sizes
head(ctwas_gene_res[order(-ctwas_gene_res$mu2),report_cols],20)
genename region_tag susie_pip mu2 PVE z
8487 DHCR7 11_40 0.961 1512.93 4.4e-03 36.46
8486 NADSYN1 11_40 0.039 1506.64 1.8e-04 36.38
9695 CYP2R1 11_11 0.000 1268.13 0.0e+00 35.17
3980 PSMA1 11_11 0.500 1253.87 1.9e-03 -17.47
6179 PDE3B 11_11 0.500 1253.87 1.9e-03 -17.47
4396 RRAS2 11_11 0.000 602.09 0.0e+00 22.33
7754 TRIM68 11_3 0.000 493.30 0.0e+00 -0.86
5685 GC 4_50 0.000 456.43 8.2e-13 -12.88
2021 SULT2A1 19_33 1.000 361.42 1.1e-03 -19.30
11530 KRTAP5-7 11_40 0.000 235.15 1.3e-08 15.23
10851 UGT2B11 4_48 0.000 192.11 6.1e-08 -11.94
1284 GEMIN2 14_11 0.986 147.22 4.4e-04 -11.77
8063 RASSF6 4_50 0.000 81.97 5.4e-17 -7.05
1595 PNN 14_11 0.000 80.97 4.8e-08 8.59
6957 USP1 1_39 0.079 78.05 1.9e-05 -8.54
4317 ANGPTL3 1_39 0.076 78.01 1.8e-05 -8.54
5101 AMDHD1 12_57 0.000 72.34 4.5e-08 8.75
11522 UGT1A7 2_137 0.001 72.22 2.9e-07 -7.31
7547 LIPC 15_26 0.000 69.34 1.2e-08 8.25
8780 CALCB 11_11 0.000 66.92 0.0e+00 7.10Genes with highest PVE
#genes with 20 highest pve
head(ctwas_gene_res[order(-ctwas_gene_res$PVE),report_cols],20)
genename region_tag susie_pip mu2 PVE z
8487 DHCR7 11_40 0.961 1512.93 4.4e-03 36.46
3980 PSMA1 11_11 0.500 1253.87 1.9e-03 -17.47
6179 PDE3B 11_11 0.500 1253.87 1.9e-03 -17.47
2021 SULT2A1 19_33 1.000 361.42 1.1e-03 -19.30
1284 GEMIN2 14_11 0.986 147.22 4.4e-04 -11.77
8486 NADSYN1 11_40 0.039 1506.64 1.8e-04 36.38
721 WIPI1 17_39 0.976 50.03 1.5e-04 6.75
4435 PSRC1 1_67 0.518 49.37 7.8e-05 6.53
7410 ABCA1 9_53 0.407 47.11 5.8e-05 -4.96
6957 USP1 1_39 0.079 78.05 1.9e-05 -8.54
4317 ANGPTL3 1_39 0.076 78.01 1.8e-05 -8.54
3212 CCND2 12_4 0.069 65.07 1.4e-05 3.69
12559 CTD-2240J17.4 15_38 0.050 64.26 9.7e-06 -3.60
11289 AC019186.1 2_95 0.049 60.45 9.0e-06 3.49
2341 DDX5 17_37 0.042 61.24 7.8e-06 -3.60
8974 STAP2 19_4 0.034 59.81 6.2e-06 -4.00
4268 UTP3 4_49 0.048 37.53 5.5e-06 4.63
8201 NPAS2 2_58 0.049 34.24 5.1e-06 -4.95
12153 RP11-120K24.3 13_62 0.029 53.97 4.7e-06 3.39
4085 JUND 19_14 0.049 30.08 4.5e-06 -4.80Genes with largest z scores
#genes with 20 largest z scores
head(ctwas_gene_res[order(-abs(ctwas_gene_res$z)),report_cols],20)
genename region_tag susie_pip mu2 PVE z
8487 DHCR7 11_40 0.961 1512.93 4.4e-03 36.46
8486 NADSYN1 11_40 0.039 1506.64 1.8e-04 36.38
9695 CYP2R1 11_11 0.000 1268.13 0.0e+00 35.17
4396 RRAS2 11_11 0.000 602.09 0.0e+00 22.33
2021 SULT2A1 19_33 1.000 361.42 1.1e-03 -19.30
3980 PSMA1 11_11 0.500 1253.87 1.9e-03 -17.47
6179 PDE3B 11_11 0.500 1253.87 1.9e-03 -17.47
11530 KRTAP5-7 11_40 0.000 235.15 1.3e-08 15.23
5685 GC 4_50 0.000 456.43 8.2e-13 -12.88
10851 UGT2B11 4_48 0.000 192.11 6.1e-08 -11.94
1284 GEMIN2 14_11 0.986 147.22 4.4e-04 -11.77
5101 AMDHD1 12_57 0.000 72.34 4.5e-08 8.75
1595 PNN 14_11 0.000 80.97 4.8e-08 8.59
4317 ANGPTL3 1_39 0.076 78.01 1.8e-05 -8.54
6957 USP1 1_39 0.079 78.05 1.9e-05 -8.54
7547 LIPC 15_26 0.000 69.34 1.2e-08 8.25
11522 UGT1A7 2_137 0.001 72.22 2.9e-07 -7.31
577 BCAS1 20_32 0.000 43.10 8.7e-12 7.26
8780 CALCB 11_11 0.000 66.92 0.0e+00 7.10
8063 RASSF6 4_50 0.000 81.97 5.4e-17 -7.05Comparing z scores and PIPs
#set nominal signifiance threshold for z scores
alpha <- 0.05

#bonferroni adjusted threshold for z scores
sig_thresh <- qnorm(1-(alpha/nrow(ctwas_gene_res)/2), lower=T)

#Q-Q plot for z scores
obs_z <- ctwas_gene_res$z[order(ctwas_gene_res$z)]
exp_z <- qnorm((1:nrow(ctwas_gene_res))/nrow(ctwas_gene_res))

plot(exp_z, obs_z, xlab="Expected z", ylab="Observed z", main="Gene z score Q-Q plot")
abline(a=0,b=1)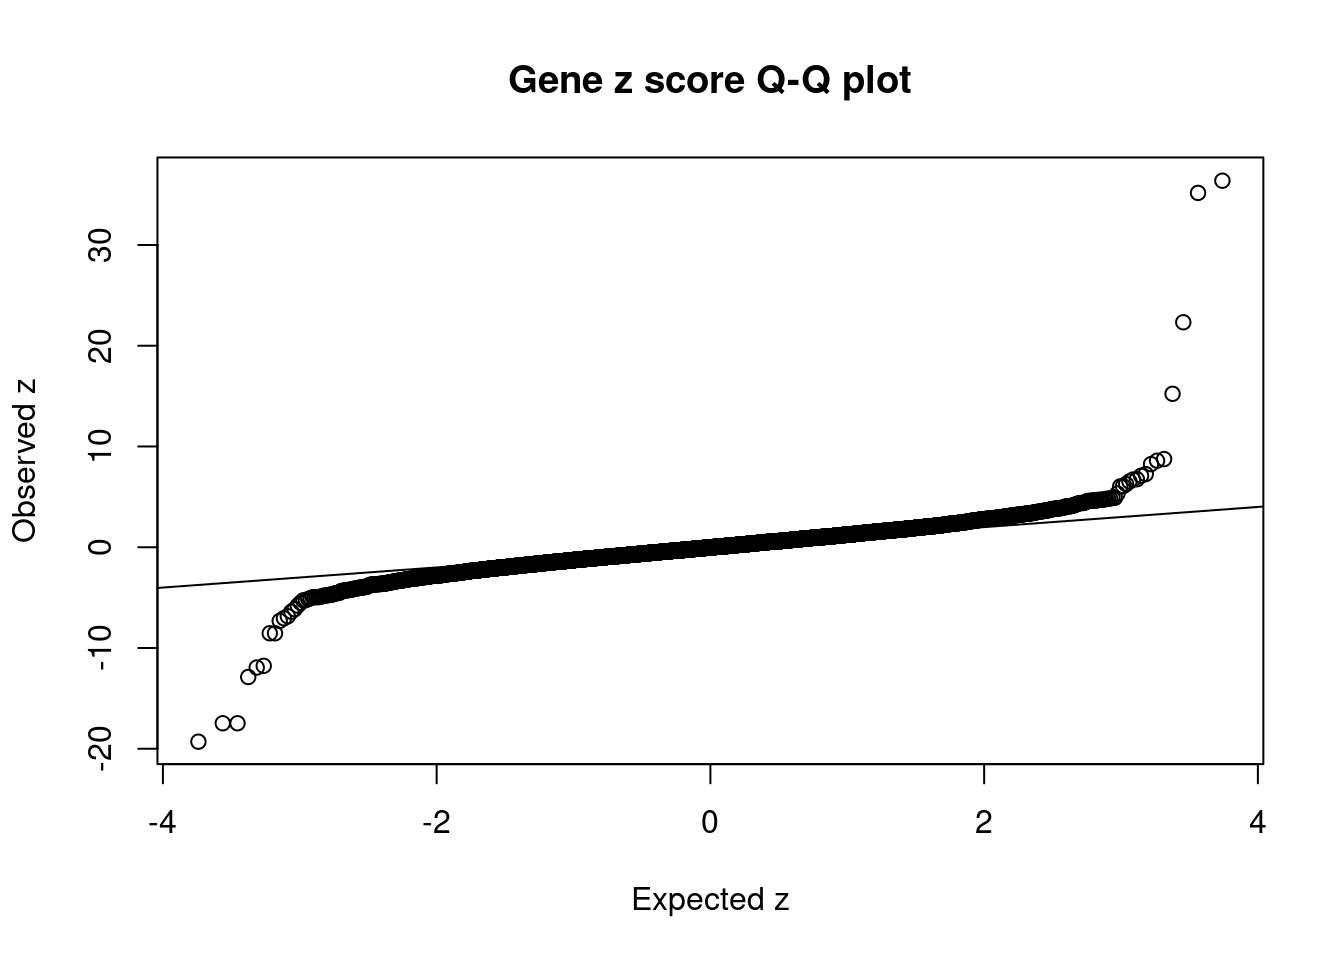
| Version | Author | Date |
|---|---|---|
| dfd2b5f | wesleycrouse | 2021-09-07 |
#plot z score vs PIP
plot(abs(ctwas_gene_res$z), ctwas_gene_res$susie_pip, xlab="abs(z)", ylab="PIP")
abline(v=sig_thresh, col="red", lty=2)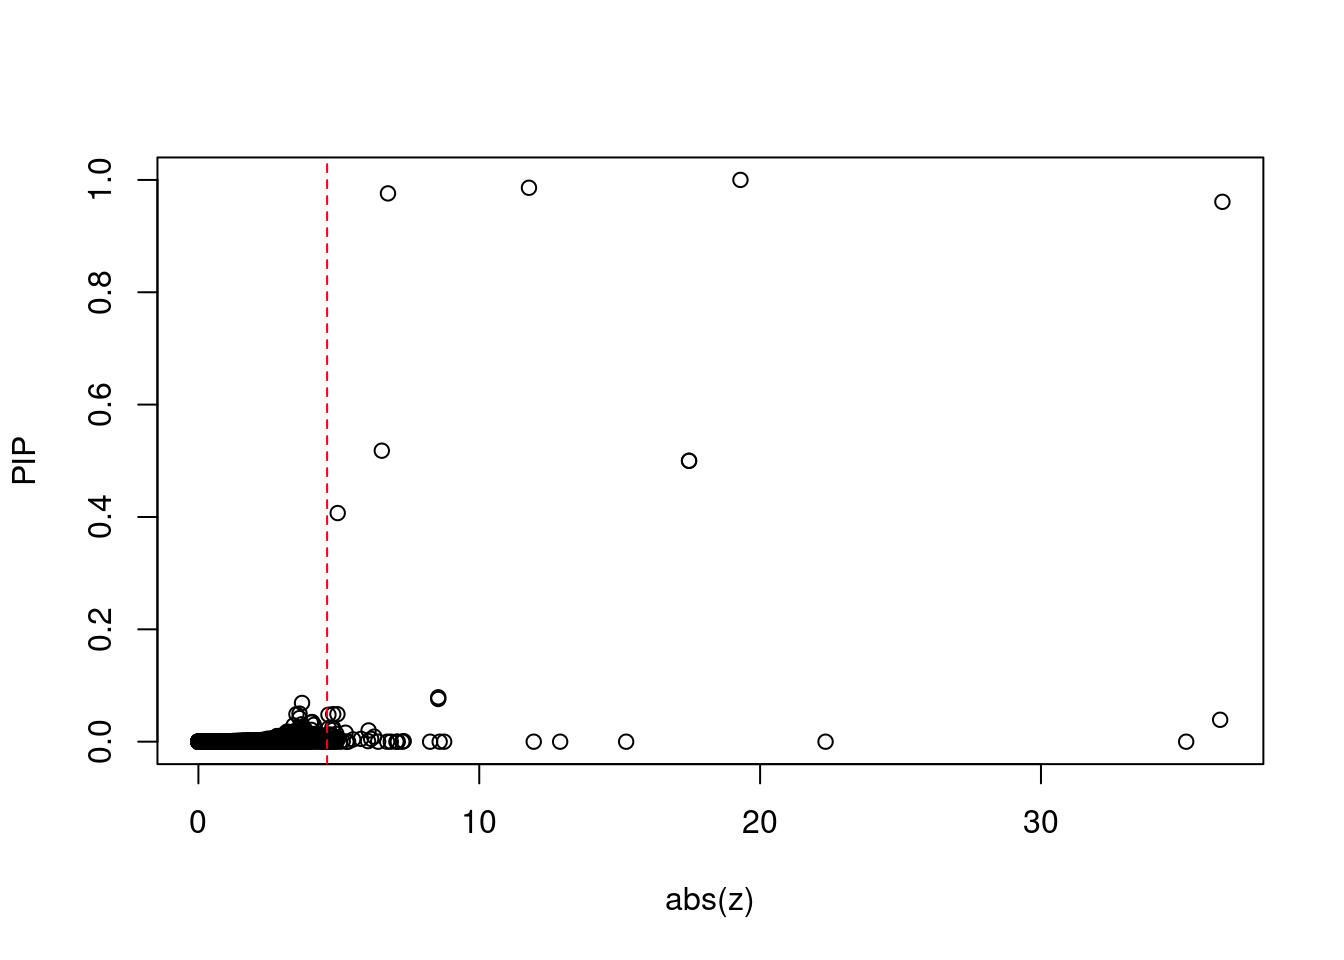
| Version | Author | Date |
|---|---|---|
| dfd2b5f | wesleycrouse | 2021-09-07 |
#proportion of significant z scores
mean(abs(ctwas_gene_res$z) > sig_thresh)
[1] 0.005962756#genes with most significant z scores
head(ctwas_gene_res[order(-abs(ctwas_gene_res$z)),report_cols],20) genename region_tag susie_pip mu2 PVE z
8487 DHCR7 11_40 0.961 1512.93 4.4e-03 36.46
8486 NADSYN1 11_40 0.039 1506.64 1.8e-04 36.38
9695 CYP2R1 11_11 0.000 1268.13 0.0e+00 35.17
4396 RRAS2 11_11 0.000 602.09 0.0e+00 22.33
2021 SULT2A1 19_33 1.000 361.42 1.1e-03 -19.30
3980 PSMA1 11_11 0.500 1253.87 1.9e-03 -17.47
6179 PDE3B 11_11 0.500 1253.87 1.9e-03 -17.47
11530 KRTAP5-7 11_40 0.000 235.15 1.3e-08 15.23
5685 GC 4_50 0.000 456.43 8.2e-13 -12.88
10851 UGT2B11 4_48 0.000 192.11 6.1e-08 -11.94
1284 GEMIN2 14_11 0.986 147.22 4.4e-04 -11.77
5101 AMDHD1 12_57 0.000 72.34 4.5e-08 8.75
1595 PNN 14_11 0.000 80.97 4.8e-08 8.59
4317 ANGPTL3 1_39 0.076 78.01 1.8e-05 -8.54
6957 USP1 1_39 0.079 78.05 1.9e-05 -8.54
7547 LIPC 15_26 0.000 69.34 1.2e-08 8.25
11522 UGT1A7 2_137 0.001 72.22 2.9e-07 -7.31
577 BCAS1 20_32 0.000 43.10 8.7e-12 7.26
8780 CALCB 11_11 0.000 66.92 0.0e+00 7.10
8063 RASSF6 4_50 0.000 81.97 5.4e-17 -7.05Locus plots for genes and SNPs
ctwas_gene_res_sortz <- ctwas_gene_res[order(-abs(ctwas_gene_res$z)),]

n_plots <- 5
for (region_tag_plot in head(unique(ctwas_gene_res_sortz$region_tag), n_plots)){
  ctwas_res_region <-  ctwas_res[ctwas_res$region_tag==region_tag_plot,]
  start <- min(ctwas_res_region$pos)
  end <- max(ctwas_res_region$pos)

  ctwas_res_region <- ctwas_res_region[order(ctwas_res_region$pos),]
  ctwas_res_region_gene <- ctwas_res_region[ctwas_res_region$type=="gene",]
  ctwas_res_region_snp <- ctwas_res_region[ctwas_res_region$type=="SNP",]

  #region name
  print(paste0("Region: ", region_tag_plot))

  #table of genes in region
  print(ctwas_res_region_gene[,report_cols])

  par(mfrow=c(4,1))

  #gene z scores
  plot(ctwas_res_region_gene$pos, abs(ctwas_res_region_gene$z), xlab="Position", ylab="abs(gene_z)", xlim=c(start,end),
   ylim=c(0,max(sig_thresh, abs(ctwas_res_region_gene$z))),
   main=paste0("Region: ", region_tag_plot))
  abline(h=sig_thresh,col="red",lty=2)

  #significance threshold for SNPs
  alpha_snp <- 5*10^(-8)
  sig_thresh_snp <- qnorm(1-alpha_snp/2, lower=T)

  #snp z scores
  plot(ctwas_res_region_snp$pos, abs(ctwas_res_region_snp$z), xlab="Position", ylab="abs(snp_z)",xlim=c(start,end),
   ylim=c(0,max(sig_thresh_snp, max(abs(ctwas_res_region_snp$z)))))
  abline(h=sig_thresh_snp,col="purple",lty=2)

  #gene pips
  plot(ctwas_res_region_gene$pos, ctwas_res_region_gene$susie_pip, xlab="Position", ylab="Gene PIP", xlim=c(start,end), ylim=c(0,1))
  abline(h=0.8,col="blue",lty=2)

  #snp pips
  plot(ctwas_res_region_snp$pos, ctwas_res_region_snp$susie_pip, xlab="Position", ylab="SNP PIP", xlim=c(start,end), ylim=c(0,1))
  abline(h=0.8,col="blue",lty=2)
}
[1] "Region: 11_40"
genename region_tag susie_pip mu2 PVE z
8486 NADSYN1 11_40 0.039 1506.64 1.8e-04 36.38
8487 DHCR7 11_40 0.961 1512.93 4.4e-03 36.46
11530 KRTAP5-7 11_40 0.000 235.15 1.3e-08 15.23
11761 KRTAP5-9 11_40 0.000 5.90 3.2e-10 0.31
10650 KRTAP5-10 11_40 0.000 31.54 6.1e-09 -3.95
6613 FAM86C1 11_40 0.000 10.44 1.0e-09 -0.96
11744 RP11-849H4.2 11_40 0.000 5.24 2.8e-10 -0.19
4859 RNF121 11_40 0.000 9.60 6.4e-10 1.44
4851 IL18BP 11_40 0.000 16.93 2.7e-09 -1.78
9490 LRTOMT 11_40 0.000 12.34 6.8e-10 -2.06
4852 NUMA1 11_40 0.000 17.98 2.3e-09 2.38
2462 FOLR3 11_40 0.000 12.66 7.0e-10 -2.11
7453 INPPL1 11_40 0.000 7.98 6.2e-10 0.27
6900 CLPB 11_40 0.000 5.11 2.8e-10 -0.02
11125 LINC01537 11_40 0.000 5.89 3.2e-10 0.95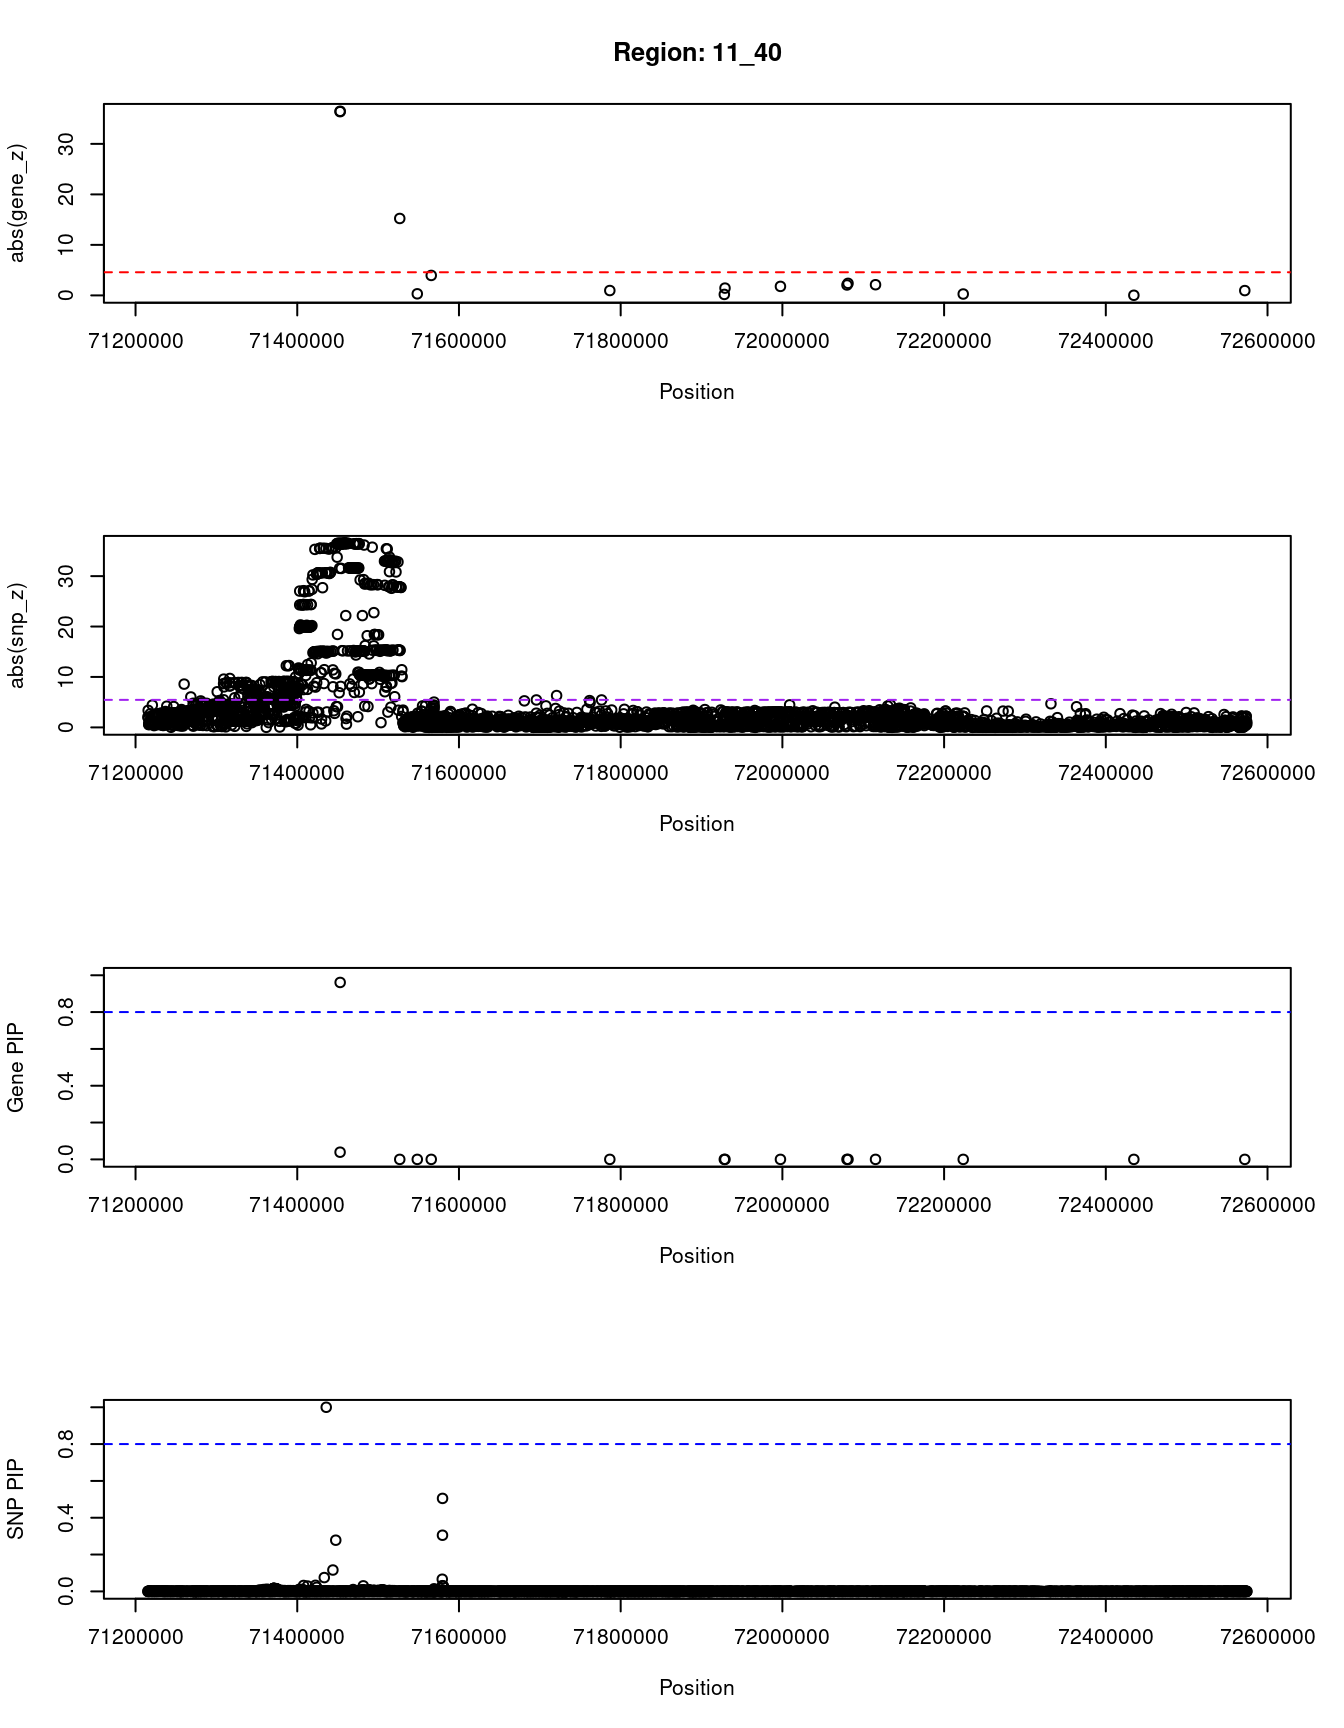
| Version | Author | Date |
|---|---|---|
| dfd2b5f | wesleycrouse | 2021-09-07 |
[1] "Region: 11_11"
      genename region_tag susie_pip     mu2    PVE      z
12029    SPON1      11_11       0.0   43.85 0.0000  -6.40
4396     RRAS2      11_11       0.0  602.09 0.0000  22.33
3980     PSMA1      11_11       0.5 1253.87 0.0019 -17.47
6179     PDE3B      11_11       0.5 1253.87 0.0019 -17.47
9695    CYP2R1      11_11       0.0 1268.13 0.0000  35.17
8780     CALCB      11_11       0.0   66.92 0.0000   7.10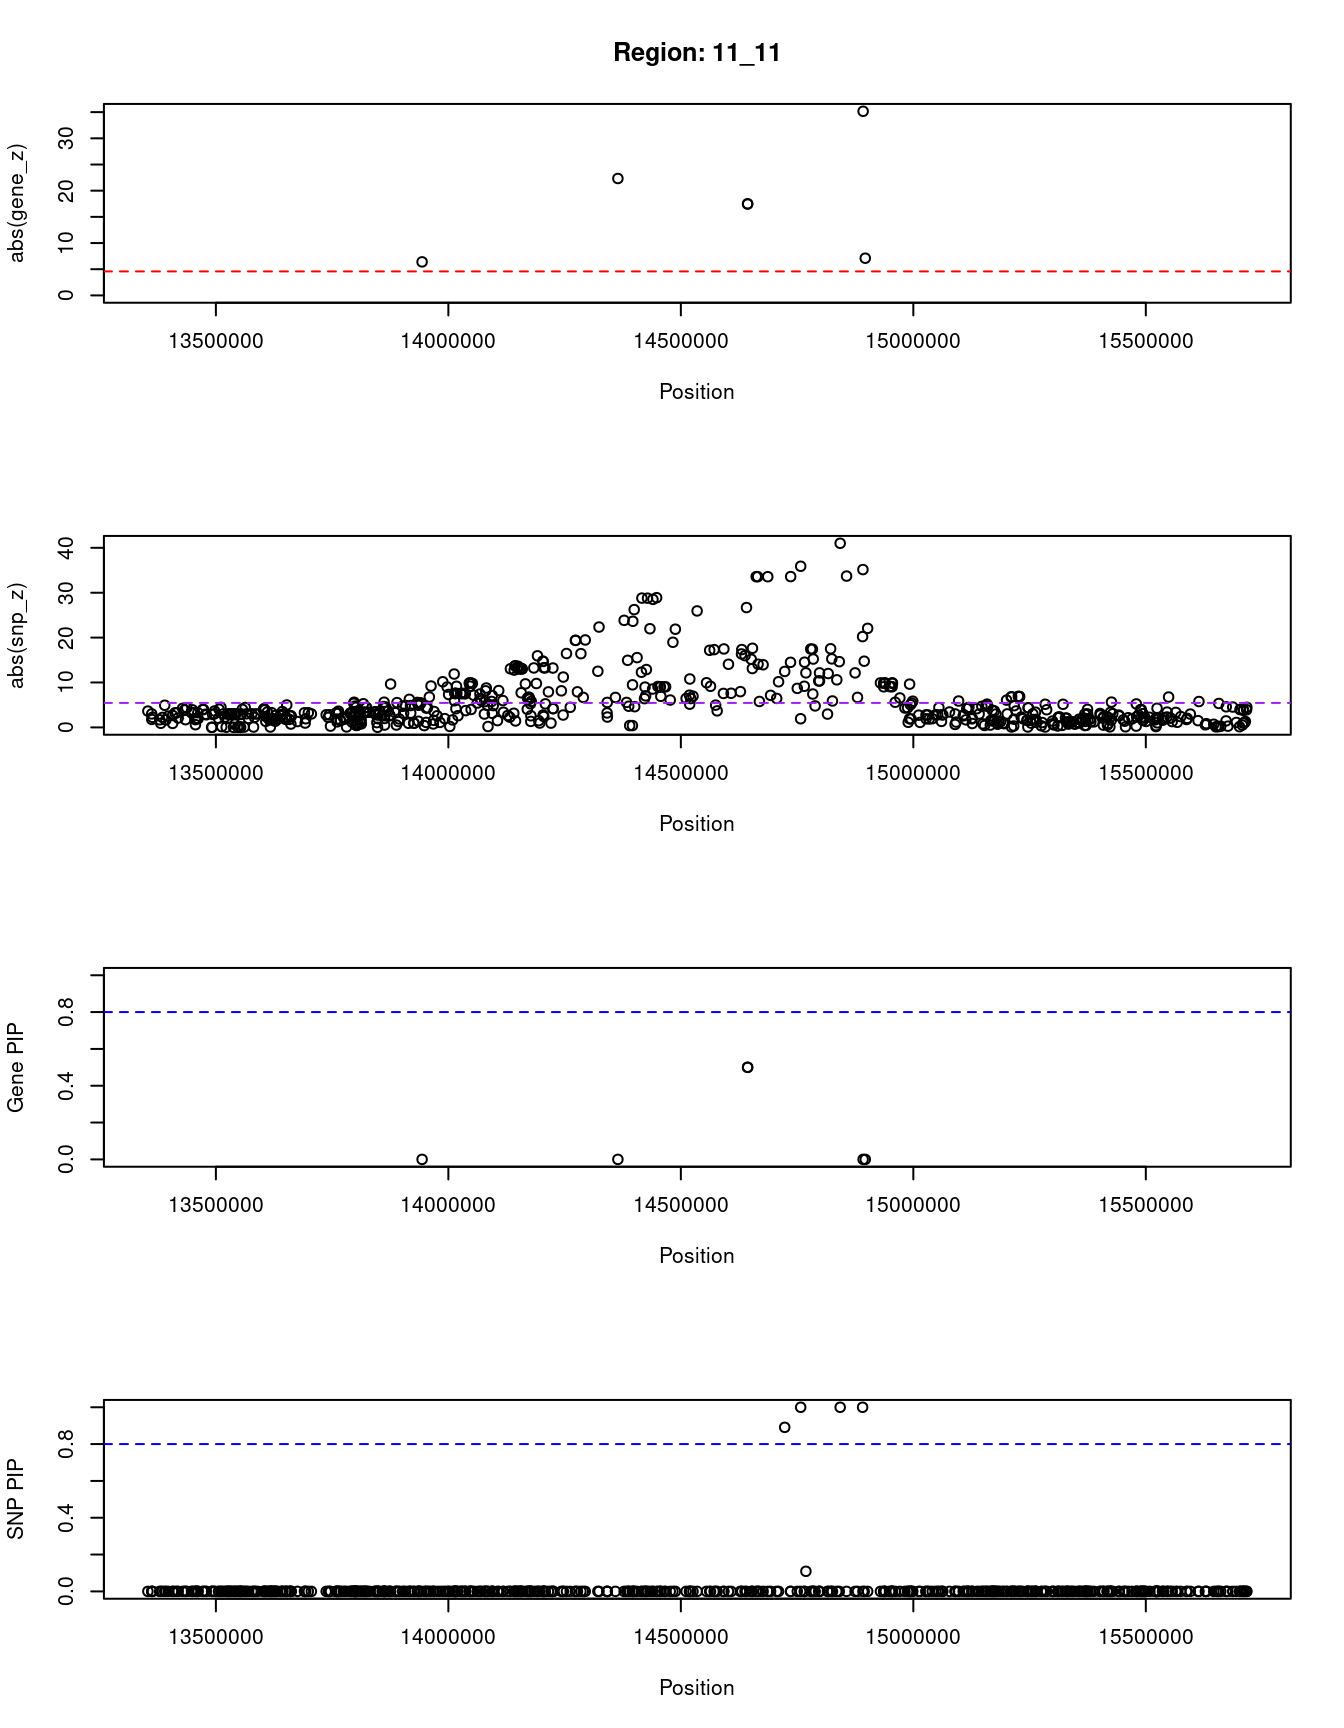
| Version | Author | Date |
|---|---|---|
| dfd2b5f | wesleycrouse | 2021-09-07 |
[1] "Region: 19_33"
      genename region_tag susie_pip    mu2     PVE      z
10231    DACT3      19_33         0   5.16 3.6e-11  -0.06
1999     PRKD2      19_33         0   6.11 4.6e-11  -0.59
1219     STRN4      19_33         0   5.53 4.0e-11  -0.33
9210      FKRP      19_33         0   7.47 6.4e-11   0.74
1998    SLC1A5      19_33         0   5.20 3.6e-11  -0.21
6725  ARHGAP35      19_33         0   9.70 1.1e-10  -1.02
4115     NPAS1      19_33         0   8.20 7.8e-11   0.94
4114     ZC3H4      19_33         0   6.60 5.1e-11   0.81
5375      SAE1      19_33         0   6.60 5.1e-11   0.81
2002     CCDC9      19_33         0   8.87 8.3e-11  -0.67
10232    C5AR1      19_33         0   7.15 6.3e-11  -0.88
11840   INAFM1      19_33         0  11.58 1.7e-10   0.99
4510     C5AR2      19_33         0   6.01 4.5e-11  -0.22
4505     DHX34      19_33         0   7.58 6.9e-11  -0.41
3155    ZNF541      19_33         0   7.01 4.9e-11  -0.37
546    GLTSCR1      19_33         0  12.85 1.4e-10   1.86
285       EHD2      19_33         0  10.72 1.0e-10  -1.18
2021   SULT2A1      19_33         1 361.42 1.1e-03 -19.30
2035   PLA2G4C      19_33         0   9.66 8.8e-11   1.66
2033      LIG1      19_33         0   5.00 3.4e-11   0.15
9623  C19orf68      19_33         0   6.88 5.7e-11   0.60
2032     CARD8      19_33         0   6.37 4.9e-11   0.53
2031   CCDC114      19_33         0   7.11 6.0e-11  -0.41
5374      EMP3      19_33         0  10.14 1.1e-10  -1.15
2028     GRWD1      19_33         0   7.28 5.9e-11   1.17
9317    KCNJ14      19_33         0   5.80 4.3e-11   0.13
2027     CYTH2      19_33         0  13.18 1.9e-10   1.76
5376     LMTK3      19_33         0   5.41 3.8e-11  -0.27
1139   SULT2B1      19_33         0  11.88 1.8e-10   0.96
2041    FAM83E      19_33         0   6.21 4.7e-11  -0.74
547      SPHK2      19_33         0  52.82 5.2e-08   3.47
2037       DBP      19_33         0   9.03 9.5e-11   0.93
548       CA11      19_33         0   5.18 3.6e-11   0.30
8865      FUT2      19_33         0  20.36 6.5e-10   2.01
8862    MAMSTR      19_33         0  28.69 2.2e-09  -2.32
9314    IZUMO1      19_33         0   5.10 3.5e-11   0.20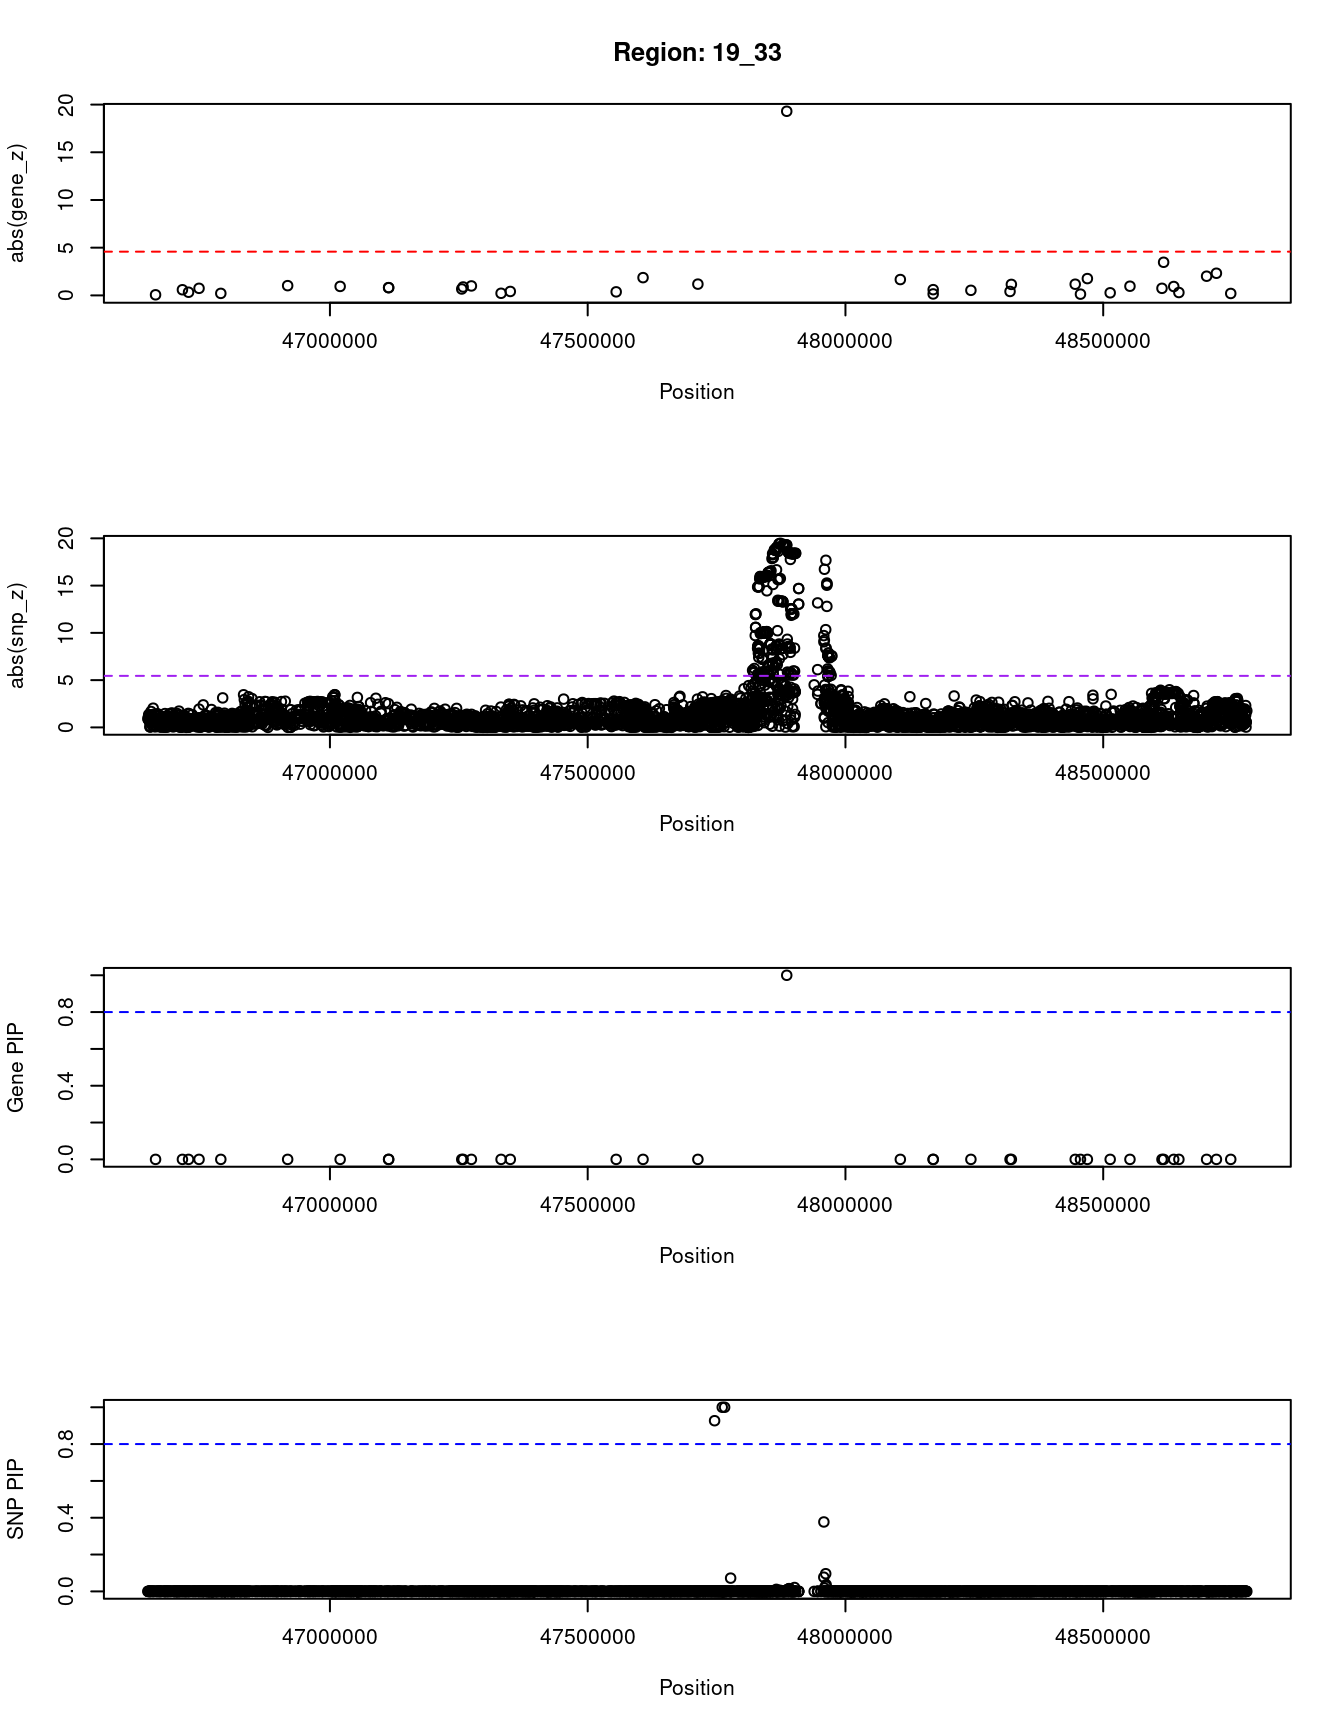
| Version | Author | Date |
|---|---|---|
| dfd2b5f | wesleycrouse | 2021-09-07 |
[1] "Region: 4_50"
          genename region_tag susie_pip    mu2     PVE      z
5685            GC       4_50         0 456.43 8.2e-13 -12.88
6449       ADAMTS3       4_50         0   5.99 2.4e-20  -0.83
7134           ALB       4_50         0   9.43 7.0e-20  -0.69
943            AFM       4_50         0  18.07 1.8e-19  -1.92
11638 RP11-622A1.2       4_50         0   9.09 4.3e-20   0.75
8063        RASSF6       4_50         0  81.97 5.4e-17  -7.05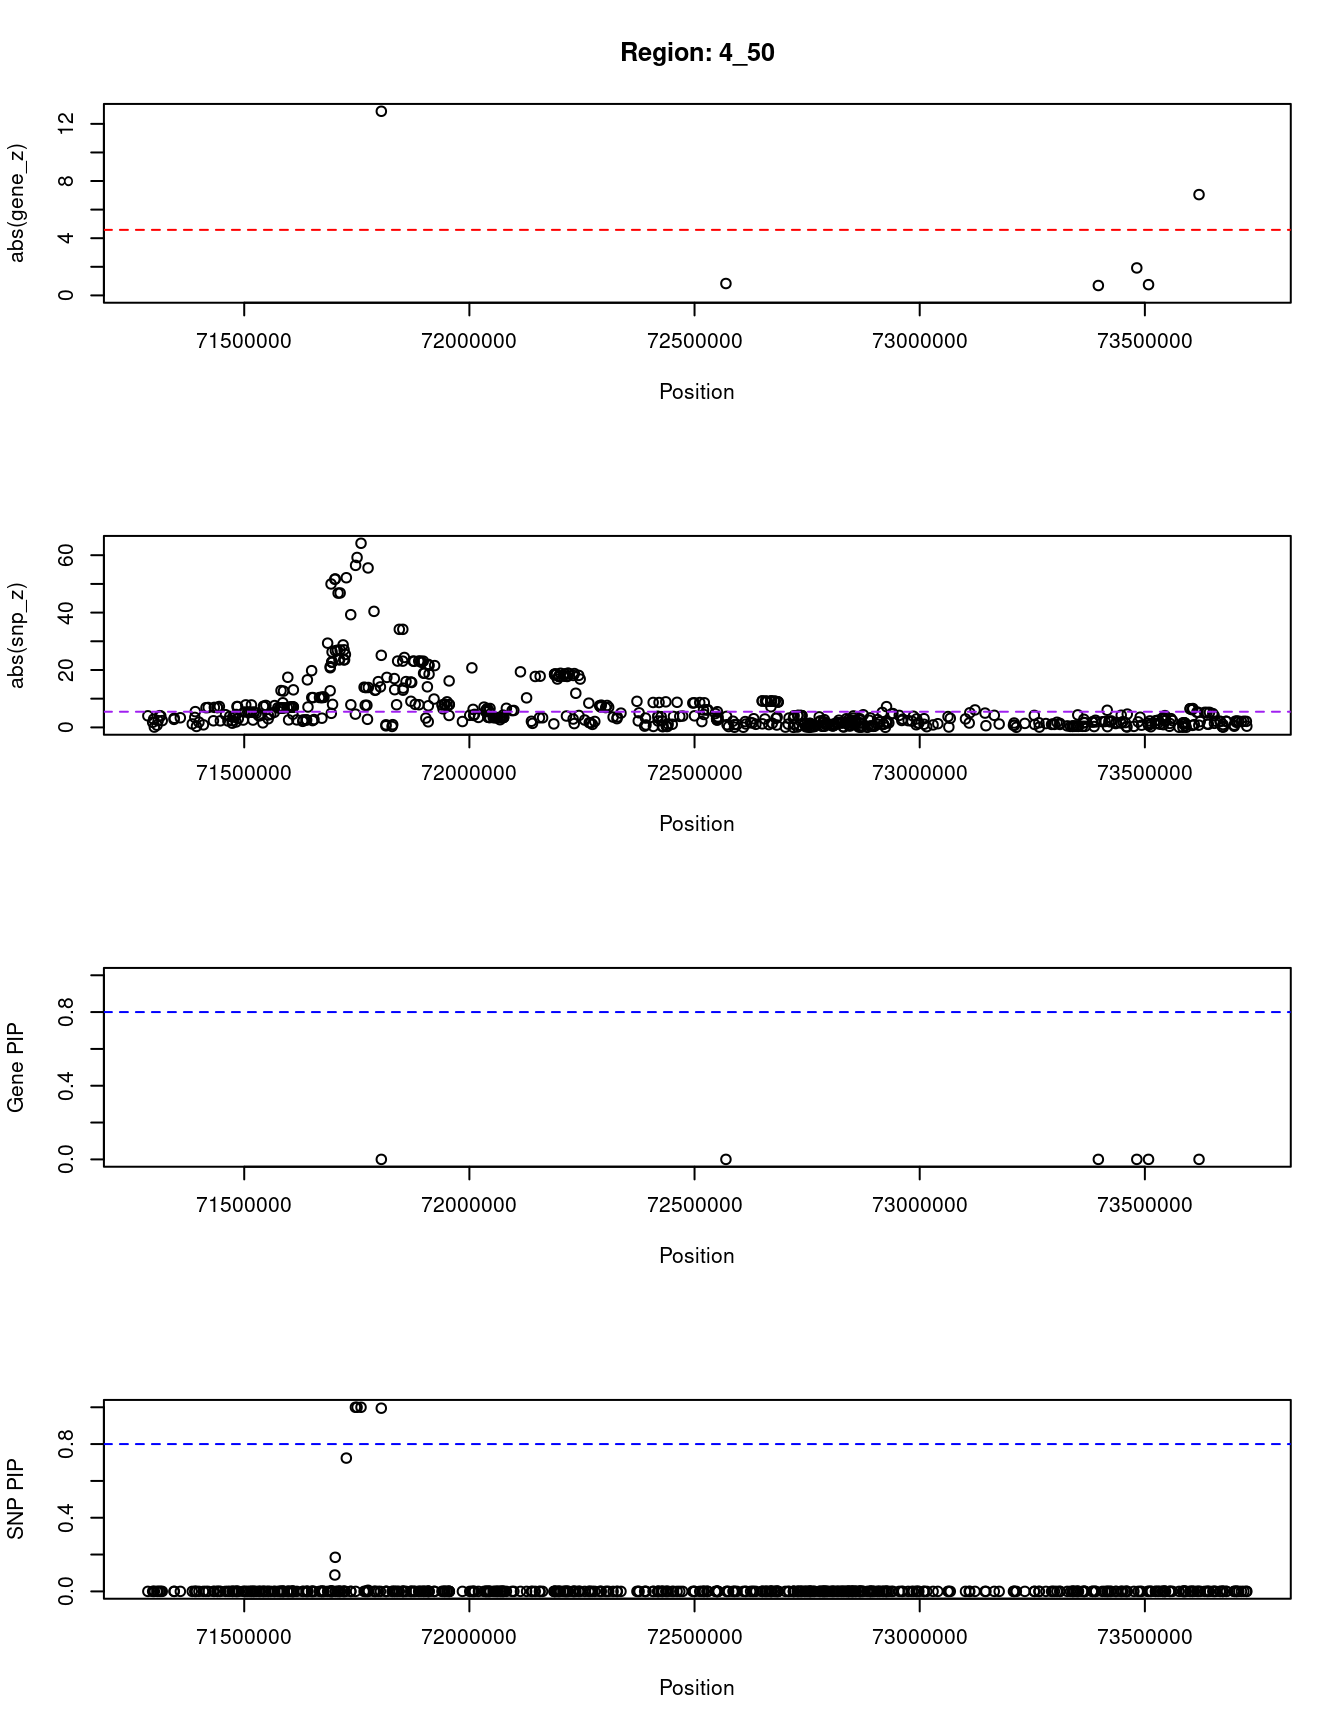
| Version | Author | Date |
|---|---|---|
| dfd2b5f | wesleycrouse | 2021-09-07 |
[1] "Region: 4_48"
      genename region_tag susie_pip    mu2     PVE      z
10303  UGT2B17       4_48         0  40.28 2.4e-08  -2.09
10116  UGT2B15       4_48         0  23.53 5.6e-10  -2.73
4558    UGT2A3       4_48         0  27.00 5.2e-10   2.84
10851  UGT2B11       4_48         0 192.11 6.1e-08 -11.94
8567    UGT2A1       4_48         0  14.69 3.5e-10  -0.88
2388   SULT1E1       4_48         0  12.27 4.4e-10   1.29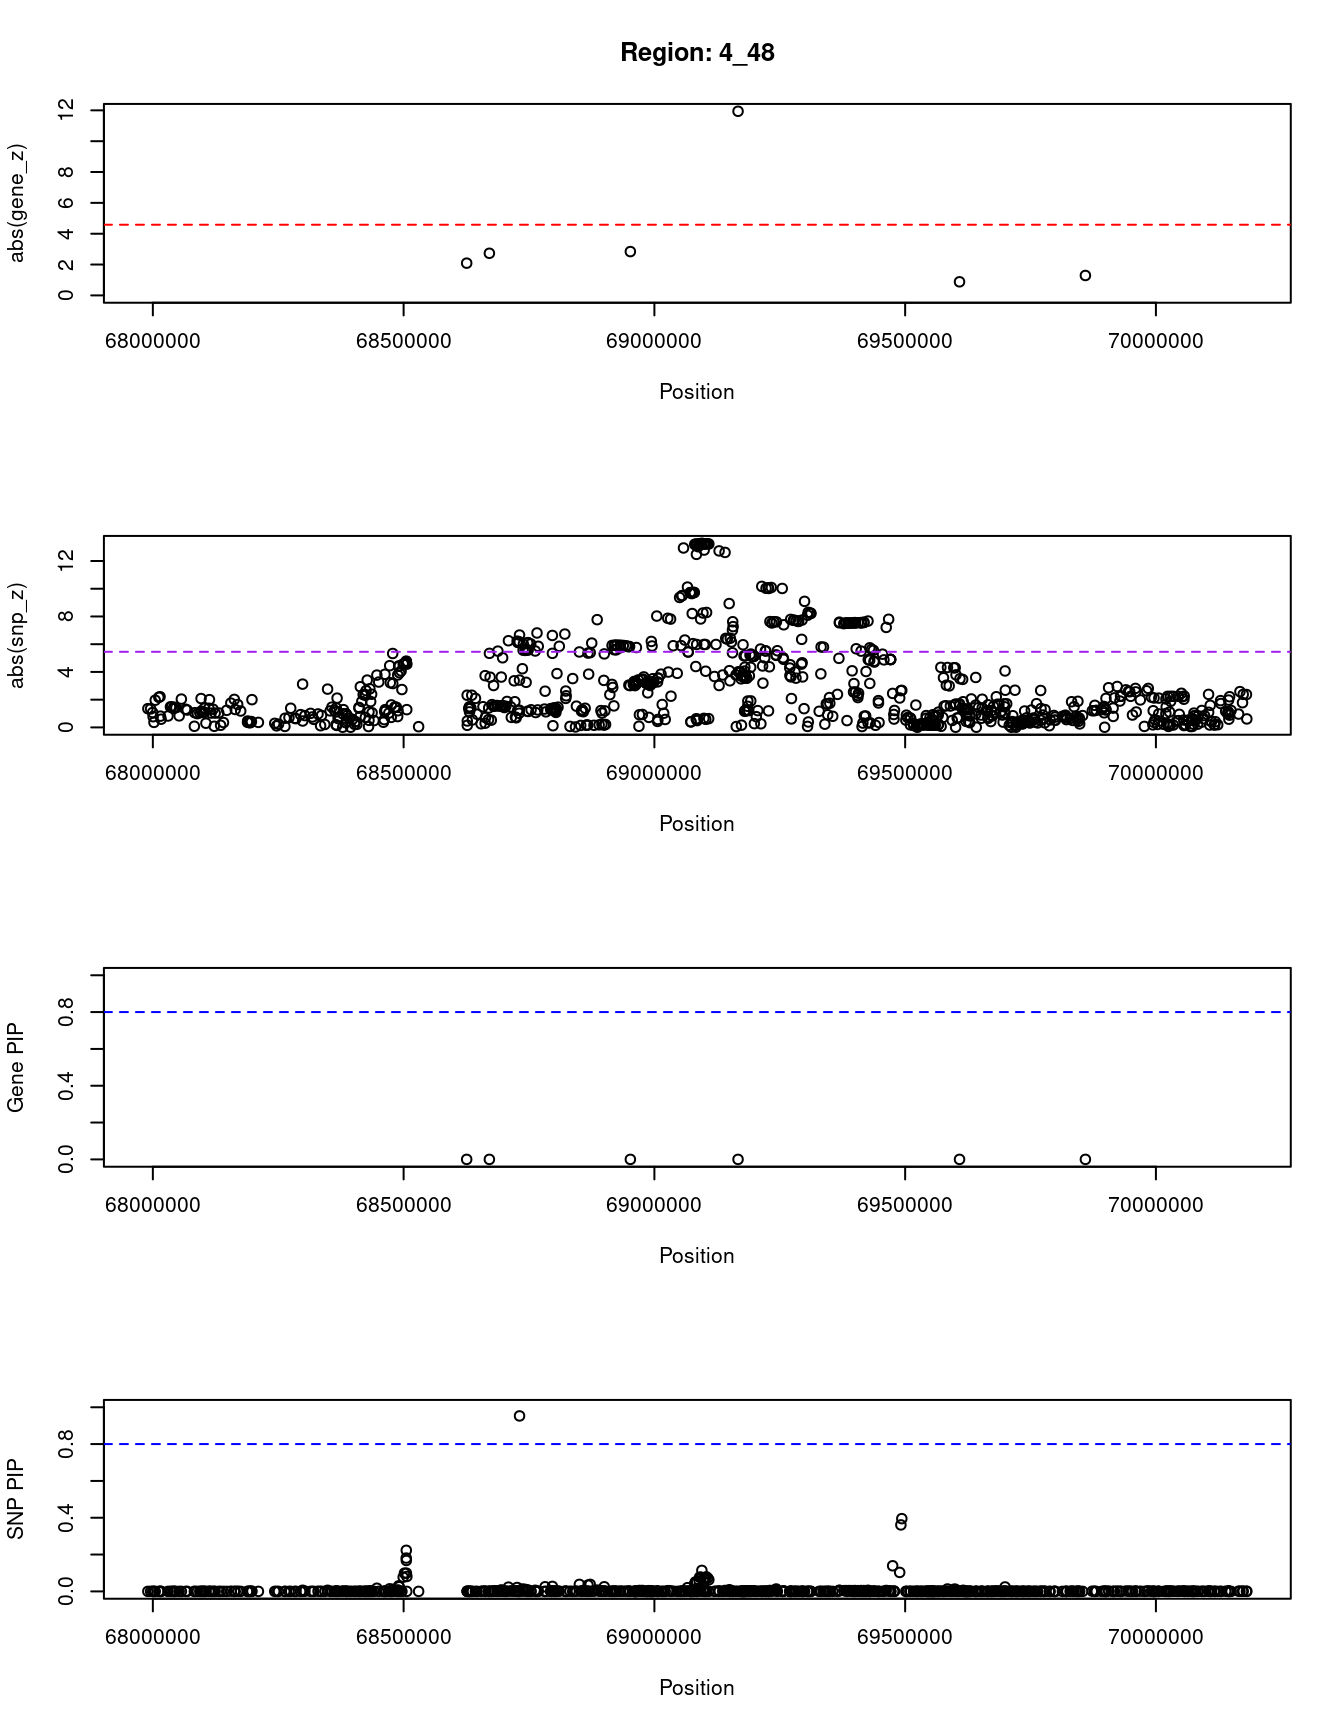
| Version | Author | Date |
|---|---|---|
| dfd2b5f | wesleycrouse | 2021-09-07 |
SNPs with highest PIPs
#snps with PIP>0.8 or 20 highest PIPs
head(ctwas_snp_res[order(-ctwas_snp_res$susie_pip),report_cols_snps],
max(sum(ctwas_snp_res$susie_pip>0.8), 20))
id region_tag susie_pip mu2 PVE z
35277 rs140655928 1_74 1.000 44.27 1.3e-04 9.17
35366 rs115288876 1_74 1.000 104.56 3.2e-04 12.20
35535 rs61813920 1_74 1.000 48.61 1.5e-04 9.77
73583 rs1042034 2_13 1.000 34.13 1.0e-04 -5.24
75319 rs780093 2_16 1.000 55.03 1.7e-04 7.97
225945 rs189319377 4_49 1.000 39.77 1.2e-04 -6.98
226094 rs222042 4_50 1.000 458.62 1.4e-03 4.62
226096 rs843005 4_50 1.000 1585.76 4.8e-03 59.21
226097 rs7697091 4_50 1.000 2026.09 6.2e-03 -64.16
562601 rs12282912 11_3 1.000 1217.23 3.7e-03 2.65
562606 rs759352454 11_3 1.000 1200.20 3.6e-03 2.92
566745 rs576218922 11_11 1.000 499.26 1.5e-03 -35.89
566764 rs10766194 11_11 1.000 1625.74 4.9e-03 -41.01
566768 rs7129781 11_11 1.000 959.46 2.9e-03 -20.22
584355 rs3740776 11_42 1.000 36.71 1.1e-04 6.23
633606 rs6538696 12_57 1.000 161.67 4.9e-04 15.75
658309 rs775834524 13_25 1.000 1224.73 3.7e-03 -2.53
752418 rs11542462 16_46 1.000 34.16 1.0e-04 -6.06
838570 rs6123359 20_32 1.000 58.42 1.8e-04 8.76
838576 rs2585441 20_32 1.000 70.82 2.2e-04 9.56
838577 rs12480880 20_32 1.000 59.79 1.8e-04 9.97
872437 rs138659167 11_40 1.000 151.01 4.6e-04 14.73
897532 rs561086564 19_33 1.000 241.32 7.3e-04 2.81
897583 rs75778010 19_33 1.000 196.73 6.0e-04 2.70
35475 rs11205006 1_74 0.999 55.37 1.7e-04 -11.74
838599 rs6068816 20_32 0.999 36.47 1.1e-04 -7.56
859061 rs2072193 22_11 0.998 29.87 9.1e-05 5.74
633610 rs7308827 12_57 0.997 63.09 1.9e-04 -11.80
226110 rs35096193 4_50 0.995 152.11 4.6e-04 25.11
842960 rs2823025 21_2 0.995 27.64 8.4e-05 -5.33
225874 rs112345622 4_49 0.978 26.53 7.9e-05 4.88
759571 rs4968186 17_7 0.975 26.04 7.7e-05 5.18
453306 rs4738679 8_45 0.965 27.21 8.0e-05 5.22
764378 rs112178027 17_18 0.965 25.66 7.5e-05 -5.24
330652 rs75080831 6_19 0.960 25.08 7.3e-05 -4.95
567173 rs117731662 11_12 0.960 26.88 7.8e-05 -5.55
86718 rs2862874 2_39 0.958 27.68 8.0e-05 -5.01
224855 rs445908 4_48 0.953 44.27 1.3e-04 -6.66
59159 rs11122453 1_117 0.941 25.46 7.3e-05 5.06
324157 rs6925468 6_7 0.933 23.45 6.6e-05 -4.68
897455 rs191652498 19_33 0.927 72.41 2.0e-04 2.43
581098 rs575513603 11_35 0.918 24.24 6.8e-05 4.77
54245 rs79687284 1_108 0.902 23.72 6.5e-05 -4.64
496378 rs11143795 9_34 0.902 24.49 6.7e-05 4.85
638857 rs55947413 12_69 0.900 22.92 6.3e-05 4.46
815774 rs1137844 19_24 0.900 24.14 6.6e-05 -4.71
566740 rs11023314 11_11 0.891 834.41 2.3e-03 12.46
597580 rs3135506 11_70 0.873 62.12 1.6e-04 -9.17
818304 rs2972561 19_32 0.859 26.13 6.8e-05 -4.79
743966 rs821840 16_31 0.857 44.62 1.2e-04 -6.90
202171 rs78649910 4_4 0.856 30.33 7.9e-05 -5.87
301972 rs1966478 5_72 0.854 24.37 6.3e-05 -4.73
35748 rs61803125 1_75 0.838 24.74 6.3e-05 4.69
598633 rs2847500 11_72 0.836 27.41 7.0e-05 -5.37
747769 rs139861017 16_37 0.821 24.61 6.1e-05 4.71
444558 rs10086575 8_27 0.819 25.30 6.3e-05 4.67
566249 rs560227606 11_10 0.817 24.88 6.2e-05 -4.56
470092 rs12056610 8_78 0.813 74.76 1.8e-04 -8.77
525668 rs11013054 10_17 0.808 24.52 6.0e-05 4.47
515281 rs115478735 9_70 0.805 24.56 6.0e-05 -4.60
865059 rs5767072 22_22 0.803 24.60 6.0e-05 4.55SNPs with largest effect sizes
#plot PIP vs effect size
plot(ctwas_snp_res$susie_pip, ctwas_snp_res$mu2, xlab="PIP", ylab="mu^2", main="SNP PIPs vs Effect Size")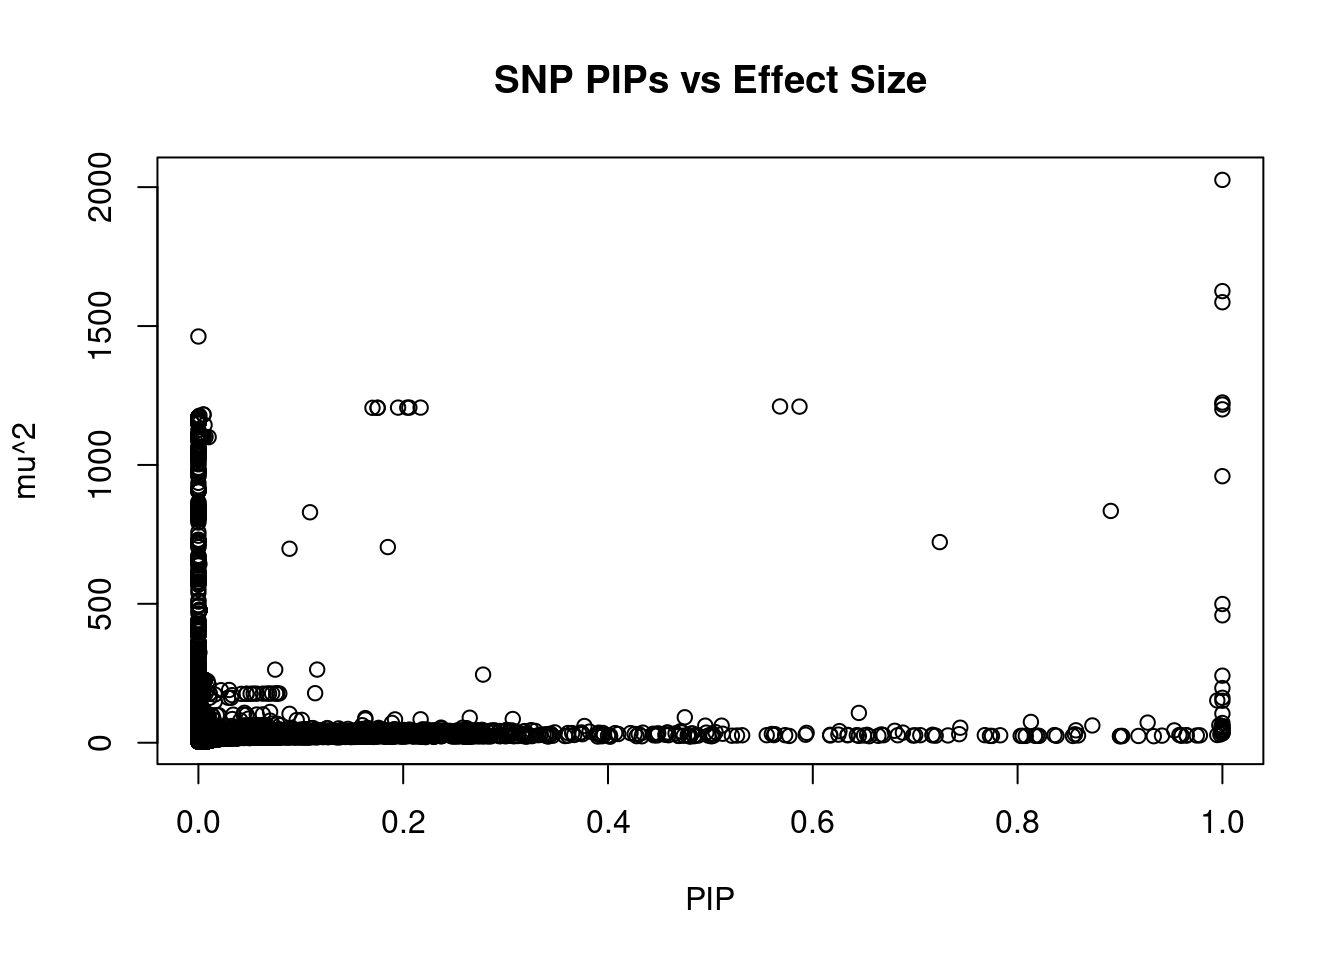
| Version | Author | Date |
|---|---|---|
| dfd2b5f | wesleycrouse | 2021-09-07 |
#SNPs with 50 largest effect sizes
head(ctwas_snp_res[order(-ctwas_snp_res$mu2),report_cols_snps],50)
id region_tag susie_pip mu2 PVE z
226097 rs7697091 4_50 1.000 2026.09 6.2e-03 -64.16
566764 rs10766194 11_11 1.000 1625.74 4.9e-03 -41.01
226096 rs843005 4_50 1.000 1585.76 4.8e-03 59.21
226095 rs705119 4_50 0.000 1462.40 2.3e-13 56.46
658309 rs775834524 13_25 1.000 1224.73 3.7e-03 -2.53
562601 rs12282912 11_3 1.000 1217.23 3.7e-03 2.65
658307 rs7999449 13_25 0.568 1210.50 2.1e-03 -2.79
658299 rs7337153 13_25 0.587 1209.98 2.2e-03 -2.81
658300 rs9527399 13_25 0.217 1206.42 7.9e-04 2.80
658304 rs9537143 13_25 0.195 1206.37 7.1e-04 2.79
658303 rs9597193 13_25 0.206 1206.36 7.5e-04 2.80
658302 rs9527401 13_25 0.204 1206.35 7.5e-04 2.79
658297 rs9527398 13_25 0.175 1205.73 6.4e-04 2.80
658298 rs9537125 13_25 0.175 1205.73 6.4e-04 2.80
658295 rs9537123 13_25 0.170 1205.62 6.2e-04 2.79
562606 rs759352454 11_3 1.000 1200.20 3.6e-03 2.92
658288 rs3013347 13_25 0.005 1181.42 1.9e-05 -2.63
658289 rs2937326 13_25 0.005 1181.37 1.8e-05 -2.63
658290 rs9597179 13_25 0.001 1177.17 2.6e-06 2.57
872503 rs2276361 11_40 0.000 1171.98 1.6e-07 36.51
872473 rs7928249 11_40 0.000 1171.97 1.6e-07 36.51
872504 rs7938885 11_40 0.000 1171.93 1.6e-07 36.50
872502 rs2276360 11_40 0.000 1171.79 1.6e-07 36.50
872509 rs12800438 11_40 0.000 1171.35 1.6e-07 36.49
872511 rs12807718 11_40 0.000 1171.26 1.6e-07 36.49
872489 rs3831470 11_40 0.000 1171.25 1.6e-07 36.49
872474 rs12793530 11_40 0.000 1171.21 1.6e-07 36.49
872494 rs4944955 11_40 0.000 1171.17 1.6e-07 36.49
872495 rs4944956 11_40 0.000 1171.17 1.6e-07 36.49
872492 rs12792306 11_40 0.000 1170.98 1.6e-07 36.49
872519 rs4423214 11_40 0.000 1170.97 1.6e-07 36.49
872521 rs2276362 11_40 0.000 1170.63 1.6e-07 36.48
872507 rs12808368 11_40 0.000 1170.53 1.6e-07 36.48
872475 rs11546509 11_40 0.000 1170.49 1.6e-07 36.48
872478 rs2002063 11_40 0.000 1170.41 1.6e-07 36.48
872499 rs4944959 11_40 0.000 1170.40 1.6e-07 36.48
872506 rs12806844 11_40 0.000 1170.33 1.6e-07 36.47
872498 rs4944958 11_40 0.000 1170.31 1.6e-07 36.48
872505 rs12790010 11_40 0.000 1170.24 1.6e-07 36.47
872500 rs12793224 11_40 0.000 1170.21 1.6e-07 36.47
872501 rs12794668 11_40 0.000 1170.21 1.6e-07 36.47
872513 rs11233746 11_40 0.000 1169.99 1.6e-07 36.47
872508 rs12790558 11_40 0.000 1169.96 1.6e-07 36.47
872514 rs11233747 11_40 0.000 1169.96 1.6e-07 36.47
872520 rs11600569 11_40 0.000 1169.87 1.6e-07 36.47
872493 rs12785878 11_40 0.000 1169.76 1.6e-07 36.46
872483 rs12789751 11_40 0.000 1169.59 1.6e-07 36.46
872482 rs11606631 11_40 0.000 1169.52 1.6e-07 36.46
872486 rs4488226 11_40 0.000 1169.48 1.6e-07 36.46
872484 rs12791871 11_40 0.000 1169.41 1.6e-07 36.46SNPs with highest PVE
#SNPs with 50 highest pve
head(ctwas_snp_res[order(-ctwas_snp_res$PVE),report_cols_snps],50)
id region_tag susie_pip mu2 PVE z
226097 rs7697091 4_50 1.000 2026.09 0.00620 -64.16
566764 rs10766194 11_11 1.000 1625.74 0.00490 -41.01
226096 rs843005 4_50 1.000 1585.76 0.00480 59.21
562601 rs12282912 11_3 1.000 1217.23 0.00370 2.65
658309 rs775834524 13_25 1.000 1224.73 0.00370 -2.53
562606 rs759352454 11_3 1.000 1200.20 0.00360 2.92
566768 rs7129781 11_11 1.000 959.46 0.00290 -20.22
566740 rs11023314 11_11 0.891 834.41 0.00230 12.46
658299 rs7337153 13_25 0.587 1209.98 0.00220 -2.81
658307 rs7999449 13_25 0.568 1210.50 0.00210 -2.79
226091 rs16846876 4_50 0.724 722.21 0.00160 -52.15
566745 rs576218922 11_11 1.000 499.26 0.00150 -35.89
226094 rs222042 4_50 1.000 458.62 0.00140 4.62
658300 rs9527399 13_25 0.217 1206.42 0.00079 2.80
658302 rs9527401 13_25 0.204 1206.35 0.00075 2.79
658303 rs9597193 13_25 0.206 1206.36 0.00075 2.80
897532 rs561086564 19_33 1.000 241.32 0.00073 2.81
658304 rs9537143 13_25 0.195 1206.37 0.00071 2.79
658297 rs9527398 13_25 0.175 1205.73 0.00064 2.80
658298 rs9537125 13_25 0.175 1205.73 0.00064 2.80
658295 rs9537123 13_25 0.170 1205.62 0.00062 2.79
897583 rs75778010 19_33 1.000 196.73 0.00060 2.70
633606 rs6538696 12_57 1.000 161.67 0.00049 15.75
226110 rs35096193 4_50 0.995 152.11 0.00046 25.11
872437 rs138659167 11_40 1.000 151.01 0.00046 14.73
226078 rs34186014 4_50 0.185 704.29 0.00040 -51.73
35366 rs115288876 1_74 1.000 104.56 0.00032 12.20
566748 rs73418613 11_11 0.109 829.59 0.00027 12.14
838576 rs2585441 20_32 1.000 70.82 0.00022 9.56
872466 rs12573951 11_40 0.278 245.22 0.00021 -10.60
883096 rs1800588 15_26 0.645 107.29 0.00021 -10.86
897455 rs191652498 19_33 0.927 72.41 0.00020 2.43
226077 rs11732044 4_50 0.089 698.25 0.00019 -51.61
633610 rs7308827 12_57 0.997 63.09 0.00019 -11.80
470092 rs12056610 8_78 0.813 74.76 0.00018 -8.77
838570 rs6123359 20_32 1.000 58.42 0.00018 8.76
838577 rs12480880 20_32 1.000 59.79 0.00018 9.97
35475 rs11205006 1_74 0.999 55.37 0.00017 -11.74
75319 rs780093 2_16 1.000 55.03 0.00017 7.97
597580 rs3135506 11_70 0.873 62.12 0.00016 -9.17
35535 rs61813920 1_74 1.000 48.61 0.00015 9.77
35277 rs140655928 1_74 1.000 44.27 0.00013 9.17
224855 rs445908 4_48 0.953 44.27 0.00013 -6.66
882861 rs261291 15_26 0.475 91.52 0.00013 -10.67
225945 rs189319377 4_49 1.000 39.77 0.00012 -6.98
743966 rs821840 16_31 0.857 44.62 0.00012 -6.90
810644 rs73004951 19_15 0.744 53.97 0.00012 7.89
584355 rs3740776 11_42 1.000 36.71 0.00011 6.23
838599 rs6068816 20_32 0.999 36.47 0.00011 -7.56
73583 rs1042034 2_13 1.000 34.13 0.00010 -5.24SNPs with largest z scores
#SNPs with 50 largest z scores
head(ctwas_snp_res[order(-abs(ctwas_snp_res$z)),report_cols_snps],50)
id region_tag susie_pip mu2 PVE z
226097 rs7697091 4_50 1.000 2026.09 6.2e-03 -64.16
226096 rs843005 4_50 1.000 1585.76 4.8e-03 59.21
226095 rs705119 4_50 0.000 1462.40 2.3e-13 56.46
226103 rs114289627 4_50 0.006 1143.93 2.2e-05 -55.56
226091 rs16846876 4_50 0.724 722.21 1.6e-03 -52.15
226078 rs34186014 4_50 0.185 704.29 4.0e-04 -51.73
226077 rs11732044 4_50 0.089 698.25 1.9e-04 -51.61
226070 rs11733890 4_50 0.001 643.15 1.0e-06 -49.98
226085 rs1526692 4_50 0.000 866.28 1.7e-15 -46.84
226081 rs7682810 4_50 0.000 864.40 1.7e-15 -46.79
566764 rs10766194 11_11 1.000 1625.74 4.9e-03 -41.01
226105 rs34539583 4_50 0.000 291.28 1.3e-14 40.43
226092 rs1491711 4_50 0.000 539.96 3.2e-15 39.27
872473 rs7928249 11_40 0.000 1171.97 1.6e-07 36.51
872503 rs2276361 11_40 0.000 1171.98 1.6e-07 36.51
872502 rs2276360 11_40 0.000 1171.79 1.6e-07 36.50
872504 rs7938885 11_40 0.000 1171.93 1.6e-07 36.50
872474 rs12793530 11_40 0.000 1171.21 1.6e-07 36.49
872489 rs3831470 11_40 0.000 1171.25 1.6e-07 36.49
872492 rs12792306 11_40 0.000 1170.98 1.6e-07 36.49
872494 rs4944955 11_40 0.000 1171.17 1.6e-07 36.49
872495 rs4944956 11_40 0.000 1171.17 1.6e-07 36.49
872509 rs12800438 11_40 0.000 1171.35 1.6e-07 36.49
872511 rs12807718 11_40 0.000 1171.26 1.6e-07 36.49
872519 rs4423214 11_40 0.000 1170.97 1.6e-07 36.49
872475 rs11546509 11_40 0.000 1170.49 1.6e-07 36.48
872478 rs2002063 11_40 0.000 1170.41 1.6e-07 36.48
872498 rs4944958 11_40 0.000 1170.31 1.6e-07 36.48
872499 rs4944959 11_40 0.000 1170.40 1.6e-07 36.48
872507 rs12808368 11_40 0.000 1170.53 1.6e-07 36.48
872521 rs2276362 11_40 0.000 1170.63 1.6e-07 36.48
872500 rs12793224 11_40 0.000 1170.21 1.6e-07 36.47
872501 rs12794668 11_40 0.000 1170.21 1.6e-07 36.47
872505 rs12790010 11_40 0.000 1170.24 1.6e-07 36.47
872506 rs12806844 11_40 0.000 1170.33 1.6e-07 36.47
872508 rs12790558 11_40 0.000 1169.96 1.6e-07 36.47
872513 rs11233746 11_40 0.000 1169.99 1.6e-07 36.47
872514 rs11233747 11_40 0.000 1169.96 1.6e-07 36.47
872520 rs11600569 11_40 0.000 1169.87 1.6e-07 36.47
872482 rs11606631 11_40 0.000 1169.52 1.6e-07 36.46
872483 rs12789751 11_40 0.000 1169.59 1.6e-07 36.46
872484 rs12791871 11_40 0.000 1169.41 1.6e-07 36.46
872486 rs4488226 11_40 0.000 1169.48 1.6e-07 36.46
872488 rs7944926 11_40 0.000 1169.37 1.6e-07 36.46
872493 rs12785878 11_40 0.000 1169.76 1.6e-07 36.46
872517 rs2040323 11_40 0.000 1168.84 1.6e-07 36.45
872557 rs7935125 11_40 0.000 1168.22 1.6e-07 36.44
872567 rs4944062 11_40 0.000 1168.09 1.6e-07 36.44
872539 rs11233789 11_40 0.000 1166.85 1.6e-07 36.41
872497 rs4944957 11_40 0.000 1165.92 1.6e-07 36.40Gene set enrichment for genes with PIP>0.8
#GO enrichment analysis
library(enrichR)
Welcome to enrichR
Checking connection ... Enrichr ... Connection is Live!
FlyEnrichr ... Connection is available!
WormEnrichr ... Connection is available!
YeastEnrichr ... Connection is available!
FishEnrichr ... Connection is available!dbs <- c("GO_Biological_Process_2021", "GO_Cellular_Component_2021", "GO_Molecular_Function_2021")
genes <- ctwas_gene_res$genename[ctwas_gene_res$susie_pip>0.8]
#number of genes for gene set enrichment
length(genes)[1] 4if (length(genes)>0){
GO_enrichment <- enrichr(genes, dbs)
for (db in dbs){
print(db)
df <- GO_enrichment[[db]]
df <- df[df$Adjusted.P.value<0.05,c("Term", "Overlap", "Adjusted.P.value", "Genes")]
print(df)
}
#DisGeNET enrichment
# devtools::install_bitbucket("ibi_group/disgenet2r")
library(disgenet2r)
disgenet_api_key <- get_disgenet_api_key(
email = "wesleycrouse@gmail.com",
password = "uchicago1" )
Sys.setenv(DISGENET_API_KEY= disgenet_api_key)
res_enrich <-disease_enrichment(entities=genes, vocabulary = "HGNC",
database = "CURATED" )
df <- res_enrich@qresult[1:10, c("Description", "FDR", "Ratio", "BgRatio")]
print(df)
#WebGestalt enrichment
library(WebGestaltR)
background <- ctwas_gene_res$genename
#listGeneSet()
databases <- c("pathway_KEGG", "disease_GLAD4U", "disease_OMIM")
enrichResult <- WebGestaltR(enrichMethod="ORA", organism="hsapiens",
interestGene=genes, referenceGene=background,
enrichDatabase=databases, interestGeneType="genesymbol",
referenceGeneType="genesymbol", isOutput=F)
print(enrichResult[,c("description", "size", "overlap", "FDR", "database", "userId")])
}Uploading data to Enrichr... Done.
Querying GO_Biological_Process_2021... Done.
Querying GO_Cellular_Component_2021... Done.
Querying GO_Molecular_Function_2021... Done.
Parsing results... Done.
[1] "GO_Biological_Process_2021"
Term
1 sterol metabolic process (GO:0016125)
2 cholesterol metabolic process (GO:0008203)
3 ethanol catabolic process (GO:0006068)
4 primary alcohol catabolic process (GO:0034310)
5 protein localization to phagophore assembly site (GO:0034497)
6 lipoprotein biosynthetic process (GO:0042158)
7 Golgi to endosome transport (GO:0006895)
8 autophagy of nucleus (GO:0044804)
9 sulfation (GO:0051923)
10 ethanol metabolic process (GO:0006067)
11 purine ribonucleoside bisphosphate metabolic process (GO:0034035)
12 3'-phosphoadenosine 5'-phosphosulfate metabolic process (GO:0050427)
13 RNA splicing, via transesterification reactions (GO:0000375)
14 steroid hormone biosynthetic process (GO:0120178)
15 secondary alcohol biosynthetic process (GO:1902653)
16 oxoacid metabolic process (GO:0043436)
17 cholesterol biosynthetic process (GO:0006695)
18 mitochondrion disassembly (GO:0061726)
19 spliceosomal snRNP assembly (GO:0000387)
20 sterol biosynthetic process (GO:0016126)
21 autophagy of mitochondrion (GO:0000422)
22 nucleocytoplasmic transport (GO:0006913)
23 secondary alcohol metabolic process (GO:1902652)
24 organic hydroxy compound biosynthetic process (GO:1901617)
25 IRE1-mediated unfolded protein response (GO:0036498)
26 autophagosome organization (GO:1905037)
27 autophagosome assembly (GO:0000045)
28 protein lipidation (GO:0006497)
29 steroid biosynthetic process (GO:0006694)
30 cellular response to nutrient levels (GO:0031669)
31 purine ribonucleotide metabolic process (GO:0009150)
32 import into nucleus (GO:0051170)
33 regulation of lipid metabolic process (GO:0019216)
34 mRNA metabolic process (GO:0016071)
35 RNA splicing (GO:0008380)
36 steroid metabolic process (GO:0008202)
37 macroautophagy (GO:0016236)
38 regulation of primary metabolic process (GO:0080090)
39 ribonucleoprotein complex assembly (GO:0022618)
40 cellular response to starvation (GO:0009267)
41 RNA processing (GO:0006396)
Overlap Adjusted.P.value Genes
1 2/70 0.002008875 DHCR7;SULT2A1
2 2/77 0.002008875 DHCR7;SULT2A1
3 1/7 0.015869231 SULT2A1
4 1/10 0.015869231 SULT2A1
5 1/11 0.015869231 WIPI1
6 1/11 0.015869231 WIPI1
7 1/16 0.015869231 WIPI1
8 1/16 0.015869231 WIPI1
9 1/17 0.015869231 SULT2A1
10 1/19 0.015869231 SULT2A1
11 1/19 0.015869231 SULT2A1
12 1/25 0.016678217 SULT2A1
13 1/25 0.016678217 GEMIN2
14 1/31 0.016678217 DHCR7
15 1/34 0.016678217 DHCR7
16 1/35 0.016678217 SULT2A1
17 1/35 0.016678217 DHCR7
18 1/36 0.016678217 WIPI1
19 1/38 0.016678217 GEMIN2
20 1/38 0.016678217 DHCR7
21 1/40 0.016678217 WIPI1
22 1/40 0.016678217 GEMIN2
23 1/49 0.019096142 SULT2A1
24 1/50 0.019096142 DHCR7
25 1/53 0.019427865 WIPI1
26 1/56 0.019678439 WIPI1
27 1/58 0.019678439 WIPI1
28 1/61 0.019952648 WIPI1
29 1/65 0.020141351 DHCR7
30 1/66 0.020141351 WIPI1
31 1/77 0.022011437 SULT2A1
32 1/77 0.022011437 GEMIN2
33 1/92 0.025473749 DHCR7
34 1/95 0.025525010 GEMIN2
35 1/98 0.025572990 GEMIN2
36 1/104 0.026372955 SULT2A1
37 1/120 0.029572363 WIPI1
38 1/130 0.031170250 DHCR7
39 1/136 0.031758446 GEMIN2
40 1/158 0.035914079 WIPI1
41 1/179 0.039632545 GEMIN2
[1] "GO_Cellular_Component_2021"
Term Overlap Adjusted.P.value Genes
1 nuclear outer membrane (GO:0005640) 1/16 0.04393012 DHCR7
2 autophagosome membrane (GO:0000421) 1/22 0.04393012 WIPI1
[1] "GO_Molecular_Function_2021"
Term
1 oxidoreductase activity, acting on the CH-CH group of donors, NAD or NADP as acceptor (GO:0016628)
2 phosphatidylinositol-3,5-bisphosphate binding (GO:0080025)
3 androgen receptor binding (GO:0050681)
4 estrogen receptor binding (GO:0030331)
5 NADP binding (GO:0050661)
6 phosphatidylinositol-3-phosphate binding (GO:0032266)
7 sulfotransferase activity (GO:0008146)
8 phosphatidylinositol bisphosphate binding (GO:1902936)
9 phosphatidylinositol phosphate binding (GO:1901981)
10 nuclear receptor binding (GO:0016922)
Overlap Adjusted.P.value Genes
1 1/18 0.01139506 DHCR7
2 1/24 0.01139506 WIPI1
3 1/27 0.01139506 WIPI1
4 1/35 0.01139506 WIPI1
5 1/36 0.01139506 DHCR7
6 1/39 0.01139506 WIPI1
7 1/40 0.01139506 SULT2A1
8 1/94 0.02249536 WIPI1
9 1/102 0.02249536 WIPI1
10 1/120 0.02378647 WIPI1GEMIN2 gene(s) from the input list not found in DisGeNET CURATED Description FDR Ratio BgRatio
13 Smith-Lemli-Opitz Syndrome 0.001468769 1/3 1/9703
15 Smith-Lemli-Opitz Syndrome, Type I 0.001468769 1/3 1/9703
16 Smith-Lemli-Opitz Syndrome, Type II 0.001468769 1/3 1/9703
18 7-Dehydrocholesterol Reductase Deficiency 0.001468769 1/3 1/9703
10 Disorders of Sex Development 0.008220022 1/3 7/9703
2 Metabolic Bone Disorder 0.012571291 1/3 14/9703
8 Osteopenia 0.012571291 1/3 15/9703
4 Lipoidosis 0.013680270 1/3 19/9703
11 Nephritis, Tubulointerstitial 0.013680270 1/3 21/9703
7 Nephritis, Interstitial 0.014066781 1/3 24/9703******************************************
* *
* Welcome to WebGestaltR ! *
* *
******************************************Loading the functional categories...
Loading the ID list...
Loading the reference list...
Performing the enrichment analysis...
description size overlap FDR database
1 Asperger's disorder 50 3 0.002103385 disease_GLAD4U
userId
1 DHCR7;GEMIN2;SULT2A1
sessionInfo()R version 3.6.1 (2019-07-05)
Platform: x86_64-pc-linux-gnu (64-bit)
Running under: Scientific Linux 7.4 (Nitrogen)
Matrix products: default
BLAS/LAPACK: /software/openblas-0.2.19-el7-x86_64/lib/libopenblas_haswellp-r0.2.19.so
locale:
[1] LC_CTYPE=en_US.UTF-8 LC_NUMERIC=C
[3] LC_TIME=en_US.UTF-8 LC_COLLATE=en_US.UTF-8
[5] LC_MONETARY=en_US.UTF-8 LC_MESSAGES=en_US.UTF-8
[7] LC_PAPER=en_US.UTF-8 LC_NAME=C
[9] LC_ADDRESS=C LC_TELEPHONE=C
[11] LC_MEASUREMENT=en_US.UTF-8 LC_IDENTIFICATION=C
attached base packages:
[1] stats graphics grDevices utils datasets methods base
other attached packages:
[1] WebGestaltR_0.4.4 disgenet2r_0.99.2 enrichR_3.0 cowplot_1.0.0
[5] ggplot2_3.3.3
loaded via a namespace (and not attached):
[1] bitops_1.0-6 matrixStats_0.57.0
[3] fs_1.3.1 bit64_4.0.5
[5] doParallel_1.0.16 progress_1.2.2
[7] httr_1.4.1 rprojroot_2.0.2
[9] GenomeInfoDb_1.20.0 doRNG_1.8.2
[11] tools_3.6.1 utf8_1.2.1
[13] R6_2.5.0 DBI_1.1.1
[15] BiocGenerics_0.30.0 colorspace_1.4-1
[17] withr_2.4.1 tidyselect_1.1.0
[19] prettyunits_1.0.2 bit_4.0.4
[21] curl_3.3 compiler_3.6.1
[23] git2r_0.26.1 Biobase_2.44.0
[25] DelayedArray_0.10.0 rtracklayer_1.44.0
[27] labeling_0.3 scales_1.1.0
[29] readr_1.4.0 apcluster_1.4.8
[31] stringr_1.4.0 digest_0.6.20
[33] Rsamtools_2.0.0 svglite_1.2.2
[35] rmarkdown_1.13 XVector_0.24.0
[37] pkgconfig_2.0.3 htmltools_0.3.6
[39] fastmap_1.1.0 BSgenome_1.52.0
[41] rlang_0.4.11 RSQLite_2.2.7
[43] generics_0.0.2 farver_2.1.0
[45] jsonlite_1.6 BiocParallel_1.18.0
[47] dplyr_1.0.7 VariantAnnotation_1.30.1
[49] RCurl_1.98-1.1 magrittr_2.0.1
[51] GenomeInfoDbData_1.2.1 Matrix_1.2-18
[53] Rcpp_1.0.6 munsell_0.5.0
[55] S4Vectors_0.22.1 fansi_0.5.0
[57] gdtools_0.1.9 lifecycle_1.0.0
[59] stringi_1.4.3 whisker_0.3-2
[61] yaml_2.2.0 SummarizedExperiment_1.14.1
[63] zlibbioc_1.30.0 plyr_1.8.4
[65] grid_3.6.1 blob_1.2.1
[67] parallel_3.6.1 promises_1.0.1
[69] crayon_1.4.1 lattice_0.20-38
[71] Biostrings_2.52.0 GenomicFeatures_1.36.3
[73] hms_1.1.0 knitr_1.23
[75] pillar_1.6.1 igraph_1.2.4.1
[77] GenomicRanges_1.36.0 rjson_0.2.20
[79] rngtools_1.5 codetools_0.2-16
[81] reshape2_1.4.3 biomaRt_2.40.1
[83] stats4_3.6.1 XML_3.98-1.20
[85] glue_1.4.2 evaluate_0.14
[87] data.table_1.14.0 foreach_1.5.1
[89] vctrs_0.3.8 httpuv_1.5.1
[91] gtable_0.3.0 purrr_0.3.4
[93] assertthat_0.2.1 cachem_1.0.5
[95] xfun_0.8 later_0.8.0
[97] tibble_3.1.2 iterators_1.0.13
[99] GenomicAlignments_1.20.1 AnnotationDbi_1.46.0
[101] memoise_2.0.0 IRanges_2.18.1
[103] workflowr_1.6.2 ellipsis_0.3.2