Number of Causal Genes Detected
wesleycrouse
2022-11-21
Last updated: 2023-06-20
Checks: 6 1
Knit directory: ctwas_applied/
This reproducible R Markdown analysis was created with workflowr (version 1.7.0). The Checks tab describes the reproducibility checks that were applied when the results were created. The Past versions tab lists the development history.
The R Markdown file has unstaged changes. To know which version of
the R Markdown file created these results, you’ll want to first commit
it to the Git repo. If you’re still working on the analysis, you can
ignore this warning. When you’re finished, you can run
wflow_publish to commit the R Markdown file and build the
HTML.
Great job! The global environment was empty. Objects defined in the global environment can affect the analysis in your R Markdown file in unknown ways. For reproduciblity it’s best to always run the code in an empty environment.
The command set.seed(20210726) was run prior to running
the code in the R Markdown file. Setting a seed ensures that any results
that rely on randomness, e.g. subsampling or permutations, are
reproducible.
Great job! Recording the operating system, R version, and package versions is critical for reproducibility.
Nice! There were no cached chunks for this analysis, so you can be confident that you successfully produced the results during this run.
Great job! Using relative paths to the files within your workflowr project makes it easier to run your code on other machines.
Great! You are using Git for version control. Tracking code development and connecting the code version to the results is critical for reproducibility.
The results in this page were generated with repository version 45e6c0d. See the Past versions tab to see a history of the changes made to the R Markdown and HTML files.
Note that you need to be careful to ensure that all relevant files for
the analysis have been committed to Git prior to generating the results
(you can use wflow_publish or
wflow_git_commit). workflowr only checks the R Markdown
file, but you know if there are other scripts or data files that it
depends on. Below is the status of the Git repository when the results
were generated:
Untracked files:
    Untracked:  gwas.RData
    Untracked:  ld_R_info.RData
    Untracked:  z_snp_pos_ebi-a-GCST004131.RData
    Untracked:  z_snp_pos_ebi-a-GCST004132.RData
    Untracked:  z_snp_pos_ebi-a-GCST004133.RData
    Untracked:  z_snp_pos_scz-2018.RData
    Untracked:  z_snp_pos_ukb-a-360.RData
    Untracked:  z_snp_pos_ukb-d-30780_irnt.RData

Unstaged changes:
    Modified:   analysis/simulation_ncausal_plot.Rmd
    Modified:   code/automate_Rmd.R
    Modified:   output/simulation_ncausal_plot.pdf
Note that any generated files, e.g. HTML, png, CSS, etc., are not included in this status report because it is ok for generated content to have uncommitted changes.
These are the previous versions of the repository in which changes were
made to the R Markdown
(analysis/simulation_ncausal_plot.Rmd) and HTML
(docs/simulation_ncausal_plot.html) files. If you’ve
configured a remote Git repository (see ?wflow_git_remote),
click on the hyperlinks in the table below to view the files as they
were in that past version.
| File | Version | Author | Date | Message |
|---|---|---|---|---|
| Rmd | fa29d7e | wesleycrouse | 2023-06-02 | updating revisions |
| Rmd | dba8c0e | wesleycrouse | 2023-05-14 | updating simulation plot with MRLocus |
| html | dba8c0e | wesleycrouse | 2023-05-14 | updating simulation plot with MRLocus |
| Rmd | c538341 | wesleycrouse | 2023-04-26 | fixing issue with ncausal plot |
| html | c538341 | wesleycrouse | 2023-04-26 | fixing issue with ncausal plot |
| Rmd | 9e7d4cd | wesleycrouse | 2022-12-15 | multigroup testing results |
| Rmd | a66efe7 | wesleycrouse | 2022-11-29 | regularized PMR |
| html | a66efe7 | wesleycrouse | 2022-11-29 | regularized PMR |
| html | 122914e | wesleycrouse | 2022-11-28 | more PMR simulations |
| Rmd | d2d654d | wesleycrouse | 2022-11-21 | Adjusting ncausal plot |
| html | d2d654d | wesleycrouse | 2022-11-21 | Adjusting ncausal plot |
| html | f95174d | wesleycrouse | 2022-11-21 | recompile ncausal |
| Rmd | b57e061 | wesleycrouse | 2022-11-21 | fixed NAs in smr heidi |
| html | b57e061 | wesleycrouse | 2022-11-21 | fixed NAs in smr heidi |
| Rmd | b5025aa | wesleycrouse | 2022-11-21 | fixed heidi significance |
| html | b5025aa | wesleycrouse | 2022-11-21 | fixed heidi significance |
| Rmd | 0ac6339 | wesleycrouse | 2022-11-21 | rename simulation report |
| html | 0ac6339 | wesleycrouse | 2022-11-21 | rename simulation report |
library(ctwas)
library(data.table)

source("~/causalTWAS/causal-TWAS/analysis/summarize_basic_plots.R")
Attaching package: 'ggpubr'The following object is masked from 'package:cowplot':
get_legendsource("~/causalTWAS/causal-TWAS/analysis/summarize_ctwas_plots.R")
Attaching package: 'plyr'The following object is masked from 'package:ggpubr':
mutatesource("~/causalTWAS/causal-TWAS/analysis/ld.R")
outputdir = "/home/simingz/causalTWAS/simulations/simulation_ctwas_rss_20210416/"
comparedir = "/home/simingz/causalTWAS/simulations/simulation_ctwas_rss_20210416_compare/"
runtag = "ukb-s80.45-adi"
configtag = 1
pgenfn = "/home/simingz/causalTWAS/ukbiobank/ukb_pgen_s80.45/ukb-s80.45_pgenfs.txt"
ld_pgenfn = "/home/simingz/causalTWAS/ukbiobank/ukb_pgen_s80.45/ukb-s80.45.2_pgenfs.txt"
exprfn = "/home/simingz/causalTWAS/simulations/simulation_ctwas_rss_20210416//ukb-s80.45-adi.expr.txt"
weightf = "/project2/mstephens/causalTWAS/fusion_weights/Adipose_Subcutaneous.pos"
ld_pgenfs <- read.table(ld_pgenfn, header = F, stringsAsFactors = F)[,1]
pgenfs <- read.table(pgenfn, header = F, stringsAsFactors = F)[,1]
pvarfs <- sapply(pgenfs, prep_pvar, outputdir = outputdir)
pgens <- lapply(1:length(pgenfs), function(x) prep_pgen(pgenf = pgenfs[x],pvarf = pvarfs[x]))
exprfs <- read.table(exprfn, header = F, stringsAsFactors = F)[,1]
exprvarfs <- sapply(exprfs, prep_exprvar)
n <- pgenlibr::GetRawSampleCt(pgens[[1]])
p <- sum(unlist(lapply(pgens, pgenlibr::GetVariantCt))) # number of SNPs
J <- 8021 # number of genes
colorsall <- c("#7fc97f", "#beaed4", "#fdc086")
simutaglist = list(paste(4, 1:5, sep = "-"), paste(10, 1:5, sep="-"))
weights <- as.data.frame(fread(weightf, header = T))
weights$ENSEMBL_ID <- sapply(weights$WGT, function(x){unlist(strsplit(unlist(strsplit(x,"/"))[2], "[.]"))[2]})Comparison with other methods
Bar plot: each bar shows the number of genes, colored by causal status. Use a different color for each method. The method and cut off values: * ctwas: PIP 0.8 * FUSION fdr: 0.05 * FUSION bonferroni: 0.05 * COLOC PP4: 0.8 * FOCUS PIP: 0.8 * SMR FDR: 0.05 * SMR HEIDI: HEIDI p > 0.05, SMR FDR < 0.05
Multiple bar plots, different settings: high gene power and low gene power.
get_ncausal_df <- function(pfiles, cau, cut = 0.8,
                           method = c("cTWAS", "fusionfdr", "Fusion","coloc", "FOCUS", "SMR", "MRLocus", "MRLocus_nofilter"),
                           fusion_files=NULL){
  df <- NULL
  for (i in 1:length(pfiles)) {

    if (method %in% c("MRLocus", "MRLocus_nofilter")){
      pfiles_dir <- paste(rev(rev(unlist(strsplit(pfiles[i], split="/")))[-1]), collapse="/")
      pfiles_batch <- list.files(pfiles_dir)
      pfiles_batch <- pfiles_batch[grep(rev(unlist(strsplit(pfiles[i], split="/")))[1], pfiles_batch)]
      pfiles_batch <- pfiles_batch[grep("temp", pfiles_batch)]
      pfiles_batch <- paste(pfiles_dir, pfiles_batch, sep="/")

      res <- do.call(rbind, lapply(pfiles_batch, fread))

      res_fusion <- as.data.frame(fread(fusion_files[i], header = T))
    } else {
      res <- fread(pfiles[i], header = T)
    }

    if (method == "cTWAS"){
        res <- data.frame(res[res$type  =="gene", ])
        res$ifcausal <- ifelse(res$id %in% cau[[i]], 1, 0)
        res <- res[res$susie_pip > cut,]
    } else if (method == "fusionfdr"){
        res$FDR <- p.adjust(res$TWAS.P, method = "fdr")
        res <- res[res$FDR < cut,]
        res$ifcausal <- ifelse(res$ID %in% cau[[i]], 1, 0)
    } else if  (method == "Fusion"){
        res$FDR <- p.adjust(res$TWAS.P, method = "bonferroni")
        res <- res[res$FDR < cut,]
        res$ifcausal <- ifelse(res$ID %in% cau[[i]], 1, 0)
    } else if  (method == "coloc"){
        res <- res[res$COLOC.PP4 > cut,]
        res$ifcausal <- ifelse(res$ID %in% cau[[i]], 1, 0)
    } else if (method == "FOCUS"){
        res <- res[res$mol_name != "NULL",]
        res <- res[res$pip > cut,]
        res$ifcausal <- ifelse(res$mol_name %in% cau[[i]], 1, 0)
    } else if (method == "SMR"){
        res <- as.data.frame(res)
        res$probeID <- sapply(res$Gene, function(x){unlist(strsplit(x, "[.]"))[1]})
        res <- res[res$probeID %in% weights$ENSEMBL_ID,]
        res$FDR <- p.adjust(res$p_SMR, method = "fdr")
        res <- res[res$FDR < cut,]
        res <- res[sapply(res$p_HEIDI > 0.05, isTRUE),]
        res$ifcausal <- ifelse(res$probeID %in% cau[[i]], 1, 0)
    } else if (method == "MR-JTI"){
        res <- res[res$CI_significance=="sig",]
        res$ifcausal <- ifelse(res$variable %in% cau[[i]], 1, 0)
    } else if (method == "PMR-Egger"){
        res <- as.data.frame(res)
        res <- res[sapply(res$causal_pvalue < cut/sum(!is.na(res$causal_pvalue)), isTRUE),]
        res$ifcausal <- ifelse(res$gene_id %in% cau[[i]], 1, 0)
    } else if (method == "MRLocus"){
        res_fusion <- res_fusion[which(p.adjust(res_fusion$TWAS.P, method="BH")<0.05),,drop=F]
        res_fusion$ENSEMBL_ID <- weights$ENSEMBL_ID[match(res_fusion$ID, weights$ID)]

        res <- as.data.frame(res)
        res <- res[res$gene_id %in% res_fusion$ENSEMBL_ID,,drop=F]
        res <- res[sapply(sign(res$CI_10)==sign(res$CI_90), isTRUE) & res$n_clumps>1,,drop=F]
        res$ifcausal <- ifelse(res$gene_id %in% cau[[i]], 1, 0)
    } else if (method == "MRLocus_nofilter"){
        res <- as.data.frame(res)
        res <- res[sapply(sign(res$CI_10)==sign(res$CI_90), isTRUE) & res$n_clumps>1,,drop=F]
        res$ifcausal <- ifelse(res$gene_id %in% cau[[i]], 1, 0)
    } else {
      stop("no such method")
    }
    df.rt <- rbind(c(nrow(res[res$ifcausal == 0, ]), 0, i),
                   c(nrow(res[res$ifcausal == 1, ]), 1, i))
    df <- rbind(df, df.rt)
  }
  colnames(df) <- c("count", "ifcausal", "runtag")
  df <- data.frame(df)
  df$method <- method
  return(df)
}

plot_ncausal <- function(configtag, runtag,  simutags, colors, ..., nofilter=F){
  phenofs <- paste0(outputdir, runtag, "_simu", simutags, "-pheno.Rd")
  cau <- lapply(phenofs, function(x) {load(x);get_causal_id(phenores)})

  cau_ensembl <- cau

  for (i in 1:length(cau_ensembl)){
    cau_ensembl[[i]][cau_ensembl[[i]] %in% weights$ID] <- weights$ENSEMBL_ID[match(cau_ensembl[[i]][cau_ensembl[[i]] %in% weights$ID], weights$ID)]
  }

  susieIfs <- paste0(outputdir, runtag, "_simu",simutags, "_config", configtag,".susieIrss.txt")
  fusioncolocfs <- paste0(comparedir, runtag, "_simu", simutags, ".Adipose_Subcutaneous.coloc.result")
  focusfs <- paste0(comparedir, runtag, "_simu", simutags, ".Adipose_Subcutaneous.focus.tsv")
  smrfs <- paste0(comparedir, runtag, "_simu", simutags, ".Adipose_Subcutaneous.smr")
  mrjtifs <- paste0(comparedir, runtag, "_simu", simutags, ".Adipose_Subcutaneous.mrjti.result")
  pmrfs <- paste0(comparedir, runtag, "_simu", simutags, ".Adipose_Subcutaneous.pmr.result_pi_080")
  mrlocusfs <- paste0(comparedir, runtag, "_simu", simutags, ".Adipose_Subcutaneous.mrlocus.result.batch_")

  ctwas_df <- get_ncausal_df(susieIfs, cau= cau, cut = 0.8, method ="cTWAS")
  #fusionfdr_df <- get_ncausal_df(fusioncolocfs , cau= cau, cut = 0.05, method = "fusionfdr")
  fusionbon_df <- get_ncausal_df(fusioncolocfs , cau= cau, cut = 0.05, method = "Fusion")
  coloc_df <- get_ncausal_df(fusioncolocfs , cau= cau, cut = 0.8, method = "coloc")
  focus_df <- get_ncausal_df(focusfs , cau= cau, cut = 0.8, method = "FOCUS")
  #smr_df <- get_ncausal_df(smrfs, cau= cau_ensembl, cut = 0.05, method = "smr")
  smrheidi_df <- get_ncausal_df(smrfs, cau= cau_ensembl, cut = 0.05, method = "SMR")
  mrjti_df <- get_ncausal_df(mrjtifs, cau= cau_ensembl, method = "MR-JTI")
  pmr_df <- get_ncausal_df(pmrfs, cau= cau_ensembl, cut = 0.05, method = "PMR-Egger")

  if (nofilter==F){
    mrlocus_df <- get_ncausal_df(mrlocusfs, cau= cau_ensembl, method = "MRLocus", fusion_files=fusioncolocfs)
  } else {
    mrlocus_df <- get_ncausal_df(mrlocusfs, cau= cau_ensembl, method = "MRLocus_nofilter", fusion_files=fusioncolocfs)
  }


  #df <- rbind(ctwas_df, fusionfdr_df, fusionbon_df, coloc_df, focus_df, smr_df, smrheidi_df, mrjti_df, pmr_df)
  df <- rbind(ctwas_df, fusionbon_df, coloc_df, focus_df, smrheidi_df, mrjti_df, pmr_df, mrlocus_df)
  df$ifcausal <- df$ifcausal + as.numeric(as.factor(df$method))*10
  df$ifcausal <- as.factor(df$ifcausal)

  fig <- ggbarplot(df, x = "method", y = "count", add = "mean_se", fill = "ifcausal", palette = colors, legend = "none", ylab="Count", xlab="", ...) + grids(linetype = "dashed")
  fig
}
colset = c("#ebebeb", "#ffffb3", # FOCUS
"#ebebeb", "#8dd3c7", # Fusion
"#ebebeb", "#CC79A7", # MR-JTI
"#ebebeb", "dimgray", # MRLocus
"#ebebeb", "goldenrod", #PMR-Egger
"#ebebeb", "#87CEFA", # SMR
"#ebebeb", "#fb8072", # cTWAS
"#ebebeb", "#bebada") # coloc
f1 <- plot_ncausal(configtag, runtag, simutaglist[[1]], colors = colset, ylim= c(0,225), main = "High Gene PVE")
f2 <- plot_ncausal(configtag, runtag, simutaglist[[2]], colors = colset, ylim= c(0,225), main = "Low Gene PVE")
gridExtra::grid.arrange(f1, f2, ncol=2)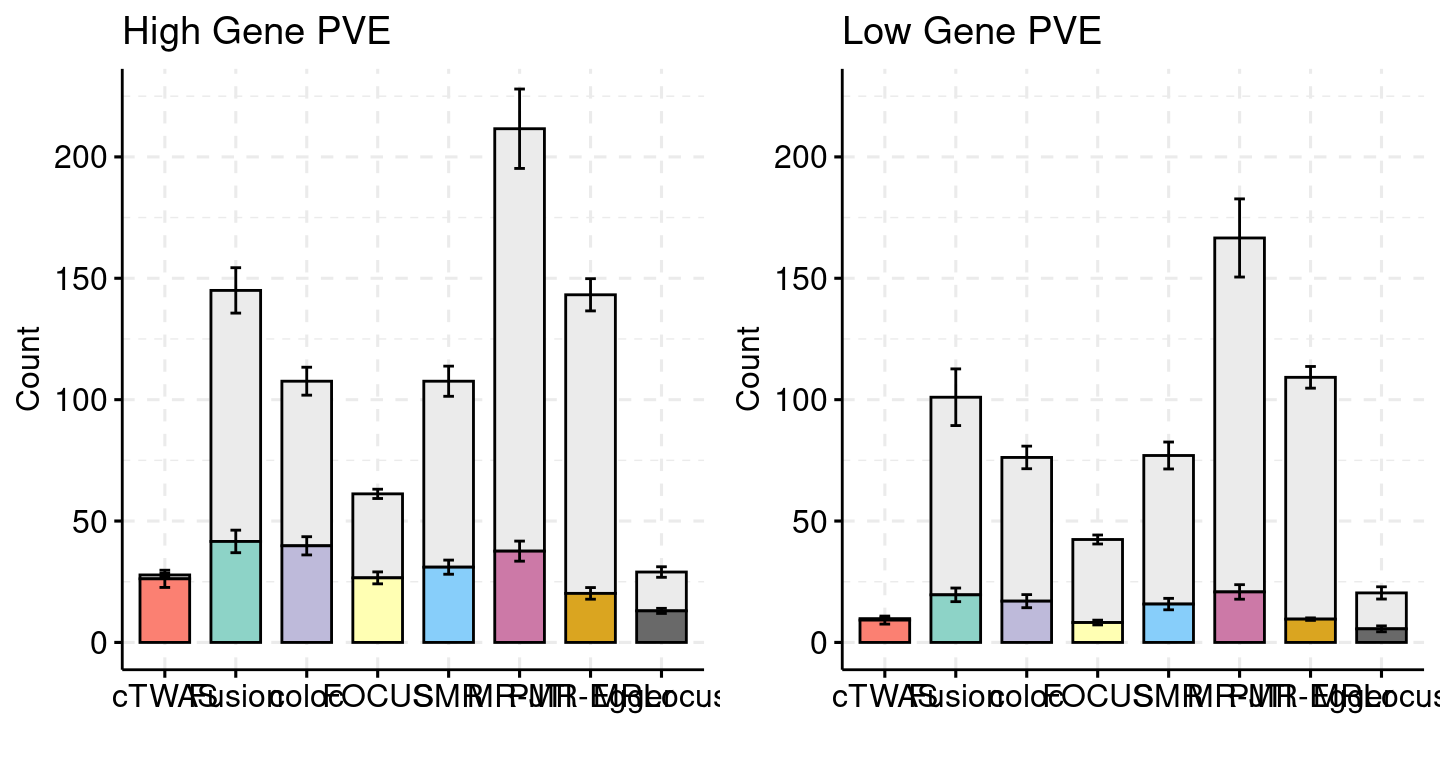
| Version | Author | Date |
|---|---|---|
| dba8c0e | wesleycrouse | 2023-05-14 |
pdf(file = "output/simulation_ncausal_plot.pdf", width = 8, height = 4)

gridExtra::grid.arrange(f1, f2, ncol=2)

dev.off()
png
2 ####################
f1 <- plot_ncausal(configtag, runtag, simutaglist[[1]], colors = colset, ylim= c(0,225), main = "High Gene PVE", nofilter=T)
f2 <- plot_ncausal(configtag, runtag, simutaglist[[2]], colors = colset, ylim= c(0,225), main = "Low Gene PVE", nofilter=T)
gridExtra::grid.arrange(f1, f2, ncol=2)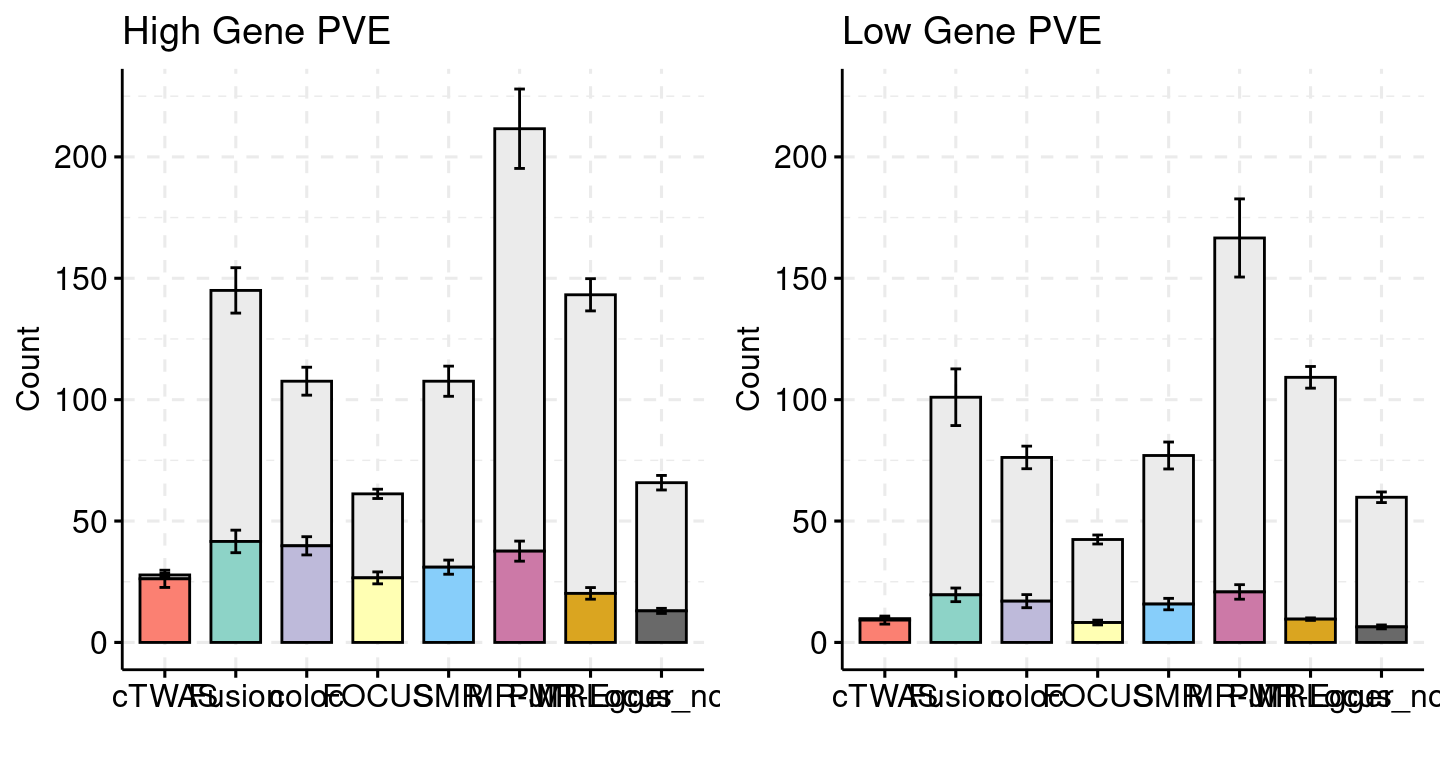
pdf(file = "output/simulation_ncausal_plot_nofilter.pdf", width = 8, height = 4)

gridExtra::grid.arrange(f1, f2, ncol=2)

dev.off()
png
2
sessionInfo()R version 4.1.0 (2021-05-18)
Platform: x86_64-pc-linux-gnu (64-bit)
Running under: CentOS Linux 7 (Core)
Matrix products: default
BLAS: /software/R-4.1.0-no-openblas-el7-x86_64/lib64/R/lib/libRblas.so
LAPACK: /software/R-4.1.0-no-openblas-el7-x86_64/lib64/R/lib/libRlapack.so
locale:
[1] LC_CTYPE=en_US.UTF-8 LC_NUMERIC=C LC_TIME=C
[4] LC_COLLATE=C LC_MONETARY=C LC_MESSAGES=C
[7] LC_PAPER=C LC_NAME=C LC_ADDRESS=C
[10] LC_TELEPHONE=C LC_MEASUREMENT=C LC_IDENTIFICATION=C
attached base packages:
[1] stats graphics grDevices utils datasets methods base
other attached packages:
[1] plyr_1.8.8 ggpubr_0.5.0 plotrix_3.8-2 cowplot_1.1.1
[5] ggplot2_3.4.0 data.table_1.14.6 ctwas_0.1.34 workflowr_1.7.0
loaded via a namespace (and not attached):
[1] Rcpp_1.0.9 lattice_0.20-45 tidyr_1.2.1 getPass_0.2-2
[5] ps_1.7.2 assertthat_0.2.1 rprojroot_2.0.3 digest_0.6.31
[9] foreach_1.5.2 utf8_1.2.2 R6_2.5.1 backports_1.4.1
[13] evaluate_0.18 highr_0.9 httr_1.4.4 pillar_1.8.1
[17] rlang_1.0.6 rstudioapi_0.14 car_3.1-1 whisker_0.4.1
[21] callr_3.7.3 jquerylib_0.1.4 Matrix_1.5-3 rmarkdown_2.18
[25] labeling_0.4.2 stringr_1.5.0 munsell_0.5.0 broom_1.0.1
[29] compiler_4.1.0 httpuv_1.6.6 xfun_0.35 pkgconfig_2.0.3
[33] htmltools_0.5.4 tidyselect_1.2.0 gridExtra_2.3 tibble_3.1.8
[37] logging_0.10-108 codetools_0.2-18 fansi_1.0.3 dplyr_1.0.10
[41] withr_2.5.0 later_1.3.0 grid_4.1.0 jsonlite_1.8.4
[45] gtable_0.3.1 lifecycle_1.0.3 DBI_1.1.3 git2r_0.30.1
[49] magrittr_2.0.3 scales_1.2.1 carData_3.0-5 cli_3.4.1
[53] stringi_1.7.8 cachem_1.0.6 farver_2.1.1 ggsignif_0.6.4
[57] fs_1.5.2 promises_1.2.0.1 pgenlibr_0.3.2 bslib_0.4.1
[61] vctrs_0.5.1 generics_0.1.3 iterators_1.0.14 tools_4.1.0
[65] glue_1.6.2 purrr_0.3.5 abind_1.4-5 processx_3.8.0
[69] fastmap_1.1.0 yaml_2.3.6 colorspace_2.0-3 rstatix_0.7.1
[73] knitr_1.41 sass_0.4.4