Simulation Results using Multiple Tissues
wesleycrouse
2023-02-01
Last updated: 2023-03-21
Checks: 7 0
Knit directory: ctwas_applied/
This reproducible R Markdown analysis was created with workflowr (version 1.7.0). The Checks tab describes the reproducibility checks that were applied when the results were created. The Past versions tab lists the development history.
Great! Since the R Markdown file has been committed to the Git repository, you know the exact version of the code that produced these results.
Great job! The global environment was empty. Objects defined in the global environment can affect the analysis in your R Markdown file in unknown ways. For reproduciblity it’s best to always run the code in an empty environment.
The command set.seed(20210726) was run prior to running
the code in the R Markdown file. Setting a seed ensures that any results
that rely on randomness, e.g. subsampling or permutations, are
reproducible.
Great job! Recording the operating system, R version, and package versions is critical for reproducibility.
Nice! There were no cached chunks for this analysis, so you can be confident that you successfully produced the results during this run.
Great job! Using relative paths to the files within your workflowr project makes it easier to run your code on other machines.
Great! You are using Git for version control. Tracking code development and connecting the code version to the results is critical for reproducibility.
The results in this page were generated with repository version 68f8393. See the Past versions tab to see a history of the changes made to the R Markdown and HTML files.
Note that you need to be careful to ensure that all relevant files for
the analysis have been committed to Git prior to generating the results
(you can use wflow_publish or
wflow_git_commit). workflowr only checks the R Markdown
file, but you know if there are other scripts or data files that it
depends on. Below is the status of the Git repository when the results
were generated:
Untracked files:
    Untracked:  gwas.RData
    Untracked:  ld_R_info.RData
    Untracked:  z_snp_pos_ebi-a-GCST004131.RData
    Untracked:  z_snp_pos_ebi-a-GCST004132.RData
    Untracked:  z_snp_pos_ebi-a-GCST004133.RData
    Untracked:  z_snp_pos_scz-2018.RData
    Untracked:  z_snp_pos_ukb-a-360.RData
    Untracked:  z_snp_pos_ukb-d-30780_irnt.RData

Unstaged changes:
    Modified:   analysis/multigroup_testing.Rmd
Note that any generated files, e.g. HTML, png, CSS, etc., are not included in this status report because it is ok for generated content to have uncommitted changes.
These are the previous versions of the repository in which changes were
made to the R Markdown (analysis/simulation_multigroup.Rmd)
and HTML (docs/simulation_multigroup.html) files. If you’ve
configured a remote Git repository (see ?wflow_git_remote),
click on the hyperlinks in the table below to view the files as they
were in that past version.
| File | Version | Author | Date | Message |
|---|---|---|---|---|
| Rmd | 68f8393 | wesleycrouse | 2023-02-10 | cleaning up plots |
| html | 68f8393 | wesleycrouse | 2023-02-10 | cleaning up plots |
| Rmd | 4e583b3 | wesleycrouse | 2023-02-07 | adding method to figure |
| html | 4e583b3 | wesleycrouse | 2023-02-07 | adding method to figure |
| Rmd | 4c8211b | wesleycrouse | 2023-02-07 | figures for all simulations |
| html | 4c8211b | wesleycrouse | 2023-02-07 | figures for all simulations |
| Rmd | e35c1e1 | wesleycrouse | 2023-02-06 | draft figure |
| html | e35c1e1 | wesleycrouse | 2023-02-06 | draft figure |
| Rmd | 9ddf086 | wesleycrouse | 2023-02-06 | adding TWAS results |
| html | 9ddf086 | wesleycrouse | 2023-02-06 | adding TWAS results |
| Rmd | 83ed361 | wesleycrouse | 2023-02-06 | adding individual tissue results and separate parameter results |
| html | c688c02 | wesleycrouse | 2023-02-04 | updating reports |
| Rmd | dc75a78 | wesleycrouse | 2023-02-02 | formating for reports |
| html | dc75a78 | wesleycrouse | 2023-02-02 | formating for reports |
| Rmd | 88f9698 | wesleycrouse | 2023-02-01 | multigroup simulation results |
| html | 88f9698 | wesleycrouse | 2023-02-01 | multigroup simulation results |
Simulation 1: Two causal tissues with equal PVE
Separate effect size parameters
For the cTWAS analysis, each tissue had its own prior inclusion parameter end effect size parameter.
results_dir <- "/project2/mstephens/causalTWAS/simulations/simulation_ctwas_rss_20220127_wc/"
runtag = "ukb-s80.45-liv_wb"
configtag <- 2

simutags <- paste(1, 1:5, sep = "-")
thin <- 0.1

sample_size <- 45000
PIP_threshold <- 0.8

results_df <- data.frame(simutag=as.character(),
                              n_causal=as.integer(),
                              n_causal_combined=as.integer(),
                              n_detected_pip=as.integer(),
                              n_detected_pip_in_causal=as.integer(),
                              n_detected_comb_pip=as.integer(),
                              n_detected_comb_pip_in_causal=as.integer(),
                              pve_snp=as.numeric(),
                              pve_weight1=as.numeric(),
                              pve_weight2=as.numeric(),
                              pve_weight3=as.numeric(),
                              prior_weight1=as.numeric(),
                              prior_weight2=as.numeric(),
                              prior_weight3=as.numeric(),
                              prior_var_snp=as.numeric(),
                              prior_var_weight1=as.numeric(),
                              prior_var_weight2=as.numeric(),
                              prior_var_weight3=as.numeric())

for (i in 1:length(simutags)){
  simutag <- simutags[i]

  #load genes with true simulated effect
  load(paste0(results_dir, runtag, "_simu", simutag, "-pheno.Rd"))
  true_genes <- unlist(sapply(1:22, function(x){phenores$batch[[x]]$id.cgene}))
  true_genes_combined <- unique(sapply(true_genes, function(x){unlist(strsplit(x, "[|]"))[1]}))

  #load cTWAS results
  ctwas_res <- data.table::fread(paste0(results_dir, runtag, "_simu", simutag, "_config", configtag, "_LDR.susieIrss.txt"))
  ctwas_gene_res <- ctwas_res[ctwas_res$type!="SNP",]

  #number of causal genes
  n_causal <- length(true_genes)
  n_causal_combined <- length(true_genes_combined)

  #number of gene+tissue combinations with cTWAS PIP > threshold
  n_ctwas_genes <- sum(ctwas_gene_res$susie_pip > PIP_threshold)

  #number of cTWAS genes that are causal
  n_causal_detected <- sum(ctwas_gene_res$id[ctwas_gene_res$susie_pip > PIP_threshold] %in% true_genes)

  #collapse gene+tissues to genes and compute combined PIP
  ctwas_gene_res$gene <- sapply(ctwas_gene_res$id, function(x){unlist(strsplit(x,"[|]"))[1]})
  ctwas_gene_res_combined <- aggregate(ctwas_gene_res$susie_pip, by=list(ctwas_gene_res$gene), FUN=sum)
  colnames(ctwas_gene_res_combined) <- c("gene", "pip_combined")

  #number of genes with combined PIP > threshold
  n_ctwas_genes_combined <- sum(ctwas_gene_res_combined$pip_combined > PIP_threshold)

  #number of cTWAS genes using combined PIP that are causal
  n_causal_detected_combined <- sum(ctwas_gene_res_combined$gene[ctwas_gene_res_combined$pip_combined > PIP_threshold] %in% true_genes_combined)

  #collect number of SNPs analyzed by cTWAS
  ctwas_res_s1 <- data.table::fread(paste0(results_dir, runtag, "_simu", simutag, "_config", configtag, "_LDR.s1.susieIrss.txt"))
  n_snps <- sum(ctwas_res_s1$type=="SNP")/thin
  rm(ctwas_res_s1)

  #load estimated parameters
  load(paste0(results_dir, runtag, "_simu", simutag, "_config", configtag, "_LDR.s2.susieIrssres.Rd"))

  #estimated group prior (all iterations)
  estimated_group_prior_all <- group_prior_rec
  estimated_group_prior_all["SNP",] <- estimated_group_prior_all["SNP",]*thin #adjust parameter to account for thin argument

  #estimated group prior variance (all iterations)
  estimated_group_prior_var_all <- group_prior_var_rec

  #set group size
  group_size <- c(table(ctwas_gene_res$type), structure(n_snps, names="SNP"))
  group_size <- group_size[rownames(estimated_group_prior_all)]

  #estimated group PVE (all iterations)
  estimated_group_pve_all <- estimated_group_prior_var_all*estimated_group_prior_all*group_size/sample_size #check PVE calculation

  results_current <- data.frame(simutag=as.character(simutag),
                                n_causal=as.integer(n_causal),
                                n_causal_combined=as.integer(n_causal_combined),
                                n_detected_pip=as.integer(n_ctwas_genes),
                                n_detected_pip_in_causal=as.integer(n_causal_detected),
                                n_detected_comb_pip=as.integer(n_ctwas_genes_combined),
                                n_detected_comb_pip_in_causal=as.integer(n_causal_detected_combined),
                                pve_snp=as.numeric(rev(estimated_group_pve_all["SNP",])[1]),
                                pve_weight1=as.numeric(rev(estimated_group_pve_all["Liver",])[1]),
                                pve_weight2=as.numeric(rev(estimated_group_pve_all["Whole_Blood",])[1]),
                                pve_weight3=as.numeric(rev(estimated_group_pve_all["Brain_Cerebellum",])[1]),
                                prior_snp=as.numeric(rev(estimated_group_prior_var_all["SNP",])[1]),
                                prior_weight1=as.numeric(rev(estimated_group_prior_all["Liver",])[1]),
                                prior_weight2=as.numeric(rev(estimated_group_prior_all["Whole_Blood",])[1]),
                                prior_weight3=as.numeric(rev(estimated_group_prior_all["Brain_Cerebellum",])[1]),
                                prior_var_snp=as.numeric(rev(estimated_group_prior_var_all["SNP",])[1]),
                                prior_var_weight1=as.numeric(rev(estimated_group_prior_var_all["Liver",])[1]),
                                prior_var_weight2=as.numeric(rev(estimated_group_prior_var_all["Whole_Blood",])[1]),
                                prior_var_weight3=as.numeric(rev(estimated_group_prior_var_all["Brain_Cerebellum",])[1]))

  results_df <- rbind(results_df, results_current)
}

#results using PIP threshold (gene+tissue)
results_df[,c("simutag", "n_causal", "n_detected_pip", "n_detected_pip_in_causal")]
simutag n_causal n_detected_pip n_detected_pip_in_causal
1 1-1 215 36 34
2 1-2 250 58 51
3 1-3 216 36 31
4 1-4 231 35 30
5 1-5 232 31 27#mean percent causal using PIP > 0.8
sum(results_df$n_detected_pip_in_causal)/sum(results_df$n_detected_pip)[1] 0.8826531#results using combined PIP threshold
results_df[,c("simutag", "n_causal_combined", "n_detected_comb_pip", "n_detected_comb_pip_in_causal")] simutag n_causal_combined n_detected_comb_pip n_detected_comb_pip_in_causal
1 1-1 214 47 45
2 1-2 247 77 69
3 1-3 216 58 49
4 1-4 231 51 42
5 1-5 230 49 42#mean percent causal using combined PIP > 0.8
sum(results_df$n_detected_comb_pip_in_causal)/sum(results_df$n_detected_comb_pip)[1] 0.8758865#prior inclusion and mean prior inclusion
results_df[,c(which(colnames(results_df)=="simutag"), setdiff(grep("prior", names(results_df)), grep("prior_var", names(results_df))))] simutag prior_snp prior_weight1 prior_weight2 prior_weight3
1 1-1 13.98029 0.01049760 0.010440150 0.001554739
2 1-2 14.32527 0.01562886 0.030946154 0.003375131
3 1-3 13.24313 0.01599995 0.011503706 0.001654758
4 1-4 12.93168 0.01632716 0.006898015 0.001867553
5 1-5 14.78867 0.01116179 0.011345179 0.004362640colMeans(results_df[,setdiff(grep("prior", names(results_df)), grep("prior_var", names(results_df)))]) prior_snp prior_weight1 prior_weight2 prior_weight3
13.853807579 0.013923071 0.014226641 0.002562964 #prior variance and mean prior variance
results_df[,c(which(colnames(results_df)=="simutag"), grep("prior_var", names(results_df)))] simutag prior_var_snp prior_var_weight1 prior_var_weight2 prior_var_weight3
1 1-1 13.98029 24.70155 14.25856 40.345898
2 1-2 14.32527 22.03369 10.92709 2.446965
3 1-3 13.24313 12.81897 14.70263 13.803416
4 1-4 12.93168 16.48358 44.99221 4.299581
5 1-5 14.78867 27.58522 23.39390 15.000354colMeans(results_df[,grep("prior_var", names(results_df))]) prior_var_snp prior_var_weight1 prior_var_weight2 prior_var_weight3
13.85381 20.72460 21.65488 15.17924 #PVE and mean PVE
results_df[,c(which(colnames(results_df)=="simutag"), grep("pve", names(results_df)))] simutag pve_snp pve_weight1 pve_weight2 pve_weight3
1 1-1 0.3839227 0.04261279 0.02702663 0.012263889
2 1-2 0.3668868 0.05659007 0.06139325 0.001614692
3 1-3 0.4037207 0.03370524 0.03070735 0.004465732
4 1-4 0.4050848 0.04422702 0.05634702 0.001569894
5 1-5 0.4118573 0.05059830 0.04818629 0.012794470colMeans(results_df[,grep("pve", names(results_df))]) pve_snp pve_weight1 pve_weight2 pve_weight3
0.394294484 0.045546683 0.044732107 0.006541735 #store results for figure
plot_df <- rbind(plot_df,
data.frame(simutag=results_df$simutag,
method="cTWAS G - Ind Var",
count=results_df$n_detected_comb_pip-results_df$n_detected_comb_pip_in_causal,
ifcausal=F))
plot_df <- rbind(plot_df,
data.frame(simutag=results_df$simutag,
method="cTWAS G - Ind Var",
count=results_df$n_detected_comb_pip_in_causal,
ifcausal=T))Individual tissue analyses
For the cTWAS analysis, each tissue was analyzed individually and the results were combined.
results_dir <- "/project2/mstephens/causalTWAS/simulations/simulation_ctwas_rss_20220127_wc/"
runtag = "ukb-s80.45-liv_wb"
configtag <- 1

simutags <- paste(1, 1:5, sep = "-")
thin <- 0.1

sample_size <- 45000
PIP_threshold <- 0.8

results_df <- data.frame(simutag=as.character(),
                         n_causal_combined=as.integer(),
                         n_detected_weight1=as.integer(),
                         n_detected_in_causal_weight1=as.integer(),
                         n_detected_weight2=as.integer(),
                         n_detected_in_causal_weight2=as.integer(),
                         n_detected_weight3=as.integer(),
                         n_detected_in_causal_weight3=as.integer(),
                         n_detected_combined=as.integer(),
                         n_detected_in_causal_combined=as.integer())

for (i in 1:length(simutags)){
  simutag <- simutags[i]

  #load genes with true simulated effect
  load(paste0(results_dir, runtag, "_simu", simutag, "-pheno.Rd"))
  true_genes <- unlist(sapply(1:22, function(x){phenores$batch[[x]]$id.cgene}))
  true_genes_combined <- unique(sapply(true_genes, function(x){unlist(strsplit(x, "[|]"))[1]}))

  #number of causal genes
  n_causal_combined <- length(true_genes_combined)

  #load cTWAS results for weight1
  ctwas_res <- data.table::fread(paste0(results_dir, runtag, "_simu", simutag, "_config", configtag, "_LDR_weight1.susieIrss.txt"))
  ctwas_gene_res <- ctwas_res[ctwas_res$type!="SNP",]

  #number of genes with cTWAS PIP > threshold in weight1
  ctwas_genes_weight1 <- ctwas_gene_res$id[ctwas_gene_res$susie_pip > PIP_threshold]
  n_ctwas_genes_weight1 <- length(ctwas_genes_weight1)
  n_causal_detected_weight1 <- sum(ctwas_genes_weight1 %in% true_genes_combined)

  #load cTWAS results for weight2
  ctwas_res <- data.table::fread(paste0(results_dir, runtag, "_simu", simutag, "_config", configtag, "_LDR_weight2.susieIrss.txt"))
  ctwas_gene_res <- ctwas_res[ctwas_res$type!="SNP",]

  #number of genes with cTWAS PIP > threshold in weight1
  ctwas_genes_weight2 <- ctwas_gene_res$id[ctwas_gene_res$susie_pip > PIP_threshold]
  n_ctwas_genes_weight2 <- length(ctwas_genes_weight2)
  n_causal_detected_weight2 <- sum(ctwas_genes_weight2 %in% true_genes_combined)

  #load cTWAS results for weight3
  ctwas_res <- data.table::fread(paste0(results_dir, runtag, "_simu", simutag, "_config", configtag, "_LDR_weight3.susieIrss.txt"))
  ctwas_gene_res <- ctwas_res[ctwas_res$type!="SNP",]

  #number of genes with cTWAS PIP > threshold in weight3
  ctwas_genes_weight3 <- ctwas_gene_res$id[ctwas_gene_res$susie_pip > PIP_threshold]
  n_ctwas_genes_weight3 <- length(ctwas_genes_weight3)
  n_causal_detected_weight3 <- sum(ctwas_genes_weight3 %in% true_genes_combined)

  #combined analysis
  ctwas_genes_combined <- unique(c(ctwas_genes_weight1, ctwas_genes_weight2, ctwas_genes_weight3))
  n_ctwas_genes_combined <- length(ctwas_genes_combined)
  n_causal_detected_combined <- sum(ctwas_genes_combined %in% true_genes_combined)

  results_current <- data.frame(simutag=as.character(simutag),
                                n_causal_combined=as.integer(n_causal_combined),
                                n_detected_weight1=as.integer(n_ctwas_genes_weight1),
                                n_detected_in_causal_weight1=as.integer(n_causal_detected_weight1),
                                n_detected_weight2=as.integer(n_ctwas_genes_weight2),
                                n_detected_in_causal_weight2=as.integer(n_causal_detected_weight2),
                                n_detected_weight3=as.integer(n_ctwas_genes_weight3),
                                n_detected_in_causal_weight3=as.integer(n_causal_detected_weight3),
                                n_detected_combined=as.integer(n_ctwas_genes_combined),
                                n_detected_in_causal_combined=as.integer(n_causal_detected_combined))

  results_df <- rbind(results_df, results_current)
}

#results using weight1
results_df[,c("simutag", colnames(results_df)[grep("weight1", colnames(results_df))])]
simutag n_detected_weight1 n_detected_in_causal_weight1
1 1-1 35 34
2 1-2 42 37
3 1-3 36 29
4 1-4 29 24
5 1-5 37 34#mean percent causal using PIP > 0.8 for weight1
sum(results_df$n_detected_in_causal_weight1)/sum(results_df$n_detected_weight1)[1] 0.8826816#results using weight2
results_df[,c("simutag", colnames(results_df)[grep("weight2", colnames(results_df))])] simutag n_detected_weight2 n_detected_in_causal_weight2
1 1-1 20 17
2 1-2 44 38
3 1-3 34 30
4 1-4 33 30
5 1-5 30 24#mean percent causal using PIP > 0.8 for weight1
sum(results_df$n_detected_in_causal_weight2)/sum(results_df$n_detected_weight2)[1] 0.863354#results using weight3
results_df[,c("simutag", colnames(results_df)[grep("weight3", colnames(results_df))])] simutag n_detected_weight3 n_detected_in_causal_weight3
1 1-1 7 6
2 1-2 9 7
3 1-3 4 3
4 1-4 7 6
5 1-5 13 10#mean percent causal using PIP > 0.8 for weight3
sum(results_df$n_detected_in_causal_weight3)/sum(results_df$n_detected_weight3)[1] 0.8#results using combined analysis
results_df[,c("simutag", colnames(results_df)[grep("combined", colnames(results_df))])] simutag n_causal_combined n_detected_combined n_detected_in_causal_combined
1 1-1 214 52 47
2 1-2 247 77 65
3 1-3 216 58 48
4 1-4 231 52 44
5 1-5 230 60 48#mean percent causal using PIP > 0.8 for weight3
sum(results_df$n_detected_in_causal_combined)/sum(results_df$n_detected_combined)[1] 0.8428094#store results for figure
plot_df <- rbind(plot_df,
data.frame(simutag=results_df$simutag,
method="cTWAS Weight1",
count=results_df$n_detected_weight1-results_df$n_detected_in_causal_weight1,
ifcausal=F))
plot_df <- rbind(plot_df,
data.frame(simutag=results_df$simutag,
method="cTWAS Weight1",
count=results_df$n_detected_in_causal_weight1,
ifcausal=T))
plot_df <- rbind(plot_df,
data.frame(simutag=results_df$simutag,
method="cTWAS Weight2",
count=results_df$n_detected_weight2-results_df$n_detected_in_causal_weight2,
ifcausal=F))
plot_df <- rbind(plot_df,
data.frame(simutag=results_df$simutag,
method="cTWAS Weight2",
count=results_df$n_detected_in_causal_weight2,
ifcausal=T))
plot_df <- rbind(plot_df,
data.frame(simutag=results_df$simutag,
method="cTWAS Weight3",
count=results_df$n_detected_weight3-results_df$n_detected_in_causal_weight3,
ifcausal=F))
plot_df <- rbind(plot_df,
data.frame(simutag=results_df$simutag,
method="cTWAS Weight3",
count=results_df$n_detected_in_causal_weight3,
ifcausal=T))
plot_df <- rbind(plot_df,
data.frame(simutag=results_df$simutag,
method="cTWAS Union",
count=results_df$n_detected_combined-results_df$n_detected_in_causal_combined,
ifcausal=F))
plot_df <- rbind(plot_df,
data.frame(simutag=results_df$simutag,
method="cTWAS Union",
count=results_df$n_detected_in_causal_combined,
ifcausal=T))Figure
For the cTWAS analysis, each tissue was analyzed individually and the results were combined.
plot_df$method <- factor(plot_df$method, levels=c("TWAS", "cTWAS G+T", "cTWAS G", "cTWAS G - Ind Var", "cTWAS Union", "cTWAS Weight1", "cTWAS Weight2", "cTWAS Weight3"))

library(ggpubr)
Loading required package: ggplot2colset = c("#ebebeb", "#fb8072")
ggbarplot(plot_df,
x = "method",
y = "count",
add = "mean_se",
fill = "ifcausal",
legend = "none",
ylab="Count",
xlab="",
palette = colset) + grids(linetype = "dashed") + theme(axis.text.x = element_text(angle = 45, vjust = 1, hjust=1))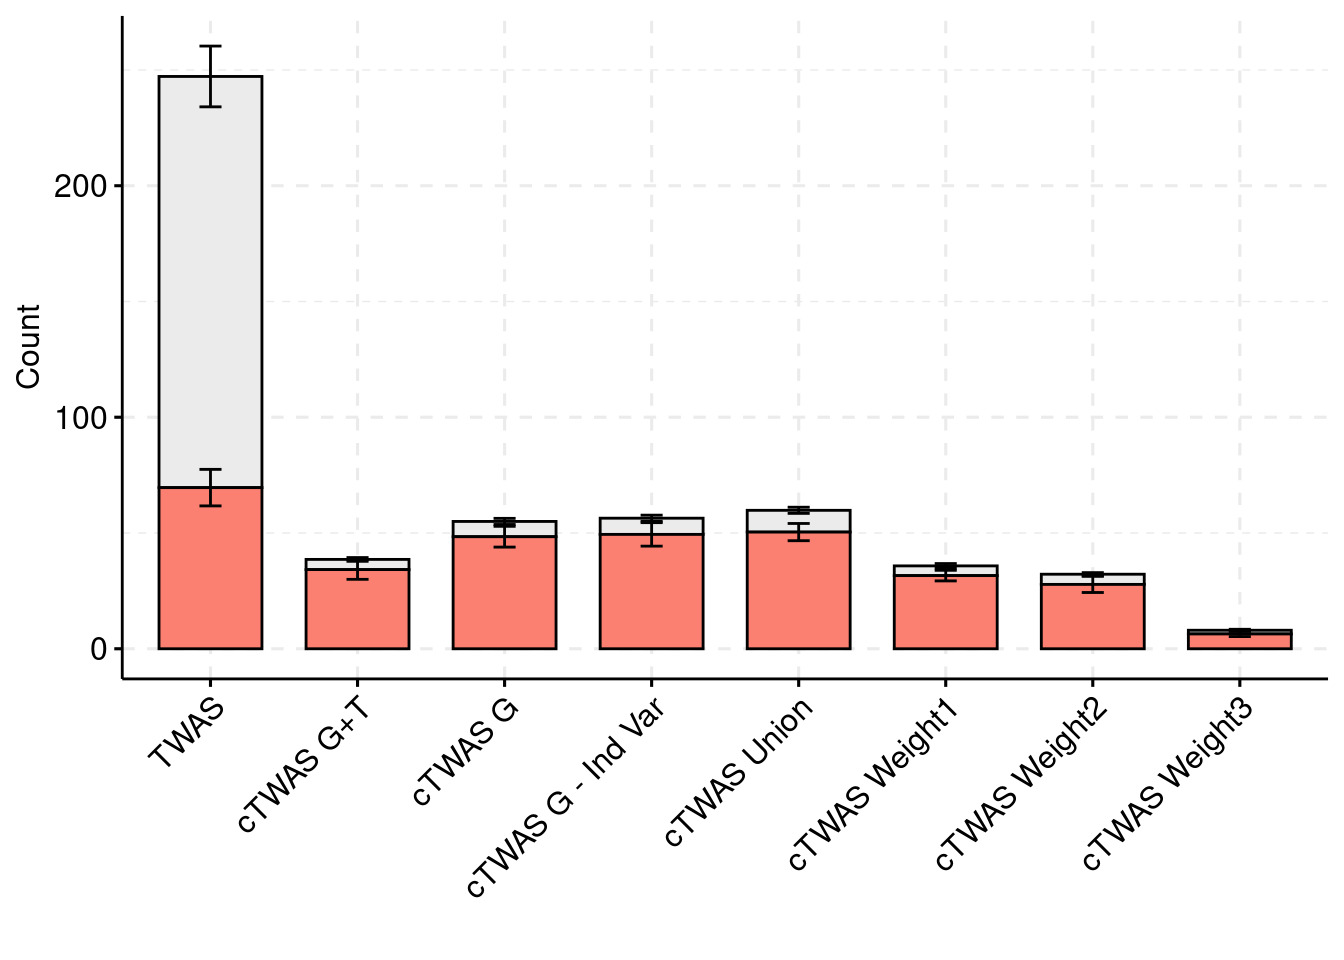
plot_df_2 <- plot_df
plot_df_2$method %in% c("TWAS", "cTWAS Union", "cTWAS Weight1", "cTWAS Weight2", "cTWAS Weight3") [1] FALSE FALSE FALSE FALSE FALSE FALSE FALSE FALSE FALSE FALSE FALSE FALSE
[13] FALSE FALSE FALSE FALSE FALSE FALSE FALSE FALSE TRUE TRUE TRUE TRUE
[25] TRUE TRUE TRUE TRUE TRUE TRUE FALSE FALSE FALSE FALSE FALSE FALSE
[37] FALSE FALSE FALSE FALSE TRUE TRUE TRUE TRUE TRUE TRUE TRUE TRUE
[49] TRUE TRUE TRUE TRUE TRUE TRUE TRUE TRUE TRUE TRUE TRUE TRUE
[61] TRUE TRUE TRUE TRUE TRUE TRUE TRUE TRUE TRUE TRUE TRUE TRUE
[73] TRUE TRUE TRUE TRUE TRUE TRUE TRUE TRUEplot_df_2$ifcausal <- as.character(plot_df_2$ifcausal+1)
plot_df_2$count[plot_df_2$method=="cTWAS G" & plot_df_2$ifcausal=="2"] <- plot_df_2$count[plot_df_2$method=="cTWAS G" & plot_df_2$ifcausal=="2"] - plot_df_2$count[plot_df_2$method=="cTWAS G+T" & plot_df_2$ifcausal=="2"]
plot_df_2 <- rbind(plot_df_2, data.frame(simutag=simutags,
method="cTWAS G",
count=plot_df_2$count[plot_df_2$method=="cTWAS G+T" & plot_df_2$ifcausal=="2"],
ifcausal="3"))
plot_df_3 <- plot_df_2
plot_df_2 <- plot_df_2[plot_df_2$method %in% c("TWAS", "cTWAS Union", "cTWAS Weight1", "cTWAS Weight2", "cTWAS Weight3"),]
plot_df_2$method <- droplevels(plot_df_2$method)
levels(plot_df_2$method) <- c("TWAS", "cTWAS Union", "cTWAS Primary", "cTWAS Secondary", "cTWAS Null")
plot_df_2$ifcausal[plot_df_2$ifcausal=="1"] <- "FP"
plot_df_2$ifcausal[plot_df_2$ifcausal=="2"] <- "TP"
colset = c("#ebebeb", "#fb8072", "#8dd3c7")
ggbarplot(plot_df_2,
x = "method",
y = "count",
add = "mean_se",
fill = "ifcausal",
legend = "right",
ylab="Count",
xlab="",
palette = colset) + grids(linetype = "dashed") + theme(axis.text.x = element_text(angle = 45, vjust = 1, hjust=1)) + guides(fill=guide_legend(title=""))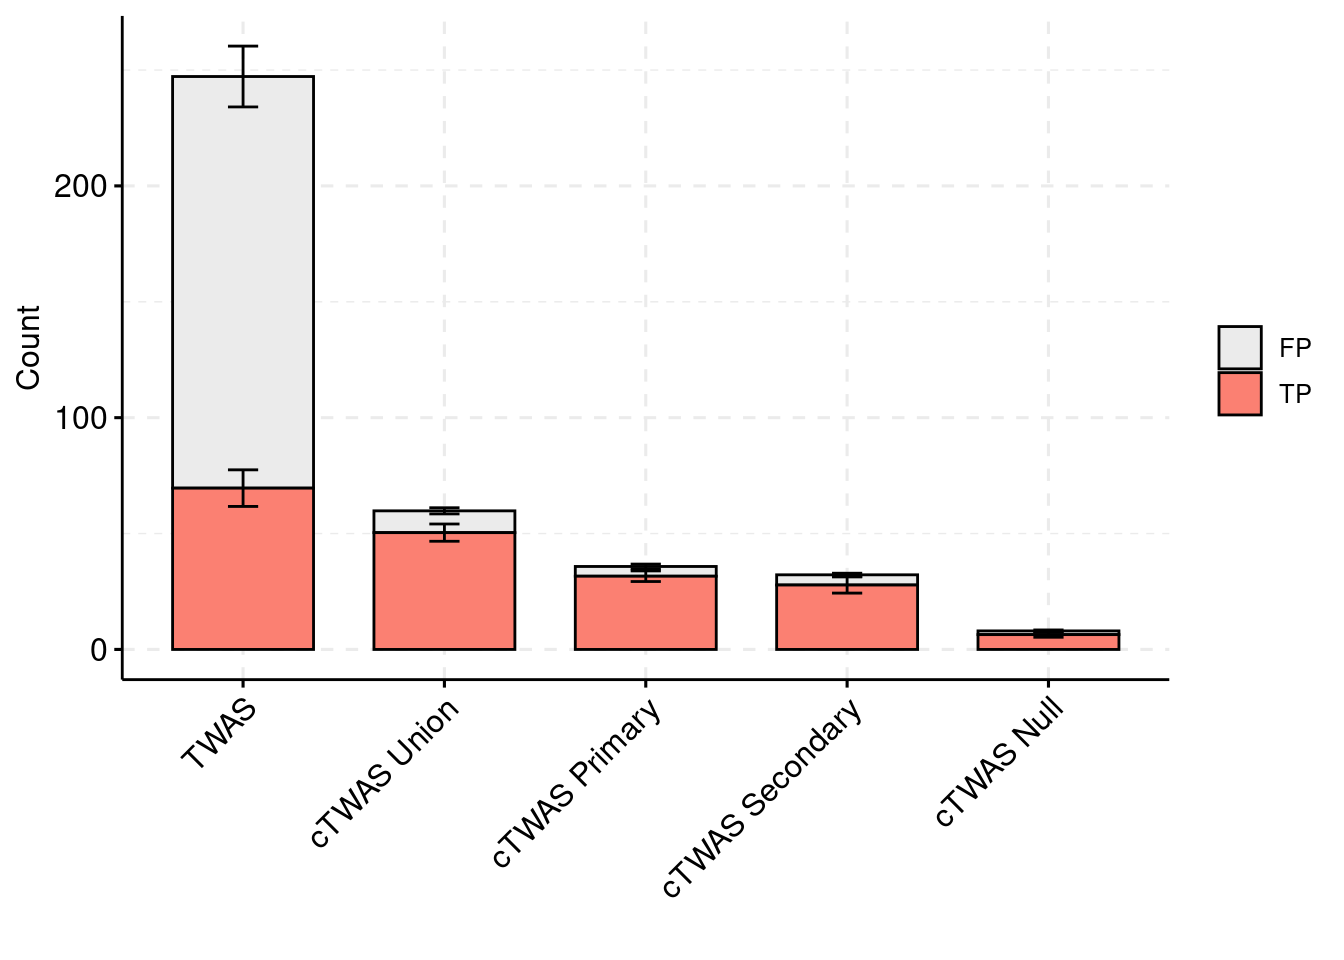
| Version | Author | Date |
|---|---|---|
| 68f8393 | wesleycrouse | 2023-02-10 |
plot_df_3 <- plot_df_3[plot_df_3$method %in% c("cTWAS G", "cTWAS Union"),]
plot_df_3$method <- droplevels(plot_df_3$method)
levels(plot_df_3$method) <- c("cTWAS Joint", "cTWAS Union")
plot_df_3$method <- relevel(plot_df_3$method, "cTWAS Union")
plot_df_3$ifcausal[plot_df_3$ifcausal=="1"] <- "FP"
plot_df_3$ifcausal[plot_df_3$ifcausal=="2"] <- "TP"
plot_df_3$ifcausal[plot_df_3$ifcausal=="3"] <- "TP and Tissue Identified\nby Joint Analysis"
ggbarplot(plot_df_3,
x = "method",
y = "count",
add = "mean_se",
fill = "ifcausal",
legend = "right",
ylab="Count",
xlab="",
palette = colset) + grids(linetype = "dashed") + theme(axis.text.x = element_text(angle = 45, vjust = 1, hjust=1)) + guides(fill=guide_legend(title=""))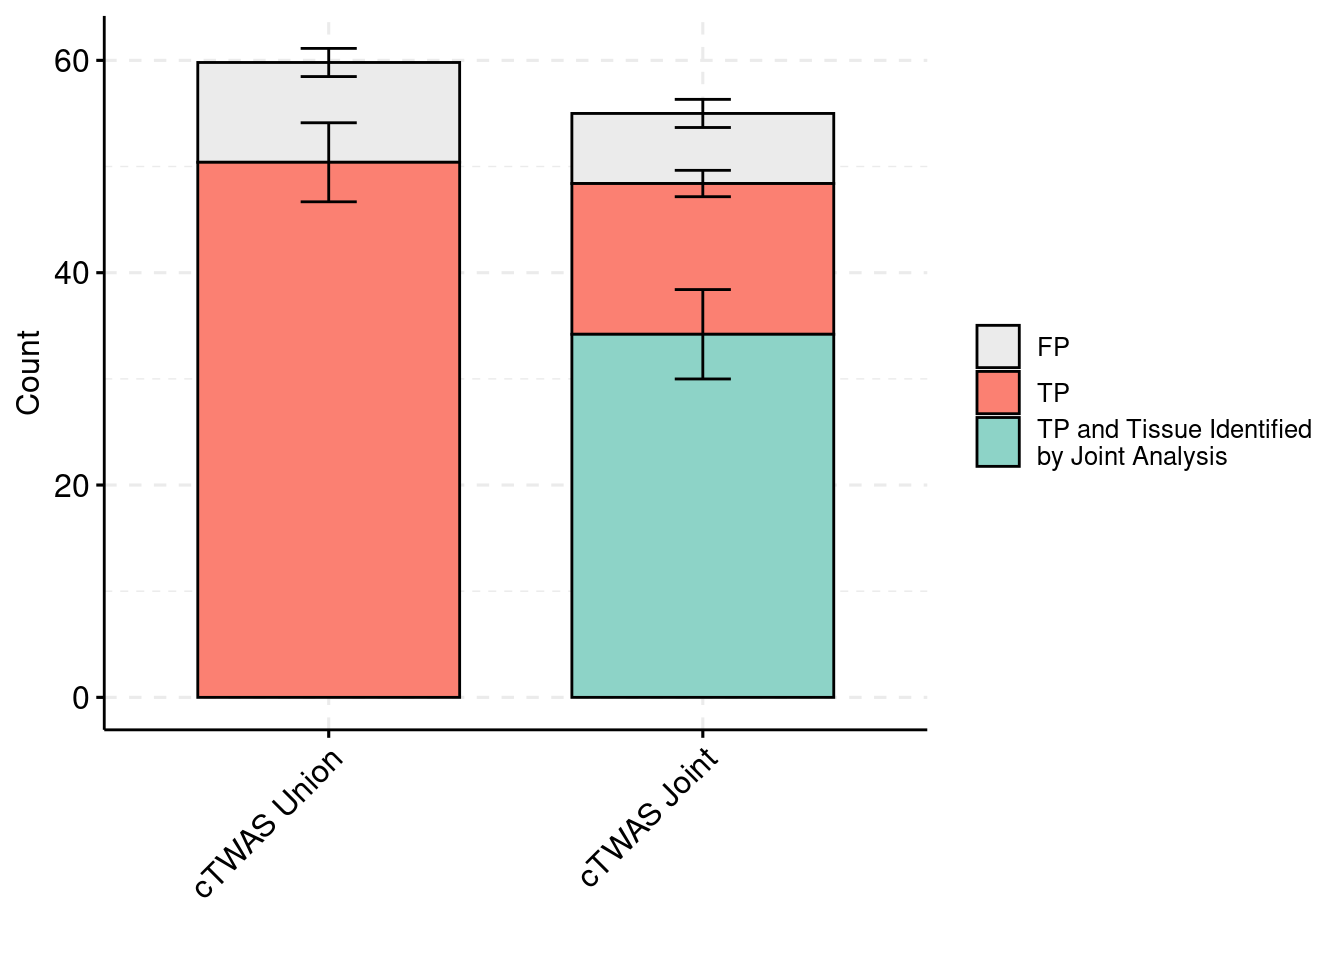
| Version | Author | Date |
|---|---|---|
| 68f8393 | wesleycrouse | 2023-02-10 |
Simulation 2: Two causal tissues with unequal PVE
Separate effect size parameters
For the cTWAS analysis, each tissue had its own prior inclusion parameter and effect size parameter.
results_dir <- "/project2/mstephens/causalTWAS/simulations/simulation_ctwas_rss_20220127_wc/"
runtag = "ukb-s80.45-liv_wb"
configtag <- 2
simutags <- paste(2, 1:5, sep = "-")
thin <- 0.1
sample_size <- 45000
PIP_threshold <- 0.8
results_df <- data.frame(simutag=as.character(),
n_causal=as.integer(),
n_causal_combined=as.integer(),
n_detected_pip=as.integer(),
n_detected_pip_in_causal=as.integer(),
n_detected_comb_pip=as.integer(),
n_detected_comb_pip_in_causal=as.integer(),
pve_snp=as.numeric(),
pve_weight1=as.numeric(),
pve_weight2=as.numeric(),
pve_weight3=as.numeric(),
prior_weight1=as.numeric(),
prior_weight2=as.numeric(),
prior_weight3=as.numeric(),
prior_var_snp=as.numeric(),
prior_var_weight1=as.numeric(),
prior_var_weight2=as.numeric(),
prior_var_weight3=as.numeric())
for (i in 1:length(simutags)){
simutag <- simutags[i]
#load genes with true simulated effect
load(paste0(results_dir, runtag, "_simu", simutag, "-pheno.Rd"))
true_genes <- unlist(sapply(1:22, function(x){phenores$batch[[x]]$id.cgene}))
true_genes_combined <- unique(sapply(true_genes, function(x){unlist(strsplit(x, "[|]"))[1]}))
#load cTWAS results
ctwas_res <- data.table::fread(paste0(results_dir, runtag, "_simu", simutag, "_config", configtag, "_LDR.susieIrss.txt"))
ctwas_gene_res <- ctwas_res[ctwas_res$type!="SNP",]
#number of causal genes
n_causal <- length(true_genes)
n_causal_combined <- length(true_genes_combined)
#number of gene+tissue combinations with cTWAS PIP > threshold
n_ctwas_genes <- sum(ctwas_gene_res$susie_pip > PIP_threshold)
#number of cTWAS genes that are causal
n_causal_detected <- sum(ctwas_gene_res$id[ctwas_gene_res$susie_pip > PIP_threshold] %in% true_genes)
#collapse gene+tissues to genes and compute combined PIP
ctwas_gene_res$gene <- sapply(ctwas_gene_res$id, function(x){unlist(strsplit(x,"[|]"))[1]})
ctwas_gene_res_combined <- aggregate(ctwas_gene_res$susie_pip, by=list(ctwas_gene_res$gene), FUN=sum)
colnames(ctwas_gene_res_combined) <- c("gene", "pip_combined")
#number of genes with combined PIP > threshold
n_ctwas_genes_combined <- sum(ctwas_gene_res_combined$pip_combined > PIP_threshold)
#number of cTWAS genes using combined PIP that are causal
n_causal_detected_combined <- sum(ctwas_gene_res_combined$gene[ctwas_gene_res_combined$pip_combined > PIP_threshold] %in% true_genes_combined)
#collect number of SNPs analyzed by cTWAS
ctwas_res_s1 <- data.table::fread(paste0(results_dir, runtag, "_simu", simutag, "_config", configtag, "_LDR.s1.susieIrss.txt"))
n_snps <- sum(ctwas_res_s1$type=="SNP")/thin
rm(ctwas_res_s1)
#load estimated parameters
load(paste0(results_dir, runtag, "_simu", simutag, "_config", configtag, "_LDR.s2.susieIrssres.Rd"))
#estimated group prior (all iterations)
estimated_group_prior_all <- group_prior_rec
estimated_group_prior_all["SNP",] <- estimated_group_prior_all["SNP",]*thin #adjust parameter to account for thin argument
#estimated group prior variance (all iterations)
estimated_group_prior_var_all <- group_prior_var_rec
#set group size
group_size <- c(table(ctwas_gene_res$type), structure(n_snps, names="SNP"))
group_size <- group_size[rownames(estimated_group_prior_all)]
#estimated group PVE (all iterations)
estimated_group_pve_all <- estimated_group_prior_var_all*estimated_group_prior_all*group_size/sample_size #check PVE calculation
results_current <- data.frame(simutag=as.character(simutag),
n_causal=as.integer(n_causal),
n_causal_combined=as.integer(n_causal_combined),
n_detected_pip=as.integer(n_ctwas_genes),
n_detected_pip_in_causal=as.integer(n_causal_detected),
n_detected_comb_pip=as.integer(n_ctwas_genes_combined),
n_detected_comb_pip_in_causal=as.integer(n_causal_detected_combined),
pve_snp=as.numeric(rev(estimated_group_pve_all["SNP",])[1]),
pve_weight1=as.numeric(rev(estimated_group_pve_all["Liver",])[1]),
pve_weight2=as.numeric(rev(estimated_group_pve_all["Whole_Blood",])[1]),
pve_weight3=as.numeric(rev(estimated_group_pve_all["Brain_Cerebellum",])[1]),
prior_snp=as.numeric(rev(estimated_group_prior_var_all["SNP",])[1]),
prior_weight1=as.numeric(rev(estimated_group_prior_all["Liver",])[1]),
prior_weight2=as.numeric(rev(estimated_group_prior_all["Whole_Blood",])[1]),
prior_weight3=as.numeric(rev(estimated_group_prior_all["Brain_Cerebellum",])[1]),
prior_var_snp=as.numeric(rev(estimated_group_prior_var_all["SNP",])[1]),
prior_var_weight1=as.numeric(rev(estimated_group_prior_var_all["Liver",])[1]),
prior_var_weight2=as.numeric(rev(estimated_group_prior_var_all["Whole_Blood",])[1]),
prior_var_weight3=as.numeric(rev(estimated_group_prior_var_all["Brain_Cerebellum",])[1]))
results_df <- rbind(results_df, results_current)
}
#results using PIP threshold (gene+tissue)
results_df[,c("simutag", "n_causal", "n_detected_pip", "n_detected_pip_in_causal")] simutag n_causal n_detected_pip n_detected_pip_in_causal
1 2-1 215 25 24
2 2-2 250 34 30
3 2-3 216 28 20
4 2-4 231 23 18
5 2-5 232 26 23#mean percent causal using PIP > 0.8
sum(results_df$n_detected_pip_in_causal)/sum(results_df$n_detected_pip)[1] 0.8455882#results using combined PIP threshold
results_df[,c("simutag", "n_causal_combined", "n_detected_comb_pip", "n_detected_comb_pip_in_causal")] simutag n_causal_combined n_detected_comb_pip n_detected_comb_pip_in_causal
1 2-1 214 34 32
2 2-2 247 53 48
3 2-3 216 36 28
4 2-4 231 34 29
5 2-5 230 39 33#mean percent causal using combined PIP > 0.8
sum(results_df$n_detected_comb_pip_in_causal)/sum(results_df$n_detected_comb_pip)[1] 0.8673469#prior inclusion and mean prior inclusion
results_df[,c(which(colnames(results_df)=="simutag"), setdiff(grep("prior", names(results_df)), grep("prior_var", names(results_df))))] simutag prior_snp prior_weight1 prior_weight2 prior_weight3
1 2-1 14.01892 0.01155677 0.003544356 0.001712023
2 2-2 15.39150 0.01602250 0.029919898 0.003678954
3 2-3 13.17307 0.01706519 0.008016523 0.004806268
4 2-4 12.77783 0.01534327 0.004428347 0.002359614
5 2-5 14.68214 0.01146830 0.005685229 0.006944209colMeans(results_df[,setdiff(grep("prior", names(results_df)), grep("prior_var", names(results_df)))]) prior_snp prior_weight1 prior_weight2 prior_weight3
14.008693050 0.014291206 0.010318871 0.003900214 #prior variance and mean prior variance
results_df[,c(which(colnames(results_df)=="simutag"), grep("prior_var", names(results_df)))] simutag prior_var_snp prior_var_weight1 prior_var_weight2 prior_var_weight3
1 2-1 14.01892 22.91043 12.549905 35.390725
2 2-2 15.39150 20.72263 4.463574 3.079414
3 2-3 13.17307 13.49436 4.000902 7.377954
4 2-4 12.77783 17.73800 48.122109 3.573693
5 2-5 14.68214 28.80506 22.130566 8.966683colMeans(results_df[,grep("prior_var", names(results_df))]) prior_var_snp prior_var_weight1 prior_var_weight2 prior_var_weight3
14.00869 20.73410 18.25341 11.67769 #PVE and mean PVE
results_df[,c(which(colnames(results_df)=="simutag"), grep("pve", names(results_df)))] simutag pve_snp pve_weight1 pve_weight2 pve_weight3
1 2-1 0.3861511 0.04351062 0.008075834 0.011845968
2 2-2 0.3811809 0.05456331 0.024246684 0.002214949
3 2-3 0.4025341 0.03784332 0.005823090 0.006932907
4 2-4 0.4041817 0.04472479 0.038689741 0.001648655
5 2-5 0.4129643 0.05428671 0.022842838 0.012173797colMeans(results_df[,grep("pve", names(results_df))]) pve_snp pve_weight1 pve_weight2 pve_weight3
0.397402438 0.046985749 0.019935637 0.006963255 #store results for figure
plot_df <- rbind(plot_df,
data.frame(simutag=results_df$simutag,
method="cTWAS G - Ind Var",
count=results_df$n_detected_comb_pip-results_df$n_detected_comb_pip_in_causal,
ifcausal=F))
plot_df <- rbind(plot_df,
data.frame(simutag=results_df$simutag,
method="cTWAS G - Ind Var",
count=results_df$n_detected_comb_pip_in_causal,
ifcausal=T))Individual tissue analyses
For the cTWAS analysis, each tissue was analyzed individually and the results were combined.
results_dir <- "/project2/mstephens/causalTWAS/simulations/simulation_ctwas_rss_20220127_wc/"
runtag = "ukb-s80.45-liv_wb"
configtag <- 1
simutags <- paste(2, 1:5, sep = "-")
thin <- 0.1
sample_size <- 45000
PIP_threshold <- 0.8
results_df <- data.frame(simutag=as.character(),
n_causal_combined=as.integer(),
n_detected_weight1=as.integer(),
n_detected_in_causal_weight1=as.integer(),
n_detected_weight2=as.integer(),
n_detected_in_causal_weight2=as.integer(),
n_detected_weight3=as.integer(),
n_detected_in_causal_weight3=as.integer(),
n_detected_combined=as.integer(),
n_detected_in_causal_combined=as.integer())
for (i in 1:length(simutags)){
simutag <- simutags[i]
#load genes with true simulated effect
load(paste0(results_dir, runtag, "_simu", simutag, "-pheno.Rd"))
true_genes <- unlist(sapply(1:22, function(x){phenores$batch[[x]]$id.cgene}))
true_genes_combined <- unique(sapply(true_genes, function(x){unlist(strsplit(x, "[|]"))[1]}))
#number of causal genes
n_causal_combined <- length(true_genes_combined)
#load cTWAS results for weight1
ctwas_res <- data.table::fread(paste0(results_dir, runtag, "_simu", simutag, "_config", configtag, "_LDR_weight1.susieIrss.txt"))
ctwas_gene_res <- ctwas_res[ctwas_res$type!="SNP",]
#number of genes with cTWAS PIP > threshold in weight1
ctwas_genes_weight1 <- ctwas_gene_res$id[ctwas_gene_res$susie_pip > PIP_threshold]
n_ctwas_genes_weight1 <- length(ctwas_genes_weight1)
n_causal_detected_weight1 <- sum(ctwas_genes_weight1 %in% true_genes_combined)
#load cTWAS results for weight2
ctwas_res <- data.table::fread(paste0(results_dir, runtag, "_simu", simutag, "_config", configtag, "_LDR_weight2.susieIrss.txt"))
ctwas_gene_res <- ctwas_res[ctwas_res$type!="SNP",]
#number of genes with cTWAS PIP > threshold in weight1
ctwas_genes_weight2 <- ctwas_gene_res$id[ctwas_gene_res$susie_pip > PIP_threshold]
n_ctwas_genes_weight2 <- length(ctwas_genes_weight2)
n_causal_detected_weight2 <- sum(ctwas_genes_weight2 %in% true_genes_combined)
#load cTWAS results for weight3
ctwas_res <- data.table::fread(paste0(results_dir, runtag, "_simu", simutag, "_config", configtag, "_LDR_weight3.susieIrss.txt"))
ctwas_gene_res <- ctwas_res[ctwas_res$type!="SNP",]
#number of genes with cTWAS PIP > threshold in weight3
ctwas_genes_weight3 <- ctwas_gene_res$id[ctwas_gene_res$susie_pip > PIP_threshold]
n_ctwas_genes_weight3 <- length(ctwas_genes_weight3)
n_causal_detected_weight3 <- sum(ctwas_genes_weight3 %in% true_genes_combined)
#combined analysis
ctwas_genes_combined <- unique(c(ctwas_genes_weight1, ctwas_genes_weight2, ctwas_genes_weight3))
n_ctwas_genes_combined <- length(ctwas_genes_combined)
n_causal_detected_combined <- sum(ctwas_genes_combined %in% true_genes_combined)
results_current <- data.frame(simutag=as.character(simutag),
n_causal_combined=as.integer(n_causal_combined),
n_detected_weight1=as.integer(n_ctwas_genes_weight1),
n_detected_in_causal_weight1=as.integer(n_causal_detected_weight1),
n_detected_weight2=as.integer(n_ctwas_genes_weight2),
n_detected_in_causal_weight2=as.integer(n_causal_detected_weight2),
n_detected_weight3=as.integer(n_ctwas_genes_weight3),
n_detected_in_causal_weight3=as.integer(n_causal_detected_weight3),
n_detected_combined=as.integer(n_ctwas_genes_combined),
n_detected_in_causal_combined=as.integer(n_causal_detected_combined))
results_df <- rbind(results_df, results_current)
}
#results using weight1
results_df[,c("simutag", colnames(results_df)[grep("weight1", colnames(results_df))])] simutag n_detected_weight1 n_detected_in_causal_weight1
1 2-1 33 32
2 2-2 38 34
3 2-3 32 24
4 2-4 25 21
5 2-5 36 34#mean percent causal using PIP > 0.8 for weight1
sum(results_df$n_detected_in_causal_weight1)/sum(results_df$n_detected_weight1)[1] 0.8841463#results using weight2
results_df[,c("simutag", colnames(results_df)[grep("weight2", colnames(results_df))])] simutag n_detected_weight2 n_detected_in_causal_weight2
1 2-1 5 3
2 2-2 19 16
3 2-3 13 12
4 2-4 19 16
5 2-5 15 10#mean percent causal using PIP > 0.8 for weight1
sum(results_df$n_detected_in_causal_weight2)/sum(results_df$n_detected_weight2)[1] 0.8028169#results using weight3
results_df[,c("simutag", colnames(results_df)[grep("weight3", colnames(results_df))])] simutag n_detected_weight3 n_detected_in_causal_weight3
1 2-1 4 4
2 2-2 7 6
3 2-3 3 2
4 2-4 5 4
5 2-5 9 7#mean percent causal using PIP > 0.8 for weight3
sum(results_df$n_detected_in_causal_weight3)/sum(results_df$n_detected_weight3)[1] 0.8214286#results using combined analysis
results_df[,c("simutag", colnames(results_df)[grep("combined", colnames(results_df))])] simutag n_causal_combined n_detected_combined n_detected_in_causal_combined
1 2-1 214 37 34
2 2-2 247 50 43
3 2-3 216 38 30
4 2-4 231 39 32
5 2-5 230 47 38#mean percent causal using PIP > 0.8 for weight3
sum(results_df$n_detected_in_causal_combined)/sum(results_df$n_detected_combined)[1] 0.8388626#store results for figure
plot_df <- rbind(plot_df,
data.frame(simutag=results_df$simutag,
method="cTWAS Weight1",
count=results_df$n_detected_weight1-results_df$n_detected_in_causal_weight1,
ifcausal=F))
plot_df <- rbind(plot_df,
data.frame(simutag=results_df$simutag,
method="cTWAS Weight1",
count=results_df$n_detected_in_causal_weight1,
ifcausal=T))
plot_df <- rbind(plot_df,
data.frame(simutag=results_df$simutag,
method="cTWAS Weight2",
count=results_df$n_detected_weight2-results_df$n_detected_in_causal_weight2,
ifcausal=F))
plot_df <- rbind(plot_df,
data.frame(simutag=results_df$simutag,
method="cTWAS Weight2",
count=results_df$n_detected_in_causal_weight2,
ifcausal=T))
plot_df <- rbind(plot_df,
data.frame(simutag=results_df$simutag,
method="cTWAS Weight3",
count=results_df$n_detected_weight3-results_df$n_detected_in_causal_weight3,
ifcausal=F))
plot_df <- rbind(plot_df,
data.frame(simutag=results_df$simutag,
method="cTWAS Weight3",
count=results_df$n_detected_in_causal_weight3,
ifcausal=T))
plot_df <- rbind(plot_df,
data.frame(simutag=results_df$simutag,
method="cTWAS Union",
count=results_df$n_detected_combined-results_df$n_detected_in_causal_combined,
ifcausal=F))
plot_df <- rbind(plot_df,
data.frame(simutag=results_df$simutag,
method="cTWAS Union",
count=results_df$n_detected_in_causal_combined,
ifcausal=T))Figure
For the cTWAS analysis, each tissue was analyzed individually and the results were combined.
plot_df$method <- factor(plot_df$method, levels=c("TWAS", "cTWAS G+T", "cTWAS G", "cTWAS G - Ind Var", "cTWAS Union", "cTWAS Weight1", "cTWAS Weight2", "cTWAS Weight3"))
library(ggpubr)
colset = c("#ebebeb", "#fb8072")

ggbarplot(plot_df,
          x = "method",
          y = "count",
          add = "mean_se",
          fill = "ifcausal",
          legend = "none",
          ylab="Count",
          xlab="",
          palette = colset) + grids(linetype = "dashed") + theme(axis.text.x = element_text(angle = 45, vjust = 1, hjust=1))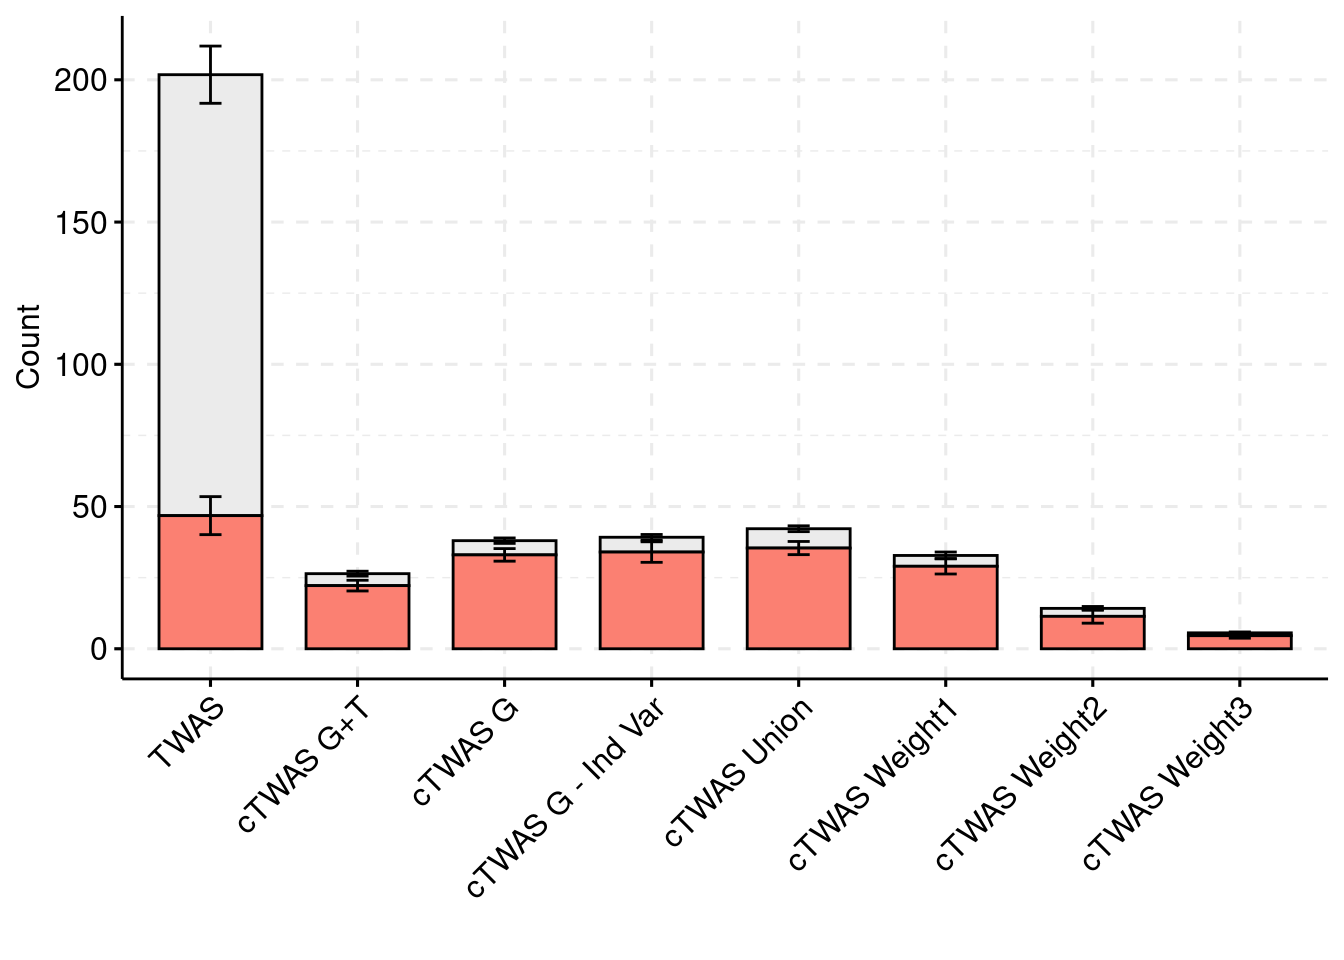
| Version | Author | Date |
|---|---|---|
| 68f8393 | wesleycrouse | 2023-02-10 |
plot_df_2 <- plot_df

plot_df_2$method %in% c("TWAS", "cTWAS Union", "cTWAS Weight1", "cTWAS Weight2", "cTWAS Weight3")
[1] FALSE FALSE FALSE FALSE FALSE FALSE FALSE FALSE FALSE FALSE FALSE FALSE
[13] FALSE FALSE FALSE FALSE FALSE FALSE FALSE FALSE TRUE TRUE TRUE TRUE
[25] TRUE TRUE TRUE TRUE TRUE TRUE FALSE FALSE FALSE FALSE FALSE FALSE
[37] FALSE FALSE FALSE FALSE TRUE TRUE TRUE TRUE TRUE TRUE TRUE TRUE
[49] TRUE TRUE TRUE TRUE TRUE TRUE TRUE TRUE TRUE TRUE TRUE TRUE
[61] TRUE TRUE TRUE TRUE TRUE TRUE TRUE TRUE TRUE TRUE TRUE TRUE
[73] TRUE TRUE TRUE TRUE TRUE TRUE TRUE TRUEplot_df_2$ifcausal <- as.character(plot_df_2$ifcausal+1)
plot_df_2$count[plot_df_2$method=="cTWAS G" & plot_df_2$ifcausal=="2"] <- plot_df_2$count[plot_df_2$method=="cTWAS G" & plot_df_2$ifcausal=="2"] - plot_df_2$count[plot_df_2$method=="cTWAS G+T" & plot_df_2$ifcausal=="2"]
plot_df_2 <- rbind(plot_df_2, data.frame(simutag=simutags,
method="cTWAS G",
count=plot_df_2$count[plot_df_2$method=="cTWAS G+T" & plot_df_2$ifcausal=="2"],
ifcausal="3"))
plot_df_3 <- plot_df_2
plot_df_2 <- plot_df_2[plot_df_2$method %in% c("TWAS", "cTWAS Union", "cTWAS Weight1", "cTWAS Weight2", "cTWAS Weight3"),]
plot_df_2$method <- droplevels(plot_df_2$method)
levels(plot_df_2$method) <- c("TWAS", "cTWAS Union", "cTWAS Primary", "cTWAS Secondary", "cTWAS Null")
plot_df_2$ifcausal[plot_df_2$ifcausal=="1"] <- "FP"
plot_df_2$ifcausal[plot_df_2$ifcausal=="2"] <- "TP"
colset = c("#ebebeb", "#fb8072", "#8dd3c7")
ggbarplot(plot_df_2,
x = "method",
y = "count",
add = "mean_se",
fill = "ifcausal",
legend = "right",
ylab="Count",
xlab="",
palette = colset) + grids(linetype = "dashed") + theme(axis.text.x = element_text(angle = 45, vjust = 1, hjust=1)) + guides(fill=guide_legend(title=""))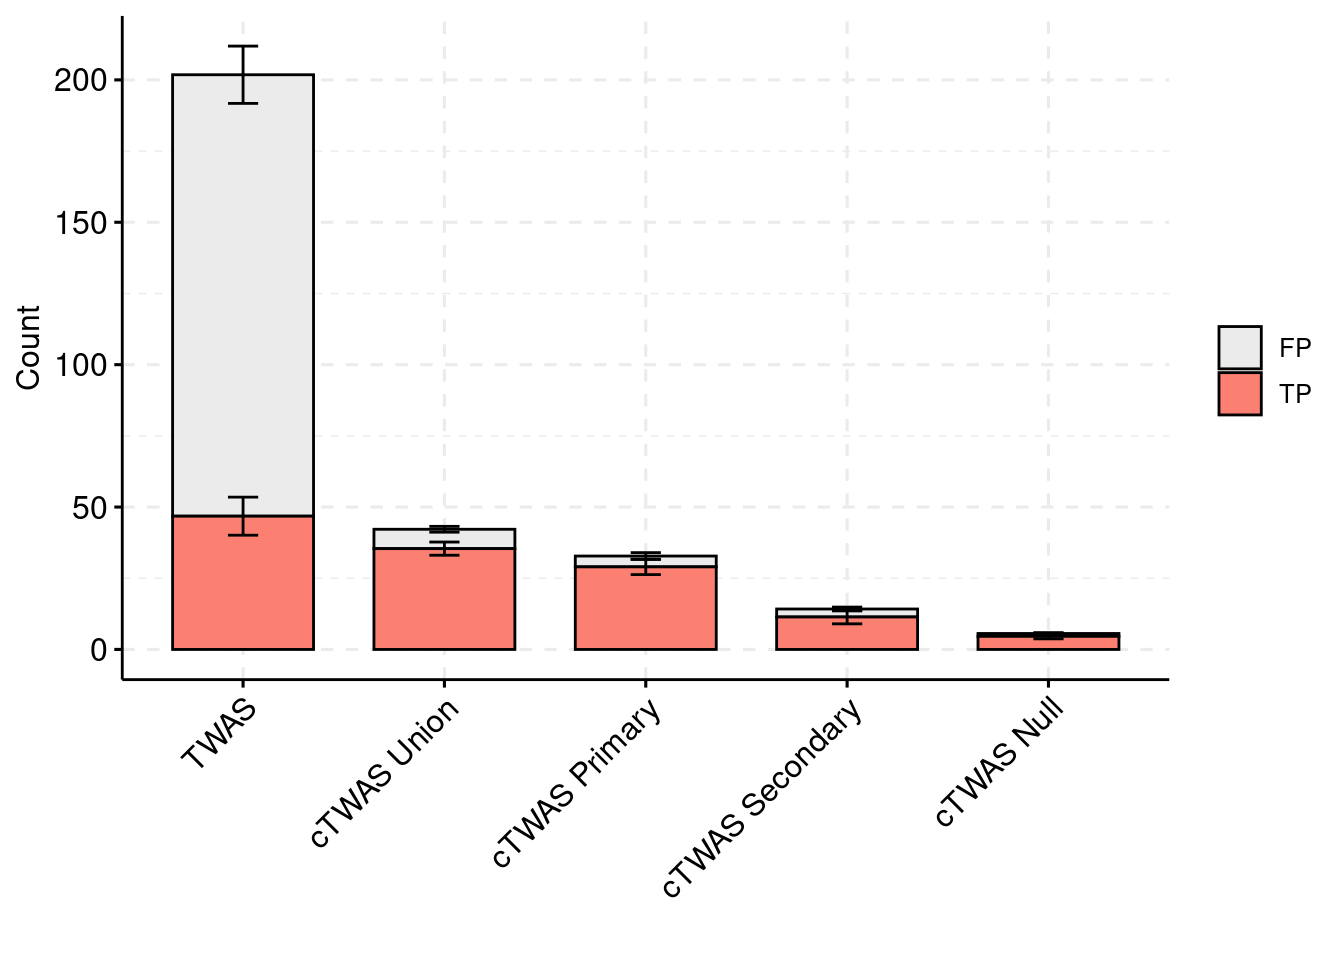
| Version | Author | Date |
|---|---|---|
| 68f8393 | wesleycrouse | 2023-02-10 |
plot_df_3 <- plot_df_3[plot_df_3$method %in% c("cTWAS G", "cTWAS Union"),]
plot_df_3$method <- droplevels(plot_df_3$method)
levels(plot_df_3$method) <- c("cTWAS Joint", "cTWAS Union")

plot_df_3$method <- relevel(plot_df_3$method, "cTWAS Union")

plot_df_3$ifcausal[plot_df_3$ifcausal=="1"] <- "FP"
plot_df_3$ifcausal[plot_df_3$ifcausal=="2"] <- "TP"
plot_df_3$ifcausal[plot_df_3$ifcausal=="3"] <- "TP and Tissue Identified\nby Joint Analysis"

ggbarplot(plot_df_3,
          x = "method",
          y = "count",
          add = "mean_se",
          fill = "ifcausal",
          legend = "right",
          ylab="Count",
          xlab="",
          palette = colset) + grids(linetype = "dashed") + theme(axis.text.x = element_text(angle = 45, vjust = 1, hjust=1)) + guides(fill=guide_legend(title=""))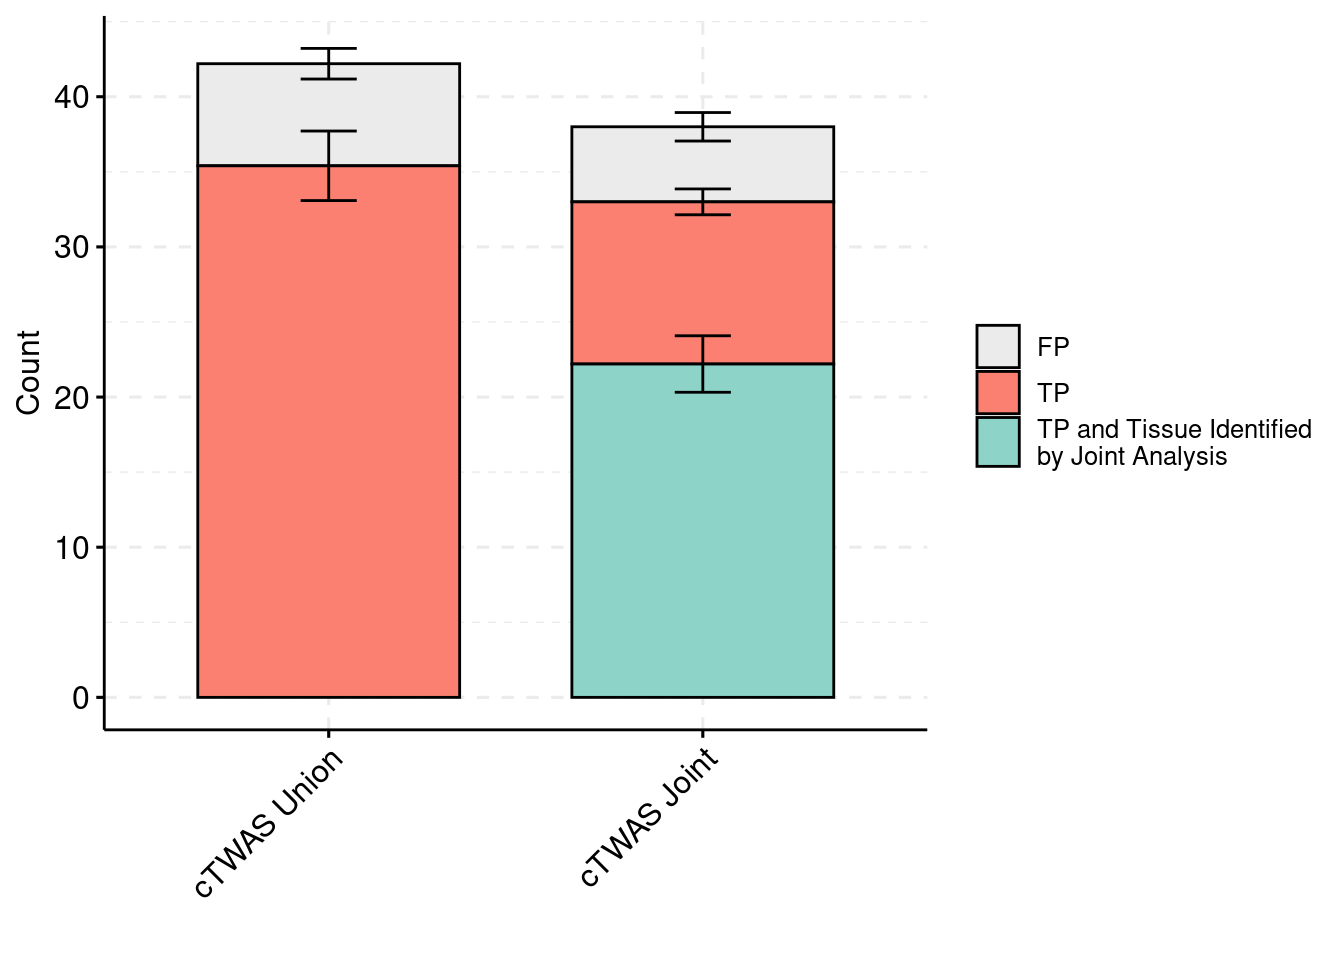
| Version | Author | Date |
|---|---|---|
| 68f8393 | wesleycrouse | 2023-02-10 |
Simulation 3: One causal tissue
Separate effect size parameters
For the cTWAS analysis, each tissue had its own prior inclusion parameter and effect size parameter.
results_dir <- "/project2/mstephens/causalTWAS/simulations/simulation_ctwas_rss_20220127_wc/"
runtag = "ukb-s80.45-liv_wb"
configtag <- 2
simutags <- paste(3, 1:5, sep = "-")
thin <- 0.1
sample_size <- 45000
PIP_threshold <- 0.8
results_df <- data.frame(simutag=as.character(),
n_causal=as.integer(),
n_causal_combined=as.integer(),
n_detected_pip=as.integer(),
n_detected_pip_in_causal=as.integer(),
n_detected_comb_pip=as.integer(),
n_detected_comb_pip_in_causal=as.integer(),
pve_snp=as.numeric(),
pve_weight1=as.numeric(),
pve_weight2=as.numeric(),
pve_weight3=as.numeric(),
prior_weight1=as.numeric(),
prior_weight2=as.numeric(),
prior_weight3=as.numeric(),
prior_var_snp=as.numeric(),
prior_var_weight1=as.numeric(),
prior_var_weight2=as.numeric(),
prior_var_weight3=as.numeric())
for (i in 1:length(simutags)){
simutag <- simutags[i]
#load genes with true simulated effect
load(paste0(results_dir, runtag, "_simu", simutag, "-pheno.Rd"))
true_genes <- unlist(sapply(1:22, function(x){phenores$batch[[x]]$id.cgene}))
true_genes_combined <- unique(sapply(true_genes, function(x){unlist(strsplit(x, "[|]"))[1]}))
#load cTWAS results
ctwas_res <- data.table::fread(paste0(results_dir, runtag, "_simu", simutag, "_config", configtag, "_LDR.susieIrss.txt"))
ctwas_gene_res <- ctwas_res[ctwas_res$type!="SNP",]
#number of causal genes
n_causal <- length(true_genes)
n_causal_combined <- length(true_genes_combined)
#number of gene+tissue combinations with cTWAS PIP > threshold
n_ctwas_genes <- sum(ctwas_gene_res$susie_pip > PIP_threshold)
#number of cTWAS genes that are causal
n_causal_detected <- sum(ctwas_gene_res$id[ctwas_gene_res$susie_pip > PIP_threshold] %in% true_genes)
#collapse gene+tissues to genes and compute combined PIP
ctwas_gene_res$gene <- sapply(ctwas_gene_res$id, function(x){unlist(strsplit(x,"[|]"))[1]})
ctwas_gene_res_combined <- aggregate(ctwas_gene_res$susie_pip, by=list(ctwas_gene_res$gene), FUN=sum)
colnames(ctwas_gene_res_combined) <- c("gene", "pip_combined")
#number of genes with combined PIP > threshold
n_ctwas_genes_combined <- sum(ctwas_gene_res_combined$pip_combined > PIP_threshold)
#number of cTWAS genes using combined PIP that are causal
n_causal_detected_combined <- sum(ctwas_gene_res_combined$gene[ctwas_gene_res_combined$pip_combined > PIP_threshold] %in% true_genes_combined)
#collect number of SNPs analyzed by cTWAS
ctwas_res_s1 <- data.table::fread(paste0(results_dir, runtag, "_simu", simutag, "_config", configtag, "_LDR.s1.susieIrss.txt"))
n_snps <- sum(ctwas_res_s1$type=="SNP")/thin
rm(ctwas_res_s1)
#load estimated parameters
load(paste0(results_dir, runtag, "_simu", simutag, "_config", configtag, "_LDR.s2.susieIrssres.Rd"))
#estimated group prior (all iterations)
estimated_group_prior_all <- group_prior_rec
estimated_group_prior_all["SNP",] <- estimated_group_prior_all["SNP",]*thin #adjust parameter to account for thin argument
#estimated group prior variance (all iterations)
estimated_group_prior_var_all <- group_prior_var_rec
#set group size
group_size <- c(table(ctwas_gene_res$type), structure(n_snps, names="SNP"))
group_size <- group_size[rownames(estimated_group_prior_all)]
#estimated group PVE (all iterations)
estimated_group_pve_all <- estimated_group_prior_var_all*estimated_group_prior_all*group_size/sample_size #check PVE calculation
results_current <- data.frame(simutag=as.character(simutag),
n_causal=as.integer(n_causal),
n_causal_combined=as.integer(n_causal_combined),
n_detected_pip=as.integer(n_ctwas_genes),
n_detected_pip_in_causal=as.integer(n_causal_detected),
n_detected_comb_pip=as.integer(n_ctwas_genes_combined),
n_detected_comb_pip_in_causal=as.integer(n_causal_detected_combined),
pve_snp=as.numeric(rev(estimated_group_pve_all["SNP",])[1]),
pve_weight1=as.numeric(rev(estimated_group_pve_all["Liver",])[1]),
pve_weight2=as.numeric(rev(estimated_group_pve_all["Whole_Blood",])[1]),
pve_weight3=as.numeric(rev(estimated_group_pve_all["Brain_Cerebellum",])[1]),
prior_snp=as.numeric(rev(estimated_group_prior_var_all["SNP",])[1]),
prior_weight1=as.numeric(rev(estimated_group_prior_all["Liver",])[1]),
prior_weight2=as.numeric(rev(estimated_group_prior_all["Whole_Blood",])[1]),
prior_weight3=as.numeric(rev(estimated_group_prior_all["Brain_Cerebellum",])[1]),
prior_var_snp=as.numeric(rev(estimated_group_prior_var_all["SNP",])[1]),
prior_var_weight1=as.numeric(rev(estimated_group_prior_var_all["Liver",])[1]),
prior_var_weight2=as.numeric(rev(estimated_group_prior_var_all["Whole_Blood",])[1]),
prior_var_weight3=as.numeric(rev(estimated_group_prior_var_all["Brain_Cerebellum",])[1]))
results_df <- rbind(results_df, results_current)
}
#results using PIP threshold (gene+tissue)
results_df[,c("simutag", "n_causal", "n_detected_pip", "n_detected_pip_in_causal")] simutag n_causal n_detected_pip n_detected_pip_in_causal
1 3-1 118 25 22
2 3-2 95 32 28
3 3-3 116 19 18
4 3-4 117 26 26
5 3-5 113 27 22#mean percent causal using PIP > 0.8
sum(results_df$n_detected_pip_in_causal)/sum(results_df$n_detected_pip)[1] 0.8992248#results using combined PIP threshold
results_df[,c("simutag", "n_causal_combined", "n_detected_comb_pip", "n_detected_comb_pip_in_causal")] simutag n_causal_combined n_detected_comb_pip n_detected_comb_pip_in_causal
1 3-1 118 28 25
2 3-2 95 32 28
3 3-3 116 26 24
4 3-4 117 32 29
5 3-5 113 32 24#mean percent causal using combined PIP > 0.8
sum(results_df$n_detected_comb_pip_in_causal)/sum(results_df$n_detected_comb_pip)[1] 0.8666667#prior inclusion and mean prior inclusion
results_df[,c(which(colnames(results_df)=="simutag"), setdiff(grep("prior", names(results_df)), grep("prior_var", names(results_df))))] simutag prior_snp prior_weight1 prior_weight2 prior_weight3
1 3-1 15.26854 0.009960057 0.0029193316 0.0006996409
2 3-2 14.21774 0.015921227 0.0005239939 0.0001075432
3 3-3 13.00977 0.011268497 0.0045913157 0.0039885322
4 3-4 13.40018 0.020094595 0.0024137731 0.0048414159
5 3-5 13.04042 0.017810800 0.0036165052 0.0014596020colMeans(results_df[,setdiff(grep("prior", names(results_df)), grep("prior_var", names(results_df)))]) prior_snp prior_weight1 prior_weight2 prior_weight3
13.787332323 0.015011035 0.002812984 0.002219347 #prior variance and mean prior variance
results_df[,c(which(colnames(results_df)=="simutag"), grep("prior_var", names(results_df)))] simutag prior_var_snp prior_var_weight1 prior_var_weight2 prior_var_weight3
1 3-1 15.26854 31.33725 8.544893 1.151033
2 3-2 14.21774 21.99653 2.170788 1.777382
3 3-3 13.00977 29.18026 12.599922 8.153568
4 3-4 13.40018 16.87536 10.573233 6.239371
5 3-5 13.04042 23.99469 2.553775 15.738786colMeans(results_df[,grep("prior_var", names(results_df))]) prior_var_snp prior_var_weight1 prior_var_weight2 prior_var_weight3
13.787332 24.676817 7.288522 6.612028 #PVE and mean PVE
results_df[,c(which(colnames(results_df)=="simutag"), grep("pve", names(results_df)))] simutag pve_snp pve_weight1 pve_weight2 pve_weight3
1 3-1 0.3902628 0.05129185 0.0045289716 1.574470e-04
2 3-2 0.4134510 0.05755146 0.0002065158 3.737101e-05
3 3-3 0.4120362 0.05403570 0.0105030290 6.358171e-03
4 3-4 0.4290854 0.05572602 0.0046335493 5.905881e-03
5 3-5 0.3937832 0.07023025 0.0016768003 4.491352e-03colMeans(results_df[,grep("pve", names(results_df))]) pve_snp pve_weight1 pve_weight2 pve_weight3
0.407723705 0.057767056 0.004309773 0.003390045 #store results for figure
plot_df <- rbind(plot_df,
data.frame(simutag=results_df$simutag,
method="cTWAS G - Ind Var",
count=results_df$n_detected_comb_pip-results_df$n_detected_comb_pip_in_causal,
ifcausal=F))
plot_df <- rbind(plot_df,
data.frame(simutag=results_df$simutag,
method="cTWAS G - Ind Var",
count=results_df$n_detected_comb_pip_in_causal,
ifcausal=T))Individual tissue analyses
For the cTWAS analysis, each tissue was analyzed individually and the results were combined.
results_dir <- "/project2/mstephens/causalTWAS/simulations/simulation_ctwas_rss_20220127_wc/"
runtag = "ukb-s80.45-liv_wb"
configtag <- 1
simutags <- paste(3, 1:5, sep = "-")
thin <- 0.1
sample_size <- 45000
PIP_threshold <- 0.8
results_df <- data.frame(simutag=as.character(),
n_causal_combined=as.integer(),
n_detected_weight1=as.integer(),
n_detected_in_causal_weight1=as.integer(),
n_detected_weight2=as.integer(),
n_detected_in_causal_weight2=as.integer(),
n_detected_weight3=as.integer(),
n_detected_in_causal_weight3=as.integer(),
n_detected_combined=as.integer(),
n_detected_in_causal_combined=as.integer())
for (i in 1:length(simutags)){
simutag <- simutags[i]
#load genes with true simulated effect
load(paste0(results_dir, runtag, "_simu", simutag, "-pheno.Rd"))
true_genes <- unlist(sapply(1:22, function(x){phenores$batch[[x]]$id.cgene}))
true_genes_combined <- unique(sapply(true_genes, function(x){unlist(strsplit(x, "[|]"))[1]}))
#number of causal genes
n_causal_combined <- length(true_genes_combined)
#load cTWAS results for weight1
ctwas_res <- data.table::fread(paste0(results_dir, runtag, "_simu", simutag, "_config", configtag, "_LDR_weight1.susieIrss.txt"))
ctwas_gene_res <- ctwas_res[ctwas_res$type!="SNP",]
#number of genes with cTWAS PIP > threshold in weight1
ctwas_genes_weight1 <- ctwas_gene_res$id[ctwas_gene_res$susie_pip > PIP_threshold]
n_ctwas_genes_weight1 <- length(ctwas_genes_weight1)
n_causal_detected_weight1 <- sum(ctwas_genes_weight1 %in% true_genes_combined)
#load cTWAS results for weight2
ctwas_res <- data.table::fread(paste0(results_dir, runtag, "_simu", simutag, "_config", configtag, "_LDR_weight2.susieIrss.txt"))
ctwas_gene_res <- ctwas_res[ctwas_res$type!="SNP",]
#number of genes with cTWAS PIP > threshold in weight1
ctwas_genes_weight2 <- ctwas_gene_res$id[ctwas_gene_res$susie_pip > PIP_threshold]
n_ctwas_genes_weight2 <- length(ctwas_genes_weight2)
n_causal_detected_weight2 <- sum(ctwas_genes_weight2 %in% true_genes_combined)
#load cTWAS results for weight3
ctwas_res <- data.table::fread(paste0(results_dir, runtag, "_simu", simutag, "_config", configtag, "_LDR_weight3.susieIrss.txt"))
ctwas_gene_res <- ctwas_res[ctwas_res$type!="SNP",]
#number of genes with cTWAS PIP > threshold in weight3
ctwas_genes_weight3 <- ctwas_gene_res$id[ctwas_gene_res$susie_pip > PIP_threshold]
n_ctwas_genes_weight3 <- length(ctwas_genes_weight3)
n_causal_detected_weight3 <- sum(ctwas_genes_weight3 %in% true_genes_combined)
#combined analysis
ctwas_genes_combined <- unique(c(ctwas_genes_weight1, ctwas_genes_weight2, ctwas_genes_weight3))
n_ctwas_genes_combined <- length(ctwas_genes_combined)
n_causal_detected_combined <- sum(ctwas_genes_combined %in% true_genes_combined)
results_current <- data.frame(simutag=as.character(simutag),
n_causal_combined=as.integer(n_causal_combined),
n_detected_weight1=as.integer(n_ctwas_genes_weight1),
n_detected_in_causal_weight1=as.integer(n_causal_detected_weight1),
n_detected_weight2=as.integer(n_ctwas_genes_weight2),
n_detected_in_causal_weight2=as.integer(n_causal_detected_weight2),
n_detected_weight3=as.integer(n_ctwas_genes_weight3),
n_detected_in_causal_weight3=as.integer(n_causal_detected_weight3),
n_detected_combined=as.integer(n_ctwas_genes_combined),
n_detected_in_causal_combined=as.integer(n_causal_detected_combined))
results_df <- rbind(results_df, results_current)
}
#results using weight1
results_df[,c("simutag", colnames(results_df)[grep("weight1", colnames(results_df))])] simutag n_detected_weight1 n_detected_in_causal_weight1
1 3-1 27 24
2 3-2 31 28
3 3-3 24 22
4 3-4 28 27
5 3-5 28 23#mean percent causal using PIP > 0.8 for weight1
sum(results_df$n_detected_in_causal_weight1)/sum(results_df$n_detected_weight1)[1] 0.8985507#results using weight2
results_df[,c("simutag", colnames(results_df)[grep("weight2", colnames(results_df))])] simutag n_detected_weight2 n_detected_in_causal_weight2
1 3-1 1 1
2 3-2 5 4
3 3-3 8 6
4 3-4 3 3
5 3-5 4 3#mean percent causal using PIP > 0.8 for weight1
sum(results_df$n_detected_in_causal_weight2)/sum(results_df$n_detected_weight2)[1] 0.8095238#results using weight3
results_df[,c("simutag", colnames(results_df)[grep("weight3", colnames(results_df))])] simutag n_detected_weight3 n_detected_in_causal_weight3
1 3-1 0 0
2 3-2 3 3
3 3-3 2 1
4 3-4 2 2
5 3-5 1 1#mean percent causal using PIP > 0.8 for weight3
sum(results_df$n_detected_in_causal_weight3)/sum(results_df$n_detected_weight3)[1] 0.875#results using combined analysis
results_df[,c("simutag", colnames(results_df)[grep("combined", colnames(results_df))])] simutag n_causal_combined n_detected_combined n_detected_in_causal_combined
1 3-1 118 27 24
2 3-2 95 31 28
3 3-3 116 26 22
4 3-4 117 29 28
5 3-5 113 29 23#mean percent causal using PIP > 0.8 for weight3
sum(results_df$n_detected_in_causal_combined)/sum(results_df$n_detected_combined)[1] 0.8802817#store results for figure
plot_df <- rbind(plot_df,
data.frame(simutag=results_df$simutag,
method="cTWAS Weight1",
count=results_df$n_detected_weight1-results_df$n_detected_in_causal_weight1,
ifcausal=F))
plot_df <- rbind(plot_df,
data.frame(simutag=results_df$simutag,
method="cTWAS Weight1",
count=results_df$n_detected_in_causal_weight1,
ifcausal=T))
plot_df <- rbind(plot_df,
data.frame(simutag=results_df$simutag,
method="cTWAS Weight2",
count=results_df$n_detected_weight2-results_df$n_detected_in_causal_weight2,
ifcausal=F))
plot_df <- rbind(plot_df,
data.frame(simutag=results_df$simutag,
method="cTWAS Weight2",
count=results_df$n_detected_in_causal_weight2,
ifcausal=T))
plot_df <- rbind(plot_df,
data.frame(simutag=results_df$simutag,
method="cTWAS Weight3",
count=results_df$n_detected_weight3-results_df$n_detected_in_causal_weight3,
ifcausal=F))
plot_df <- rbind(plot_df,
data.frame(simutag=results_df$simutag,
method="cTWAS Weight3",
count=results_df$n_detected_in_causal_weight3,
ifcausal=T))
plot_df <- rbind(plot_df,
data.frame(simutag=results_df$simutag,
method="cTWAS Union",
count=results_df$n_detected_combined-results_df$n_detected_in_causal_combined,
ifcausal=F))
plot_df <- rbind(plot_df,
data.frame(simutag=results_df$simutag,
method="cTWAS Union",
count=results_df$n_detected_in_causal_combined,
ifcausal=T))Figure
For the cTWAS analysis, each tissue was analyzed individually and the results were combined.
plot_df$method <- factor(plot_df$method, levels=c("TWAS", "cTWAS G+T", "cTWAS G", "cTWAS G - Ind Var", "cTWAS Union", "cTWAS Weight1", "cTWAS Weight2", "cTWAS Weight3"))

library(ggpubr)

colset = c("#ebebeb", "#fb8072")

ggbarplot(plot_df,
          x = "method",
          y = "count",
          add = "mean_se",
          fill = "ifcausal",
          legend = "none",
          ylab="Count",
          xlab="",
          palette = colset) + grids(linetype = "dashed") + theme(axis.text.x = element_text(angle = 45, vjust = 1, hjust=1))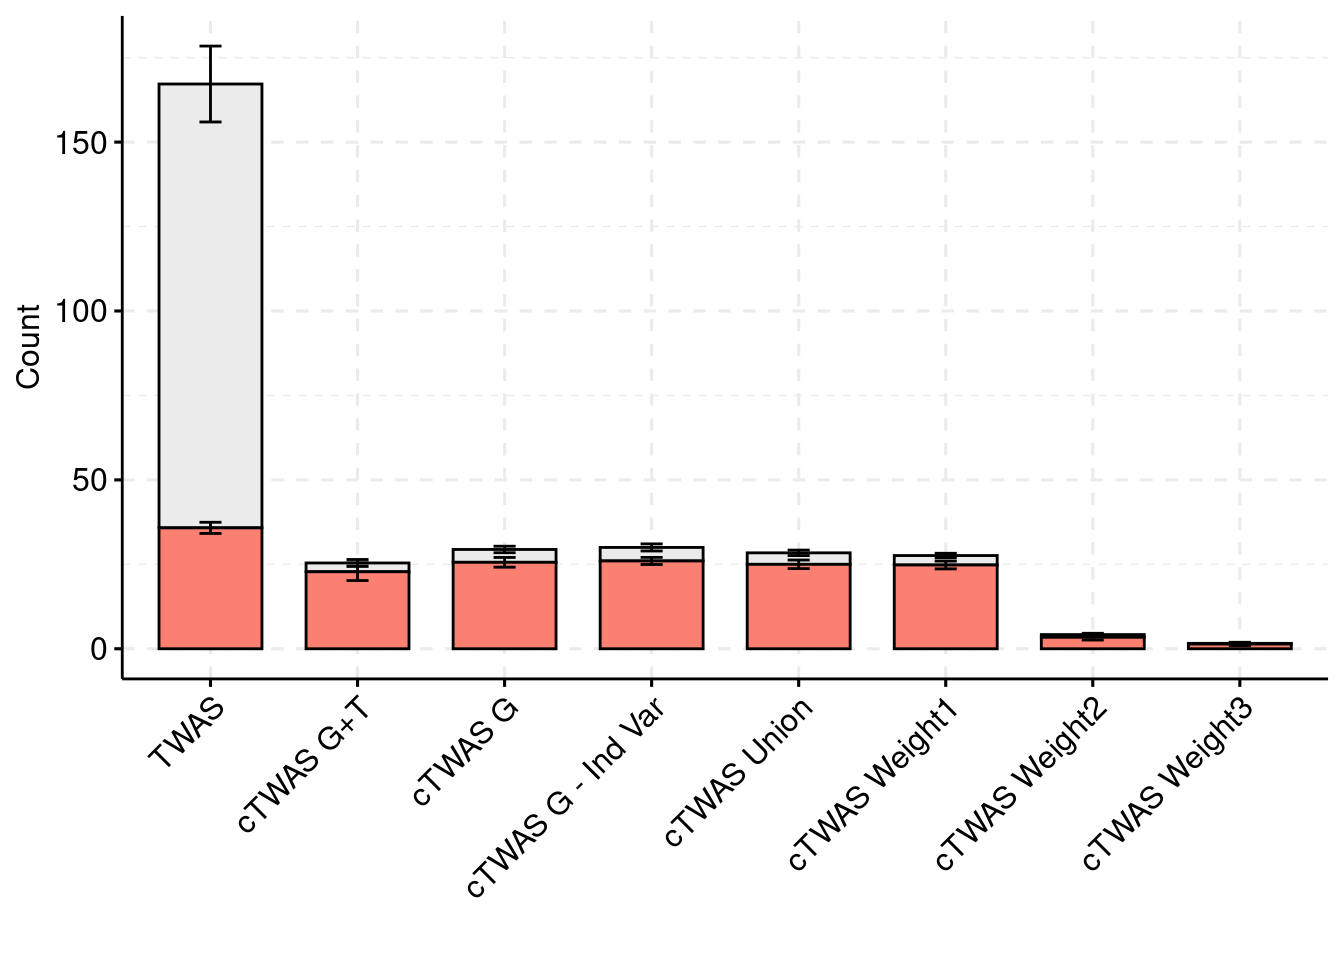
| Version | Author | Date |
|---|---|---|
| 68f8393 | wesleycrouse | 2023-02-10 |
plot_df_2 <- plot_df

plot_df_2$method %in% c("TWAS", "cTWAS Union", "cTWAS Weight1", "cTWAS Weight2", "cTWAS Weight3")
[1] FALSE FALSE FALSE FALSE FALSE FALSE FALSE FALSE FALSE FALSE FALSE FALSE
[13] FALSE FALSE FALSE FALSE FALSE FALSE FALSE FALSE TRUE TRUE TRUE TRUE
[25] TRUE TRUE TRUE TRUE TRUE TRUE FALSE FALSE FALSE FALSE FALSE FALSE
[37] FALSE FALSE FALSE FALSE TRUE TRUE TRUE TRUE TRUE TRUE TRUE TRUE
[49] TRUE TRUE TRUE TRUE TRUE TRUE TRUE TRUE TRUE TRUE TRUE TRUE
[61] TRUE TRUE TRUE TRUE TRUE TRUE TRUE TRUE TRUE TRUE TRUE TRUE
[73] TRUE TRUE TRUE TRUE TRUE TRUE TRUE TRUEplot_df_2$ifcausal <- as.character(plot_df_2$ifcausal+1)
plot_df_2$count[plot_df_2$method=="cTWAS G" & plot_df_2$ifcausal=="2"] <- plot_df_2$count[plot_df_2$method=="cTWAS G" & plot_df_2$ifcausal=="2"] - plot_df_2$count[plot_df_2$method=="cTWAS G+T" & plot_df_2$ifcausal=="2"]
plot_df_2 <- rbind(plot_df_2, data.frame(simutag=simutags,
method="cTWAS G",
count=plot_df_2$count[plot_df_2$method=="cTWAS G+T" & plot_df_2$ifcausal=="2"],
ifcausal="3"))
plot_df_3 <- plot_df_2
plot_df_2 <- plot_df_2[plot_df_2$method %in% c("TWAS", "cTWAS Union", "cTWAS Weight1", "cTWAS Weight2", "cTWAS Weight3"),]
plot_df_2$method <- droplevels(plot_df_2$method)
levels(plot_df_2$method) <- c("TWAS", "cTWAS Union", "cTWAS Primary", "cTWAS Secondary", "cTWAS Null")
plot_df_2$ifcausal[plot_df_2$ifcausal=="1"] <- "FP"
plot_df_2$ifcausal[plot_df_2$ifcausal=="2"] <- "TP"
colset = c("#ebebeb", "#fb8072", "#8dd3c7")
ggbarplot(plot_df_2,
x = "method",
y = "count",
add = "mean_se",
fill = "ifcausal",
legend = "right",
ylab="Count",
xlab="",
palette = colset) + grids(linetype = "dashed") + theme(axis.text.x = element_text(angle = 45, vjust = 1, hjust=1)) + guides(fill=guide_legend(title=""))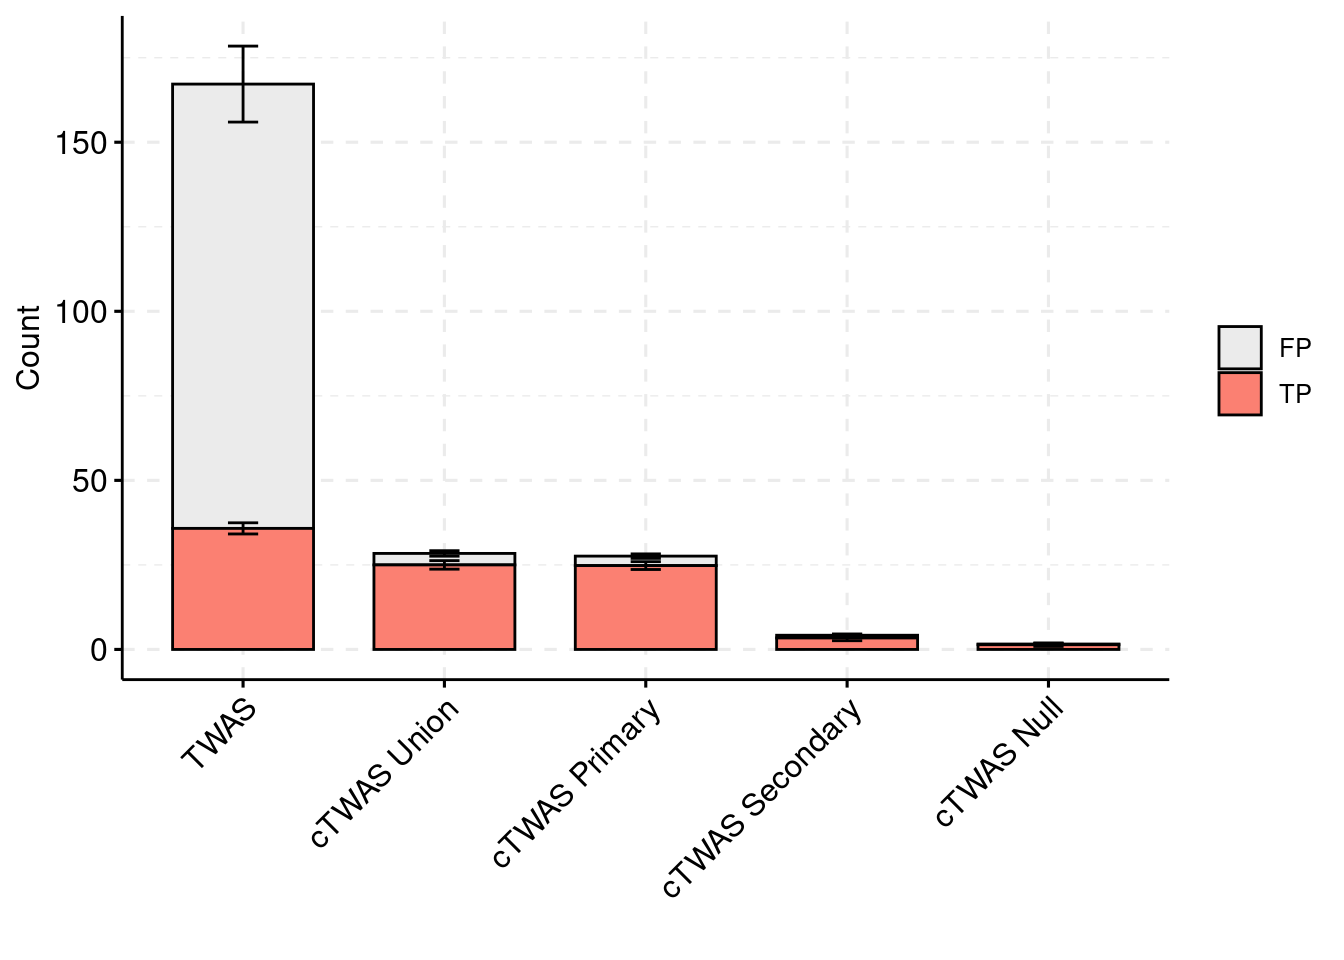
| Version | Author | Date |
|---|---|---|
| 68f8393 | wesleycrouse | 2023-02-10 |
plot_df_3 <- plot_df_3[plot_df_3$method %in% c("cTWAS G", "cTWAS Union"),]
plot_df_3$method <- droplevels(plot_df_3$method)
levels(plot_df_3$method) <- c("cTWAS Joint", "cTWAS Union")

plot_df_3$method <- relevel(plot_df_3$method, "cTWAS Union")

plot_df_3$ifcausal[plot_df_3$ifcausal=="1"] <- "FP"
plot_df_3$ifcausal[plot_df_3$ifcausal=="2"] <- "TP"
plot_df_3$ifcausal[plot_df_3$ifcausal=="3"] <- "TP and Tissue Identified\nby Joint Analysis"

ggbarplot(plot_df_3,
          x = "method",
          y = "count",
          add = "mean_se",
          fill = "ifcausal",
          legend = "right",
          ylab="Count",
          xlab="",
          palette = colset) + grids(linetype = "dashed") + theme(axis.text.x = element_text(angle = 45, vjust = 1, hjust=1)) + guides(fill=guide_legend(title=""))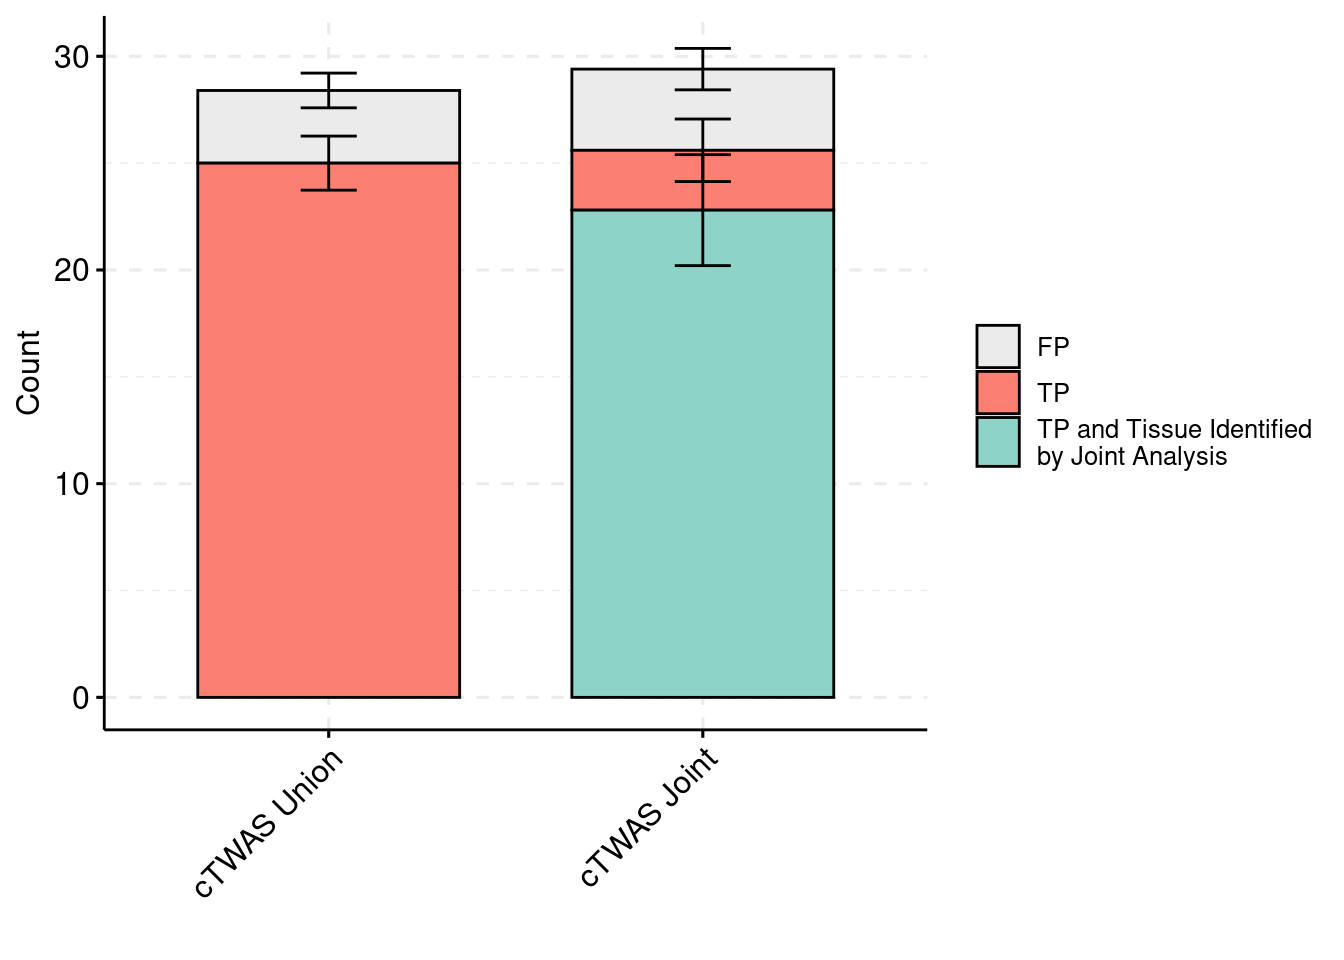
| Version | Author | Date |
|---|---|---|
| 68f8393 | wesleycrouse | 2023-02-10 |
Simulation 4: No causal tissues
Separate effect size parameters
For the cTWAS analysis, each tissue had its own prior inclusion parameter end effect size parameter.
results_dir <- "/project2/mstephens/causalTWAS/simulations/simulation_ctwas_rss_20220127_wc/"
runtag = "ukb-s80.45-liv_wb"
configtag <- 2
simutags <- paste(4, 1:5, sep = "-")
thin <- 0.1
sample_size <- 45000
PIP_threshold <- 0.8
results_df <- data.frame(simutag=as.character(),
n_causal=as.integer(),
n_causal_combined=as.integer(),
n_detected_pip=as.integer(),
n_detected_pip_in_causal=as.integer(),
n_detected_comb_pip=as.integer(),
n_detected_comb_pip_in_causal=as.integer(),
pve_snp=as.numeric(),
pve_weight1=as.numeric(),
pve_weight2=as.numeric(),
pve_weight3=as.numeric(),
prior_weight1=as.numeric(),
prior_weight2=as.numeric(),
prior_weight3=as.numeric(),
prior_var_snp=as.numeric(),
prior_var_weight1=as.numeric(),
prior_var_weight2=as.numeric(),
prior_var_weight3=as.numeric())
for (i in 1:length(simutags)){
simutag <- simutags[i]
#load genes with true simulated effect
load(paste0(results_dir, runtag, "_simu", simutag, "-pheno.Rd"))
true_genes <- unlist(sapply(1:22, function(x){phenores$batch[[x]]$id.cgene}))
true_genes_combined <- unique(sapply(true_genes, function(x){unlist(strsplit(x, "[|]"))[1]}))
#load cTWAS results
ctwas_res <- data.table::fread(paste0(results_dir, runtag, "_simu", simutag, "_config", configtag, "_LDR.susieIrss.txt"))
ctwas_gene_res <- ctwas_res[ctwas_res$type!="SNP",]
#number of causal genes
n_causal <- length(true_genes)
n_causal_combined <- length(true_genes_combined)
#number of gene+tissue combinations with cTWAS PIP > threshold
n_ctwas_genes <- sum(ctwas_gene_res$susie_pip > PIP_threshold)
#number of cTWAS genes that are causal
n_causal_detected <- sum(ctwas_gene_res$id[ctwas_gene_res$susie_pip > PIP_threshold] %in% true_genes)
#collapse gene+tissues to genes and compute combined PIP
ctwas_gene_res$gene <- sapply(ctwas_gene_res$id, function(x){unlist(strsplit(x,"[|]"))[1]})
ctwas_gene_res_combined <- aggregate(ctwas_gene_res$susie_pip, by=list(ctwas_gene_res$gene), FUN=sum)
colnames(ctwas_gene_res_combined) <- c("gene", "pip_combined")
#number of genes with combined PIP > threshold
n_ctwas_genes_combined <- sum(ctwas_gene_res_combined$pip_combined > PIP_threshold)
#number of cTWAS genes using combined PIP that are causal
n_causal_detected_combined <- sum(ctwas_gene_res_combined$gene[ctwas_gene_res_combined$pip_combined > PIP_threshold] %in% true_genes_combined)
#collect number of SNPs analyzed by cTWAS
ctwas_res_s1 <- data.table::fread(paste0(results_dir, runtag, "_simu", simutag, "_config", configtag, "_LDR.s1.susieIrss.txt"))
n_snps <- sum(ctwas_res_s1$type=="SNP")/thin
rm(ctwas_res_s1)
#load estimated parameters
load(paste0(results_dir, runtag, "_simu", simutag, "_config", configtag, "_LDR.s2.susieIrssres.Rd"))
#estimated group prior (all iterations)
estimated_group_prior_all <- group_prior_rec
estimated_group_prior_all["SNP",] <- estimated_group_prior_all["SNP",]*thin #adjust parameter to account for thin argument
#estimated group prior variance (all iterations)
estimated_group_prior_var_all <- group_prior_var_rec
#set group size
group_size <- c(table(ctwas_gene_res$type), structure(n_snps, names="SNP"))
group_size <- group_size[rownames(estimated_group_prior_all)]
#estimated group PVE (all iterations)
estimated_group_pve_all <- estimated_group_prior_var_all*estimated_group_prior_all*group_size/sample_size #check PVE calculation
results_current <- data.frame(simutag=as.character(simutag),
n_causal=as.integer(n_causal),
n_causal_combined=as.integer(n_causal_combined),
n_detected_pip=as.integer(n_ctwas_genes),
n_detected_pip_in_causal=as.integer(n_causal_detected),
n_detected_comb_pip=as.integer(n_ctwas_genes_combined),
n_detected_comb_pip_in_causal=as.integer(n_causal_detected_combined),
pve_snp=as.numeric(rev(estimated_group_pve_all["SNP",])[1]),
pve_weight1=as.numeric(rev(estimated_group_pve_all["Liver",])[1]),
pve_weight2=as.numeric(rev(estimated_group_pve_all["Whole_Blood",])[1]),
pve_weight3=as.numeric(rev(estimated_group_pve_all["Brain_Cerebellum",])[1]),
prior_snp=as.numeric(rev(estimated_group_prior_var_all["SNP",])[1]),
prior_weight1=as.numeric(rev(estimated_group_prior_all["Liver",])[1]),
prior_weight2=as.numeric(rev(estimated_group_prior_all["Whole_Blood",])[1]),
prior_weight3=as.numeric(rev(estimated_group_prior_all["Brain_Cerebellum",])[1]),
prior_var_snp=as.numeric(rev(estimated_group_prior_var_all["SNP",])[1]),
prior_var_weight1=as.numeric(rev(estimated_group_prior_var_all["Liver",])[1]),
prior_var_weight2=as.numeric(rev(estimated_group_prior_var_all["Whole_Blood",])[1]),
prior_var_weight3=as.numeric(rev(estimated_group_prior_var_all["Brain_Cerebellum",])[1]))
results_df <- rbind(results_df, results_current)
}
#results using PIP threshold (gene+tissue)
results_df[,c("simutag", "n_causal", "n_detected_pip", "n_detected_pip_in_causal")] simutag n_causal n_detected_pip n_detected_pip_in_causal
1 4-1 0 0 0
2 4-2 0 0 0
3 4-3 0 0 0
4 4-4 0 1 0
5 4-5 0 0 0#mean percent causal using PIP > 0.8
sum(results_df$n_detected_pip_in_causal)/sum(results_df$n_detected_pip)[1] 0#results using combined PIP threshold
results_df[,c("simutag", "n_causal_combined", "n_detected_comb_pip", "n_detected_comb_pip_in_causal")] simutag n_causal_combined n_detected_comb_pip n_detected_comb_pip_in_causal
1 4-1 0 1 0
2 4-2 0 0 0
3 4-3 0 2 0
4 4-4 0 3 0
5 4-5 0 1 0#mean percent causal using combined PIP > 0.8
sum(results_df$n_detected_comb_pip_in_causal)/sum(results_df$n_detected_comb_pip)[1] 0#prior inclusion and mean prior inclusion
results_df[,c(which(colnames(results_df)=="simutag"), setdiff(grep("prior", names(results_df)), grep("prior_var", names(results_df))))] simutag prior_snp prior_weight1 prior_weight2 prior_weight3
1 4-1 12.58359 0.0017288204 0.0030204233 0.003619867
2 4-2 13.08410 0.0005832831 0.0014533136 0.001222175
3 4-3 12.06660 0.0037554283 0.0009381176 0.002609262
4 4-4 11.14881 0.0073686855 0.0013821132 0.000845720
5 4-5 12.07505 0.0047356209 0.0026851585 0.001770055colMeans(results_df[,setdiff(grep("prior", names(results_df)), grep("prior_var", names(results_df)))]) prior_snp prior_weight1 prior_weight2 prior_weight3
12.191632680 0.003634368 0.001895825 0.002013416 #prior variance and mean prior variance
results_df[,c(which(colnames(results_df)=="simutag"), grep("prior_var", names(results_df)))] simutag prior_var_snp prior_var_weight1 prior_var_weight2 prior_var_weight3
1 4-1 12.58359 0.6479737 28.946442 0.4261434
2 4-2 13.08410 1.3718846 2.020467 38.9870059
3 4-3 12.06660 4.0111067 32.042210 3.7671720
4 4-4 11.14881 3.1822072 37.942118 0.8168949
5 4-5 12.07505 1.3471771 20.428115 0.6388463colMeans(results_df[,grep("prior_var", names(results_df))]) prior_var_snp prior_var_weight1 prior_var_weight2 prior_var_weight3
12.191633 2.112070 24.275870 8.927212 #PVE and mean PVE
results_df[,c(which(colnames(results_df)=="simutag"), grep("pve", names(results_df)))] simutag pve_snp pve_weight1 pve_weight2 pve_weight3
1 4-1 0.3776241 0.0001840911 0.0158734940 0.0003015920
2 4-2 0.4258038 0.0001314991 0.0005331148 0.0093159007
3 4-3 0.4219170 0.0024754226 0.0054574440 0.0019217837
4 4-4 0.3769374 0.0038534004 0.0095208286 0.0001350717
5 4-5 0.4087371 0.0010484007 0.0099588172 0.0002210826colMeans(results_df[,grep("pve", names(results_df))]) pve_snp pve_weight1 pve_weight2 pve_weight3
0.402203910 0.001538563 0.008268740 0.002379086 #store results for figure
plot_df <- rbind(plot_df,
data.frame(simutag=results_df$simutag,
method="cTWAS G - Ind Var",
count=results_df$n_detected_comb_pip-results_df$n_detected_comb_pip_in_causal,
ifcausal=F))
plot_df <- rbind(plot_df,
data.frame(simutag=results_df$simutag,
method="cTWAS G - Ind Var",
count=results_df$n_detected_comb_pip_in_causal,
ifcausal=T))Individual tissue analyses
For the cTWAS analysis, each tissue was analyzed individually and the results were combined.
results_dir <- "/project2/mstephens/causalTWAS/simulations/simulation_ctwas_rss_20220127_wc/"
runtag = "ukb-s80.45-liv_wb"
configtag <- 1
simutags <- paste(4, 1:5, sep = "-")
thin <- 0.1
sample_size <- 45000
PIP_threshold <- 0.8
results_df <- data.frame(simutag=as.character(),
n_causal_combined=as.integer(),
n_detected_weight1=as.integer(),
n_detected_in_causal_weight1=as.integer(),
n_detected_weight2=as.integer(),
n_detected_in_causal_weight2=as.integer(),
n_detected_weight3=as.integer(),
n_detected_in_causal_weight3=as.integer(),
n_detected_combined=as.integer(),
n_detected_in_causal_combined=as.integer())
for (i in 1:length(simutags)){
simutag <- simutags[i]
#load genes with true simulated effect
load(paste0(results_dir, runtag, "_simu", simutag, "-pheno.Rd"))
true_genes <- unlist(sapply(1:22, function(x){phenores$batch[[x]]$id.cgene}))
true_genes_combined <- unique(sapply(true_genes, function(x){unlist(strsplit(x, "[|]"))[1]}))
#number of causal genes
n_causal_combined <- length(true_genes_combined)
#load cTWAS results for weight1
ctwas_res <- data.table::fread(paste0(results_dir, runtag, "_simu", simutag, "_config", configtag, "_LDR_weight1.susieIrss.txt"))
ctwas_gene_res <- ctwas_res[ctwas_res$type!="SNP",]
#number of genes with cTWAS PIP > threshold in weight1
ctwas_genes_weight1 <- ctwas_gene_res$id[ctwas_gene_res$susie_pip > PIP_threshold]
n_ctwas_genes_weight1 <- length(ctwas_genes_weight1)
n_causal_detected_weight1 <- sum(ctwas_genes_weight1 %in% true_genes_combined)
#load cTWAS results for weight2
ctwas_res <- data.table::fread(paste0(results_dir, runtag, "_simu", simutag, "_config", configtag, "_LDR_weight2.susieIrss.txt"))
ctwas_gene_res <- ctwas_res[ctwas_res$type!="SNP",]
#number of genes with cTWAS PIP > threshold in weight1
ctwas_genes_weight2 <- ctwas_gene_res$id[ctwas_gene_res$susie_pip > PIP_threshold]
n_ctwas_genes_weight2 <- length(ctwas_genes_weight2)
n_causal_detected_weight2 <- sum(ctwas_genes_weight2 %in% true_genes_combined)
#load cTWAS results for weight3
ctwas_res <- data.table::fread(paste0(results_dir, runtag, "_simu", simutag, "_config", configtag, "_LDR_weight3.susieIrss.txt"))
ctwas_gene_res <- ctwas_res[ctwas_res$type!="SNP",]
#number of genes with cTWAS PIP > threshold in weight3
ctwas_genes_weight3 <- ctwas_gene_res$id[ctwas_gene_res$susie_pip > PIP_threshold]
n_ctwas_genes_weight3 <- length(ctwas_genes_weight3)
n_causal_detected_weight3 <- sum(ctwas_genes_weight3 %in% true_genes_combined)
#combined analysis
ctwas_genes_combined <- unique(c(ctwas_genes_weight1, ctwas_genes_weight2, ctwas_genes_weight3))
n_ctwas_genes_combined <- length(ctwas_genes_combined)
n_causal_detected_combined <- sum(ctwas_genes_combined %in% true_genes_combined)
results_current <- data.frame(simutag=as.character(simutag),
n_causal_combined=as.integer(n_causal_combined),
n_detected_weight1=as.integer(n_ctwas_genes_weight1),
n_detected_in_causal_weight1=as.integer(n_causal_detected_weight1),
n_detected_weight2=as.integer(n_ctwas_genes_weight2),
n_detected_in_causal_weight2=as.integer(n_causal_detected_weight2),
n_detected_weight3=as.integer(n_ctwas_genes_weight3),
n_detected_in_causal_weight3=as.integer(n_causal_detected_weight3),
n_detected_combined=as.integer(n_ctwas_genes_combined),
n_detected_in_causal_combined=as.integer(n_causal_detected_combined))
results_df <- rbind(results_df, results_current)
}
#results using weight1
results_df[,c("simutag", colnames(results_df)[grep("weight1", colnames(results_df))])] simutag n_detected_weight1 n_detected_in_causal_weight1
1 4-1 0 0
2 4-2 0 0
3 4-3 0 0
4 4-4 0 0
5 4-5 0 0#mean percent causal using PIP > 0.8 for weight1
sum(results_df$n_detected_in_causal_weight1)/sum(results_df$n_detected_weight1)[1] NaN#results using weight2
results_df[,c("simutag", colnames(results_df)[grep("weight2", colnames(results_df))])] simutag n_detected_weight2 n_detected_in_causal_weight2
1 4-1 0 0
2 4-2 0 0
3 4-3 0 0
4 4-4 1 0
5 4-5 0 0#mean percent causal using PIP > 0.8 for weight1
sum(results_df$n_detected_in_causal_weight2)/sum(results_df$n_detected_weight2)[1] 0#results using weight3
results_df[,c("simutag", colnames(results_df)[grep("weight3", colnames(results_df))])] simutag n_detected_weight3 n_detected_in_causal_weight3
1 4-1 0 0
2 4-2 0 0
3 4-3 0 0
4 4-4 0 0
5 4-5 0 0#mean percent causal using PIP > 0.8 for weight3
sum(results_df$n_detected_in_causal_weight3)/sum(results_df$n_detected_weight3)[1] NaN#results using combined analysis
results_df[,c("simutag", colnames(results_df)[grep("combined", colnames(results_df))])] simutag n_causal_combined n_detected_combined n_detected_in_causal_combined
1 4-1 0 0 0
2 4-2 0 0 0
3 4-3 0 0 0
4 4-4 0 1 0
5 4-5 0 0 0#mean percent causal using PIP > 0.8 for weight3
sum(results_df$n_detected_in_causal_combined)/sum(results_df$n_detected_combined)[1] 0#store results for figure
plot_df <- rbind(plot_df,
data.frame(simutag=results_df$simutag,
method="cTWAS Weight1",
count=results_df$n_detected_weight1-results_df$n_detected_in_causal_weight1,
ifcausal=F))
plot_df <- rbind(plot_df,
data.frame(simutag=results_df$simutag,
method="cTWAS Weight1",
count=results_df$n_detected_in_causal_weight1,
ifcausal=T))
plot_df <- rbind(plot_df,
data.frame(simutag=results_df$simutag,
method="cTWAS Weight2",
count=results_df$n_detected_weight2-results_df$n_detected_in_causal_weight2,
ifcausal=F))
plot_df <- rbind(plot_df,
data.frame(simutag=results_df$simutag,
method="cTWAS Weight2",
count=results_df$n_detected_in_causal_weight2,
ifcausal=T))
plot_df <- rbind(plot_df,
data.frame(simutag=results_df$simutag,
method="cTWAS Weight3",
count=results_df$n_detected_weight3-results_df$n_detected_in_causal_weight3,
ifcausal=F))
plot_df <- rbind(plot_df,
data.frame(simutag=results_df$simutag,
method="cTWAS Weight3",
count=results_df$n_detected_in_causal_weight3,
ifcausal=T))
plot_df <- rbind(plot_df,
data.frame(simutag=results_df$simutag,
method="cTWAS Union",
count=results_df$n_detected_combined-results_df$n_detected_in_causal_combined,
ifcausal=F))
plot_df <- rbind(plot_df,
data.frame(simutag=results_df$simutag,
method="cTWAS Union",
count=results_df$n_detected_in_causal_combined,
ifcausal=T))Figure
For the cTWAS analysis, each tissue was analyzed individually and the results were combined.
plot_df$method <- factor(plot_df$method, levels=c("TWAS", "cTWAS G+T", "cTWAS G", "cTWAS G - Ind Var", "cTWAS Union", "cTWAS Weight1", "cTWAS Weight2", "cTWAS Weight3"))

library(ggpubr)

colset = c("#ebebeb", "#fb8072")

ggbarplot(plot_df,
          x = "method",
          y = "count",
          add = "mean_se",
          fill = "ifcausal",
          legend = "none",
          ylab="Count",
          xlab="",
          palette = colset) + grids(linetype = "dashed") + theme(axis.text.x = element_text(angle = 45, vjust = 1, hjust=1))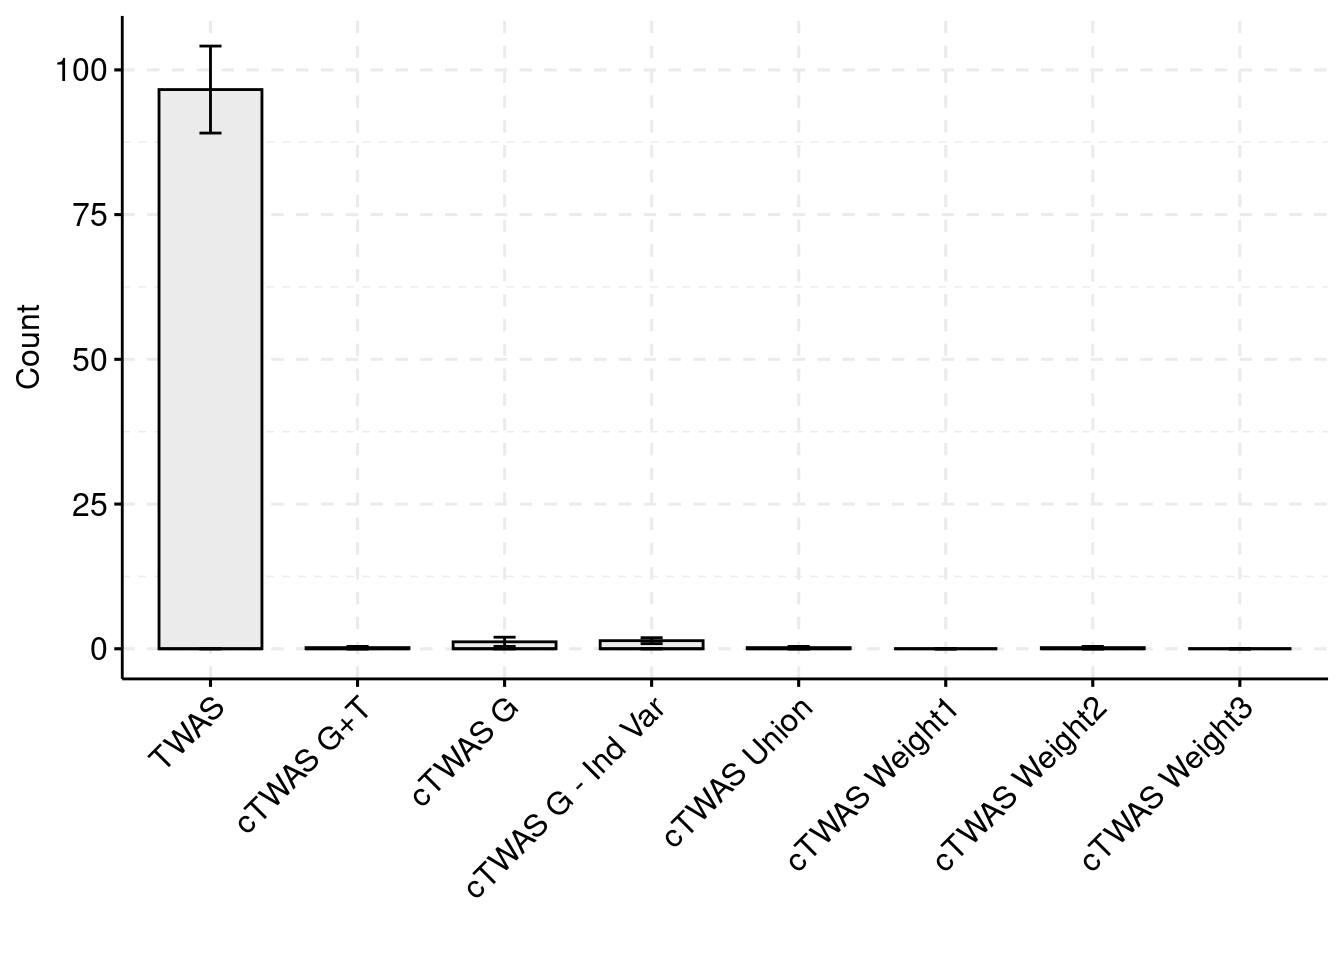
| Version | Author | Date |
|---|---|---|
| 68f8393 | wesleycrouse | 2023-02-10 |
plot_df_2 <- plot_df

plot_df_2$method %in% c("TWAS", "cTWAS Union", "cTWAS Weight1", "cTWAS Weight2", "cTWAS Weight3")
[1] FALSE FALSE FALSE FALSE FALSE FALSE FALSE FALSE FALSE FALSE FALSE FALSE
[13] FALSE FALSE FALSE FALSE FALSE FALSE FALSE FALSE TRUE TRUE TRUE TRUE
[25] TRUE TRUE TRUE TRUE TRUE TRUE FALSE FALSE FALSE FALSE FALSE FALSE
[37] FALSE FALSE FALSE FALSE TRUE TRUE TRUE TRUE TRUE TRUE TRUE TRUE
[49] TRUE TRUE TRUE TRUE TRUE TRUE TRUE TRUE TRUE TRUE TRUE TRUE
[61] TRUE TRUE TRUE TRUE TRUE TRUE TRUE TRUE TRUE TRUE TRUE TRUE
[73] TRUE TRUE TRUE TRUE TRUE TRUE TRUE TRUEplot_df_2$ifcausal <- as.character(plot_df_2$ifcausal+1)
plot_df_2$count[plot_df_2$method=="cTWAS G" & plot_df_2$ifcausal=="2"] <- plot_df_2$count[plot_df_2$method=="cTWAS G" & plot_df_2$ifcausal=="2"] - plot_df_2$count[plot_df_2$method=="cTWAS G+T" & plot_df_2$ifcausal=="2"]
plot_df_2 <- rbind(plot_df_2, data.frame(simutag=simutags,
method="cTWAS G",
count=plot_df_2$count[plot_df_2$method=="cTWAS G+T" & plot_df_2$ifcausal=="2"],
ifcausal="3"))
plot_df_3 <- plot_df_2
plot_df_2 <- plot_df_2[plot_df_2$method %in% c("TWAS", "cTWAS Union", "cTWAS Weight1", "cTWAS Weight2", "cTWAS Weight3"),]
plot_df_2$method <- droplevels(plot_df_2$method)
levels(plot_df_2$method) <- c("TWAS", "cTWAS Union", "cTWAS Primary", "cTWAS Secondary", "cTWAS Null")
plot_df_2$ifcausal[plot_df_2$ifcausal=="1"] <- "FP"
plot_df_2$ifcausal[plot_df_2$ifcausal=="2"] <- "TP"
colset = c("#ebebeb", "#fb8072", "#8dd3c7")
ggbarplot(plot_df_2,
x = "method",
y = "count",
add = "mean_se",
fill = "ifcausal",
legend = "right",
ylab="Count",
xlab="",
palette = colset) + grids(linetype = "dashed") + theme(axis.text.x = element_text(angle = 45, vjust = 1, hjust=1)) + guides(fill=guide_legend(title=""))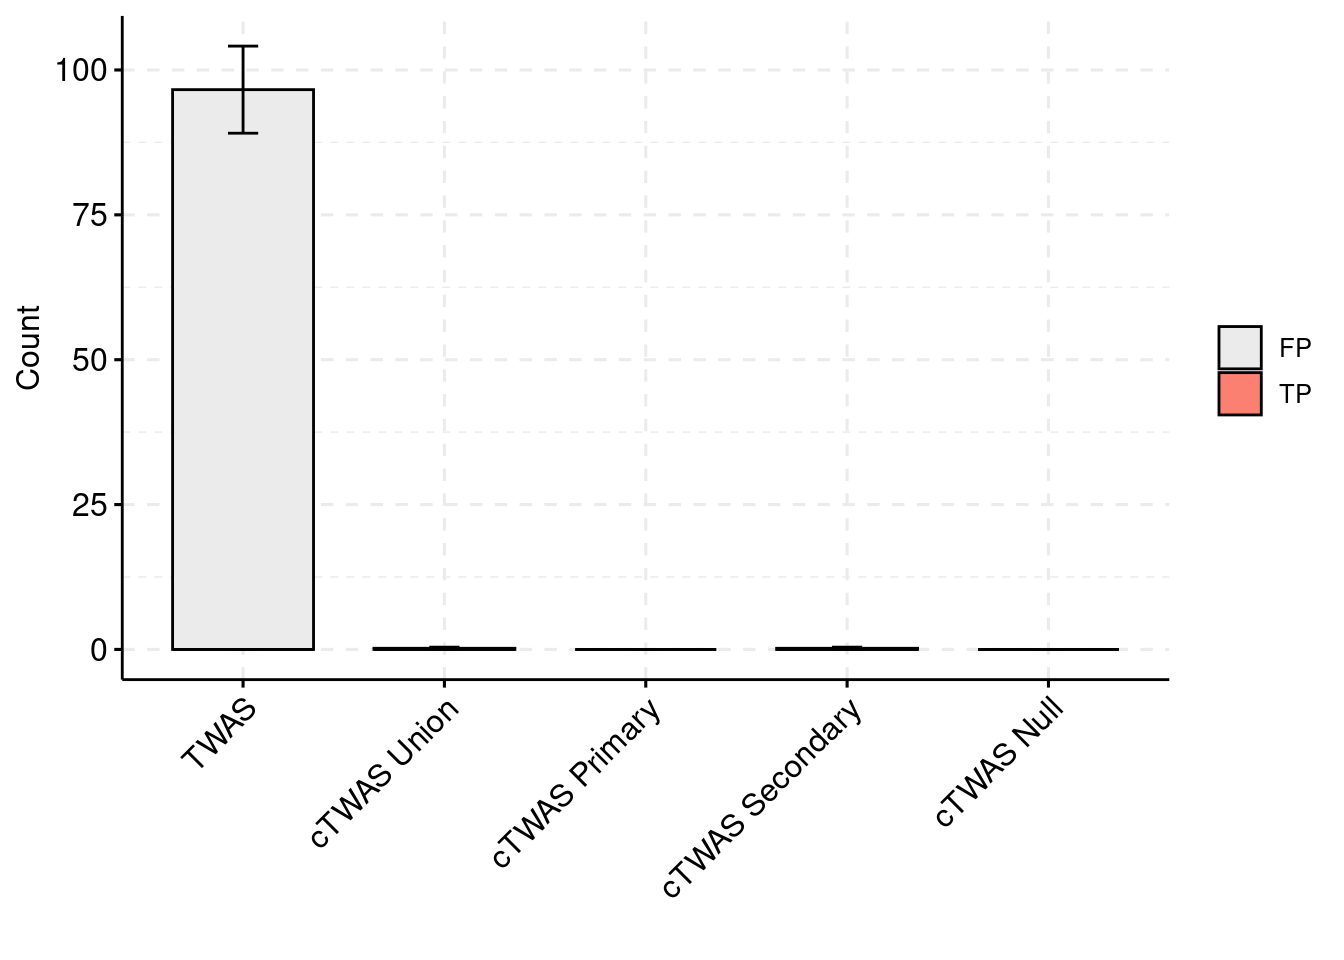
| Version | Author | Date |
|---|---|---|
| 68f8393 | wesleycrouse | 2023-02-10 |
plot_df_3 <- plot_df_3[plot_df_3$method %in% c("cTWAS G", "cTWAS Union"),]
plot_df_3$method <- droplevels(plot_df_3$method)
levels(plot_df_3$method) <- c("cTWAS Joint", "cTWAS Union")

plot_df_3$method <- relevel(plot_df_3$method, "cTWAS Union")

plot_df_3$ifcausal[plot_df_3$ifcausal=="1"] <- "FP"
plot_df_3$ifcausal[plot_df_3$ifcausal=="2"] <- "TP"
plot_df_3$ifcausal[plot_df_3$ifcausal=="3"] <- "TP and Tissue Identified\nby Joint Analysis"

ggbarplot(plot_df_3,
          x = "method",
          y = "count",
          add = "mean_se",
          fill = "ifcausal",
          legend = "right",
          ylab="Count",
          xlab="",
          palette = colset) + grids(linetype = "dashed") + theme(axis.text.x = element_text(angle = 45, vjust = 1, hjust=1)) + guides(fill=guide_legend(title=""))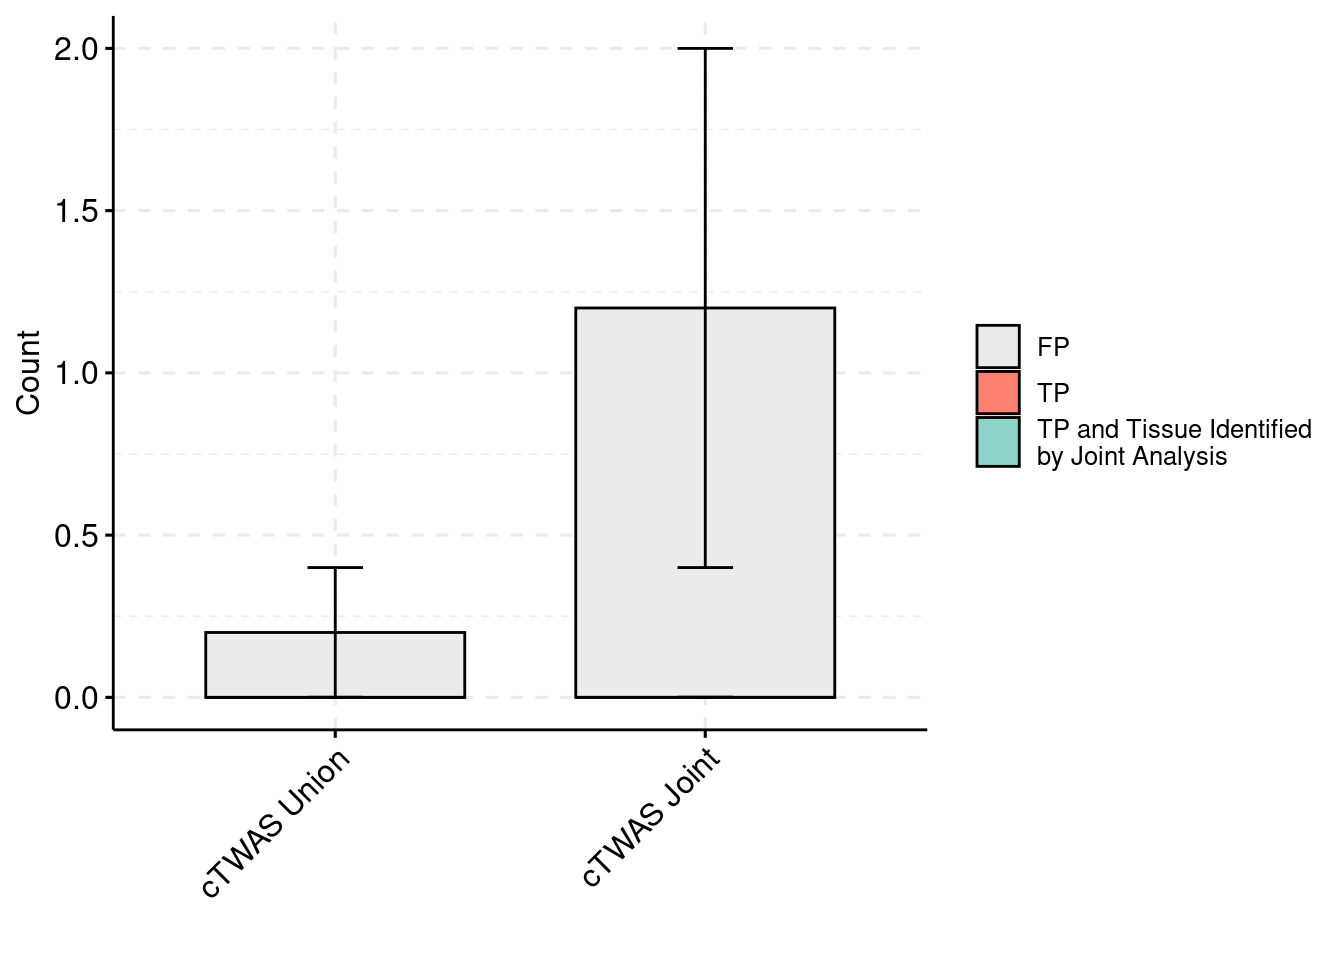
| Version | Author | Date |
|---|---|---|
| 68f8393 | wesleycrouse | 2023-02-10 |
sessionInfo()R version 4.1.0 (2021-05-18)
Platform: x86_64-pc-linux-gnu (64-bit)
Running under: CentOS Linux 7 (Core)
Matrix products: default
BLAS: /software/R-4.1.0-no-openblas-el7-x86_64/lib64/R/lib/libRblas.so
LAPACK: /software/R-4.1.0-no-openblas-el7-x86_64/lib64/R/lib/libRlapack.so
locale:
[1] LC_CTYPE=en_US.UTF-8 LC_NUMERIC=C LC_TIME=C
[4] LC_COLLATE=C LC_MONETARY=C LC_MESSAGES=C
[7] LC_PAPER=C LC_NAME=C LC_ADDRESS=C
[10] LC_TELEPHONE=C LC_MEASUREMENT=C LC_IDENTIFICATION=C
attached base packages:
[1] stats graphics grDevices utils datasets methods base
other attached packages:
[1] ggpubr_0.5.0 ggplot2_3.4.0 workflowr_1.7.0
loaded via a namespace (and not attached):
[1] tidyselect_1.2.0 xfun_0.35 bslib_0.4.1 purrr_0.3.5
[5] carData_3.0-5 colorspace_2.0-3 vctrs_0.5.1 generics_0.1.3
[9] htmltools_0.5.4 yaml_2.3.6 utf8_1.2.2 rlang_1.0.6
[13] jquerylib_0.1.4 later_1.3.0 pillar_1.8.1 glue_1.6.2
[17] withr_2.5.0 DBI_1.1.3 lifecycle_1.0.3 stringr_1.5.0
[21] munsell_0.5.0 ggsignif_0.6.4 gtable_0.3.1 evaluate_0.18
[25] labeling_0.4.2 knitr_1.41 callr_3.7.3 fastmap_1.1.0
[29] httpuv_1.6.6 ps_1.7.2 fansi_1.0.3 highr_0.9
[33] broom_1.0.1 Rcpp_1.0.9 backports_1.4.1 promises_1.2.0.1
[37] scales_1.2.1 cachem_1.0.6 jsonlite_1.8.4 abind_1.4-5
[41] farver_2.1.1 fs_1.5.2 digest_0.6.31 stringi_1.7.8
[45] rstatix_0.7.1 processx_3.8.0 dplyr_1.0.10 getPass_0.2-2
[49] rprojroot_2.0.3 grid_4.1.0 cli_3.4.1 tools_4.1.0
[53] magrittr_2.0.3 sass_0.4.4 tibble_3.1.8 car_3.1-1
[57] tidyr_1.2.1 whisker_0.4.1 pkgconfig_2.0.3 data.table_1.14.6
[61] assertthat_0.2.1 rmarkdown_2.18 httr_1.4.4 rstudioapi_0.14
[65] R6_2.5.1 git2r_0.30.1 compiler_4.1.0