Investigating PMR Simulation Results
wesleycrouse
2022-11-14
Last updated: 2022-11-29
Checks: 6 1
Knit directory: ctwas_applied/
This reproducible R Markdown analysis was created with workflowr (version 1.6.2). The Checks tab describes the reproducibility checks that were applied when the results were created. The Past versions tab lists the development history.
The R Markdown file has unstaged changes. To know which version of the R Markdown file created these results, you’ll want to first commit it to the Git repo. If you’re still working on the analysis, you can ignore this warning. When you’re finished, you can run wflow_publish to commit the R Markdown file and build the HTML.
Great job! The global environment was empty. Objects defined in the global environment can affect the analysis in your R Markdown file in unknown ways. For reproduciblity it’s best to always run the code in an empty environment.
The command set.seed(20210726) was run prior to running the code in the R Markdown file. Setting a seed ensures that any results that rely on randomness, e.g. subsampling or permutations, are reproducible.
Great job! Recording the operating system, R version, and package versions is critical for reproducibility.
Nice! There were no cached chunks for this analysis, so you can be confident that you successfully produced the results during this run.
Great job! Using relative paths to the files within your workflowr project makes it easier to run your code on other machines.
Great! You are using Git for version control. Tracking code development and connecting the code version to the results is critical for reproducibility.
The results in this page were generated with repository version 794723c. See the Past versions tab to see a history of the changes made to the R Markdown and HTML files.
Note that you need to be careful to ensure that all relevant files for the analysis have been committed to Git prior to generating the results (you can use wflow_publish or wflow_git_commit). workflowr only checks the R Markdown file, but you know if there are other scripts or data files that it depends on. Below is the status of the Git repository when the results were generated:
Untracked files:
    Untracked:  gwas.RData
    Untracked:  ld_R_info.RData
    Untracked:  workspace1.RData
    Untracked:  workspace2.RData
    Untracked:  workspace20.RData
    Untracked:  workspace3.RData
    Untracked:  z_snp_pos_ebi-a-GCST004131.RData
    Untracked:  z_snp_pos_ebi-a-GCST004132.RData
    Untracked:  z_snp_pos_ebi-a-GCST004133.RData
    Untracked:  z_snp_pos_scz-2018.RData
    Untracked:  z_snp_pos_ukb-a-360.RData
    Untracked:  z_snp_pos_ukb-d-30780_irnt.RData

Unstaged changes:
    Modified:   analysis/simulation_PMR.Rmd
Note that any generated files, e.g. HTML, png, CSS, etc., are not included in this status report because it is ok for generated content to have uncommitted changes.
These are the previous versions of the repository in which changes were made to the R Markdown (analysis/simulation_PMR.Rmd) and HTML (docs/simulation_PMR.html) files. If you’ve configured a remote Git repository (see ?wflow_git_remote), click on the hyperlinks in the table below to view the files as they were in that past version.
| File | Version | Author | Date | Message |
|---|---|---|---|---|
| Rmd | 794723c | wesleycrouse | 2022-11-29 | pmr compile |
| Rmd | a66efe7 | wesleycrouse | 2022-11-29 | regularized PMR |
| html | a66efe7 | wesleycrouse | 2022-11-29 | regularized PMR |
| html | 182fce5 | wesleycrouse | 2022-11-29 | more PMR results |
| Rmd | 122914e | wesleycrouse | 2022-11-29 | more PMR simulations |
| html | 5c59596 | wesleycrouse | 2022-11-20 | recompile pmr |
| Rmd | c8dba89 | wesleycrouse | 2022-11-18 | recompile PMR |
| html | c8dba89 | wesleycrouse | 2022-11-18 | recompile PMR |
| Rmd | b870118 | wesleycrouse | 2022-11-18 | updated simulation plot |
| Rmd | 7fc6395 | wesleycrouse | 2022-11-18 | updated PMR plots |
| html | 7fc6395 | wesleycrouse | 2022-11-18 | updated PMR plots |
| Rmd | fb60eee | wesleycrouse | 2022-11-18 | detailed exploration of PMR false positives |
| html | fb60eee | wesleycrouse | 2022-11-18 | detailed exploration of PMR false positives |
| Rmd | 62bff7d | wesleycrouse | 2022-11-15 | recompile |
| html | 62bff7d | wesleycrouse | 2022-11-15 | recompile |
| Rmd | a80a34a | wesleycrouse | 2022-11-15 | pmr recompile |
| html | a80a34a | wesleycrouse | 2022-11-15 | pmr recompile |
| Rmd | 0620ab0 | wesleycrouse | 2022-11-14 | adding report for PMR |
| html | 0620ab0 | wesleycrouse | 2022-11-14 | adding report for PMR |
PMR with SNPs +/-100kb gene body
PMR using eQTL summary statistics for all variants from GTEx. Analyzed all genes included in the FUSION weights, matched to summary statistics using ensembl IDs.
This analysis used only variants +/-100kb from the gene body, which was the approach used in the PMR paper real data analysis. The full GTEx data includes variants +/-1mb of gene TSS.
library(data.table)

#load weight names
weightf <- "/project2/mstephens/causalTWAS/fusion_weights/Adipose_Subcutaneous.pos"
weights <- as.data.frame(fread(weightf, header = T))
weights$ENSEMBL_ID <- sapply(weights$WGT, function(x){unlist(strsplit(unlist(strsplit(x,"/"))[2], "[.]"))[2]})

####################

results_df <- data.frame(simutag=as.character(),
                         n_causal=as.integer(),
                         n_genes=as.integer(),
                         n_zero_snps=as.integer(),
                         n_chol_error=as.integer(),
                         n_other_error=as.integer(),
                         n_below_h2_thresh=as.integer(),
                         n_analyzed=as.integer(),
                         n_sig=as.integer(),
                         n_true_positive=as.integer(),
                         n_causal_in_gene_list=as.integer(),
                         n_causal_analyzed_or_below_h2_thresh=as.integer(),
                         n_causal_analyzed=as.integer())

simutag_list <- c("4-1", "4-2", "4-3", "4-4", "4-5")
#simutag_list <- c("10-1", "10-2", "10-3", "10-4", "10-5")

####################

#results_dir <- "/project2/mstephens/causalTWAS/simulations/simulation_ctwas_rss_20210416_compare/"
results_dir <- "~/PMR_bkup/"

alpha <- 0.05

for (simutag in simutag_list){
  load(paste0("/home/wcrouse/causalTWAS/simulations/simulation_ctwas_rss_20210416/ukb-s80.45-adi_simu", simutag, "-pheno.Rd"))

  true_genes <- unlist(sapply(1:22, function(x){phenores$batch[[x]]$id.cgene}))
  true_genes <- weights$ENSEMBL_ID[match(true_genes, weights$ID)]

  n_causal <- length(true_genes)

  ##########
  #pmr_results <- as.data.frame(data.table::fread(paste0("/project2/mstephens/causalTWAS/simulations/simulation_ctwas_rss_20210416_compare/ukb-s80.45-adi_simu", simutag, ".Adipose_Subcutaneous.pmr.result")))

  results_files <- list.files(results_dir)
  results_files <- results_files[grep("_temp", results_files)]
  results_files <- results_files[grep("batch", results_files)]
  results_files <- results_files[grep("100kb", results_files)]
  results_files <- results_files[-grep("lambda", results_files)]
  results_files <- paste0(results_dir, results_files)
  results_files <- results_files[grep(simutag, results_files)]
  pmr_results <- lapply(results_files, function(x){as.data.frame(fread(x, header=T))})
  pmr_results <- do.call(rbind, pmr_results)

  # write.table(pmr_results,
  #             file=paste0("/project2/mstephens/causalTWAS/simulations/simulation_ctwas_rss_20210416_compare/ukb-s80.45-adi_simu", simutag, ".Adipose_Subcutaneous.pmr.result_100kb"),
  #             col.names=T,
  #             row.names=F)

  ##########

  n_genes <- nrow(pmr_results)
  n_zero_snps <- sum(pmr_results$nsnps==0)
  n_chol_error <- sum(pmr_results$pmr_message=="chol(): decomposition failed")
  n_other_error <- sum(pmr_results$pmr_message!="chol(): decomposition failed" & pmr_results$pmr_message!="")
  n_below_h2_thresh <- sum(!is.na(pmr_results$causal_effect) & is.na(pmr_results$causal_pvalue))
  n_analyzed <- sum(!is.na(pmr_results$causal_pvalue))

  sig_thresh <- alpha/n_analyzed

  n_sig <- sum(pmr_results$causal_pvalue < sig_thresh, na.rm=T)
  n_true_positive <- sum(pmr_results$gene_id %in% true_genes & pmr_results$causal_pvalue < sig_thresh, na.rm=T)

  n_causal_in_gene_list <- sum(pmr_results$gene_id %in% true_genes)
  n_causal_analyzed_or_below_h2_thresh <- sum(pmr_results$gene_id %in% true_genes & !is.na(pmr_results$causal_effect))
  n_causal_analyzed <- sum(pmr_results$gene_id %in% true_genes & !is.na(pmr_results$causal_pvalue))

  results_current <- data.frame(simutag=simutag,
                                n_causal=n_causal,
                                n_genes=n_genes,
                                n_zero_snps=n_zero_snps,
                                n_chol_error=n_chol_error,
                                n_other_error=n_other_error,
                                n_below_h2_thresh=n_below_h2_thresh,
                                n_analyzed=n_analyzed,
                                n_sig=n_sig,
                                n_true_positive=n_true_positive,
                                n_causal_in_gene_list=n_causal_in_gene_list,
                                n_causal_analyzed_or_below_h2_thresh=n_causal_analyzed_or_below_h2_thresh,
                                n_causal_analyzed=n_causal_analyzed)

  results_df <- rbind(results_df, results_current)
}

results_df$percent_tp <- results_df$n_true_positive/results_df$n_sig

####################
#summary of PMR results for each simulation
results_df[,c(colnames(results_df)[1:10], "percent_tp")]
simutag n_causal n_genes n_zero_snps n_chol_error n_other_error
1 4-1 106 8192 33 6858 52
2 4-2 105 8192 33 6863 52
3 4-3 136 8192 33 6866 52
4 4-4 132 8192 33 6861 52
5 4-5 123 8192 33 6871 52
n_below_h2_thresh n_analyzed n_sig n_true_positive percent_tp
1 40 1209 29 6 0.2068966
2 39 1205 37 4 0.1081081
3 41 1200 43 7 0.1627907
4 39 1207 48 3 0.0625000
5 40 1196 40 5 0.1250000#averaging over simulations
colMeans(results_df[,colnames(results_df)[2:10]]) n_causal n_genes n_zero_snps n_chol_error
120.4 8192.0 33.0 6863.8
n_other_error n_below_h2_thresh n_analyzed n_sig
52.0 39.8 1203.4 39.4
n_true_positive
5.0 #statistics for causal genes
results_df[,colnames(results_df)[c(1:2,11:13,10)]] simutag n_causal n_causal_in_gene_list
1 4-1 106 106
2 4-2 105 105
3 4-3 136 136
4 4-4 132 132
5 4-5 123 123
n_causal_analyzed_or_below_h2_thresh n_causal_analyzed n_true_positive
1 22 22 6
2 20 20 4
3 23 22 7
4 22 22 3
5 16 15 5PMR with SNPs +/-500kb of gene TSS
#results_dir <- "/project2/mstephens/causalTWAS/simulations/simulation_ctwas_rss_20210416_compare/"
results_dir <- "~/PMR_bkup/"
#load weight names
weightf <- "/project2/mstephens/causalTWAS/fusion_weights/Adipose_Subcutaneous.pos"
weights <- as.data.frame(fread(weightf, header = T))
weights$ENSEMBL_ID <- sapply(weights$WGT, function(x){unlist(strsplit(unlist(strsplit(x,"/"))[2], "[.]"))[2]})
####################
results_df <- data.frame(simutag=as.character(),
n_causal=as.integer(),
n_genes=as.integer(),
n_zero_snps=as.integer(),
n_chol_error=as.integer(),
n_other_error=as.integer(),
n_below_h2_thresh=as.integer(),
n_analyzed=as.integer(),
n_sig=as.integer(),
n_true_positive=as.integer(),
n_causal_in_gene_list=as.integer(),
n_causal_analyzed_or_below_h2_thresh=as.integer(),
n_causal_analyzed=as.integer())
simutag_list <- c("4-1", "4-2", "4-3", "4-4", "4-5")
#simutag_list <- c("10-1", "10-2", "10-3", "10-4", "10-5")
####################
alpha <- 0.05
for (simutag in simutag_list){
load(paste0("/home/wcrouse/causalTWAS/simulations/simulation_ctwas_rss_20210416/ukb-s80.45-adi_simu", simutag, "-pheno.Rd"))
true_genes <- unlist(sapply(1:22, function(x){phenores$batch[[x]]$id.cgene}))
true_genes <- weights$ENSEMBL_ID[match(true_genes, weights$ID)]
n_causal <- length(true_genes)
results_files <- list.files(results_dir)
results_files <- results_files[grep("_temp", results_files)]
results_files <- results_files[grep("batch", results_files)]
results_files <- results_files[grep("500", results_files)]
results_files <- paste0(results_dir, results_files)
results_files <- results_files[grep(simutag, results_files)]
pmr_results <- lapply(results_files, function(x){as.data.frame(fread(x, header=T))})
pmr_results <- do.call(rbind, pmr_results)
n_genes <- nrow(pmr_results)
n_zero_snps <- sum(pmr_results$nsnps==0)
n_chol_error <- sum(pmr_results$pmr_message=="chol(): decomposition failed")
n_other_error <- sum(pmr_results$pmr_message!="chol(): decomposition failed" & pmr_results$pmr_message!="")
n_below_h2_thresh <- sum(!is.na(pmr_results$causal_effect) & is.na(pmr_results$causal_pvalue))
n_analyzed <- sum(!is.na(pmr_results$causal_pvalue))
sig_thresh <- alpha/n_analyzed
n_sig <- sum(pmr_results$causal_pvalue < sig_thresh, na.rm=T)
n_true_positive <- sum(pmr_results$gene_id %in% true_genes & pmr_results$causal_pvalue < sig_thresh, na.rm=T)
n_causal_in_gene_list <- sum(pmr_results$gene_id %in% true_genes)
n_causal_analyzed_or_below_h2_thresh <- sum(pmr_results$gene_id %in% true_genes & !is.na(pmr_results$causal_effect))
n_causal_analyzed <- sum(pmr_results$gene_id %in% true_genes & !is.na(pmr_results$causal_pvalue))
results_current <- data.frame(simutag=simutag,
n_causal=n_causal,
n_genes=n_genes,
n_zero_snps=n_zero_snps,
n_chol_error=n_chol_error,
n_other_error=n_other_error,
n_below_h2_thresh=n_below_h2_thresh,
n_analyzed=n_analyzed,
n_sig=n_sig,
n_true_positive=n_true_positive,
n_causal_in_gene_list=n_causal_in_gene_list,
n_causal_analyzed_or_below_h2_thresh=n_causal_analyzed_or_below_h2_thresh,
n_causal_analyzed=n_causal_analyzed)
results_df <- rbind(results_df, results_current)
}
results_df$percent_tp <- results_df$n_true_positive/results_df$n_sig
####################
#summary of PMR results for each simulation
results_df[,c(colnames(results_df)[1:10], "percent_tp")] simutag n_causal n_genes n_zero_snps n_chol_error n_other_error
1 4-1 106 8160 0 6393 245
2 4-2 105 8160 0 6399 245
3 4-3 136 8160 0 6386 245
4 4-4 132 8160 0 6394 245
5 4-5 123 8160 0 6403 245
n_below_h2_thresh n_analyzed n_sig n_true_positive percent_tp
1 23 1499 76 7 0.09210526
2 18 1498 103 5 0.04854369
3 19 1510 108 6 0.05555556
4 13 1508 91 7 0.07692308
5 20 1492 87 10 0.11494253#averaging over simulations
colMeans(results_df[,colnames(results_df)[2:10]]) n_causal n_genes n_zero_snps n_chol_error
120.4 8160.0 0.0 6395.0
n_other_error n_below_h2_thresh n_analyzed n_sig
245.0 18.6 1501.4 93.0
n_true_positive
7.0 #statistics for causal genes
results_df[,colnames(results_df)[c(1:2,11:13,10)]] simutag n_causal n_causal_in_gene_list
1 4-1 106 106
2 4-2 105 105
3 4-3 136 136
4 4-4 132 130
5 4-5 123 123
n_causal_analyzed_or_below_h2_thresh n_causal_analyzed n_true_positive
1 20 20 7
2 20 20 5
3 24 24 6
4 19 19 7
5 29 29 10PMR with SNPs +/-1mb of gene TSS
#results_dir <- "/project2/mstephens/causalTWAS/simulations/simulation_ctwas_rss_20210416_compare/"
results_dir <- "~/PMR_bkup/"
#load weight names
weightf <- "/project2/mstephens/causalTWAS/fusion_weights/Adipose_Subcutaneous.pos"
weights <- as.data.frame(fread(weightf, header = T))
weights$ENSEMBL_ID <- sapply(weights$WGT, function(x){unlist(strsplit(unlist(strsplit(x,"/"))[2], "[.]"))[2]})
####################
results_df <- data.frame(simutag=as.character(),
n_causal=as.integer(),
n_genes=as.integer(),
n_zero_snps=as.integer(),
n_chol_error=as.integer(),
n_other_error=as.integer(),
n_below_h2_thresh=as.integer(),
n_analyzed=as.integer(),
n_sig=as.integer(),
n_true_positive=as.integer(),
n_causal_in_gene_list=as.integer(),
n_causal_analyzed_or_below_h2_thresh=as.integer(),
n_causal_analyzed=as.integer())
simutag_list <- c("4-1")
####################
alpha <- 0.05
for (simutag in simutag_list){
load(paste0("/home/wcrouse/causalTWAS/simulations/simulation_ctwas_rss_20210416/ukb-s80.45-adi_simu", simutag, "-pheno.Rd"))
true_genes <- unlist(sapply(1:22, function(x){phenores$batch[[x]]$id.cgene}))
true_genes <- weights$ENSEMBL_ID[match(true_genes, weights$ID)]
n_causal <- length(true_genes)
results_files <- list.files(results_dir)
results_files <- results_files[grep("_temp", results_files)]
results_files <- results_files[grep("batch", results_files)]
results_files <- results_files[-grep("100", results_files)]
results_files <- results_files[-grep("500", results_files)]
results_files <- paste0(results_dir, results_files)
results_files <- results_files[grep(simutag, results_files)]
pmr_results <- lapply(results_files, function(x){as.data.frame(fread(x, header=T))})
pmr_results <- do.call(rbind, pmr_results)
n_genes <- nrow(pmr_results)
n_zero_snps <- sum(pmr_results$nsnps==0)
n_chol_error <- sum(pmr_results$pmr_message=="chol(): decomposition failed")
n_other_error <- sum(pmr_results$pmr_message!="chol(): decomposition failed" & pmr_results$pmr_message!="")
n_below_h2_thresh <- sum(!is.na(pmr_results$causal_effect) & is.na(pmr_results$causal_pvalue))
n_analyzed <- sum(!is.na(pmr_results$causal_pvalue))
sig_thresh <- alpha/n_analyzed
n_sig <- sum(pmr_results$causal_pvalue < sig_thresh, na.rm=T)
n_true_positive <- sum(pmr_results$gene_id %in% true_genes & pmr_results$causal_pvalue < sig_thresh, na.rm=T)
n_causal_in_gene_list <- sum(pmr_results$gene_id %in% true_genes)
n_causal_analyzed_or_below_h2_thresh <- sum(pmr_results$gene_id %in% true_genes & !is.na(pmr_results$causal_effect))
n_causal_analyzed <- sum(pmr_results$gene_id %in% true_genes & !is.na(pmr_results$causal_pvalue))
results_current <- data.frame(simutag=simutag,
n_causal=n_causal,
n_genes=n_genes,
n_zero_snps=n_zero_snps,
n_chol_error=n_chol_error,
n_other_error=n_other_error,
n_below_h2_thresh=n_below_h2_thresh,
n_analyzed=n_analyzed,
n_sig=n_sig,
n_true_positive=n_true_positive,
n_causal_in_gene_list=n_causal_in_gene_list,
n_causal_analyzed_or_below_h2_thresh=n_causal_analyzed_or_below_h2_thresh,
n_causal_analyzed=n_causal_analyzed)
results_df <- rbind(results_df, results_current)
}
results_df$percent_tp <- results_df$n_true_positive/results_df$n_sig
####################
#summary of PMR results for each simulation
results_df[,c(colnames(results_df)[1:10], "percent_tp")]
#averaging over simulations
colMeans(results_df[,colnames(results_df)[2:10]])
#statistics for causal genes
results_df[,colnames(results_df)[c(1:2,11:13,10)]]PMR with SNPs +/-100kb gene body and lambda=0.15
PMR using eQTL summary statistics for all variants from GTEx. Analyzed all genes included in the FUSION weights, matched to summary statistics using ensembl IDs.
This analysis used only variants +/-100kb from the gene body, which was the approach used in the PMR paper real data analysis. The full GTEx data includes variants +/-1mb of gene TSS.
library(data.table)

#load weight names
weightf <- "/project2/mstephens/causalTWAS/fusion_weights/Adipose_Subcutaneous.pos"
weights <- as.data.frame(fread(weightf, header = T))
weights$ENSEMBL_ID <- sapply(weights$WGT, function(x){unlist(strsplit(unlist(strsplit(x,"/"))[2], "[.]"))[2]})

####################

results_df <- data.frame(simutag=as.character(),
                         n_causal=as.integer(),
                         n_genes=as.integer(),
                         n_zero_snps=as.integer(),
                         n_chol_error=as.integer(),
                         n_other_error=as.integer(),
                         n_below_h2_thresh=as.integer(),
                         n_analyzed=as.integer(),
                         n_sig=as.integer(),
                         n_true_positive=as.integer(),
                         n_causal_in_gene_list=as.integer(),
                         n_causal_analyzed_or_below_h2_thresh=as.integer(),
                         n_causal_analyzed=as.integer())

simutag_list <- c("4-1")

####################

#results_dir <- "/project2/mstephens/causalTWAS/simulations/simulation_ctwas_rss_20210416_compare/"
results_dir <- "~/PMR_bkup/"

alpha <- 0.05

for (simutag in simutag_list){
  load(paste0("/home/wcrouse/causalTWAS/simulations/simulation_ctwas_rss_20210416/ukb-s80.45-adi_simu", simutag, "-pheno.Rd"))

  true_genes <- unlist(sapply(1:22, function(x){phenores$batch[[x]]$id.cgene}))
  true_genes <- weights$ENSEMBL_ID[match(true_genes, weights$ID)]

  n_causal <- length(true_genes)

  ##########
  #pmr_results <- as.data.frame(data.table::fread(paste0("/project2/mstephens/causalTWAS/simulations/simulation_ctwas_rss_20210416_compare/ukb-s80.45-adi_simu", simutag, ".Adipose_Subcutaneous.pmr.result")))

  results_files <- list.files(results_dir)
  results_files <- results_files[grep("_temp", results_files)]
  results_files <- results_files[grep("batch", results_files)]
  results_files <- results_files[grep("100", results_files)]
  results_files <- results_files[grep("lambda", results_files)]
  results_files <- paste0(results_dir, results_files)
  results_files <- results_files[grep(simutag, results_files)]
  pmr_results <- lapply(results_files, function(x){as.data.frame(fread(x, header=T))})
  pmr_results <- do.call(rbind, pmr_results)

  ##########

  n_genes <- nrow(pmr_results)
  n_zero_snps <- sum(pmr_results$nsnps==0)
  n_chol_error <- sum(pmr_results$pmr_message=="chol(): decomposition failed")
  n_other_error <- sum(pmr_results$pmr_message!="chol(): decomposition failed" & pmr_results$pmr_message!="")
  n_below_h2_thresh <- sum(!is.na(pmr_results$causal_effect) & is.na(pmr_results$causal_pvalue))
  n_analyzed <- sum(!is.na(pmr_results$causal_pvalue))

  sig_thresh <- alpha/n_analyzed

  n_sig <- sum(pmr_results$causal_pvalue < sig_thresh, na.rm=T)
  n_true_positive <- sum(pmr_results$gene_id %in% true_genes & pmr_results$causal_pvalue < sig_thresh, na.rm=T)

  n_causal_in_gene_list <- sum(pmr_results$gene_id %in% true_genes)
  n_causal_analyzed_or_below_h2_thresh <- sum(pmr_results$gene_id %in% true_genes & !is.na(pmr_results$causal_effect))
  n_causal_analyzed <- sum(pmr_results$gene_id %in% true_genes & !is.na(pmr_results$causal_pvalue))

  results_current <- data.frame(simutag=simutag,
                                n_causal=n_causal,
                                n_genes=n_genes,
                                n_zero_snps=n_zero_snps,
                                n_chol_error=n_chol_error,
                                n_other_error=n_other_error,
                                n_below_h2_thresh=n_below_h2_thresh,
                                n_analyzed=n_analyzed,
                                n_sig=n_sig,
                                n_true_positive=n_true_positive,
                                n_causal_in_gene_list=n_causal_in_gene_list,
                                n_causal_analyzed_or_below_h2_thresh=n_causal_analyzed_or_below_h2_thresh,
                                n_causal_analyzed=n_causal_analyzed)

  results_df <- rbind(results_df, results_current)
}

results_df$percent_tp <- results_df$n_true_positive/results_df$n_sig

####################
#summary of PMR results for each simulation
results_df[,c(colnames(results_df)[1:10], "percent_tp")]
simutag n_causal n_genes n_zero_snps n_chol_error n_other_error
1 4-1 106 8121 33 6759 70
n_below_h2_thresh n_analyzed n_sig n_true_positive percent_tp
1 41 1218 31 7 0.2258065#averaging over simulations
colMeans(results_df[,colnames(results_df)[2:10]]) n_causal n_genes n_zero_snps n_chol_error
106 8121 33 6759
n_other_error n_below_h2_thresh n_analyzed n_sig
70 41 1218 31
n_true_positive
7 #statistics for causal genes
results_df[,colnames(results_df)[c(1:2,11:13,10)]] simutag n_causal n_causal_in_gene_list
1 4-1 106 106
n_causal_analyzed_or_below_h2_thresh n_causal_analyzed n_true_positive
1 22 22 7PMR with SNPs +/-100kb gene body and different values of lambda
library(data.table)

#load weight names
weightf <- "/project2/mstephens/causalTWAS/fusion_weights/Adipose_Subcutaneous.pos"
weights <- as.data.frame(fread(weightf, header = T))
weights$ENSEMBL_ID <- sapply(weights$WGT, function(x){unlist(strsplit(unlist(strsplit(x,"/"))[2], "[.]"))[2]})

####################

results_df <- data.frame(lambda=as.character(),
                         simutag=as.character(),
                         n_causal=as.integer(),
                         n_genes=as.integer(),
                         n_zero_snps=as.integer(),
                         n_chol_error=as.integer(),
                         n_other_error=as.integer(),
                         n_below_h2_thresh=as.integer(),
                         n_analyzed=as.integer(),
                         n_sig=as.integer(),
                         n_true_positive=as.integer(),
                         n_causal_in_gene_list=as.integer(),
                         n_causal_analyzed_or_below_h2_thresh=as.integer(),
                         n_causal_analyzed=as.integer())

simutag_list <- c("4-1")

####################

lambda_list <- c("025","050","075")

for (lambda in lambda_list){
  results_dir <- "/project2/mstephens/causalTWAS/simulations/simulation_ctwas_rss_20210416_compare/"

  alpha <- 0.05

  for (simutag in simutag_list){
    load(paste0("/home/wcrouse/causalTWAS/simulations/simulation_ctwas_rss_20210416/ukb-s80.45-adi_simu", simutag, "-pheno.Rd"))

    true_genes <- unlist(sapply(1:22, function(x){phenores$batch[[x]]$id.cgene}))
    true_genes <- weights$ENSEMBL_ID[match(true_genes, weights$ID)]

    n_causal <- length(true_genes)

    ##########

    results_files <- list.files(results_dir)
    results_files <- results_files[grep("_temp", results_files)]
    results_files <- results_files[grep("batch", results_files)]
    results_files <- results_files[grep(paste0("lambda_",lambda), results_files)]
    results_files <- paste0(results_dir, results_files)
    results_files <- results_files[grep(simutag, results_files)]
    pmr_results <- lapply(results_files, function(x){as.data.frame(fread(x, header=T))})
    pmr_results <- do.call(rbind, pmr_results)

    ##########

    n_genes <- nrow(pmr_results)
    n_zero_snps <- sum(pmr_results$nsnps==0)
    n_chol_error <- sum(pmr_results$pmr_message=="chol(): decomposition failed")
    n_other_error <- sum(pmr_results$pmr_message!="chol(): decomposition failed" & pmr_results$pmr_message!="")
    n_below_h2_thresh <- sum(!is.na(pmr_results$causal_effect) & is.na(pmr_results$causal_pvalue))
    n_analyzed <- sum(!is.na(pmr_results$causal_pvalue))

    sig_thresh <- alpha/n_analyzed

    n_sig <- sum(pmr_results$causal_pvalue < sig_thresh, na.rm=T)
    n_true_positive <- sum(pmr_results$gene_id %in% true_genes & pmr_results$causal_pvalue < sig_thresh, na.rm=T)

    n_causal_in_gene_list <- sum(pmr_results$gene_id %in% true_genes)
    n_causal_analyzed_or_below_h2_thresh <- sum(pmr_results$gene_id %in% true_genes & !is.na(pmr_results$causal_effect))
    n_causal_analyzed <- sum(pmr_results$gene_id %in% true_genes & !is.na(pmr_results$causal_pvalue))

    results_current <- data.frame(lambda=lambda,
                                  simutag=simutag,
                                  n_causal=n_causal,
                                  n_genes=n_genes,
                                  n_zero_snps=n_zero_snps,
                                  n_chol_error=n_chol_error,
                                  n_other_error=n_other_error,
                                  n_below_h2_thresh=n_below_h2_thresh,
                                  n_analyzed=n_analyzed,
                                  n_sig=n_sig,
                                  n_true_positive=n_true_positive,
                                  n_causal_in_gene_list=n_causal_in_gene_list,
                                  n_causal_analyzed_or_below_h2_thresh=n_causal_analyzed_or_below_h2_thresh,
                                  n_causal_analyzed=n_causal_analyzed)

    results_df <- rbind(results_df, results_current)
  }
}

results_df$percent_tp <- results_df$n_true_positive/results_df$n_sig

####################
#summary of PMR results for each simulation
results_df[,c(colnames(results_df)[1:11], "percent_tp")]
lambda simutag n_causal n_genes n_zero_snps n_chol_error n_other_error
1 025 4-1 106 8126 33 6747 86
2 050 4-1 106 8105 33 6768 41
3 075 4-1 106 8192 33 6835 52
n_below_h2_thresh n_analyzed n_sig n_true_positive percent_tp
1 41 1219 34 7 0.2058824
2 44 1219 72 10 0.1388889
3 52 1220 117 14 0.1196581#statistics for causal genes
results_df[,colnames(results_df)[c(1:3,12:14,11)]] lambda simutag n_causal n_causal_in_gene_list
1 025 4-1 106 104
2 050 4-1 106 106
3 075 4-1 106 106
n_causal_analyzed_or_below_h2_thresh n_causal_analyzed n_true_positive
1 22 22 7
2 22 22 10
3 22 22 14PMR with SNPs +/-100kb gene body and different values of pi
library(data.table)

#load weight names
weightf <- "/project2/mstephens/causalTWAS/fusion_weights/Adipose_Subcutaneous.pos"
weights <- as.data.frame(fread(weightf, header = T))
weights$ENSEMBL_ID <- sapply(weights$WGT, function(x){unlist(strsplit(unlist(strsplit(x,"/"))[2], "[.]"))[2]})

####################

results_df <- data.frame(pi=as.character(),
                         simutag=as.character(),
                         n_causal=as.integer(),
                         n_genes=as.integer(),
                         n_zero_snps=as.integer(),
                         n_chol_error=as.integer(),
                         n_other_error=as.integer(),
                         n_below_h2_thresh=as.integer(),
                         n_analyzed=as.integer(),
                         n_sig=as.integer(),
                         n_true_positive=as.integer(),
                         n_causal_in_gene_list=as.integer(),
                         n_causal_analyzed_or_below_h2_thresh=as.integer(),
                         n_causal_analyzed=as.integer())

simutag_list <- c("4-1", "4-2", "4-3", "4-4", "4-5")

####################

pi_list <- c("099","090","080")

for (pi in pi_list){
  results_dir <- "/project2/mstephens/causalTWAS/simulations/simulation_ctwas_rss_20210416_compare/"

  alpha <- 0.05

  for (simutag in simutag_list){
    load(paste0("/home/wcrouse/causalTWAS/simulations/simulation_ctwas_rss_20210416/ukb-s80.45-adi_simu", simutag, "-pheno.Rd"))

    true_genes <- unlist(sapply(1:22, function(x){phenores$batch[[x]]$id.cgene}))
    true_genes <- weights$ENSEMBL_ID[match(true_genes, weights$ID)]

    n_causal <- length(true_genes)

    ##########

    results_files <- list.files(results_dir)
    results_files <- results_files[grep("_temp", results_files)]
    results_files <- results_files[grep("batch", results_files)]
    results_files <- results_files[grep(paste0("pi_",pi), results_files)]
    results_files <- paste0(results_dir, results_files)
    results_files <- results_files[grep(simutag, results_files)]
    pmr_results <- lapply(results_files, function(x){as.data.frame(fread(x, header=T))})
    pmr_results <- do.call(rbind, pmr_results)

    ##########

    n_genes <- nrow(pmr_results)
    n_zero_snps <- sum(pmr_results$nsnps==0)
    n_chol_error <- sum(pmr_results$pmr_message=="chol(): decomposition failed")
    n_other_error <- sum(pmr_results$pmr_message!="chol(): decomposition failed" & pmr_results$pmr_message!="")
    n_below_h2_thresh <- sum(!is.na(pmr_results$causal_effect) & is.na(pmr_results$causal_pvalue))
    n_analyzed <- sum(!is.na(pmr_results$causal_pvalue))

    sig_thresh <- alpha/n_analyzed

    n_sig <- sum(pmr_results$causal_pvalue < sig_thresh, na.rm=T)
    n_true_positive <- sum(pmr_results$gene_id %in% true_genes & pmr_results$causal_pvalue < sig_thresh, na.rm=T)

    n_causal_in_gene_list <- sum(pmr_results$gene_id %in% true_genes)
    n_causal_analyzed_or_below_h2_thresh <- sum(pmr_results$gene_id %in% true_genes & !is.na(pmr_results$causal_effect))
    n_causal_analyzed <- sum(pmr_results$gene_id %in% true_genes & !is.na(pmr_results$causal_pvalue))

    results_current <- data.frame(pi=pi,
                                  simutag=simutag,
                                  n_causal=n_causal,
                                  n_genes=n_genes,
                                  n_zero_snps=n_zero_snps,
                                  n_chol_error=n_chol_error,
                                  n_other_error=n_other_error,
                                  n_below_h2_thresh=n_below_h2_thresh,
                                  n_analyzed=n_analyzed,
                                  n_sig=n_sig,
                                  n_true_positive=n_true_positive,
                                  n_causal_in_gene_list=n_causal_in_gene_list,
                                  n_causal_analyzed_or_below_h2_thresh=n_causal_analyzed_or_below_h2_thresh,
                                  n_causal_analyzed=n_causal_analyzed)

    results_df <- rbind(results_df, results_current)
  }
}

results_df$percent_tp <- results_df$n_true_positive/results_df$n_sig

####################
#summary of PMR results for each simulation
results_df[,c(colnames(results_df)[1:11], "percent_tp")]
pi simutag n_causal n_genes n_zero_snps n_chol_error n_other_error
1 099 4-1 106 8192 33 6441 53
2 099 4-2 105 8192 33 6440 53
3 099 4-3 136 8192 33 6440 53
4 099 4-4 132 8192 33 6439 53
5 099 4-5 123 8192 33 6437 53
6 090 4-1 106 8192 33 2376 63
7 090 4-2 105 8192 33 2378 63
8 090 4-3 136 8192 33 2375 63
9 090 4-4 132 8192 33 2376 63
10 090 4-5 123 8192 33 2378 63
11 080 4-1 106 8192 33 1519 74
12 080 4-2 105 8192 33 1520 74
13 080 4-3 136 8192 33 1520 74
14 080 4-4 132 8192 33 1520 74
15 080 4-5 123 8192 33 1520 74
n_below_h2_thresh n_analyzed n_sig n_true_positive percent_tp
1 40 1625 39 7 0.17948718
2 39 1627 41 4 0.09756098
3 41 1625 56 9 0.16071429
4 39 1628 46 3 0.06521739
5 40 1629 48 7 0.14583333
6 52 5668 104 11 0.10576923
7 51 5667 111 16 0.14414414
8 52 5669 122 22 0.18032787
9 50 5670 140 16 0.11428571
10 53 5665 132 15 0.11363636
11 57 6509 127 13 0.10236220
12 56 6509 123 17 0.13821138
13 57 6508 145 27 0.18620690
14 54 6511 159 22 0.13836478
15 53 6512 162 22 0.13580247#statistics for causal genes
results_df[,colnames(results_df)[c(1:3,12:14,11)]] pi simutag n_causal n_causal_in_gene_list
1 099 4-1 106 106
2 099 4-2 105 105
3 099 4-3 136 136
4 099 4-4 132 132
5 099 4-5 123 123
6 090 4-1 106 106
7 090 4-2 105 105
8 090 4-3 136 136
9 090 4-4 132 132
10 090 4-5 123 123
11 080 4-1 106 106
12 080 4-2 105 105
13 080 4-3 136 136
14 080 4-4 132 132
15 080 4-5 123 123
n_causal_analyzed_or_below_h2_thresh n_causal_analyzed n_true_positive
1 25 25 7
2 27 27 4
3 26 25 9
4 25 25 3
5 25 24 7
6 67 67 11
7 77 76 16
8 95 94 22
9 86 86 16
10 87 86 15
11 78 78 13
12 86 85 17
13 107 106 27
14 103 103 22
15 101 100 22Compare results with Sheng’s analysis
#load weight names
weightf <- "/project2/mstephens/causalTWAS/fusion_weights/Adipose_Subcutaneous.pos"
weights <- as.data.frame(fread(weightf, header = T))
weights$ENSEMBL_ID <- sapply(weights$WGT, function(x){unlist(strsplit(unlist(strsplit(x,"/"))[2], "[.]"))[2]})

####################

#results_dir <- "/project2/mstephens/causalTWAS/simulations/simulation_ctwas_rss_20210416_compare/"
results_dir <- "~/PMR_bkup/"

simutag <- "4-1"

load(paste0("/home/wcrouse/causalTWAS/simulations/simulation_ctwas_rss_20210416/ukb-s80.45-adi_simu", simutag, "-pheno.Rd"))

true_genes <- unlist(sapply(1:22, function(x){phenores$batch[[x]]$id.cgene}))
true_genes <- weights$ENSEMBL_ID[match(true_genes, weights$ID)]

n_causal <- length(true_genes)

results_files <- list.files(results_dir)
results_files <- results_files[grep("_temp", results_files)]
results_files <- results_files[grep("batch", results_files)]
results_files <- results_files[grep("100", results_files)]
results_files <- results_files[-grep("lambda", results_files)]
results_files <- paste0(results_dir, results_files)
results_files <- results_files[grep(simutag, results_files)]
pmr_results <- lapply(results_files, function(x){as.data.frame(fread(x, header=T))})
pmr_results <- do.call(rbind, pmr_results)

####################

results_dir <- "/project2/xinhe/shengqian/cTWAS/PMR/"

simutag <- "4_1"

sheng_results <- read.table(paste0(results_dir, "causalP_", simutag, ".txt"), sep=":")
colnames(sheng_results) <- c("gene_id", "causal_pvalue", "causal_effect")

sheng_results <- sheng_results[sheng_results$gene_id %in% weights$ENSEMBL_ID,]


####################

df_both <- pmr_results[!is.na(pmr_results$causal_effect),c("gene_id", "causal_effect")]
df_both$causal_effect_sheng <- sheng_results$causal_effect[match(df_both$gene_id, sheng_results$gene_id)]

df_both <- df_both[!is.na(df_both$causal_effect_sheng),]


range(df_both$causal_effect)
[1] -2.237551 3.625878range(df_both$causal_effect_sheng)[1] -9.2210596 0.9914207range(df_both$causal_effect_sheng, na.rm=T)[1] -9.2210596 0.9914207cor(df_both$causal_effect, df_both$causal_effect_sheng)[1] 0.102045plot(df_both$causal_effect, df_both$causal_effect_sheng)
abline(a=0, b=-1)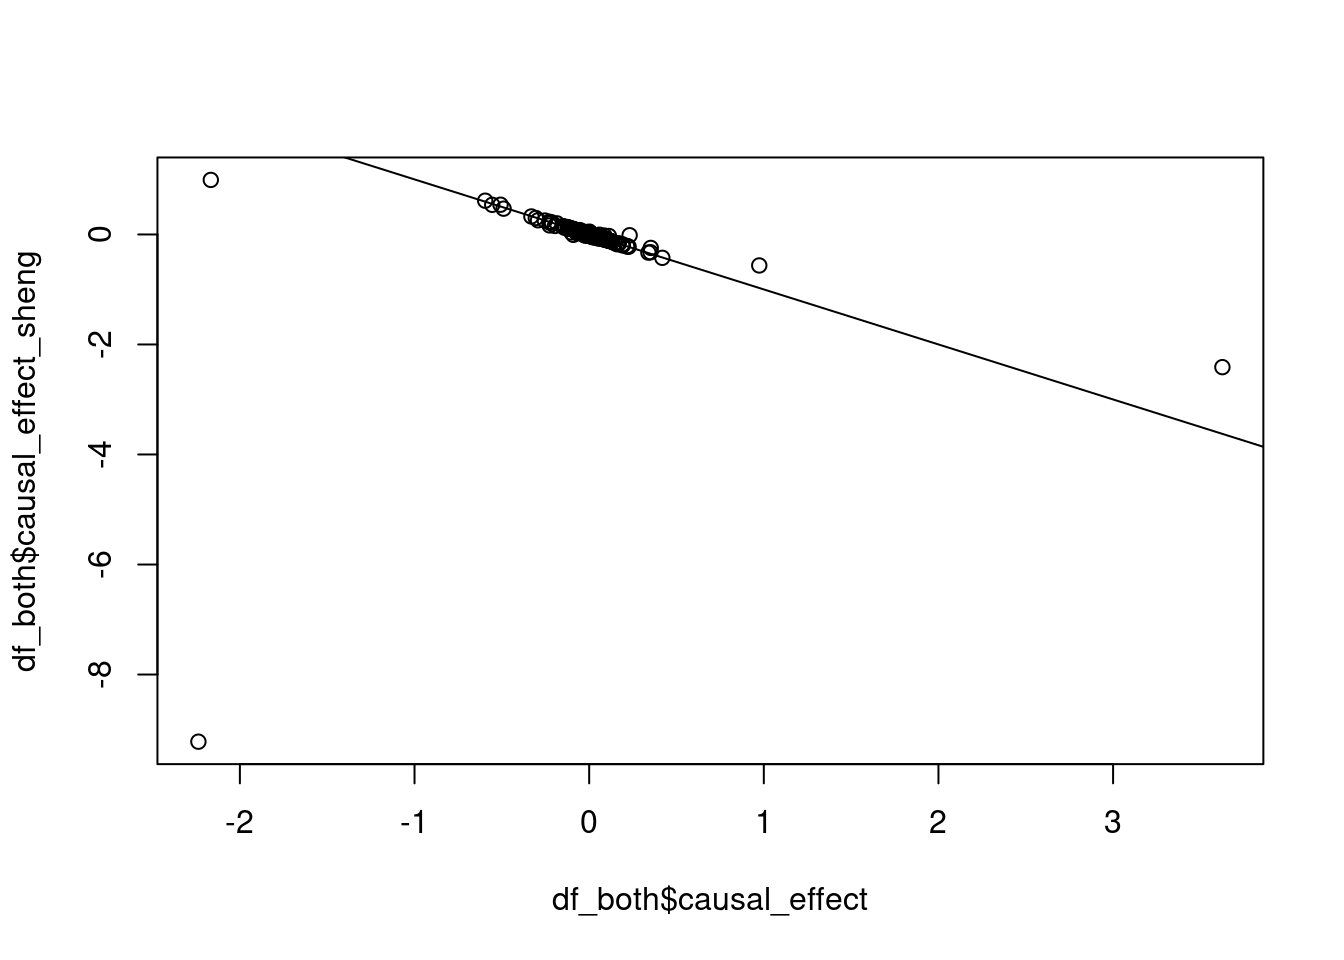
| Version | Author | Date |
|---|---|---|
| 182fce5 | wesleycrouse | 2022-11-29 |
#there's still one large outlier, but otherwise the results are highly correlated
#suspect that Sheng's is an outlier that gets fixed by harmonization
cor(df_both$causal_effect[df_both$causal_effect<1.5 & df_both$causal_effect>-1.5],
    df_both$causal_effect_sheng[df_both$causal_effect<1.5 & df_both$causal_effect>-1.5])
[1] -0.9714363Investigating results for a single simulation
#load weight names
weightf <- "/project2/mstephens/causalTWAS/fusion_weights/Adipose_Subcutaneous.pos"
weights <- as.data.frame(fread(weightf, header = T))
weights$ENSEMBL_ID <- sapply(weights$WGT, function(x){unlist(strsplit(unlist(strsplit(x,"/"))[2], "[.]"))[2]})

####################

results_dir <- "/project2/mstephens/causalTWAS/simulations/simulation_ctwas_rss_20210416_compare/"
simutag <- "4-1"

####################
#load true positive genes and SNPs from simulation

load(paste0("/home/wcrouse/causalTWAS/simulations/simulation_ctwas_rss_20210416/ukb-s80.45-adi_simu", simutag, "-pheno.Rd"))

true_genes <- unlist(sapply(1:22, function(x){phenores$batch[[x]]$id.cgene}))
true_genes <- weights$ENSEMBL_ID[match(true_genes, weights$ID)]
n_causal <- length(true_genes)
true_gene_effects <- unlist(sapply(1:22, function(x){phenores$batch[[x]]$e.beta}))
names(true_gene_effects) <- true_genes

true_snps <-  unlist(sapply(1:22, function(x){phenores$batch[[x]]$id.cSNP}))
true_snp_effects <- unlist(sapply(1:22, function(x){phenores$batch[[x]]$s.theta}))
names(true_snp_effects) <- true_snps

####################
#load the +/-100kb results

results_files <- list.files(results_dir)
results_files <- results_files[grep("_temp", results_files)]
results_files <- results_files[grep("batch", results_files)]
results_files <- results_files[grep(paste0("pi_080"), results_files)]
results_files <- paste0(results_dir, results_files)
results_files <- results_files[grep(simutag, results_files)]
pmr_results <- lapply(results_files, function(x){as.data.frame(fread(x, header=T))})
pmr_results <- do.call(rbind, pmr_results)


####################
#load the TWAS z scores

twas <- paste0("/project2/mstephens/causalTWAS/simulations/simulation_ctwas_rss_20210416_compare/ukb-s80.45-adi_simu", simutag, ".Adipose_Subcutaneous.coloc.result")
twas <- fread(twas, header = T)

twas$gene_id <- weights$ENSEMBL_ID[match(twas$ID, weights$ID)]

pmr_results$twas_p <- twas$TWAS.P[match(pmr_results$gene_id, twas$gene_id)]

# ####################
# #load GWAS
# gwas <- paste0("/project2/mstephens/causalTWAS/simulations/simulation_ctwas_rss_20210416/ukb-s80.45-adi_simu", simutag, ".snpgwas.txt.gz")
#
# #load GWAS
# gwas <- as.data.frame(fread(gwas, header = T))
#
# #rename z score
# gwas <- dplyr::rename(gwas, z="t.value")
#
# #drop variants that are non uniquely identified by ID
# gwas <- gwas[!(gwas$id %in% gwas$id[duplicated(gwas$id)]),]
#
# ####################
# #load eQTL data
#
# eqtl <- "/project2/mstephens/causalTWAS/GTEx_v7_all/Adipose_Subcutaneous.allpairs_processed.txt.gz"
#
# ####################
# #load eQTL; in GTEx, the eQTL effect allele is the ALT allele
# eqtl <- as.data.frame(fread(eqtl, header = T))
#
# #trim version number from ensembl IDs
# eqtl_gene_id_crosswalk <- unique(eqtl$gene_id)
# eqtl_gene_id_crosswalk <- data.frame(original=eqtl_gene_id_crosswalk,
#                                      trimmed=sapply(eqtl_gene_id_crosswalk, function(x){unlist(strsplit(x, "[.]"))[1]}))
# eqtl$gene_id <- eqtl_gene_id_crosswalk[eqtl$gene_id, "trimmed"]
# eqtl <- eqtl[, c("rs_id_dbSNP147_GRCh37p13", "gene_id", "gene_name", "ref", "alt", "slope", "slope_se", "pval_nominal")]
# eqtl <- dplyr::rename(eqtl, id="rs_id_dbSNP147_GRCh37p13")
#
# #drop genes without FUSION weights
# eqtl <- eqtl[eqtl$gene_id %in% weights$ENSEMBL_ID,]
#
# #drop entries not uniquely identified by gene_id and variant id (variant not biallelic)
# eqtl_unique_id_gene <- paste0(eqtl$id, eqtl$gene_id)
# eqtl <- eqtl[!(eqtl_unique_id_gene %in% eqtl_unique_id_gene[duplicated(eqtl_unique_id_gene)]),]
#
# #compute z score
# eqtl$z <- eqtl$slope/eqtl$slope_se
# eqtl <- eqtl[,!(colnames(eqtl) %in% c("slope", "slope_se", "pval_nominal"))]
#
# ####################
# ld_R_dir = "/project2/mstephens/causalTWAS/ukbiobank/ukb_LDR_s80.45/s80.45.2_LDR"
#
# #LD files
# ld_R_files <- paste0(ld_R_dir, "/", list.files(ld_R_dir))
# ld_R_files <- ld_R_files[grep(".RDS", ld_R_files)]
#
# ld_R_info_files <- paste0(ld_R_dir, "/", list.files(ld_R_dir))
# ld_R_info_files <- ld_R_info_files[grep(".Rvar", ld_R_info_files)]
#
# ld_R_info <- lapply(1:length(ld_R_info_files), function(x){y <- fread(ld_R_info_files[x]); y$index <- x; as.data.frame(y)})
# ld_R_info <- do.call(rbind, ld_R_info)
#
# ####################
# #subset to SNPs in all three datasets
# snplist <- intersect(intersect(gwas$id, ld_R_info$id), eqtl$id)
#
# gwas <- gwas[gwas$id %in% snplist,]
# eqtl <- eqtl[eqtl$id %in% snplist,]
# ld_R_info <- ld_R_info[ld_R_info$id %in% snplist,]
#
# rm(snplist)
#
# ####################
# #define function for harmonization
# harmonize_sumstat_ld <- function(sumstats, ldref){
#   snpnames <- intersect(sumstats$id, ldref$id)
#
#   if (length(snpnames) != 0){
#     ss.idx <- which(sumstats$id %in% snpnames)
#     ld.idx <- match(sumstats$id[ss.idx], ldref$id)
#     qc <- ctwas:::allele.qc(sumstats$alt[ss.idx], sumstats$ref[ss.idx],
#                             ldref$alt[ld.idx], ldref$ref[ld.idx])
#     ifflip <- qc[["flip"]]
#     ifremove <- !qc[["keep"]]
#
#     flip.idx <- ss.idx[ifflip]
#     sumstats[flip.idx, c("alt", "ref")] <- sumstats[flip.idx, c("ref", "alt")]
#     sumstats[flip.idx, "z"] <- -sumstats[flip.idx, "z"]
#
#     remove.idx <- ss.idx[ifremove]
#     if (length(remove.idx) != 0) {
#       sumstats <- sumstats[-remove.idx,,drop = F]
#     }
#   }
#   return(sumstats)
# }
#
# ####################
# #harmonize GWAS to LD reference
# gwas <- harmonize_sumstat_ld(gwas, ld_R_info)
#
# #harmonize eQTL to LD reference
# eqtl <- harmonize_sumstat_ld(eqtl, ld_R_info)
#
# ####################
# save(gwas, file="/project2/mstephens/wcrouse/gwas.RData")
# save(eqtl, file="/project2/mstephens/wcrouse/eqtl.RData")
# save(ld_R_info, file="/project2/mstephens/wcrouse/ld_R_info.RData")

####################
load("/project2/mstephens/wcrouse/gwas.RData")
load("/project2/mstephens/wcrouse/eqtl.RData")
load("/project2/mstephens/wcrouse/ld_R_info.RData")

####################
#load gene location information

# gtf <- rtracklayer::import("/project2/mstephens/causalTWAS/GTEx_v7_all/gencode.v19.genes.v7.patched_contigs.gtf")
# gtf_df <- as.data.frame(gtf)
# save(gtf_df, file="/project2/mstephens/causalTWAS/GTEx_v7_all/gencode.v19.genes.v7.patched_contigs.RData")
load("/project2/mstephens/causalTWAS/GTEx_v7_all/gencode.v19.genes.v7.patched_contigs.RData")

#keep only gene-level information
gtf_df <- gtf_df[gtf_df$type=="gene",]

#trim ensembl ID version number
gtf_df$gene_id <- sapply(gtf_df$gene_id, function(x){unlist(strsplit(x, "[.]"))[1]})

#drop genes without FUSION weights
gtf_df <- gtf_df[gtf_df$gene_id %in% weights$ENSEMBL_ID,]

####################

#denote significant genes
n_analyzed <- sum(!is.na(pmr_results$causal_pvalue))

alpha <- 0.05
sig_thresh_pmr <- alpha/n_analyzed

sig_thresh_twas <- alpha/nrow(weights)

pmr_results$sig <- pmr_results$causal_pvalue < sig_thresh_pmr
pmr_results$causal <- pmr_results$gene_id %in% true_genes

#drop results for genes that did not run in PMR
pmr_results <- pmr_results[!is.na(pmr_results$sig),]

#drop results that did not run in TWAS
pmr_results <- pmr_results[!is.na(pmr_results$twas_p),]

####################
#significance of true causal genes by PMR and TWAS
x_twas <- -log10(pmr_results$twas_p[pmr_results$causal])
y_pmr <- -log10(pmr_results$causal_pvalue[pmr_results$causal])

plot_lim <- c(0, max(x_twas, y_pmr))

plot(x_twas, y_pmr,
     main="Significance of True Causal Genes",
     xlab="TWAS -log10p",
     ylab="PMR -log10p",
     xlim=plot_lim,
     ylim=plot_lim)
abline(a=0, b=1, lty=3)
abline(h=-log10(sig_thresh_pmr), lty=2, col="red")
abline(v=-log10(sig_thresh_twas), lty=2, col="blue")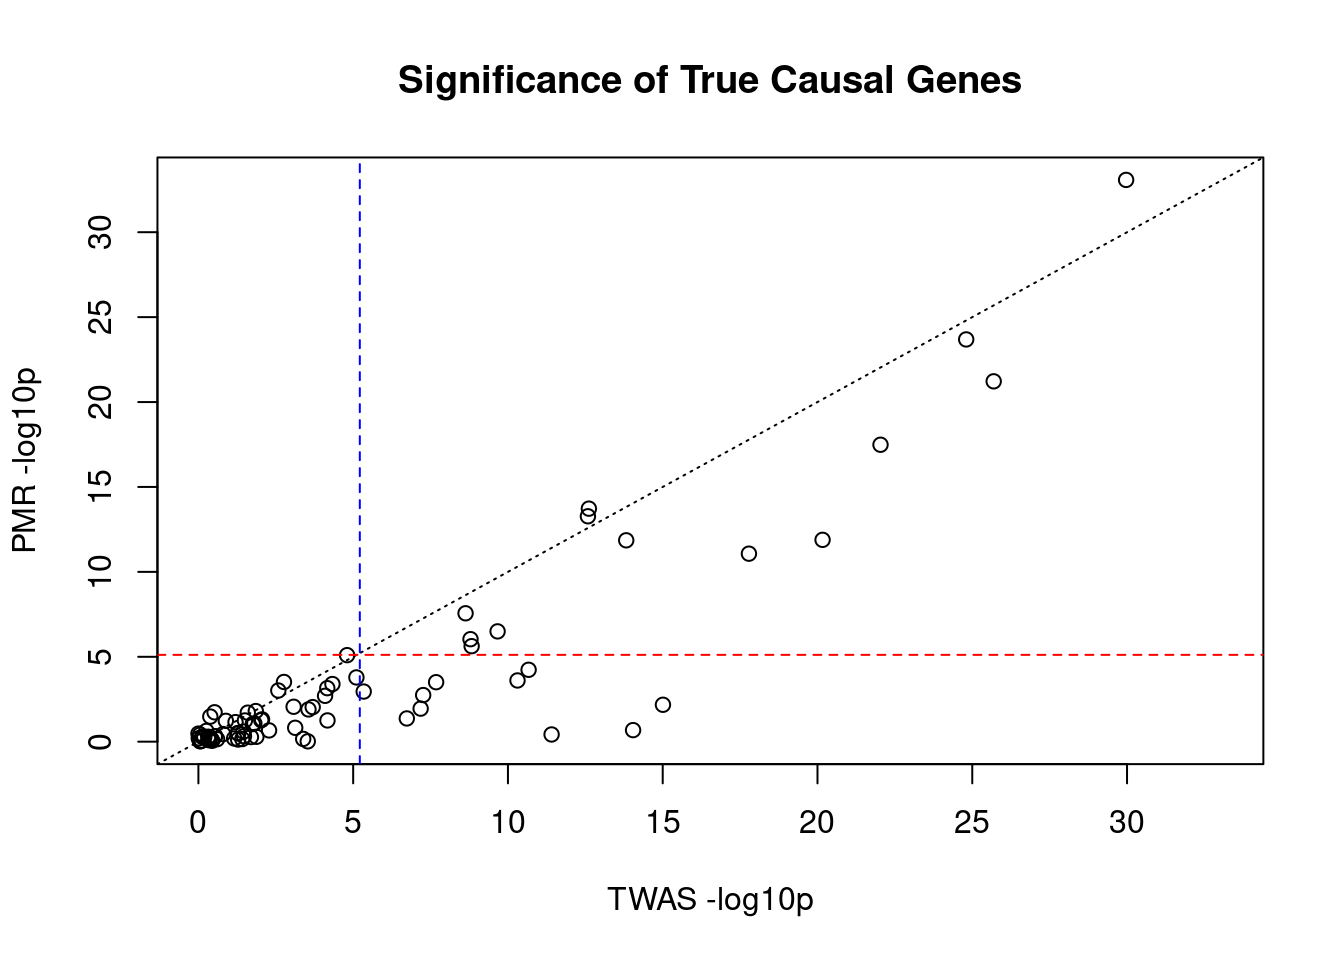
| Version | Author | Date |
|---|---|---|
| 182fce5 | wesleycrouse | 2022-11-29 |
#correlation between TWAS and PMR for true causal genes
cor(x_twas, y_pmr)
[1] 0.8954738####################
#compare TWAS and PMR p-values for all genes analyzed by both methods
x_twas <- -log10(pmr_results$twas_p)
y_pmr <- -log10(pmr_results$causal_pvalue)
plot_lim <- c(0, max(x_twas, y_pmr))
plot(x_twas, y_pmr,
main="Significance of All Genes",
xlab="TWAS -log10p",
ylab="PMR -log10p",
xlim=plot_lim,
ylim=plot_lim,
col=pmr_results$causal+1)
abline(a=0, b=1, lty=3)
abline(h=-log10(sig_thresh_pmr), lty=2, col="green")
abline(v=-log10(sig_thresh_twas), lty=2, col="blue")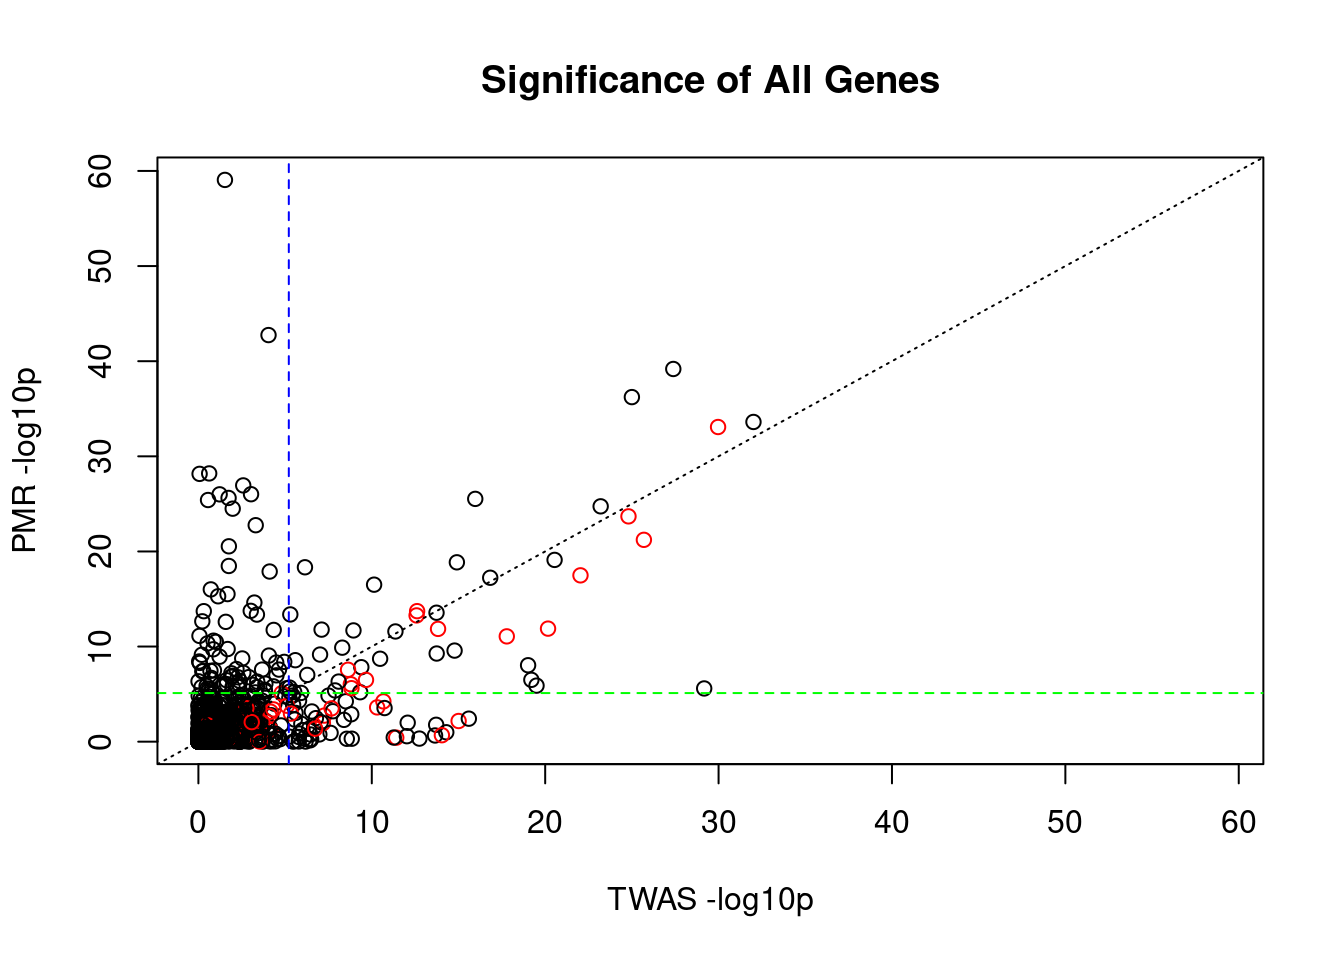
| Version | Author | Date |
|---|---|---|
| 182fce5 | wesleycrouse | 2022-11-29 |
#correlation between TWAS and PMR for true causal genes
cor(x_twas, y_pmr)
[1] 0.5673513####################
window_size_kb <- 100
# pmr_results$causal_snp_n <- NA
# pmr_results$causal_snp_name <- NA
# pmr_results$causal_snp_max <- NA
# pmr_results$causal_snp_eqtlz <- NA
#
# for (i in 1:nrow(pmr_results)){
# print(i)
# gene <- pmr_results$gene_id[i]
#
# #subset eQTL data to current gene
# eqtl_current <- eqtl[eqtl$gene_id==gene,]
#
# #all SNPs for current gene
# snplist <- eqtl_current$id
#
# if (!is.null(window_size_kb)){
# #positions +/- window_size of gene start and end
# gtf_df_idx <- which(gtf_df$gene_id==gene)
# gene_start <- gtf_df$start[gtf_df_idx] - window_size_kb*1000
# gene_end <- gtf_df$end[gtf_df_idx] + window_size_kb*1000
#
# #subset snplist to SNPs within window
# ld_R_info_current <- ld_R_info[match(snplist, ld_R_info$id),]
# ld_R_info_current <- ld_R_info_current[ld_R_info_current$pos >= gene_start & ld_R_info_current$pos <= gene_end,]
# snplist <- ld_R_info_current$id
# }
#
# overlap <- names(true_snp_effects) %in% snplist
#
# causal_snp_n <- sum(overlap)
# pmr_results$causal_snp_n[i] <- causal_snp_n
#
# if(causal_snp_n>0){
# #sort absolute effect sizes of true causal SNPs overlapping the gene
# overlap_abs <- rev(sort(abs(true_snp_effects[overlap])))
#
# pmr_results$causal_snp_name[i] <- names(overlap_abs)[1]
# pmr_results$causal_snp_max[i] <- overlap_abs[1]
# pmr_results$causal_snp_eqtlz[i] <- eqtl_current$z[eqtl_current$id==pmr_results$causal_snp_name[i]]
# }
# }
#
# save(pmr_results, file="/project2/mstephens/wcrouse/pmr_results.RData")
load("/project2/mstephens/wcrouse/pmr_results.RData")
####################
#compare TWAS and PMR p-values for all genes analyzed by both methods and highlight genes confounded by SNPs
x_twas <- -log10(pmr_results$twas_p)
y_pmr <- -log10(pmr_results$causal_pvalue)
color_palette <- c("black", "red")
colors <- color_palette[as.numeric(pmr_results$causal_snp_n>0)+1]
colors[pmr_results$causal] <- "purple"
plot_lim <- c(0, max(x_twas, y_pmr))
plot(x_twas, y_pmr,
main="Significance of All Genes",
xlab="TWAS -log10p",
ylab="PMR -log10p",
xlim=plot_lim,
ylim=plot_lim,
col=colors)
abline(a=0, b=1, lty=3)
abline(h=-log10(sig_thresh_pmr), lty=2, col="green")
abline(v=-log10(sig_thresh_twas), lty=2, col="blue")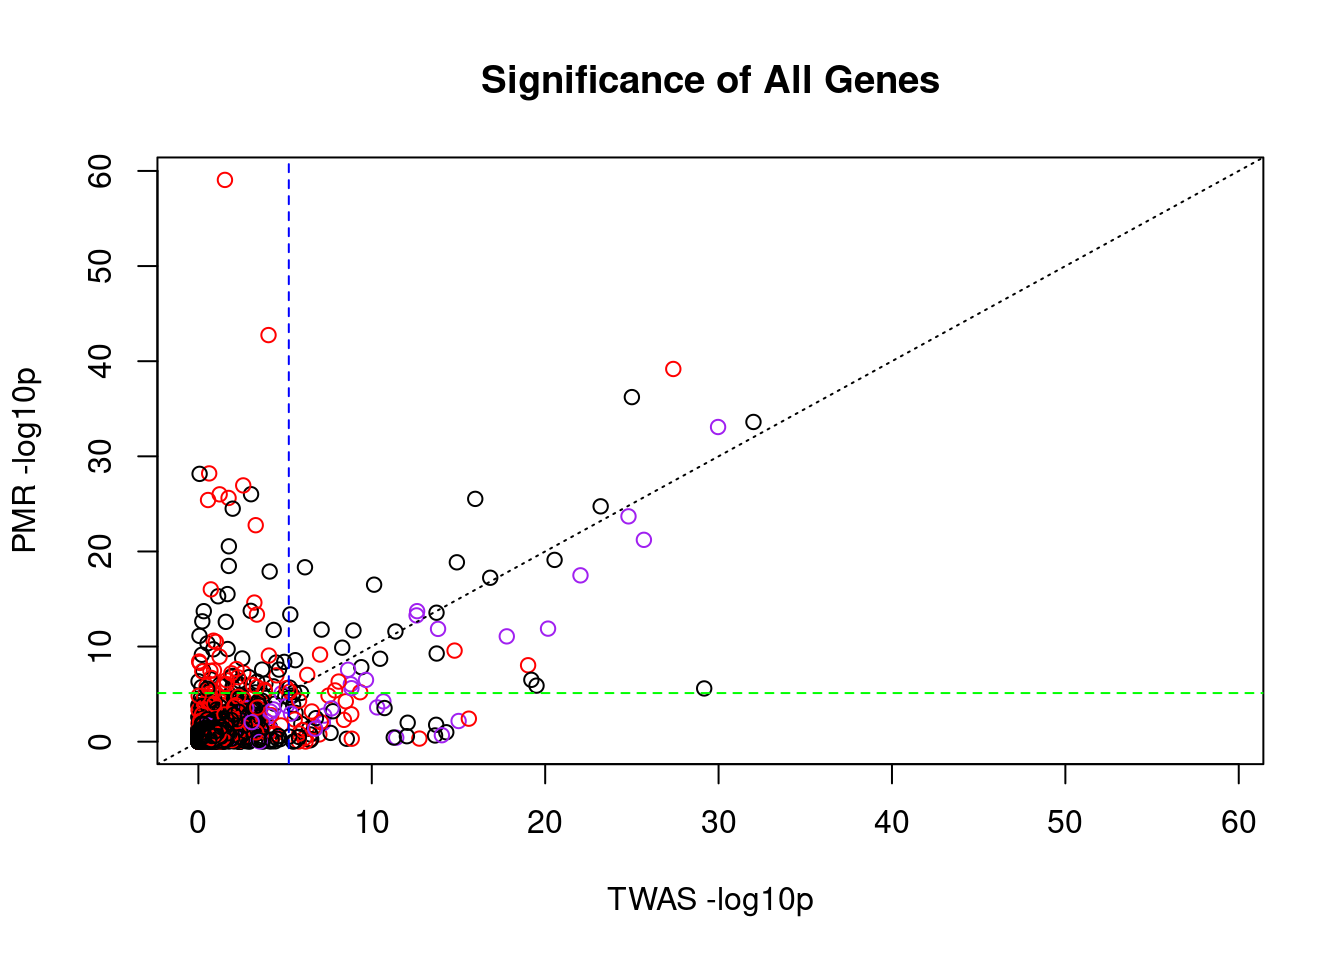
| Version | Author | Date |
|---|---|---|
| 182fce5 | wesleycrouse | 2022-11-29 |
#report PMR outlier gene names
#pmr_results[x_twas < 5 & y_pmr > 20,]

outlier_table <- pmr_results[x_twas < -log10(sig_thresh_twas) & y_pmr,]
outlier_table <- outlier_table[order(outlier_table$causal_pvalue),]
outlier_results <- outlier_table$gene_id[1:5]

outlier_table[1:10,]
gene_id causal_effect causal_pvalue pleiotropy_effect
3310 ENSG00000169902 1.5471960 8.773799e-60 3.348589e-05
2528 ENSG00000037749 0.5606189 1.795379e-43 -8.609222e-05
3154 ENSG00000003147 -0.5567055 6.285714e-29 1.754047e-06
3309 ENSG00000241258 3.3027514 7.001716e-29 -8.829762e-04
2441 ENSG00000248648 -1.5976802 1.145112e-27 -2.167526e-04
2439 ENSG00000164404 -0.2734296 9.658923e-27 5.546175e-04
3829 ENSG00000164830 -0.2786765 9.965565e-27 -1.910186e-04
1344 ENSG00000135914 0.3856143 2.381571e-26 -5.795716e-04
3153 ENSG00000244239 -3.2745216 3.931112e-26 5.275220e-05
3319 ENSG00000232546 0.3108472 3.192131e-25 -8.132660e-05
pleiotropy_pvalue sigma_cisSNP sigma_error_1 sigma_error_2 nsnps
3310 8.773669e-01 1.987970e-06 0.9941696 0.9921136 486
2528 3.041544e-01 1.001900e-05 0.9783253 0.9936534 789
3154 9.839103e-01 1.206939e-05 0.9836348 0.9957117 619
3309 1.169112e-02 8.327136e-07 0.9970089 0.9923797 317
2441 2.207317e-01 3.352633e-06 0.9956638 0.9964071 297
2439 8.712013e-06 7.764346e-05 0.9284289 0.9965407 272
3829 5.251829e-04 2.797936e-05 0.9433665 0.9947932 963
1344 3.620059e-05 4.746091e-05 0.9386292 0.9965838 288
3153 7.682482e-01 5.185006e-07 0.9969945 0.9959523 320
3319 4.662446e-01 7.174929e-05 0.9549342 0.9962749 248
pmr_message twas_p sig causal causal_snp_n causal_snp_name
3310 2.95e-02 TRUE FALSE 1 rs778685
2528 9.04e-05 TRUE FALSE 1 rs12656524
3154 2.39e-01 TRUE FALSE 1 rs3757521
3309 8.53e-01 TRUE FALSE 0 <NA>
2441 2.60e-03 TRUE FALSE 1 rs6887292
2439 9.20e-04 TRUE FALSE 0 <NA>
3829 5.95e-02 TRUE FALSE 2 rs7842556
1344 1.82e-02 TRUE FALSE 1 rs4973370
3153 2.78e-01 TRUE FALSE 1 rs3757521
3319 1.05e-02 TRUE FALSE 0 <NA>
causal_snp_max causal_snp_eqtlz
3310 0.078904474 1.8312861
2528 0.094092590 -1.7986975
3154 0.076978336 -1.7059314
3309 NA NA
2441 0.009341283 0.6898035
2439 NA NA
3829 0.048556016 0.9010583
1344 0.072018807 0.3639670
3153 0.076978336 -0.7165631
3319 NA NA#show distribution of true SNP effect sizes
plot(density(abs(true_snp_effects), from=0), main="Distribution of True SNP Effects")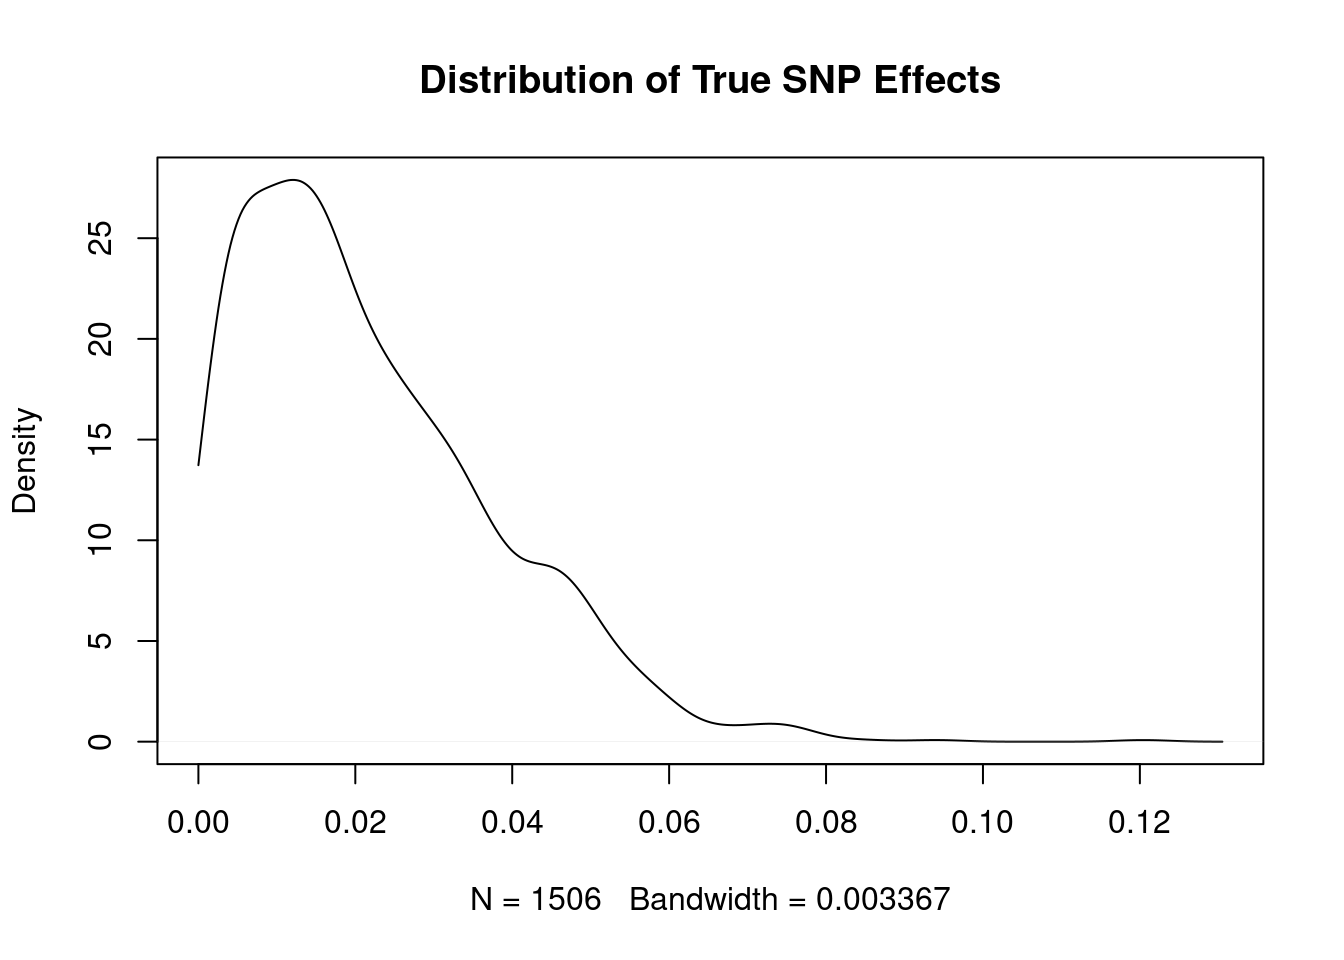
| Version | Author | Date |
|---|---|---|
| 182fce5 | wesleycrouse | 2022-11-29 |
####################

# weightf_dir <- "/project2/mstephens/causalTWAS/fusion_weights/Adipose_Subcutaneous/"
#
# pmr_results$causal_snp_weight <- NA
#
# confounded_list <- which(pmr_results$causal_snp_n>0)
#
# for (i in confounded_list){
#   gene <- pmr_results$gene_id[i]
#   snp <- pmr_results$causal_snp_name[pmr_results$gene_id==gene]
#   weightf_gene <- list.files(weightf_dir)
#   weightf_gene <- paste0(weightf_dir, weightf_gene[grep(gene, weightf_gene)])
#   load(weightf_gene)
#
#   weight_snp <- wgt.matrix[rownames(wgt.matrix)==snp, "lasso"]
#   if (length(weight_snp)==0){
#     weight_snp <- NA
#   }
#
#   pmr_results$causal_snp_weight[i] <- weight_snp
# }

####################

#outlier_results <- c("ENSG00000003147","ENSG00000135914","ENSG00000174482","ENSG00000180817","ENSG00000187240")

for (gene in outlier_results){
  #subset eQTL data to current gene
  eqtl_current <- eqtl[eqtl$gene_id==gene,]

  #all SNPs for current gene
  snplist <- eqtl_current$id

  df_locus <- data.frame(id=eqtl_current$id, z_eqtl=eqtl_current$z)
  df_locus <- cbind(df_locus, ld_R_info[match(df_locus$id, ld_R_info$id),c("chrom","pos")])
  df_locus$z_gwas <- gwas$z[match(df_locus$id, gwas$id)]
  df_locus$causal <- df_locus$id %in% names(true_snp_effects)

  weightf_dir <- "/project2/mstephens/causalTWAS/fusion_weights/Adipose_Subcutaneous/"
  weightf_gene <- list.files(weightf_dir)
  weightf_gene <- paste0(weightf_dir, weightf_gene[grep(gene, weightf_gene)])
  load(weightf_gene)

  df_locus$weight <- wgt.matrix[match(df_locus$id, rownames(wgt.matrix)),"lasso"]
  df_locus$weight[is.na(df_locus$weight)] <- 0

  if (!is.null(window_size_kb)){
    #positions +/- window_size of gene start and end
    gtf_df_idx <- which(gtf_df$gene_id==gene)
    gene_start <- gtf_df$start[gtf_df_idx] - window_size_kb*1000
    gene_end <- gtf_df$end[gtf_df_idx] + window_size_kb*1000
  }

  par(mfrow=c(3,1))

  logging::loginfo(gene)

  par(mar=c(2.1, 4.1, 2.1, 2.1))

  plot(df_locus$pos, abs(df_locus$z_gwas), xlab="", ylab="GWAS |Z|")
  abline(v=df_locus$pos[df_locus$causal], col="red")
  abline(v=gene_start, lty=2)
  abline(v=gene_end, lty=2)

  plot(df_locus$pos, abs(df_locus$z_eqtl), xlab="", ylab="eQTL SS |Z|")
  abline(v=df_locus$pos[df_locus$causal], col="red")
  abline(v=gene_start, lty=2)
  abline(v=gene_end, lty=2)

  plot(df_locus$pos, abs(df_locus$weight), col="purple", xlab="", ylab="eQTL Lasso |wgt|")
  abline(v=df_locus$pos[df_locus$causal], col="red")
  abline(v=gene_start, lty=2)
  abline(v=gene_end, lty=2)
}
2022-11-29 15:00:16 INFO::ENSG00000169902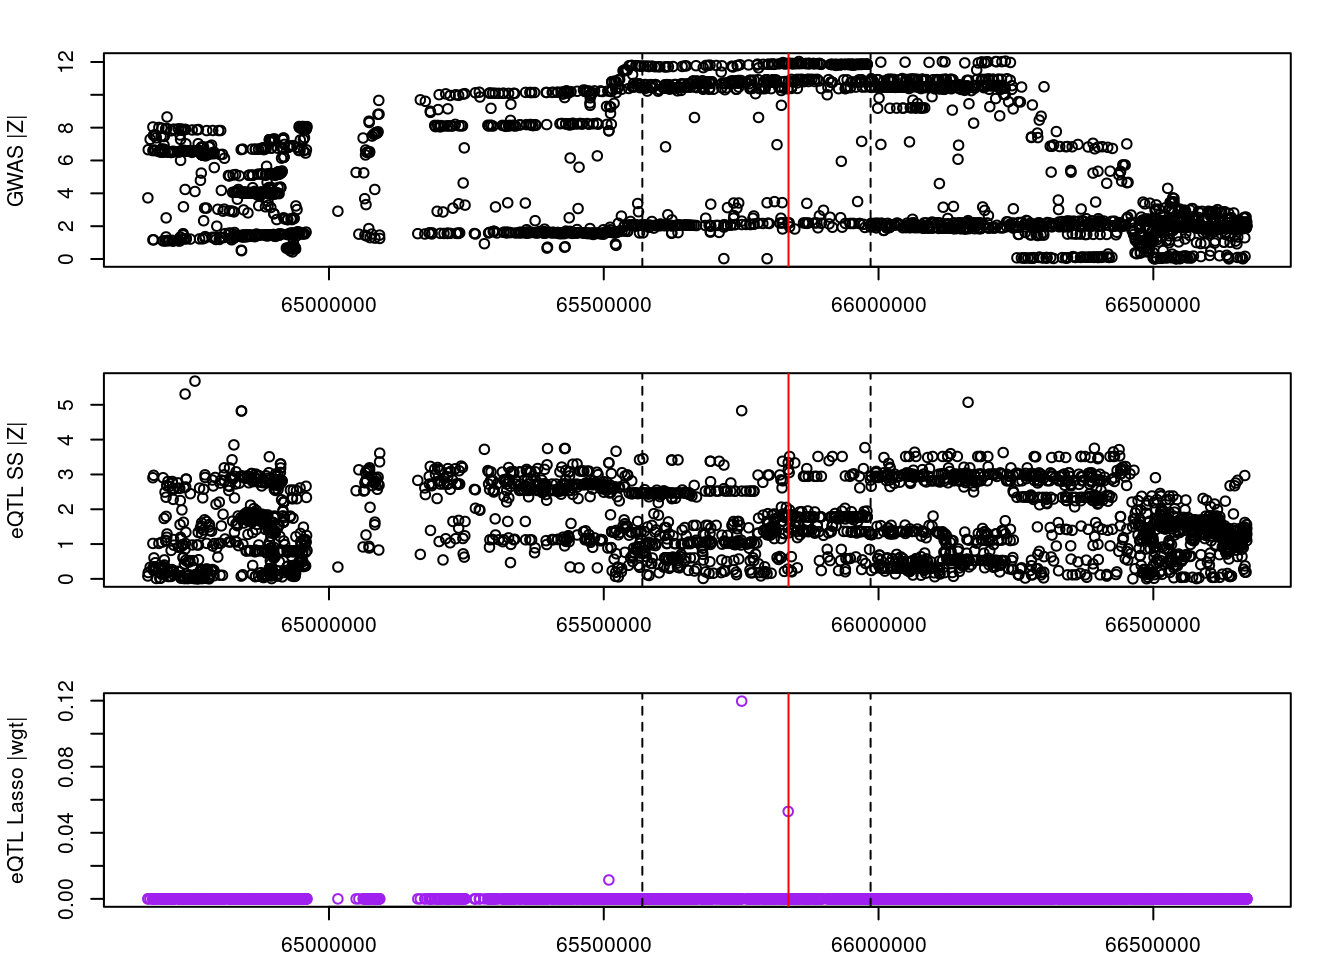
| Version | Author | Date |
|---|---|---|
| 182fce5 | wesleycrouse | 2022-11-29 |
2022-11-29 15:00:19 INFO::ENSG00000037749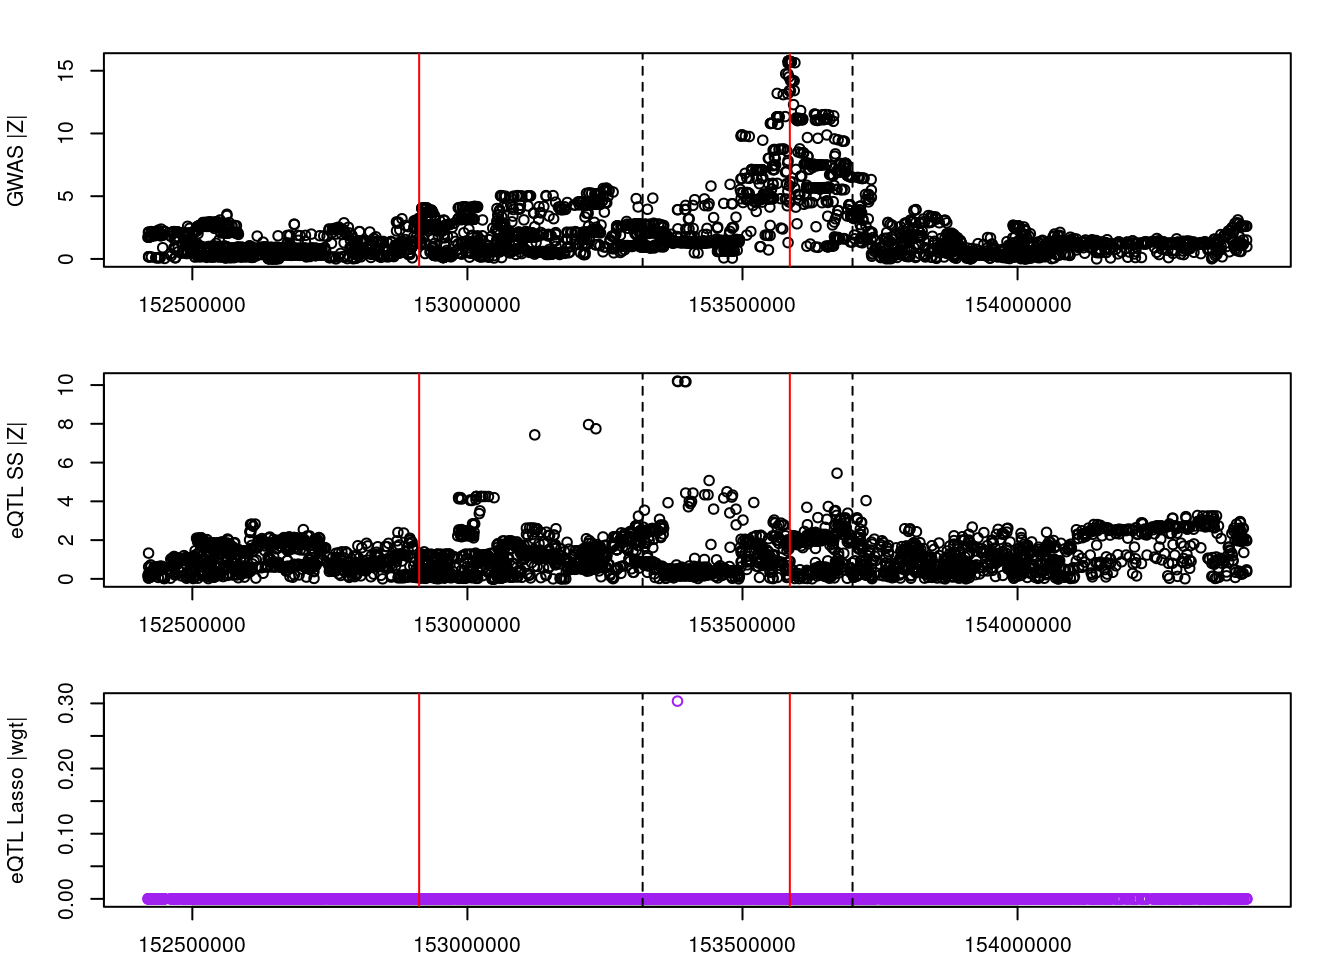
| Version | Author | Date |
|---|---|---|
| 182fce5 | wesleycrouse | 2022-11-29 |
2022-11-29 15:00:21 INFO::ENSG00000003147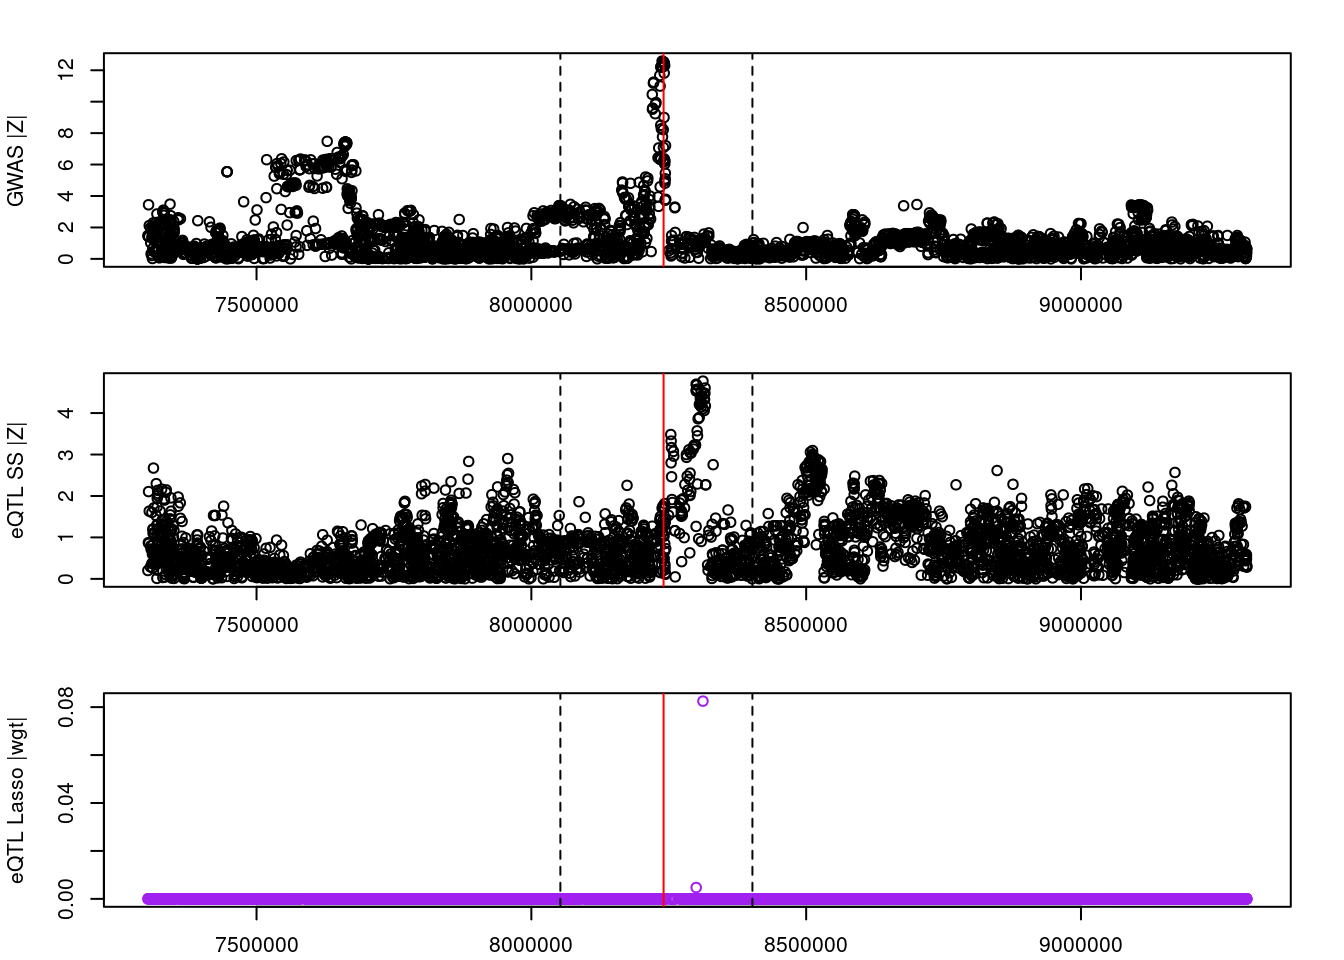
| Version | Author | Date |
|---|---|---|
| 182fce5 | wesleycrouse | 2022-11-29 |
2022-11-29 15:00:23 INFO::ENSG00000241258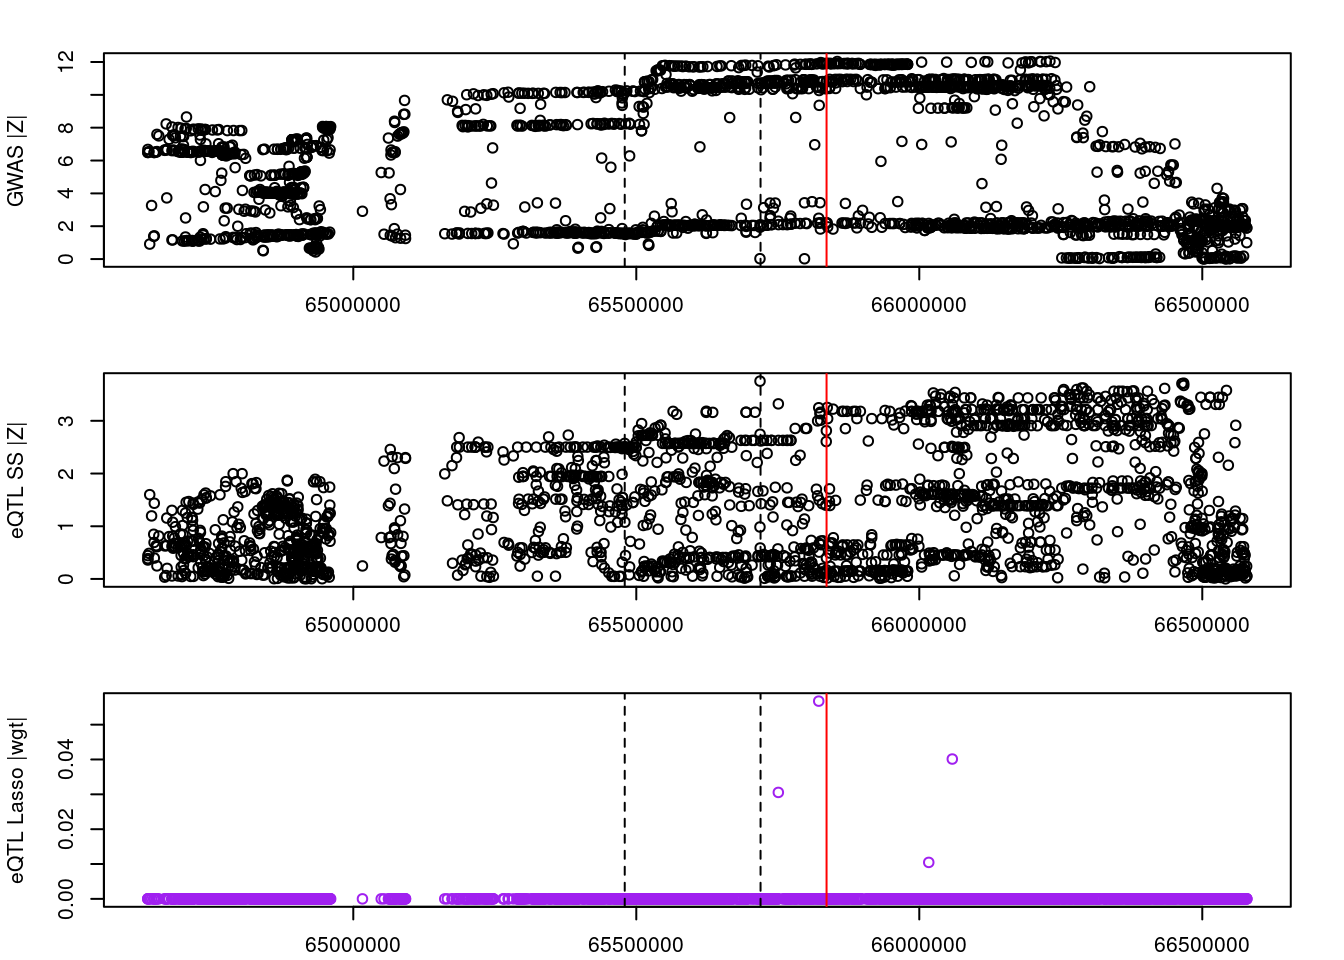
| Version | Author | Date |
|---|---|---|
| 182fce5 | wesleycrouse | 2022-11-29 |
2022-11-29 15:00:25 INFO::ENSG00000248648####################
#LD between weights and variants for a given gene
gene <- "ENSG00000003147"
#subset eQTL data to current gene
eqtl_current <- eqtl[eqtl$gene_id==gene,]
#all SNPs for current gene
snplist <- eqtl_current$id
if (!is.null(window_size_kb)){
#positions +/- window_size of gene start and end
gtf_df_idx <- which(gtf_df$gene_id==gene)
gene_start <- gtf_df$start[gtf_df_idx] - window_size_kb*1000
gene_end <- gtf_df$end[gtf_df_idx] + window_size_kb*1000
#subset snplist to SNPs within window
ld_R_info_current <- ld_R_info[match(snplist, ld_R_info$id),]
ld_R_info_current <- ld_R_info_current[ld_R_info_current$pos >= gene_start & ld_R_info_current$pos <= gene_end,]
snplist <- ld_R_info_current$id
}
#causal SNPs in current gene
causal_snp <- names(true_snp_effects)[names(true_snp_effects) %in% snplist]
#load weights
weightf_dir <- "/project2/mstephens/causalTWAS/fusion_weights/Adipose_Subcutaneous/"
weightf_gene <- list.files(weightf_dir)
weightf_gene <- paste0(weightf_dir, weightf_gene[grep(gene, weightf_gene)])
load(weightf_gene)
lasso_snps <- rownames(wgt.matrix)[wgt.matrix[,"lasso"]!=0]
#list of snps with non-zero weight or in causal snps
snplist <- c(causal_snp, lasso_snps)
#load LD information
ld_R_dir = "/project2/mstephens/causalTWAS/ukbiobank/ukb_LDR_s80.45/s80.45.2_LDR"
ld_R_files <- paste0(ld_R_dir, "/", list.files(ld_R_dir))
ld_R_files <- ld_R_files[grep(".RDS", ld_R_files)]
ld_R_info_files <- paste0(ld_R_dir, "/", list.files(ld_R_dir))
ld_R_info_files <- ld_R_info_files[grep(".Rvar", ld_R_info_files)]
ld_R_info <- lapply(1:length(ld_R_info_files), function(x){y <- fread(ld_R_info_files[x]); y$index <- x; as.data.frame(y)})
ld_R_info <- do.call(rbind, ld_R_info)
#drop SNPs not in LD
snplist <- snplist[snplist %in% ld_R_info$id]
#load LD matrices for selected SNPs
ld_R_idx <- unique(ld_R_info$index[match(snplist, ld_R_info$id)])
R_snp <- lapply(ld_R_files[ld_R_idx], readRDS)
R_snp <- as.matrix(Matrix::bdiag(R_snp))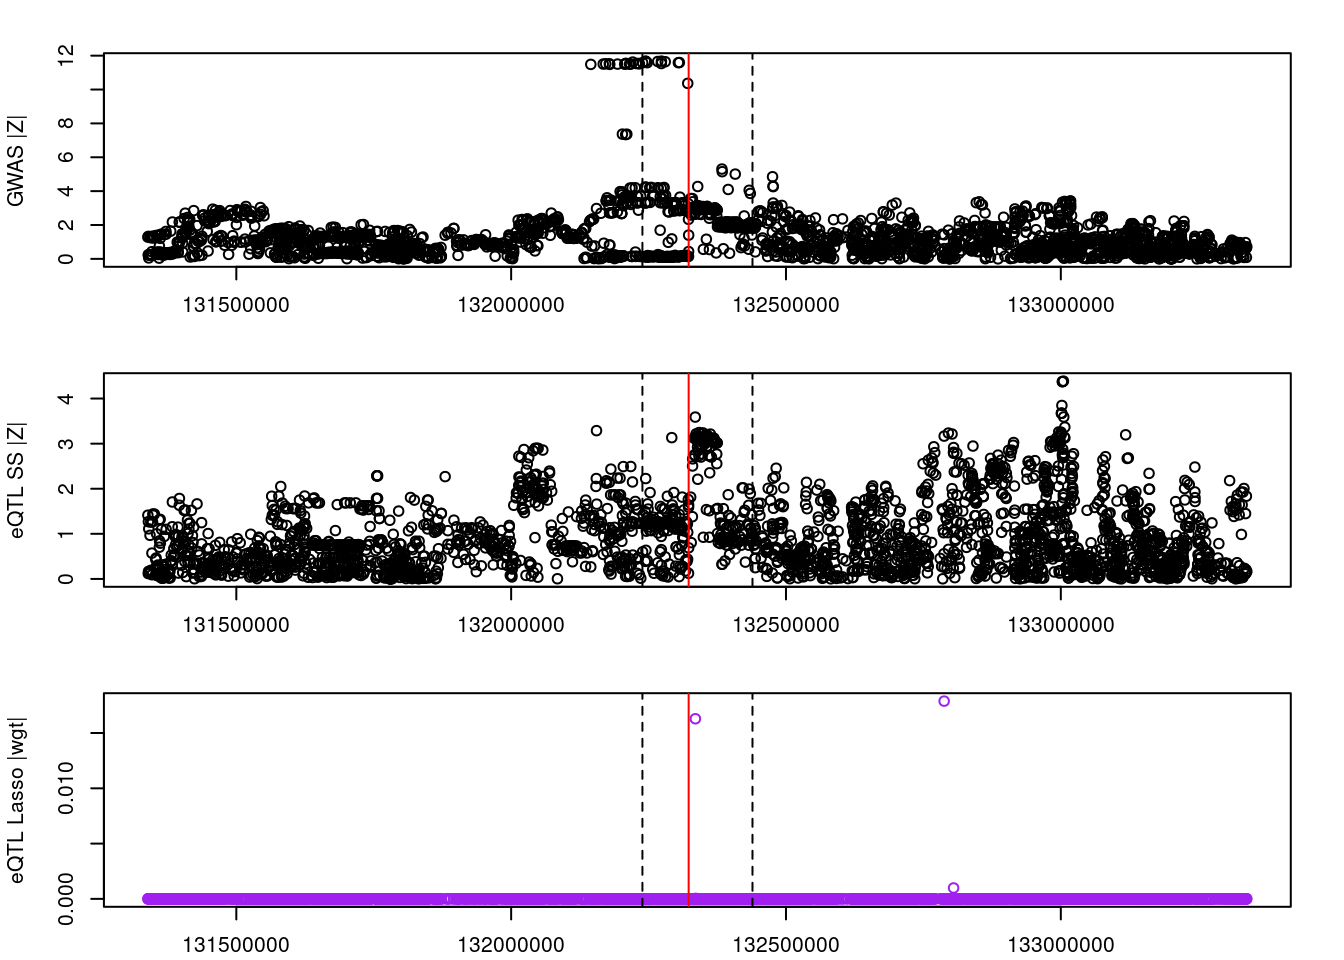
| Version | Author | Date |
|---|---|---|
| 182fce5 | wesleycrouse | 2022-11-29 |
R_snp_info <- lapply(ld_R_info_files[ld_R_idx], fread)
R_snp_info <- as.data.frame(do.call(rbind, R_snp_info))

colnames(R_snp) <- R_snp_info$id
rownames(R_snp) <- R_snp_info$id

R_snp <- R_snp[snplist,snplist,drop=F]

#####
#list gene
gene
[1] "ENSG00000003147"#list causal SNPs
causal_snp[1] "rs3757521"#list SNPs with non-zero weight for gene
lasso_snps[1] "rs3779364" "rs3807807" "rs9640065"#show LD matrix for SNPs in LD reference
R_snp rs3757521 rs3807807 rs9640065
rs3757521 1.00000000 -0.02165183 -0.01710677
rs3807807 -0.02165183 1.00000000 0.75981538
rs9640065 -0.01710677 0.75981538 1.00000000#show non-zero weights for gene
wgt.matrix[lasso_snps,] blup lasso top1 enet
rs3779364 -0.01177565 -0.01042960 -3.268661 -0.01572752
rs3807807 0.01094618 0.00472351 4.155254 0.01452020
rs9640065 -0.01185488 -0.08251070 -4.605357 -0.05599002#SNP info
R_snp_info[R_snp_info$id %in% snplist,] chrom id pos alt ref
1404 7 rs3757521 8240603 A G
1506 7 rs3807807 8299942 A G
1535 7 rs9640065 8312186 C A
sessionInfo()R version 3.6.1 (2019-07-05)
Platform: x86_64-pc-linux-gnu (64-bit)
Running under: CentOS Linux 7 (Core)
Matrix products: default
BLAS/LAPACK: /software/openblas-0.2.19-el7-x86_64/lib/libopenblas_haswellp-r0.2.19.so
locale:
[1] C
attached base packages:
[1] stats graphics grDevices utils datasets methods base
other attached packages:
[1] data.table_1.14.0
loaded via a namespace (and not attached):
[1] Rcpp_1.0.6 whisker_0.3-2 knitr_1.23 magrittr_2.0.3
[5] workflowr_1.6.2 lattice_0.20-38 R6_2.5.0 rlang_1.0.2
[9] fastmap_1.1.0 fansi_0.5.0 stringr_1.4.0 tools_3.6.1
[13] grid_3.6.1 xfun_0.8 logging_0.10-108 utf8_1.2.1
[17] cli_3.3.0 git2r_0.26.1 htmltools_0.5.2 ellipsis_0.3.2
[21] rprojroot_2.0.2 yaml_2.2.0 digest_0.6.20 tibble_3.1.7
[25] lifecycle_1.0.1 crayon_1.4.1 Matrix_1.5-3 later_0.8.0
[29] vctrs_0.4.1 fs_1.5.2 promises_1.0.1 glue_1.6.2
[33] evaluate_0.14 rmarkdown_1.13 stringi_1.4.3 compiler_3.6.1
[37] pillar_1.7.0 httpuv_1.5.1 pkgconfig_2.0.3