Testing Multigroup cTWAS
wesleycrouse
2022-12-15
Last updated: 2023-03-23
Checks: 6 1
Knit directory: ctwas_applied/
This reproducible R Markdown analysis was created with workflowr (version 1.6.2). The Checks tab describes the reproducibility checks that were applied when the results were created. The Past versions tab lists the development history.
The R Markdown file has unstaged changes. To know which version of the R Markdown file created these results, you’ll want to first commit it to the Git repo. If you’re still working on the analysis, you can ignore this warning. When you’re finished, you can run wflow_publish to commit the R Markdown file and build the HTML.
Great job! The global environment was empty. Objects defined in the global environment can affect the analysis in your R Markdown file in unknown ways. For reproduciblity it’s best to always run the code in an empty environment.
The command set.seed(20210726) was run prior to running the code in the R Markdown file. Setting a seed ensures that any results that rely on randomness, e.g. subsampling or permutations, are reproducible.
Great job! Recording the operating system, R version, and package versions is critical for reproducibility.
Nice! There were no cached chunks for this analysis, so you can be confident that you successfully produced the results during this run.
Great job! Using relative paths to the files within your workflowr project makes it easier to run your code on other machines.
Great! You are using Git for version control. Tracking code development and connecting the code version to the results is critical for reproducibility.
The results in this page were generated with repository version 2e68699. See the Past versions tab to see a history of the changes made to the R Markdown and HTML files.
Note that you need to be careful to ensure that all relevant files for the analysis have been committed to Git prior to generating the results (you can use wflow_publish or wflow_git_commit). workflowr only checks the R Markdown file, but you know if there are other scripts or data files that it depends on. Below is the status of the Git repository when the results were generated:
Untracked files:
    Untracked:  gwas.RData
    Untracked:  ld_R_info.RData
    Untracked:  z_snp_pos_ebi-a-GCST004131.RData
    Untracked:  z_snp_pos_ebi-a-GCST004132.RData
    Untracked:  z_snp_pos_ebi-a-GCST004133.RData
    Untracked:  z_snp_pos_scz-2018.RData
    Untracked:  z_snp_pos_ukb-a-360.RData
    Untracked:  z_snp_pos_ukb-d-30780_irnt.RData

Unstaged changes:
    Modified:   analysis/multigroup_testing_all_tissues.Rmd
Note that any generated files, e.g. HTML, png, CSS, etc., are not included in this status report because it is ok for generated content to have uncommitted changes.
These are the previous versions of the repository in which changes were made to the R Markdown (analysis/multigroup_testing_all_tissues.Rmd) and HTML (docs/multigroup_testing_all_tissues.html) files. If you’ve configured a remote Git repository (see ?wflow_git_remote), click on the hyperlinks in the table below to view the files as they were in that past version.
| File | Version | Author | Date | Message |
|---|---|---|---|---|
| Rmd | 2e68699 | wesleycrouse | 2023-03-23 | cleanup |
| html | 2e68699 | wesleycrouse | 2023-03-23 | cleanup |
| Rmd | ebdf8f6 | wesleycrouse | 2023-03-23 | removing legend from plots |
| html | ebdf8f6 | wesleycrouse | 2023-03-23 | removing legend from plots |
| Rmd | 423951a | wesleycrouse | 2023-03-23 | breaking out all tissue results to separate report |
| html | 423951a | wesleycrouse | 2023-03-23 | breaking out all tissue results to separate report |
analysis_id <- "ukb-d-30780_irnt_multigroup"
trait_id <- "ukb-d-30780_irnt"

traits <- read.csv("/project2/mstephens/wcrouse/UKB_analysis_known_anno/ukbb_neale_v3_known_annotations.csv", head=F)
colnames(traits) <- c("trait_name", "ieu_id", "weight")

trait_name <- traits$trait_name[match(trait_id, traits$ieu_id)]

source("/project2/mstephens/wcrouse/ctwas_multigroup_testing/ctwas_config.R")
Case 26 - All tissues with shared variance parameter
Load ctwas results
results_dir <- paste0("/project2/mstephens/wcrouse/ctwas_multigroup_testing/", trait_id, "/multigroup_case26")

weight <- "/project2/compbio/predictdb/mashr_models/"
weight <- paste0(weight, list.files(weight))
weight <- weight[-grep(".gz", weight)]


#load information for all genes

gene_info <- data.frame(gene=as.character(), genename=as.character(), gene_type=as.character(), weight=as.character())

for (i in 1:length(weight)){
  sqlite <- RSQLite::dbDriver("SQLite")
  db = RSQLite::dbConnect(sqlite, weight[i])
  query <- function(...) RSQLite::dbGetQuery(db, ...)
  gene_info_current <- query("select gene, genename, gene_type from extra")
  RSQLite::dbDisconnect(db)

  gene_info_current$weight <- weight[i]

  gene_info <- rbind(gene_info, gene_info_current)
}

gene_info$group <- sapply(1:nrow(gene_info), function(x){paste0(unlist(strsplit(tools::file_path_sans_ext(rev(unlist(strsplit(gene_info$weight[x], "/")))[1]), "_"))[-1], collapse="_")})

gene_info$gene_id <- paste(gene_info$gene, gene_info$group, sep="|")

#load ctwas results
ctwas_res <- data.table::fread(paste0(results_dir, "/", analysis_id, "_ctwas.susieIrss.txt"))

#make unique identifier for regions
ctwas_res$region_tag <- paste(ctwas_res$region_tag1, ctwas_res$region_tag2, sep="_")

#load z scores for SNPs and collect sample size
load(paste0(results_dir, "/", analysis_id, "_expr_z_snp.Rd"))

sample_size <- z_snp$ss
sample_size <- as.numeric(names(which.max(table(sample_size))))

#compute PVE for each gene/SNP
ctwas_res$PVE = ctwas_res$susie_pip*ctwas_res$mu2/sample_size

#separate gene and SNP results
ctwas_gene_res <- ctwas_res[ctwas_res$type != "SNP", ]
ctwas_gene_res <- data.frame(ctwas_gene_res)
ctwas_snp_res <- ctwas_res[ctwas_res$type == "SNP", ]
ctwas_snp_res <- data.frame(ctwas_snp_res)

#add gene information to results
ctwas_gene_res$gene_id <- sapply(ctwas_gene_res$id, function(x){unlist(strsplit(x, split="[|]"))[1]})
ctwas_gene_res$group <- ctwas_gene_res$type
ctwas_gene_res$alt_name <- paste0(ctwas_gene_res$gene_id, "|", ctwas_gene_res$group)

ctwas_gene_res$genename <- NA
ctwas_gene_res$gene_type <- NA

group_list <- unique(ctwas_gene_res$group)

for (j in 1:length(group_list)){
  print(j)
  group <- group_list[j]

  res_group_indx <- which(ctwas_gene_res$group==group)
  gene_info_group <- gene_info[gene_info$group==group,,drop=F]

  ctwas_gene_res[res_group_indx,c("genename", "gene_type")] <- gene_info_group[sapply(ctwas_gene_res$alt_name[res_group_indx], match, gene_info_group$gene_id), c("genename", "gene_type")]
}
[1] 1
[1] 2
[1] 3
[1] 4
[1] 5
[1] 6
[1] 7
[1] 8
[1] 9
[1] 10
[1] 11
[1] 12
[1] 13
[1] 14
[1] 15
[1] 16
[1] 17
[1] 18
[1] 19
[1] 20
[1] 21
[1] 22
[1] 23
[1] 24
[1] 25
[1] 26
[1] 27
[1] 28
[1] 29
[1] 30
[1] 31
[1] 32
[1] 33
[1] 34
[1] 35
[1] 36
[1] 37
[1] 38
[1] 39
[1] 40
[1] 41
[1] 42
[1] 43
[1] 44
[1] 45
[1] 46
[1] 47
[1] 48
[1] 49#add z scores to results
load(paste0(results_dir, "/", analysis_id, "_expr_z_gene.Rd"))
ctwas_gene_res$z <- z_gene[ctwas_gene_res$id,]$z
z_snp <- z_snp[z_snp$id %in% ctwas_snp_res$id,]
ctwas_snp_res$z <- z_snp$z[match(ctwas_snp_res$id, z_snp$id)]
#merge gene and snp results with added information
ctwas_snp_res$gene_id=NA
ctwas_snp_res$group="SNP"
ctwas_snp_res$alt_name=NA
ctwas_snp_res$genename=NA
ctwas_snp_res$gene_type=NA
ctwas_res <- rbind(ctwas_gene_res,
ctwas_snp_res[,colnames(ctwas_gene_res)])
#get number of SNPs from s1 results; adjust for thin argument
ctwas_res_s1 <- data.table::fread(paste0(results_dir, "/", analysis_id, "_ctwas.s1.susieIrss.txt"))
n_snps <- sum(ctwas_res_s1$type=="SNP")/thin
rm(ctwas_res_s1)
#store columns to report
report_cols <- colnames(ctwas_gene_res)[!(colnames(ctwas_gene_res) %in% c("type", "region_tag1", "region_tag2", "cs_index", "gene_type", "z_flag", "id", "chrom", "pos", "alt_name", "gene_id"))]
first_cols <- c("genename", "group", "region_tag")
report_cols <- c(first_cols, report_cols[!(report_cols %in% first_cols)])Check convergence of parameters
library(ggplot2)
library(cowplot)

load(paste0(results_dir, "/", analysis_id, "_ctwas.s2.susieIrssres.Rd"))

#estimated group prior (all iterations)
estimated_group_prior_all <- group_prior_rec
estimated_group_prior_all["SNP",] <- estimated_group_prior_all["SNP",]*thin #adjust parameter to account for thin argument

#estimated group prior variance (all iterations)
estimated_group_prior_var_all <- group_prior_var_rec

#set group size
group_size <- c(table(ctwas_gene_res$type), structure(n_snps, names="SNP"))
group_size <- group_size[rownames(estimated_group_prior_all)]

#estimated group PVE (all iterations)
estimated_group_pve_all <- estimated_group_prior_var_all*estimated_group_prior_all*group_size/sample_size #check PVE calculation

#estimated enrichment of genes (all iterations)
estimated_enrichment_all <- t(sapply(rownames(estimated_group_prior_all)[rownames(estimated_group_prior_all)!="SNP"], function(x){estimated_group_prior_all[rownames(estimated_group_prior_all)==x,]/estimated_group_prior_all[rownames(estimated_group_prior_all)=="SNP"]}))

title_size <- 12

df <- data.frame(niter = rep(1:ncol(estimated_group_prior_all), nrow(estimated_group_prior_all)),
                 value = unlist(lapply(1:nrow(estimated_group_prior_all), function(x){estimated_group_prior_all[x,]})),
                 group = rep(rownames(estimated_group_prior_all), each=ncol(estimated_group_prior_all)))

groupnames_for_plots <- sapply(as.character(unique(df$group)), function(x){paste(sapply(unlist(strsplit(x, "_")), substr, start=1, stop=3), collapse="_")})

df$group <- groupnames_for_plots[df$group]
df$group <- as.factor(df$group)

p_pi <- ggplot(df, aes(x=niter, y=value, group=group)) +
  geom_line(aes(color=group)) +
  geom_point(aes(color=group)) +
  xlab("Iteration") + ylab(bquote(pi)) +
  ggtitle("Proportion Causal") +
  theme_cowplot()

p_pi <- p_pi + theme(plot.title=element_text(size=title_size)) +
  expand_limits(y=0) +
  guides(color = guide_legend(title = "Group")) + theme (legend.title = element_text(size=12, face="bold"))

df <- data.frame(niter = rep(1:ncol(estimated_group_prior_var_all), nrow(estimated_group_prior_var_all)),
                 value = unlist(lapply(1:nrow(estimated_group_prior_var_all), function(x){estimated_group_prior_var_all[x,]})),
                 group = rep(rownames(estimated_group_prior_var_all), each=ncol(estimated_group_prior_var_all)))

groupnames_for_plots <- sapply(as.character(unique(df$group)), function(x){paste(sapply(unlist(strsplit(x, "_")), substr, start=1, stop=3), collapse="_")})

df$group <- groupnames_for_plots[df$group]
df$group <- as.factor(df$group)

p_sigma2 <- ggplot(df, aes(x=niter, y=value, group=group)) +
  geom_line(aes(color=group)) +
  geom_point(aes(color=group)) +
  xlab("Iteration") + ylab(bquote(sigma^2)) +
  ggtitle("Effect Size") +
  theme_cowplot()

p_sigma2 <- p_sigma2 + theme(plot.title=element_text(size=title_size)) +
  expand_limits(y=0) +
  guides(color = guide_legend(title = "Group")) + theme (legend.title = element_text(size=12, face="bold"))

df <- data.frame(niter = rep(1:ncol(estimated_group_pve_all), nrow(estimated_group_pve_all)),
                 value = unlist(lapply(1:nrow(estimated_group_pve_all), function(x){estimated_group_pve_all[x,]})),
                 group = rep(rownames(estimated_group_pve_all), each=ncol(estimated_group_pve_all)))

groupnames_for_plots <- sapply(as.character(unique(df$group)), function(x){paste(sapply(unlist(strsplit(x, "_")), substr, start=1, stop=3), collapse="_")})

df$group <- groupnames_for_plots[df$group]
df$group <- as.factor(df$group)

p_pve <- ggplot(df, aes(x=niter, y=value, group=group)) +
  geom_line(aes(color=group)) +
  geom_point(aes(color=group)) +
  xlab("Iteration") + ylab(bquote(h^2[G])) +
  ggtitle("PVE") +
  theme_cowplot()

p_pve <- p_pve + theme(plot.title=element_text(size=title_size)) +
  expand_limits(y=0) +
  guides(color = guide_legend(title = "Group")) + theme (legend.title = element_text(size=12, face="bold"))

df <- data.frame(niter = rep(1:ncol(estimated_enrichment_all), nrow(estimated_enrichment_all)),
                 value = unlist(lapply(1:nrow(estimated_enrichment_all), function(x){estimated_enrichment_all[x,]})),
                 group = rep(rownames(estimated_enrichment_all), each=ncol(estimated_enrichment_all)))

groupnames_for_plots <- sapply(as.character(unique(df$group)), function(x){paste(sapply(unlist(strsplit(x, "_")), substr, start=1, stop=3), collapse="_")})

df$group <- groupnames_for_plots[df$group]
df$group <- as.factor(df$group)

p_enrich <- ggplot(df, aes(x=niter, y=value, group=group)) +
  geom_line(aes(color=group)) +
  geom_point(aes(color=group)) +
  xlab("Iteration") + ylab(bquote(pi[G]/pi[S])) +
  ggtitle("Enrichment") +
  theme_cowplot()

p_enrich <- p_enrich + theme(plot.title=element_text(size=title_size)) +
  expand_limits(y=0) +
  guides(color = guide_legend(title = "Group")) + theme (legend.title = element_text(size=12, face="bold"))

plot_grid(p_pi + theme(legend.position = "none"),
          p_sigma2 + theme(legend.position = "none"),
          p_enrich + theme(legend.position = "none"),
          p_pve+ theme(legend.position = "none"))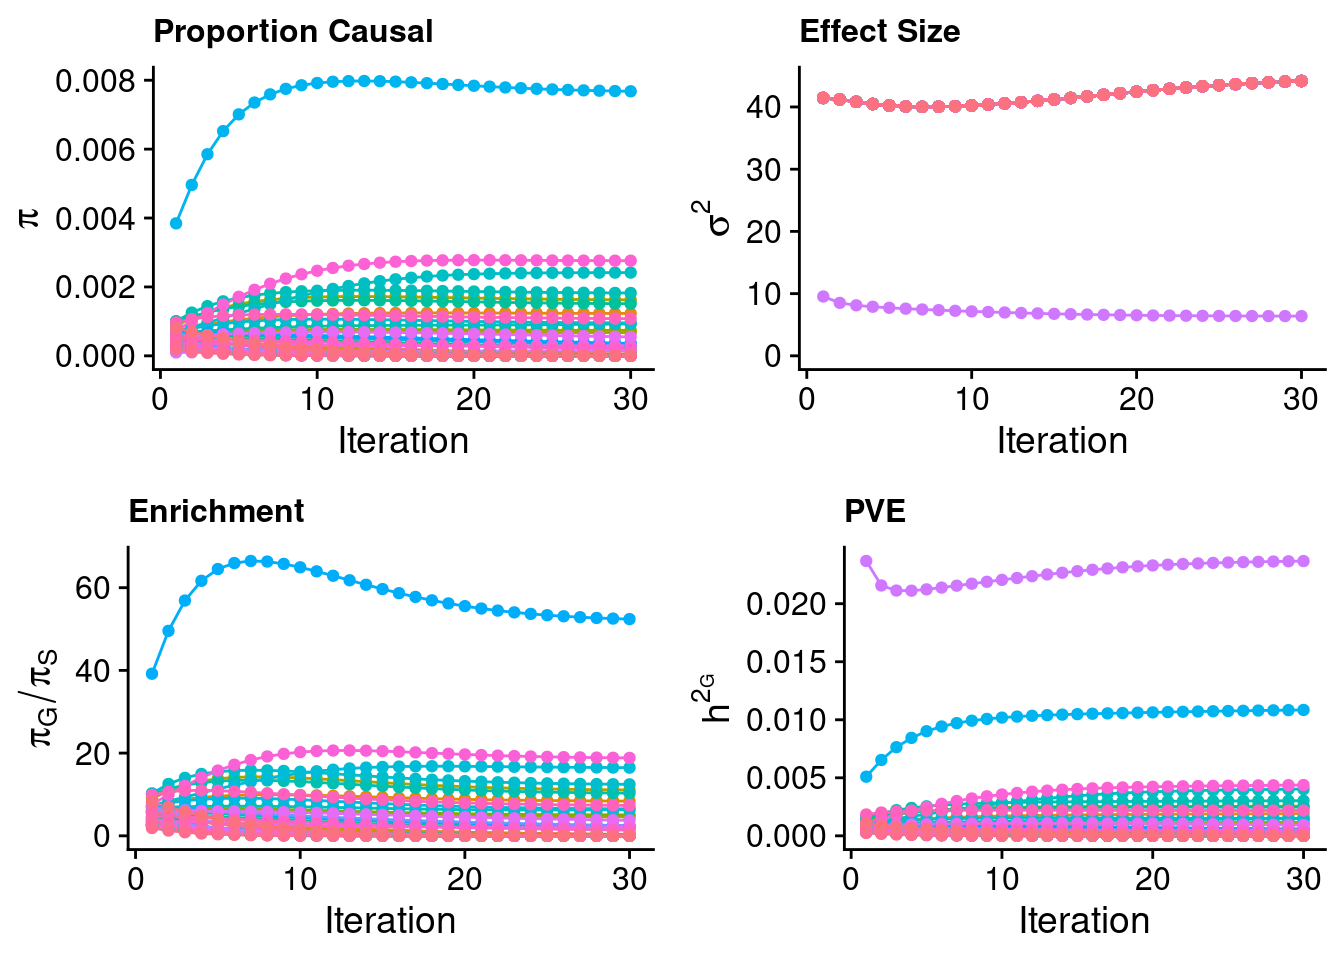
#p_pi
#p_sigma2 + theme(legend.position = "none")
#p_enrich + theme(legend.position = "none")
#p_pve + theme(legend.position = "none")

####################

#estimated group prior
estimated_group_prior <- estimated_group_prior_all[,ncol(group_prior_rec)]
-sort(-estimated_group_prior)
Liver
7.678925e-03
Spleen
2.761580e-03
Esophagus_Muscularis
2.416817e-03
Esophagus_Mucosa
1.824333e-03
Brain_Cerebellum
1.624084e-03
Colon_Transverse
1.512828e-03
Artery_Coronary
1.230304e-03
Testis
1.078124e-03
Heart_Atrial_Appendage
9.548189e-04
Esophagus_Gastroesophageal_Junction
9.270242e-04
Brain_Frontal_Cortex_BA9
7.388320e-04
Brain_Cerebellar_Hemisphere
6.720351e-04
Skin_Not_Sun_Exposed_Suprapubic
5.493272e-04
Muscle_Skeletal
3.616994e-04
Lung
3.428143e-04
Colon_Sigmoid
3.228810e-04
Skin_Sun_Exposed_Lower_leg
2.970045e-04
Cells_EBV-transformed_lymphocytes
2.435308e-04
Stomach
2.020489e-04
SNP
1.465425e-04
Artery_Tibial
5.263171e-05
Adipose_Visceral_Omentum
4.361397e-05
Kidney_Cortex
2.447455e-05
Brain_Caudate_basal_ganglia
1.601047e-05
Adrenal_Gland
1.427112e-05
Prostate
7.575684e-06
Thyroid
7.165434e-06
Whole_Blood
2.644834e-06
Pancreas
1.686359e-06
Nerve_Tibial
1.147164e-06
Brain_Amygdala
9.591520e-07
Minor_Salivary_Gland
5.132029e-07
Ovary
4.110385e-07
Artery_Aorta
4.057736e-07
Brain_Substantia_nigra
3.793462e-07
Breast_Mammary_Tissue
3.234640e-07
Brain_Putamen_basal_ganglia
2.377746e-07
Pituitary
2.219286e-07
Small_Intestine_Terminal_Ileum
1.569164e-07
Adipose_Subcutaneous
1.355395e-07
Brain_Hypothalamus
1.017948e-07
Cells_Cultured_fibroblasts
9.264274e-08
Brain_Nucleus_accumbens_basal_ganglia
4.695558e-08
Brain_Hippocampus
3.640750e-08
Brain_Spinal_cord_cervical_c-1
1.458363e-08
Heart_Left_Ventricle
8.809855e-09
Uterus
6.358487e-09
Brain_Cortex
4.205326e-09
Brain_Anterior_cingulate_cortex_BA24
2.219845e-09
Vagina
1.534677e-09 #estimated group prior variance
estimated_group_prior_var <- estimated_group_prior_var_all[,ncol(group_prior_var_rec)]
-sort(-estimated_group_prior_var) Adipose_Subcutaneous
44.17900
Adipose_Visceral_Omentum
44.17900
Adrenal_Gland
44.17900
Artery_Aorta
44.17900
Artery_Coronary
44.17900
Artery_Tibial
44.17900
Brain_Amygdala
44.17900
Brain_Anterior_cingulate_cortex_BA24
44.17900
Brain_Caudate_basal_ganglia
44.17900
Brain_Cerebellar_Hemisphere
44.17900
Brain_Cerebellum
44.17900
Brain_Cortex
44.17900
Brain_Frontal_Cortex_BA9
44.17900
Brain_Hippocampus
44.17900
Brain_Hypothalamus
44.17900
Brain_Nucleus_accumbens_basal_ganglia
44.17900
Brain_Putamen_basal_ganglia
44.17900
Brain_Spinal_cord_cervical_c-1
44.17900
Brain_Substantia_nigra
44.17900
Breast_Mammary_Tissue
44.17900
Cells_Cultured_fibroblasts
44.17900
Cells_EBV-transformed_lymphocytes
44.17900
Colon_Sigmoid
44.17900
Colon_Transverse
44.17900
Esophagus_Gastroesophageal_Junction
44.17900
Esophagus_Mucosa
44.17900
Esophagus_Muscularis
44.17900
Heart_Atrial_Appendage
44.17900
Heart_Left_Ventricle
44.17900
Kidney_Cortex
44.17900
Liver
44.17900
Lung
44.17900
Minor_Salivary_Gland
44.17900
Muscle_Skeletal
44.17900
Nerve_Tibial
44.17900
Ovary
44.17900
Pancreas
44.17900
Pituitary
44.17900
Prostate
44.17900
Skin_Not_Sun_Exposed_Suprapubic
44.17900
Skin_Sun_Exposed_Lower_leg
44.17900
Small_Intestine_Terminal_Ileum
44.17900
Spleen
44.17900
Stomach
44.17900
Testis
44.17900
Thyroid
44.17900
Uterus
44.17900
Vagina
44.17900
Whole_Blood
44.17900
SNP
6.38226 #estimated enrichment
estimated_enrichment <- estimated_enrichment_all[,ncol(group_prior_var_rec)]
-sort(-estimated_enrichment) Liver
5.240068e+01
Spleen
1.884491e+01
Esophagus_Muscularis
1.649226e+01
Esophagus_Mucosa
1.244917e+01
Brain_Cerebellum
1.108269e+01
Colon_Transverse
1.032348e+01
Artery_Coronary
8.395545e+00
Testis
7.357077e+00
Heart_Atrial_Appendage
6.515646e+00
Esophagus_Gastroesophageal_Junction
6.325976e+00
Brain_Frontal_Cortex_BA9
5.041760e+00
Brain_Cerebellar_Hemisphere
4.585941e+00
Skin_Not_Sun_Exposed_Suprapubic
3.748587e+00
Muscle_Skeletal
2.468222e+00
Lung
2.339351e+00
Colon_Sigmoid
2.203327e+00
Skin_Sun_Exposed_Lower_leg
2.026747e+00
Cells_EBV-transformed_lymphocytes
1.661844e+00
Stomach
1.378774e+00
Artery_Tibial
3.591567e-01
Adipose_Visceral_Omentum
2.976200e-01
Kidney_Cortex
1.670134e-01
Brain_Caudate_basal_ganglia
1.092548e-01
Adrenal_Gland
9.738557e-02
Prostate
5.169616e-02
Thyroid
4.889664e-02
Whole_Blood
1.804824e-02
Pancreas
1.150765e-02
Nerve_Tibial
7.828203e-03
Brain_Amygdala
6.545215e-03
Minor_Salivary_Gland
3.502076e-03
Ovary
2.804910e-03
Artery_Aorta
2.768983e-03
Brain_Substantia_nigra
2.588643e-03
Breast_Mammary_Tissue
2.207306e-03
Brain_Putamen_basal_ganglia
1.622564e-03
Pituitary
1.514432e-03
Small_Intestine_Terminal_Ileum
1.070791e-03
Adipose_Subcutaneous
9.249158e-04
Brain_Hypothalamus
6.946435e-04
Cells_Cultured_fibroblasts
6.321903e-04
Brain_Nucleus_accumbens_basal_ganglia
3.204230e-04
Brain_Hippocampus
2.484433e-04
Brain_Spinal_cord_cervical_c-1
9.951809e-05
Heart_Left_Ventricle
6.011810e-05
Uterus
4.339006e-05
Brain_Cortex
2.869698e-05
Brain_Anterior_cingulate_cortex_BA24
1.514814e-05
Vagina
1.047257e-05 #report sample size
print(sample_size)[1] 343621#report group size
print(group_size) SNP
8696600
Adipose_Subcutaneous
13003
Adipose_Visceral_Omentum
12878
Adrenal_Gland
11837
Artery_Aorta
12767
Artery_Coronary
12088
Artery_Tibial
12913
Brain_Amygdala
10993
Brain_Anterior_cingulate_cortex_BA24
11632
Brain_Caudate_basal_ganglia
12278
Brain_Cerebellar_Hemisphere
11977
Brain_Cerebellum
12220
Brain_Cortex
12463
Brain_Frontal_Cortex_BA9
12203
Brain_Hippocampus
11686
Brain_Hypothalamus
11834
Brain_Nucleus_accumbens_basal_ganglia
12230
Brain_Putamen_basal_ganglia
11920
Brain_Spinal_cord_cervical_c-1
11211
Brain_Substantia_nigra
10753
Breast_Mammary_Tissue
12813
Cells_Cultured_fibroblasts
12453
Cells_EBV-transformed_lymphocytes
10647
Colon_Sigmoid
12553
Colon_Transverse
12752
Esophagus_Gastroesophageal_Junction
12493
Esophagus_Mucosa
12890
Esophagus_Muscularis
12949
Heart_Atrial_Appendage
12297
Heart_Left_Ventricle
11567
Kidney_Cortex
9390
Liver
10985
Lung
13316
Minor_Salivary_Gland
11899
Muscle_Skeletal
11907
Nerve_Tibial
13727
Ovary
11867
Pancreas
11963
Pituitary
12773
Prostate
12516
Skin_Not_Sun_Exposed_Suprapubic
13269
Skin_Sun_Exposed_Lower_leg
13505
Small_Intestine_Terminal_Ileum
12118
Spleen
12319
Stomach
12280
Testis
15723
Thyroid
13648
Uterus
11328
Vagina
11059
Whole_Blood
11139 #estimated group PVE
estimated_group_pve <- estimated_group_pve_all[,ncol(group_prior_rec)]
-sort(-estimated_group_pve) SNP
2.367052e-02
Liver
1.084518e-02
Spleen
4.373904e-03
Esophagus_Muscularis
4.023613e-03
Esophagus_Mucosa
3.023383e-03
Brain_Cerebellum
2.551620e-03
Colon_Transverse
2.480299e-03
Testis
2.179417e-03
Artery_Coronary
1.912067e-03
Heart_Atrial_Appendage
1.509581e-03
Esophagus_Gastroesophageal_Junction
1.488998e-03
Brain_Frontal_Cortex_BA9
1.159174e-03
Brain_Cerebellar_Hemisphere
1.034847e-03
Skin_Not_Sun_Exposed_Suprapubic
9.371421e-04
Lung
5.869065e-04
Muscle_Skeletal
5.537150e-04
Colon_Sigmoid
5.211061e-04
Skin_Sun_Exposed_Lower_leg
5.156961e-04
Cells_EBV-transformed_lymphocytes
3.333629e-04
Stomach
3.190002e-04
Artery_Tibial
8.737974e-05
Adipose_Visceral_Omentum
7.221214e-05
Kidney_Cortex
2.954721e-05
Brain_Caudate_basal_ganglia
2.527364e-05
Adrenal_Gland
2.171881e-05
Thyroid
1.257325e-05
Prostate
1.219056e-05
Whole_Blood
3.787746e-06
Pancreas
2.593739e-06
Nerve_Tibial
2.024591e-06
Brain_Amygdala
1.355626e-06
Minor_Salivary_Gland
7.851195e-07
Artery_Aorta
6.660531e-07
Ovary
6.271329e-07
Breast_Mammary_Tissue
5.328599e-07
Brain_Substantia_nigra
5.244469e-07
Pituitary
3.644537e-07
Brain_Putamen_basal_ganglia
3.643996e-07
Small_Intestine_Terminal_Ileum
2.444755e-07
Adipose_Subcutaneous
2.265925e-07
Brain_Hypothalamus
1.548793e-07
Cells_Cultured_fibroblasts
1.483274e-07
Brain_Nucleus_accumbens_basal_ganglia
7.383289e-08
Brain_Hippocampus
5.470070e-08
Brain_Spinal_cord_cervical_c-1
2.102065e-08
Heart_Left_Ventricle
1.310164e-08
Uterus
9.260686e-09
Brain_Cortex
6.738425e-09
Brain_Anterior_cingulate_cortex_BA24
3.319810e-09
Vagina
2.182071e-09 #total PVE
sum(estimated_group_pve)[1] 0.06429501#attributable PVE
-sort(-estimated_group_pve/sum(estimated_group_pve)) SNP
3.681549e-01
Liver
1.686784e-01
Spleen
6.802868e-02
Esophagus_Muscularis
6.258049e-02
Esophagus_Mucosa
4.702360e-02
Brain_Cerebellum
3.968612e-02
Colon_Transverse
3.857685e-02
Testis
3.389715e-02
Artery_Coronary
2.973896e-02
Heart_Atrial_Appendage
2.347897e-02
Esophagus_Gastroesophageal_Junction
2.315883e-02
Brain_Frontal_Cortex_BA9
1.802898e-02
Brain_Cerebellar_Hemisphere
1.609529e-02
Skin_Not_Sun_Exposed_Suprapubic
1.457566e-02
Lung
9.128337e-03
Muscle_Skeletal
8.612099e-03
Colon_Sigmoid
8.104923e-03
Skin_Sun_Exposed_Lower_leg
8.020779e-03
Cells_EBV-transformed_lymphocytes
5.184896e-03
Stomach
4.961508e-03
Artery_Tibial
1.359044e-03
Adipose_Visceral_Omentum
1.123137e-03
Kidney_Cortex
4.595569e-04
Brain_Caudate_basal_ganglia
3.930887e-04
Adrenal_Gland
3.377992e-04
Thyroid
1.955557e-04
Prostate
1.896035e-04
Whole_Blood
5.891197e-05
Pancreas
4.034122e-05
Nerve_Tibial
3.148909e-05
Brain_Amygdala
2.108446e-05
Minor_Salivary_Gland
1.221120e-05
Artery_Aorta
1.035933e-05
Ovary
9.753990e-06
Breast_Mammary_Tissue
8.287733e-06
Brain_Substantia_nigra
8.156884e-06
Pituitary
5.668460e-06
Brain_Putamen_basal_ganglia
5.667619e-06
Small_Intestine_Terminal_Ileum
3.802402e-06
Adipose_Subcutaneous
3.524262e-06
Brain_Hypothalamus
2.408885e-06
Cells_Cultured_fibroblasts
2.306982e-06
Brain_Nucleus_accumbens_basal_ganglia
1.148346e-06
Brain_Hippocampus
8.507768e-07
Brain_Spinal_cord_cervical_c-1
3.269406e-07
Heart_Left_Ventricle
2.037738e-07
Uterus
1.440343e-07
Brain_Cortex
1.048048e-07
Brain_Anterior_cingulate_cortex_BA24
5.163403e-08
Vagina
3.393842e-08 Top gene+tissue pairs by PIP
#genes with PIP>0.8 or 20 highest PIPs
head(ctwas_gene_res[order(-ctwas_gene_res$susie_pip),report_cols], max(sum(ctwas_gene_res$susie_pip>0.8), 20))
genename group region_tag
547056 PCSK9 Whole_Blood 1_34
549667 APOB Esophagus_Mucosa 2_13
556346 LPA Testis 6_104
575793 ZDHHC7 Esophagus_Mucosa 16_49
565521 USP28 Muscle_Skeletal 11_67
550896 INSIG2 Liver 2_69
561421 ABCA1 Liver 9_53
558457 TNKS Liver 8_12
574913 HPR Liver 16_38
548544 MARC1 Colon_Transverse 1_112
569640 GAS6 Liver 13_62
556911 SP4 Liver 7_19
554294 TRIM39 Liver 6_24
552709 CSNK1G3 Liver 5_75
551821 PXK Artery_Coronary 3_40
596636 RRBP1 Liver 20_13
576935 ASGR1 Esophagus_Gastroesophageal_Junction 17_6
572815 LITAF Brain_Frontal_Cortex_BA9 16_12
564544 FADS1 Liver 11_34
552269 MITF Spleen 3_47
594860 FCGRT Esophagus_Mucosa 19_34
568774 FLT3 Lung 13_7
574865 TXNL4B Heart_Atrial_Appendage 16_38
563369 ADRB1 Spleen 10_71
547844 PSRC1 Liver 1_67
571482 NYNRIN Liver 14_3
549519 ALLC Liver 2_2
558572 LPL Testis 8_21
553423 OR2H2 Brain_Cerebellar_Hemisphere 6_23
584418 PDE4C Brain_Cerebellum 19_14
546898 PCSK9 Skin_Not_Sun_Exposed_Suprapubic 1_34
565384 DRD2 Brain_Cerebellum 11_67
575482 OSGIN1 Liver 16_48
549089 RP4-781K5.7 Liver 1_121
574604 TXNL4B Brain_Cerebellum 16_38
588730 CYP2A6 Liver 19_28
556456 RAC1 Brain_Cerebellum 7_8
551240 ACVR1C Liver 2_94
554772 NT5DC1 Artery_Coronary 6_77
569060 N4BP2L1 Esophagus_Gastroesophageal_Junction 13_10
567411 LRRK2 Liver 12_25
562883 GPAM Esophagus_Gastroesophageal_Junction 10_70
546109 ASAP3 Liver 1_16
556072 SLC22A1 Skin_Sun_Exposed_Lower_leg 6_103
569077 N4BP2L1 Heart_Atrial_Appendage 13_10
566858 ST3GAL4 Liver 11_77
550837 AC073257.2 Esophagus_Muscularis 2_69
556900 SP4 Esophagus_Muscularis 7_19
576072 FOXF1 Heart_Atrial_Appendage 16_51
559803 PLEC Colon_Transverse 8_94
568045 STAC3 Esophagus_Muscularis 12_36
561517 GATA3 Artery_Coronary 10_8
579031 PGS1 Esophagus_Muscularis 17_44
591107 IRF2BP1 Esophagus_Muscularis 19_32
562257 CYP26C1 Brain_Cerebellar_Hemisphere 10_59
593071 NTN5 Skin_Not_Sun_Exposed_Suprapubic 19_33
597990 PLTP Liver 20_28
592692 PRKD2 Liver 19_33
551384 FAM117B Brain_Cerebellar_Hemisphere 2_120
598959 BRWD1 Skin_Not_Sun_Exposed_Suprapubic 21_19
558329 CLDN23 Liver 8_11
561220 TTC39B Liver 9_13
587705 ZNF486 Artery_Coronary 19_16
545593 KLHDC7A Liver 1_13
547104 PRMT6 Liver 1_66
557464 TMED4 Esophagus_Muscularis 7_32
558067 BRI3 Liver 7_60
573170 CETP Artery_Aorta 16_30
550132 KCNK3 Heart_Atrial_Appendage 2_15
susie_pip mu2 PVE z
547056 1.0000000 303.35442 8.828169e-04 -23.237813
549667 1.0000000 803.64279 2.338748e-03 38.857959
556346 1.0000000 369.40561 1.075038e-03 -18.873327
575793 0.9999998 52.06682 1.515239e-04 -6.906720
565521 0.9999998 282.22193 8.213173e-04 -4.621519
550896 0.9999989 69.93727 2.035301e-04 8.982702
561421 0.9998566 71.45438 2.079155e-04 -7.982017
558457 0.9998403 85.76712 2.495582e-04 -11.038564
574913 0.9998230 286.83096 8.345828e-04 17.962770
548544 0.9998023 93.23112 2.712660e-04 -9.668702
569640 0.9993799 79.53000 2.313033e-04 8.923688
556911 0.9992645 106.60401 3.100090e-04 -10.693191
554294 0.9990462 76.32893 2.219193e-04 -8.840164
552709 0.9975428 84.47295 2.452277e-04 -9.116291
551821 0.9943961 66.54059 1.925601e-04 7.955317
596636 0.9942847 33.92595 9.816644e-05 -7.008305
576935 0.9920015 89.86027 2.594182e-04 -9.644806
572815 0.9915327 36.64564 1.057425e-04 5.772374
564544 0.9878783 161.56736 4.644911e-04 -12.926351
552269 0.9860400 34.59269 9.926569e-05 -5.519279
594860 0.9833651 30.83439 8.824101e-05 4.135964
568774 0.9833530 37.29779 1.067365e-04 5.820864
574865 0.9771763 218.28388 6.207474e-04 -2.264888
563369 0.9761541 41.94337 1.191522e-04 6.216518
547844 0.9748017 1663.80182 4.719958e-03 41.687336
571482 0.9739043 48.51887 1.375141e-04 -7.009952
549519 0.9725759 28.05778 7.941401e-05 -4.919066
558572 0.9692914 34.48204 9.726745e-05 5.563062
553423 0.9655675 49.47939 1.390360e-04 7.374266
584418 0.9650869 47.30392 1.328568e-04 6.633160
546898 0.9649245 105.32673 2.957687e-04 15.890031
565384 0.9632179 112.70967 3.159410e-04 -3.250305
575482 0.9624309 50.80867 1.423075e-04 -6.907310
549089 0.9564623 204.21060 5.684162e-04 15.108415
574604 0.9525200 259.55754 7.194955e-04 -18.129274
588730 0.9509540 31.43019 8.698148e-05 -5.407028
556456 0.9454510 36.02546 9.912173e-05 -5.713928
551240 0.9346819 25.16317 6.844624e-05 4.687370
554772 0.9344266 60.67408 1.649942e-04 7.669070
569060 0.9264501 39.73024 1.071183e-04 -6.647944
567411 0.9185921 27.12869 7.252233e-05 -4.792808
562883 0.9143740 57.80639 1.538226e-04 -7.194356
546109 0.9120411 32.75142 8.692903e-05 -5.283225
556072 0.9057635 57.82240 1.524162e-04 7.155007
569077 0.9014084 47.36497 1.242508e-04 -7.250966
566858 0.8912349 172.64250 4.477754e-04 -13.376072
550837 0.8799692 29.24086 7.488210e-05 -5.046154
556900 0.8798374 49.52584 1.268103e-04 7.330657
576072 0.8775131 29.23553 7.465946e-05 -5.012221
559803 0.8758950 48.68217 1.240916e-04 6.767908
568045 0.8724693 39.24675 9.964928e-05 5.874553
561517 0.8701767 29.56814 7.487758e-05 -4.990067
579031 0.8662931 53.79800 1.356286e-04 7.140667
591107 0.8639131 84.94768 2.135708e-04 -8.060102
562257 0.8588801 67.16139 1.678698e-04 -8.237356
593071 0.8552348 115.13788 2.865655e-04 -12.110745
597990 0.8494840 62.84694 1.553673e-04 5.732491
592692 0.8451069 30.07464 7.396605e-05 -5.072217
551384 0.8397245 57.22370 1.398405e-04 8.348197
598959 0.8298207 571.94914 1.381217e-03 -2.982534
558329 0.8257987 25.91277 6.227422e-05 -4.720010
561220 0.8254973 23.70093 5.693790e-05 4.334495
587705 0.8254483 51.56357 1.238663e-04 -6.991792
545593 0.8183601 22.75472 5.419213e-05 -4.124187
547104 0.8127810 32.10979 7.595062e-05 5.323721
557464 0.8111055 63.38956 1.496288e-04 -9.575315
558067 0.8074427 30.20908 7.098548e-05 5.140136
573170 0.8048222 205.65382 4.816782e-04 -14.582596
550132 0.8034501 26.95019 6.301458e-05 -4.634044Top genes by combined PIP
#aggregate by gene name
df_gene <- aggregate(ctwas_gene_res$susie_pip, by=list(ctwas_gene_res$genename), FUN=sum)
colnames(df_gene) <- c("genename", "combined_pip")

#drop duplicated gene names
df_gene <- df_gene[!(df_gene$genename %in% names(which(table(ctwas_gene_res$genename)>length(weight)))),]

#collect tissue-level results
all_tissue_names <- unique(ctwas_gene_res$group)

df_gene_pips <- matrix(NA, nrow=nrow(df_gene), ncol=length(all_tissue_names))
colnames(df_gene_pips) <- all_tissue_names

for (i in 1:nrow(df_gene)){
  #print(i)

  gene <- df_gene$genename[i]
  ctwas_gene_res_subset <- ctwas_gene_res[ctwas_gene_res$genename==gene,]
  df_gene_pips[i,ctwas_gene_res_subset$group] <- ctwas_gene_res_subset$susie_pip
}

df_gene <- cbind(df_gene, df_gene_pips)

#sort by combined PIP
df_gene <- df_gene[order(-df_gene$combined_pip),]

df_gene <- df_gene[,apply(df_gene, 2, function(x){!all(is.na(x))})]

#genes with PIP>0.8 or 20 highest PIPs
head(df_gene[,c("genename", "combined_pip", "Liver")], max(sum(df_gene$combined_pip>0.8), 20))
genename combined_pip Liver
11391 N4BP2L1 2.6363568 2.779247e-03
8899 LDLR 2.0000000 NA
18533 SP4 1.9678399 9.992645e-01
12659 PCSK9 1.9653204 NA
20423 TXNL4B 1.9360994 NA
8356 KCNK3 1.8636853 NA
78 ABCG8 1.7463517 5.485313e-01
36 ABCA1 1.7131846 9.998566e-01
12513 PARP9 1.6919785 1.311536e-02
21260 ZDHHC7 1.4476807 4.802575e-03
17961 SLC22A1 1.3371909 NA
593 ACVR1C 1.2481918 9.346819e-01
362 AC073257.2 1.2111168 1.137434e-03
4991 DNAJC13 1.2050427 1.667727e-01
12119 NYNRIN 1.1151374 9.739043e-01
10045 LITAF 1.1136612 1.025066e-01
13867 PXK 1.0880080 4.587298e-03
10495 MARC1 1.0797668 6.429089e-02
539 ACP6 1.0547871 4.519575e-02
6142 FCGRT 1.0407669 1.563035e-02
3648 CNIH4 1.0403337 6.068566e-01
1511 ASGR1 1.0365428 NA
2062 C10orf88 1.0352894 7.367786e-03
7627 HPR 1.0332530 9.998230e-01
19490 TIMD4 1.0332270 NA
7526 HMGCR 1.0327456 NA
6583 GAS6 1.0308308 9.993799e-01
2404 C6orf106 1.0304899 1.152956e-02
3283 CETP 1.0300162 9.107228e-03
13730 PSRC1 1.0284621 9.748017e-01
13159 PLTP 1.0271601 8.494840e-01
4006 CSNK1G3 1.0251799 9.975428e-01
5767 FADS1 1.0246555 9.878783e-01
11330 MYLIP 1.0225010 4.908059e-03
11866 NPC1L1 1.0211863 5.712926e-01
18799 ST3GAL4 1.0210225 8.912349e-01
7494 HLA-DOB 1.0194407 9.106181e-03
13720 PSMG1 1.0164963 8.163365e-02
20690 USP28 1.0160222 2.237867e-03
18700 SPTY2D1 1.0158874 4.935378e-01
17203 RRBP1 1.0152336 9.942847e-01
12771 PELO 1.0144536 3.174076e-02
6293 FLT3 1.0139908 1.176088e-02
7141 GSK3B 1.0137367 6.607167e-02
13021 PKN3 1.0135939 1.959753e-01
1607 ATP1B2 1.0129527 4.299207e-01
8023 INSIG2 1.0118501 9.999989e-01
7393 HFE 1.0116575 5.033274e-03
12861 PHC1 1.0115913 3.814000e-02
20125 TRIM39 1.0109401 9.990462e-01
7544 HNF1A 1.0093247 8.859540e-03
5798 FAM117B 1.0092980 NA
19919 TNKS 1.0050947 9.998403e-01
4539 CYP2A6 1.0045799 9.509540e-01
10866 MITF 1.0039619 9.839026e-03
10113 LPA 1.0008389 3.634569e-04
16947 RP4-781K5.7 1.0005515 9.564623e-01
8426 KDSR 1.0000915 3.953176e-01
1263 APOB 1.0000000 1.578648e-11
13992 RAC1 0.9999827 5.527332e-03
18848 STAT5B 0.9997169 4.538253e-01
46 ABCA8 0.9988278 NA
13294 POP7 0.9988130 4.204977e-01
734 ADRB1 0.9980826 7.291318e-03
12853 PGS1 0.9927453 1.197515e-02
958 ALLC 0.9919668 9.725759e-01
5605 ERGIC3 0.9904117 NA
12000 NT5DC1 0.9890894 1.585599e-02
21471 ZNF329 0.9875014 1.913257e-01
10127 LPL 0.9868029 5.415695e-03
12693 PDE4C 0.9831384 3.175422e-03
17779 SH3TC1 0.9805800 1.217851e-02
18181 SLC4A7 0.9799874 1.266394e-02
12242 OR2H2 0.9794274 NA
13087 PLEC 0.9786905 1.337186e-02
20717 USP53 0.9777320 3.233507e-01
5064 DOPEY2 0.9773328 5.970757e-03
5118 DRD2 0.9769902 NA
13535 PRKD2 0.9764914 8.451069e-01
77 ABCG5 0.9758083 NA
13552 PRMT6 0.9745100 8.127810e-01
12639 PCMTD2 0.9730153 2.071639e-01
12336 OSGIN1 0.9706080 9.624309e-01
17846 SIPA1 0.9675438 8.920474e-03
1486 ASAP3 0.9653063 9.120411e-01
4566 CYP4F12 0.9651260 7.936832e-03
17733 SGMS1 0.9620011 6.978874e-01
8089 IRF2BP1 0.9615833 NA
4534 CYP26C1 0.9614738 NA
20828 VPS37D 0.9546597 3.120892e-02
6929 GPAM 0.9522601 NA
1816 BCAT2 0.9511309 4.932736e-01
19074 SYTL1 0.9472628 4.907381e-01
6358 FOXF1 0.9443884 3.630297e-02
6313 FN1 0.9432315 NA
20318 TTC39B 0.9391861 8.254973e-01
7300 HBS1L 0.9372965 3.337573e-01
5297 EEPD1 0.9349431 4.929160e-01
10243 LRRK2 0.9341073 9.185921e-01
7852 IGF2R 0.9224562 4.050024e-01
2903 CCND2 0.9218828 3.509243e-01
18067 SLC2A4RG 0.9207592 6.892090e-02
224 AC007950.2 0.9189124 4.764393e-03
3902 CRACR2B 0.9163486 5.124684e-01
20673 USP1 0.9128224 7.321420e-01
3986 CSE1L 0.9082353 9.336825e-03
12015 NTN5 0.9038029 NA
7143 GSN 0.9022591 5.765758e-01
3517 CLDN23 0.9018924 8.257987e-01
18824 STAC3 0.8980901 NA
10320 LY96 0.8942083 NA
18749 SRRT 0.8864554 6.965266e-01
6589 GATA3 0.8795033 NA
2078 C11orf58 0.8749333 4.064828e-01
8580 KLHDC7A 0.8729319 8.183601e-01
4439 CTSH 0.8726960 2.717720e-01
1993 BRWD1 0.8698207 NA
6881 GOLGA3 0.8588020 5.439460e-03
19594 TMED4 0.8583463 6.035695e-03
21561 ZNF486 0.8566501 2.531606e-02
2957 CD163L1 0.8533031 2.199325e-02
20897 WBP4 0.8518498 NA
9407 LINC01184 0.8487412 2.824512e-01
16541 RP11-766F14.2 0.8449696 NA
13930 RAB21 0.8424570 7.542498e-03
1977 BRI3 0.8316413 8.074427e-01
18496 SORCS2 0.8314154 4.120853e-01
19454 THOP1 0.8309397 2.491448e-01
11443 NAP1L4 0.8286951 8.186003e-03
1809 BCAR1 0.8276299 NA
11842 NOS3 0.8220421 9.106728e-03
5817 FAM134B 0.8204765 NA
19991 TP53INP1 0.8201000 5.168250e-01
20788 VIL1 0.8156495 4.510462e-01
11657 NF1 0.8153226 9.651858e-03
17489 SDC4 0.8149133 7.844299e-01
3961 CRTC3 0.8100111 7.015122e-01
20136 TRIM5 0.8095141 2.661279e-02
6116 FBXO46 0.8069903 NA
4099 CTB-50L17.10 0.8055965 7.615144e-01write.csv(df_gene, file="LDL_all_tissue_PIPs.csv")
all_tissue_genes <- df_gene$genename[df_gene$combined_pip>0.8]
#number of genes detected by combined PIP
length(all_tissue_genes)[1] 140Silver Standard
library(readxl)

known_annotations <- read_xlsx("data/summary_known_genes_annotations.xlsx", sheet="LDL")
New names:known_annotations <- unique(known_annotations$`Gene Symbol`)
#number of silver standard genes
length(known_annotations)[1] 69#number of silver standard genes in all tissue genes
sum(all_tissue_genes %in% known_annotations)[1] 15#list silver standard genes detected
all_tissue_genes[all_tissue_genes %in% known_annotations] [1] "LDLR" "PCSK9" "ABCG8" "ABCA1" "HMGCR" "CETP" "PLTP"
[8] "FADS1" "MYLIP" "NPC1L1" "TNKS" "LPA" "APOB" "LPL"
[15] "ABCG5" Enrichment Analysis
library(enrichR)Welcome to enrichR
Checking connection ... Enrichr ... Connection is Live!
FlyEnrichr ... Connection is available!
WormEnrichr ... Connection is available!
YeastEnrichr ... Connection is available!
FishEnrichr ... Connection is available!dbs <- c("GO_Biological_Process_2021", "GO_Cellular_Component_2021", "GO_Molecular_Function_2021")
genes <- all_tissue_genes
GO_enrichment <- enrichr(genes, dbs)Uploading data to Enrichr... Done.
Querying GO_Biological_Process_2021... Done.
Querying GO_Cellular_Component_2021... Done.
Querying GO_Molecular_Function_2021... Done.
Parsing results... Done.for (db in dbs){
print(db)
df <- GO_enrichment[[db]]
print(plotEnrich(GO_enrichment[[db]]))
df <- df[df$Adjusted.P.value<0.05,c("Term", "Overlap", "Adjusted.P.value", "Genes")]
print(df)
}[1] "GO_Biological_Process_2021"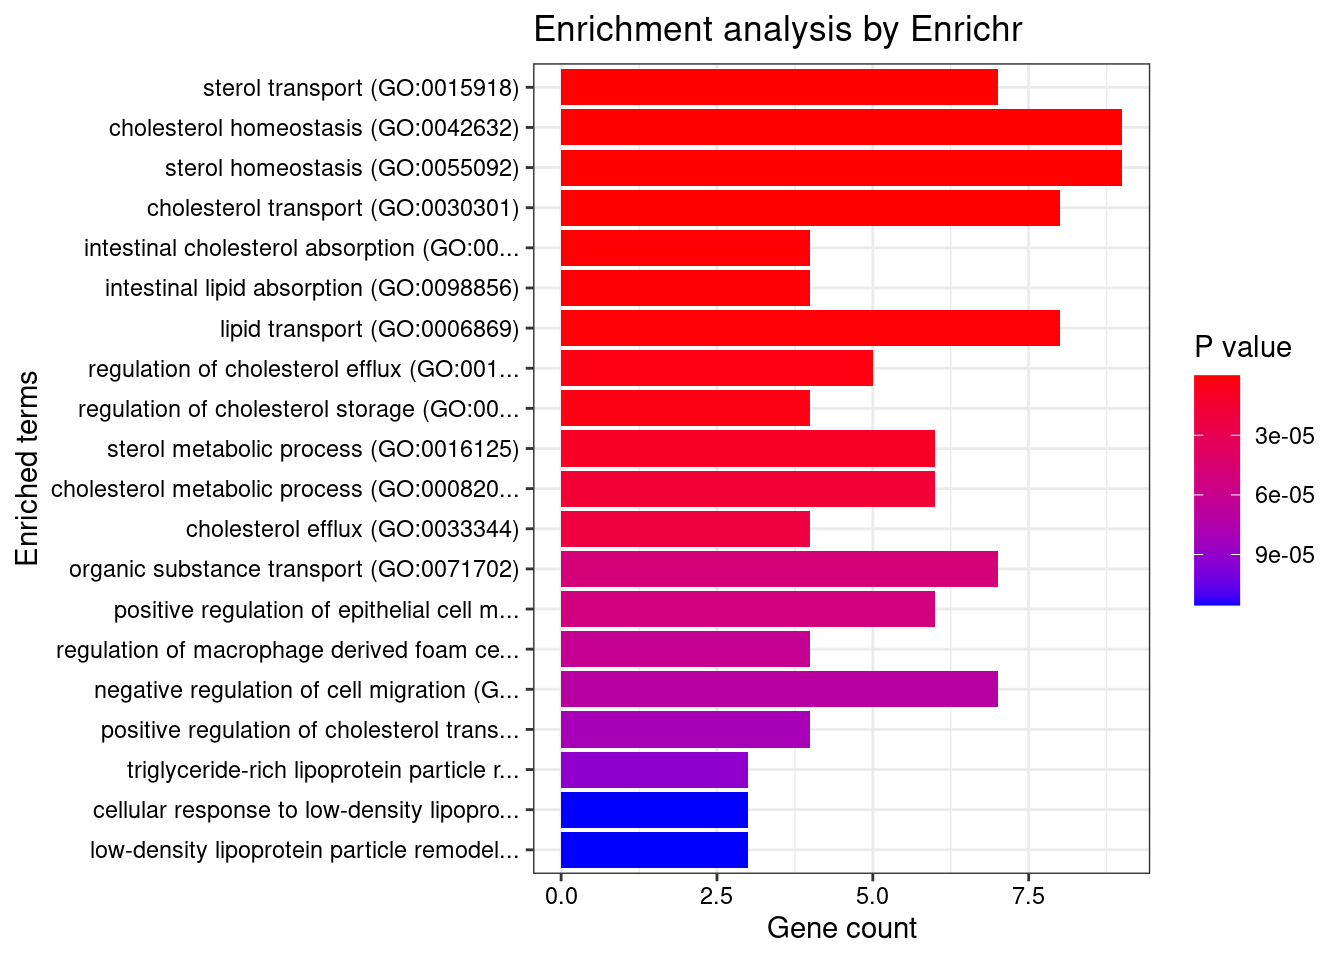
Term
1 sterol transport (GO:0015918)
2 cholesterol homeostasis (GO:0042632)
3 sterol homeostasis (GO:0055092)
4 cholesterol transport (GO:0030301)
5 intestinal cholesterol absorption (GO:0030299)
6 intestinal lipid absorption (GO:0098856)
7 lipid transport (GO:0006869)
8 regulation of cholesterol efflux (GO:0010874)
9 regulation of cholesterol storage (GO:0010885)
10 sterol metabolic process (GO:0016125)
11 cholesterol metabolic process (GO:0008203)
12 cholesterol efflux (GO:0033344)
13 organic substance transport (GO:0071702)
14 positive regulation of epithelial cell migration (GO:0010634)
15 regulation of macrophage derived foam cell differentiation (GO:0010743)
16 negative regulation of cell migration (GO:0030336)
17 positive regulation of cholesterol transport (GO:0032376)
18 triglyceride-rich lipoprotein particle remodeling (GO:0034370)
19 cellular response to low-density lipoprotein particle stimulus (GO:0071404)
20 low-density lipoprotein particle remodeling (GO:0034374)
21 peptidyl-serine phosphorylation (GO:0018105)
22 phospholipid biosynthetic process (GO:0008654)
23 peptidyl-serine modification (GO:0018209)
24 regulation of neuroblast proliferation (GO:1902692)
25 excitatory postsynaptic potential (GO:0060079)
26 positive regulation of endothelial cell migration (GO:0010595)
27 regulation of endothelial cell migration (GO:0010594)
28 autonomic nervous system development (GO:0048483)
29 alditol phosphate metabolic process (GO:0052646)
30 receptor-mediated endocytosis (GO:0006898)
31 positive regulation of cholesterol efflux (GO:0010875)
32 triglyceride metabolic process (GO:0006641)
33 regulation of cholesterol transport (GO:0032374)
34 chemical synaptic transmission, postsynaptic (GO:0099565)
35 negative regulation of actin filament depolymerization (GO:0030835)
36 positive regulation of cholesterol storage (GO:0010886)
37 membrane lipid biosynthetic process (GO:0046467)
38 regulation of actin filament bundle assembly (GO:0032231)
39 peptidyl-threonine phosphorylation (GO:0018107)
40 chylomicron remnant clearance (GO:0034382)
41 actin filament polymerization (GO:0030041)
42 cellular response to nutrient levels (GO:0031669)
43 cell projection organization (GO:0030030)
44 nervous system development (GO:0007399)
45 negative regulation of cell motility (GO:2000146)
46 peptidyl-threonine modification (GO:0018210)
47 actin filament reorganization (GO:0090527)
48 regulation of dopamine receptor signaling pathway (GO:0060159)
49 cellular response to interferon-alpha (GO:0035457)
50 regulation of intestinal cholesterol absorption (GO:0030300)
51 regulation of gene expression (GO:0010468)
52 kidney development (GO:0001822)
53 positive regulation of macromolecule metabolic process (GO:0010604)
54 cellular response to sterol depletion (GO:0071501)
55 chylomicron remodeling (GO:0034371)
56 very-low-density lipoprotein particle remodeling (GO:0034372)
57 negative regulation of biomineralization (GO:0110150)
58 phosphatidylglycerol biosynthetic process (GO:0006655)
59 secondary alcohol biosynthetic process (GO:1902653)
60 sphingolipid biosynthetic process (GO:0030148)
61 cholesterol biosynthetic process (GO:0006695)
62 regulation of postsynaptic membrane potential (GO:0060078)
63 phospholipid metabolic process (GO:0006644)
64 positive regulation of signal transduction (GO:0009967)
65 protein poly-ADP-ribosylation (GO:0070212)
66 low-density lipoprotein particle receptor catabolic process (GO:0032802)
67 low-density lipoprotein receptor particle metabolic process (GO:0032799)
68 negative regulation of cholesterol storage (GO:0010887)
69 negative regulation of receptor binding (GO:1900121)
70 cellular response to insulin stimulus (GO:0032869)
Overlap Adjusted.P.value
1 7/21 1.220958e-07
2 9/71 9.370116e-07
3 9/72 9.370116e-07
4 8/51 9.370116e-07
5 4/9 9.080062e-05
6 4/11 1.960300e-04
7 8/109 2.272585e-04
8 5/33 6.381378e-04
9 4/16 7.014077e-04
10 6/70 1.543432e-03
11 6/77 2.437496e-03
12 4/24 2.940614e-03
13 7/136 5.967299e-03
14 6/94 5.967299e-03
15 4/31 6.706199e-03
16 7/144 7.053146e-03
17 4/33 7.612259e-03
18 3/13 8.157485e-03
19 3/14 8.880989e-03
20 3/14 8.880989e-03
21 7/156 8.880989e-03
22 4/37 9.290161e-03
23 7/169 1.331210e-02
24 3/17 1.425102e-02
25 3/19 1.929651e-02
26 5/86 2.140931e-02
27 5/89 2.340657e-02
28 3/21 2.340657e-02
29 2/5 2.663887e-02
30 6/143 2.761633e-02
31 3/23 2.786461e-02
32 4/55 2.992106e-02
33 3/25 3.167432e-02
34 3/25 3.167432e-02
35 2/6 3.167432e-02
36 2/6 3.167432e-02
37 4/58 3.167432e-02
38 3/26 3.286387e-02
39 4/60 3.416716e-02
40 2/7 4.018627e-02
41 3/29 4.215535e-02
42 4/66 4.266876e-02
43 3/30 4.266876e-02
44 10/447 4.266876e-02
45 5/114 4.266876e-02
46 4/67 4.266876e-02
47 2/8 4.266876e-02
48 2/8 4.266876e-02
49 2/8 4.266876e-02
50 2/8 4.266876e-02
51 17/1079 4.565444e-02
52 4/70 4.565444e-02
53 9/384 4.676490e-02
54 2/9 4.676490e-02
55 2/9 4.676490e-02
56 2/9 4.676490e-02
57 2/9 4.676490e-02
58 2/9 4.676490e-02
59 3/34 4.676490e-02
60 4/74 4.842649e-02
61 3/35 4.842649e-02
62 3/35 4.842649e-02
63 4/76 4.923746e-02
64 7/252 4.923746e-02
65 2/10 4.923746e-02
66 2/10 4.923746e-02
67 2/10 4.923746e-02
68 2/10 4.923746e-02
69 2/10 4.923746e-02
70 5/129 4.946696e-02
Genes
1 ABCG8;CETP;ABCG5;NPC1L1;ABCA8;APOB;LDLR
2 ABCA1;ABCG8;CETP;ABCG5;PCSK9;LPL;APOB;LDLR;TTC39B
3 ABCA1;ABCG8;CETP;ABCG5;PCSK9;LPL;APOB;LDLR;TTC39B
4 ABCA1;ABCG8;CETP;ABCG5;NPC1L1;ABCA8;APOB;LDLR
5 ABCG8;ABCG5;NPC1L1;LDLR
6 ABCG8;ABCG5;NPC1L1;LDLR
7 ABCA1;ABCG8;CETP;ABCG5;NPC1L1;ABCA8;PLTP;LDLR
8 CETP;EEPD1;ABCA8;PLTP;TTC39B
9 ABCA1;LPL;APOB;TTC39B
10 ABCA1;CETP;CYP26C1;INSIG2;HMGCR;APOB
11 ABCA1;CETP;INSIG2;NPC1L1;HMGCR;APOB
12 ABCA1;ABCG8;ABCG5;ABCA8
13 ABCA1;ABCG8;CETP;ABCG5;SLC22A1;ABCA8;PLTP
14 VIL1;CTSH;PRKD2;RAC1;GATA3;BCAR1
15 ABCA1;CETP;LPL;APOB
16 ACVR1C;TP53INP1;NF1;MITF;ATP1B2;RAC1;DRD2
17 CETP;EEPD1;ABCA8;PLTP
18 CETP;LPL;APOB
19 ABCA1;LPL;LDLR
20 CETP;APOB;LPA
21 CSNK1G3;GSK3B;TNKS;PKN3;LRRK2;PRKD2;GAS6
22 SGMS1;GPAM;ABCA8;FADS1
23 CSNK1G3;GSK3B;TNKS;PKN3;LRRK2;PRKD2;GAS6
24 LRRK2;NF1;DRD2
25 GSK3B;LRRK2;DRD2
26 NOS3;PRKD2;RAC1;GATA3;BCAR1
27 NF1;PRKD2;RAC1;GATA3;BCAR1
28 FN1;NF1;GATA3
29 GPAM;ACP6
30 DNAJC13;HPR;APOB;LDLR;IGF2R;ASGR1
31 EEPD1;ABCA8;PLTP
32 CETP;GPAM;LPL;APOB
33 CETP;ABCA8;TTC39B
34 GSK3B;LRRK2;DRD2
35 VIL1;GSN
36 LPL;APOB
37 SGMS1;ST3GAL4;PRKD2;KDSR
38 VIL1;ASAP3;RAC1
39 GSK3B;TNKS;LRRK2;PRKD2
40 APOB;LDLR
41 VIL1;GSN;RAC1
42 LRRK2;PCSK9;LPL;FADS1
43 GSN;RAC1;ATP1B2
44 MYLIP;CYP26C1;ACVR1C;GSN;FN1;NF1;PCSK9;NTN5;HMGCR;DRD2
45 TP53INP1;NF1;MITF;GATA3;DRD2
46 GSK3B;TNKS;LRRK2;PRKD2
47 GSN;BCAR1
48 LRRK2;DRD2
49 GATA3;GAS6
50 ABCG8;ABCG5
51 GSK3B;GSN;NOS3;HFE;SRRT;FN1;MITF;GATA3;PARP9;SPTY2D1;TRIM39;TRIM5;CTSH;GAS6;FADS1;SLC2A4RG;ZNF486
52 NF1;PCSK9;CTSH;GATA3
53 GSK3B;GSN;NOS3;HFE;FN1;PCSK9;CTSH;MITF;GAS6
54 INSIG2;NPC1L1
55 LPL;APOB
56 CETP;LPL
57 NOS3;GAS6
58 PGS1;GPAM
59 INSIG2;NPC1L1;HMGCR
60 SGMS1;PRKD2;KDSR;ABCA8
61 INSIG2;NPC1L1;HMGCR
62 GSK3B;LRRK2;DRD2
63 GPAM;ACP6;LPL;FADS1
64 TRIM39;NOS3;LRRK2;LY96;PRKD2;GATA3;GAS6
65 TNKS;PARP9
66 MYLIP;PCSK9
67 MYLIP;PCSK9
68 ABCA1;TTC39B
69 HFE;PCSK9
70 GSK3B;INSIG2;PCSK9;ZDHHC7;BCAR1
[1] "GO_Cellular_Component_2021"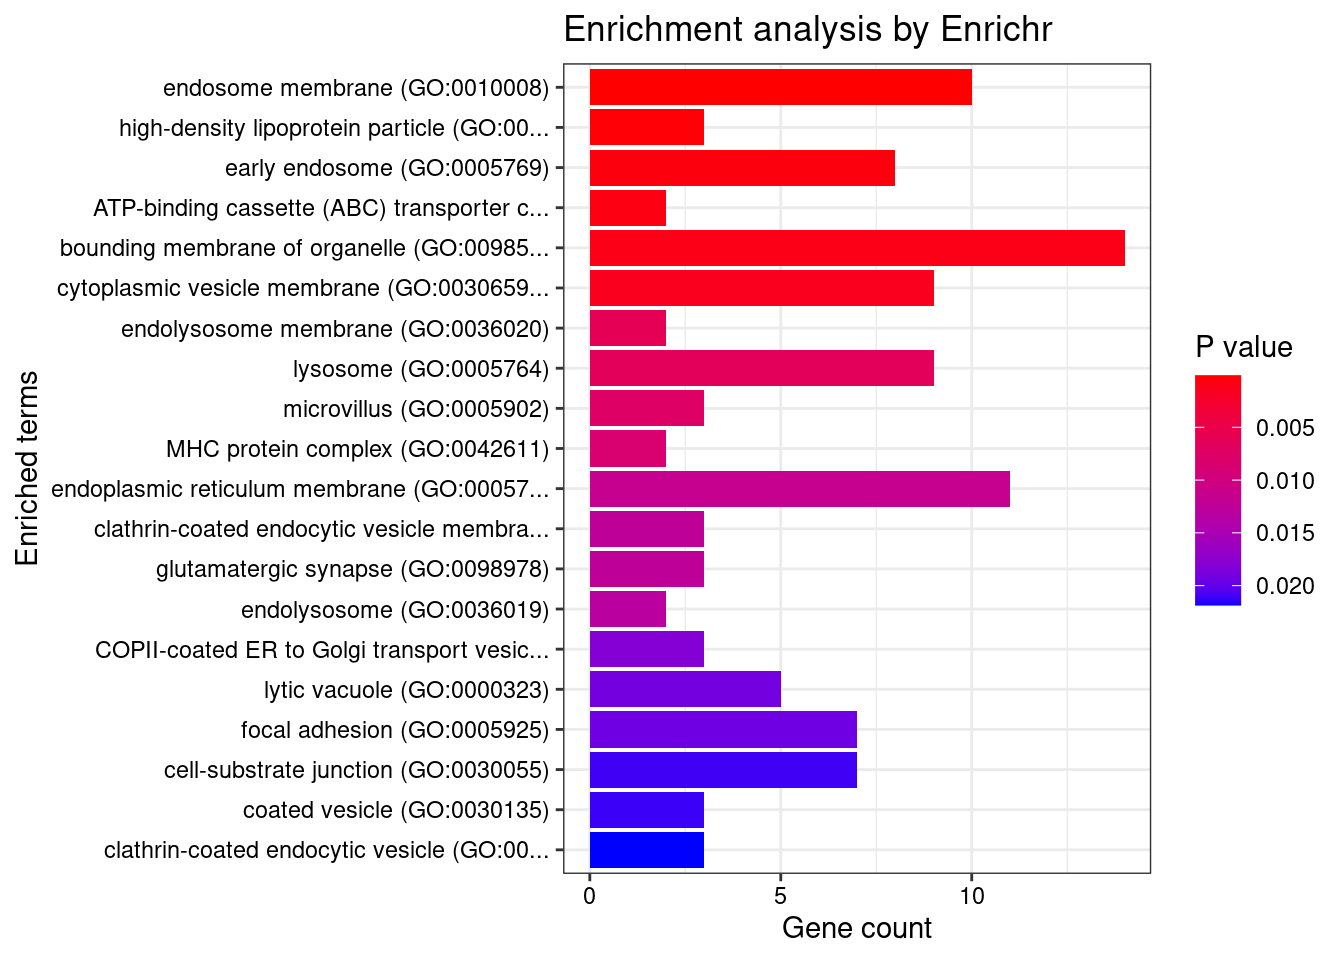
                                                         Term Overlap
1                              endosome membrane (GO:0010008)  10/325
2              high-density lipoprotein particle (GO:0034364)    3/19
3                                 early endosome (GO:0005769)   8/266
4 ATP-binding cassette (ABC) transporter complex (GO:0043190)     2/6
5                 bounding membrane of organelle (GO:0098588)  14/767
6                   cytoplasmic vesicle membrane (GO:0030659)   9/380
  Adjusted.P.value
1       0.01729750
2       0.02606826
3       0.03116523
4       0.03116523
5       0.03449305
6       0.04196977
                                                                                Genes
1                           RAB21;FLT3;LY96;PCSK9;VPS37D;DNAJC13;RAC1;APOB;LDLR;IGF2R
2                                                                       CETP;HPR;PLTP
3                                       RAB21;HFE;PCSK9;ADRB1;DNAJC13;APOB;LDLR;IGF2R
4                                                                         ABCG8;ABCG5
5 SGMS1;FLT3;NOS3;LY96;VPS37D;ZDHHC7;DNAJC13;IGF2R;GOLGA3;ST3GAL4;RAC1;APOB;DRD2;LDLR
6                                  FLT3;NOS3;LY96;VPS37D;DNAJC13;RAC1;APOB;LDLR;IGF2R
[1] "GO_Molecular_Function_2021"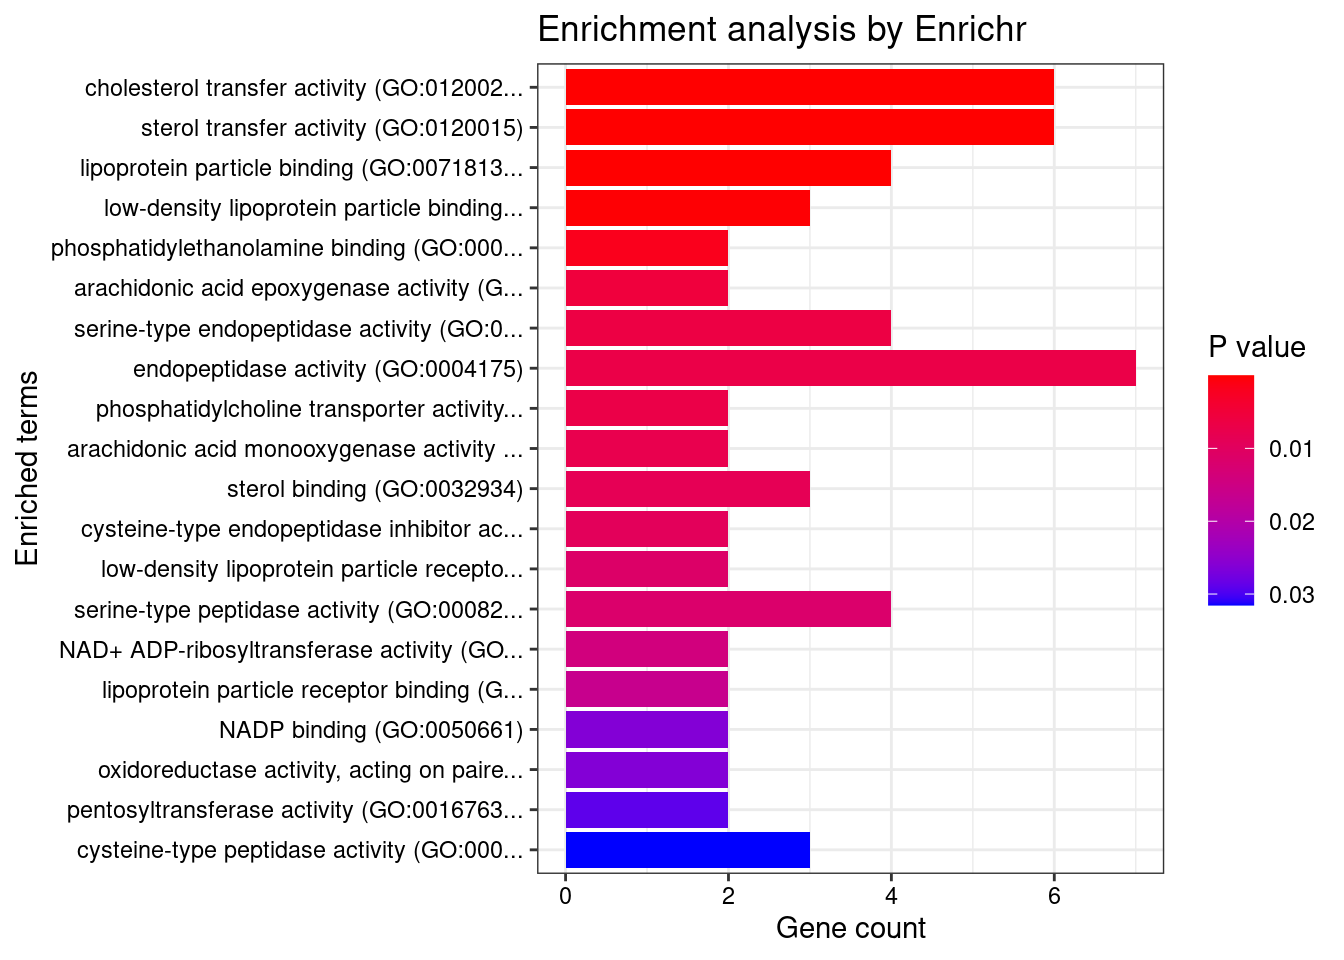
                                                   Term Overlap
1            cholesterol transfer activity (GO:0120020)    6/18
2                 sterol transfer activity (GO:0120015)    6/19
3             lipoprotein particle binding (GO:0071813)    4/24
4 low-density lipoprotein particle binding (GO:0030169)    3/17
  Adjusted.P.value                            Genes
1     3.150420e-07 ABCA1;ABCG8;CETP;ABCG5;APOB;PLTP
2     3.150420e-07 ABCA1;ABCG8;CETP;ABCG5;APOB;PLTP
3     1.731492e-03              LPL;PCSK9;LDLR;PLTP
4     1.258693e-02                  PCSK9;LDLR;PLTP
sessionInfo()R version 3.6.1 (2019-07-05)
Platform: x86_64-pc-linux-gnu (64-bit)
Running under: CentOS Linux 7 (Core)
Matrix products: default
BLAS/LAPACK: /software/openblas-0.2.19-el7-x86_64/lib/libopenblas_haswellp-r0.2.19.so
locale:
[1] C
attached base packages:
[1] stats graphics grDevices utils datasets methods base
other attached packages:
[1] enrichR_3.0 readxl_1.3.1 cowplot_1.1.1 ggplot2_3.3.5
loaded via a namespace (and not attached):
[1] tidyselect_1.1.2 xfun_0.8 purrr_0.3.4
[4] colorspace_1.4-1 vctrs_0.4.1 generics_0.0.2
[7] htmltools_0.5.2 yaml_2.2.0 utf8_1.2.1
[10] blob_1.2.1 rlang_1.0.2 later_0.8.0
[13] pillar_1.7.0 glue_1.6.2 withr_2.4.1
[16] DBI_1.1.1 bit64_4.0.5 lifecycle_1.0.1
[19] stringr_1.4.0 cellranger_1.1.0 munsell_0.5.0
[22] gtable_0.3.0 workflowr_1.6.2 memoise_2.0.0
[25] evaluate_0.14 labeling_0.3 knitr_1.23
[28] fastmap_1.1.0 httpuv_1.5.1 curl_3.3
[31] fansi_0.5.0 Rcpp_1.0.6 promises_1.0.1
[34] scales_1.2.0 cachem_1.0.5 farver_2.1.0
[37] fs_1.5.2 bit_4.0.4 rjson_0.2.20
[40] digest_0.6.20 stringi_1.4.3 dplyr_1.0.9
[43] rprojroot_2.0.2 grid_3.6.1 cli_3.3.0
[46] tools_3.6.1 magrittr_2.0.3 tibble_3.1.7
[49] RSQLite_2.2.7 crayon_1.4.1 whisker_0.3-2
[52] pkgconfig_2.0.3 ellipsis_0.3.2 data.table_1.14.0
[55] httr_1.4.1 rmarkdown_1.13 R6_2.5.0
[58] git2r_0.26.1 compiler_3.6.1