Ulcerative colitis - all weights (no lncRNA)
wesleycrouse
2022-06-09
Last updated: 2022-06-14
Checks: 6 1
Knit directory: ctwas_applied/
This reproducible R Markdown analysis was created with workflowr (version 1.6.2). The Checks tab describes the reproducibility checks that were applied when the results were created. The Past versions tab lists the development history.
The R Markdown file has unstaged changes. To know which version of the R Markdown file created these results, you’ll want to first commit it to the Git repo. If you’re still working on the analysis, you can ignore this warning. When you’re finished, you can run wflow_publish to commit the R Markdown file and build the HTML.
Great job! The global environment was empty. Objects defined in the global environment can affect the analysis in your R Markdown file in unknown ways. For reproduciblity it’s best to always run the code in an empty environment.
The command set.seed(20210726) was run prior to running the code in the R Markdown file. Setting a seed ensures that any results that rely on randomness, e.g. subsampling or permutations, are reproducible.
Great job! Recording the operating system, R version, and package versions is critical for reproducibility.
Nice! There were no cached chunks for this analysis, so you can be confident that you successfully produced the results during this run.
Great job! Using relative paths to the files within your workflowr project makes it easier to run your code on other machines.
Great! You are using Git for version control. Tracking code development and connecting the code version to the results is critical for reproducibility.
The results in this page were generated with repository version a36d798. See the Past versions tab to see a history of the changes made to the R Markdown and HTML files.
Note that you need to be careful to ensure that all relevant files for the analysis have been committed to Git prior to generating the results (you can use wflow_publish or wflow_git_commit). workflowr only checks the R Markdown file, but you know if there are other scripts or data files that it depends on. Below is the status of the Git repository when the results were generated:
Untracked files:
    Untracked:  analysis/ebi-a-GCST004133_allweights_nolnc_bkup.Rmd
    Untracked:  group_enrichment_results.RData
    Untracked:  workspace.RData
    Untracked:  workspace2.RData
    Untracked:  workspace3.RData
    Untracked:  workspace4.RData
    Untracked:  workspace5.RData
    Untracked:  z_snp_pos_ebi-a-GCST004131.RData
    Untracked:  z_snp_pos_ebi-a-GCST004132.RData
    Untracked:  z_snp_pos_ebi-a-GCST004133.RData
    Untracked:  z_snp_pos_ukb-d-30780_irnt.RData

Unstaged changes:
    Modified:   analysis/ebi-a-GCST004133_allweights_nolnc.Rmd
    Modified:   code/automate_Rmd.R
Note that any generated files, e.g. HTML, png, CSS, etc., are not included in this status report because it is ok for generated content to have uncommitted changes.
These are the previous versions of the repository in which changes were made to the R Markdown (analysis/ebi-a-GCST004133_allweights_nolnc.Rmd) and HTML (docs/ebi-a-GCST004133_allweights_nolnc.html) files. If you’ve configured a remote Git repository (see ?wflow_git_remote), click on the hyperlinks in the table below to view the files as they were in that past version.
| File | Version | Author | Date | Message |
|---|---|---|---|---|
| Rmd | 0136d2e | wesleycrouse | 2022-06-10 | reports without lncRNA |
| html | 0136d2e | wesleycrouse | 2022-06-10 | reports without lncRNA |
options(width=1000)trait_id <- "ebi-a-GCST004133"
trait_name <- "Ulcerative colitis"
source("/project2/mstephens/wcrouse/UKB_analysis_allweights/ctwas_config.R")
trait_dir <- paste0("/project2/mstephens/wcrouse/UKB_analysis_allweights/", trait_id)
results_dirs <- list.dirs(trait_dir, recursive=F)
results_dirs <- results_dirs[grep("nolnc", results_dirs)]Load cTWAS results for all weights
# df <- list()
#
# for (i in 1:length(results_dirs)){
#   print(i)
#
#   results_dir <- results_dirs[i]
#   weight <- rev(unlist(strsplit(results_dir, "/")))[1]
#   weight <- unlist(strsplit(weight, split="_nolnc"))
#   analysis_id <- paste(trait_id, weight, sep="_")
#
#   #load ctwas results
#   ctwas_res <- data.table::fread(paste0(results_dir, "/", analysis_id, "_ctwas.susieIrss.txt"))
#
#   #make unique identifier for regions and effects
#   ctwas_res$region_tag <- paste(ctwas_res$region_tag1, ctwas_res$region_tag2, sep="_")
#   ctwas_res$region_cs_tag <- paste(ctwas_res$region_tag, ctwas_res$cs_index, sep="_")
#
#   #load z scores for SNPs and collect sample size
#   load(paste0(results_dir, "/", analysis_id, "_expr_z_snp.Rd"))
#
#   sample_size <- z_snp$ss
#   sample_size <- as.numeric(names(which.max(table(sample_size))))
#
#   #separate gene and SNP results
#   ctwas_gene_res <- ctwas_res[ctwas_res$type == "gene", ]
#   ctwas_gene_res <- data.frame(ctwas_gene_res)
#   ctwas_snp_res <- ctwas_res[ctwas_res$type == "SNP", ]
#   ctwas_snp_res <- data.frame(ctwas_snp_res)
#
#   #add gene information to results
#   sqlite <- RSQLite::dbDriver("SQLite")
#   db = RSQLite::dbConnect(sqlite, paste0("/project2/mstephens/wcrouse/predictdb_nolnc/mashr_", weight, "_nolnc.db"))
#   query <- function(...) RSQLite::dbGetQuery(db, ...)
#   gene_info <- query("select gene, genename, gene_type from extra")
#   RSQLite::dbDisconnect(db)
#
#   ctwas_gene_res <- cbind(ctwas_gene_res, gene_info[sapply(ctwas_gene_res$id, match, gene_info$gene), c("genename", "gene_type")])
#
#   #add z scores to results
#   load(paste0(results_dir, "/", analysis_id, "_expr_z_gene.Rd"))
#   ctwas_gene_res$z <- z_gene[ctwas_gene_res$id,]$z
#
#   z_snp <- z_snp[z_snp$id %in% ctwas_snp_res$id,]
#   ctwas_snp_res$z <- z_snp$z[match(ctwas_snp_res$id, z_snp$id)]
#
#   #merge gene and snp results with added information
#   ctwas_snp_res$genename=NA
#   ctwas_snp_res$gene_type=NA
#
#   ctwas_res <- rbind(ctwas_gene_res, ctwas_snp_res[,colnames(ctwas_gene_res)])
#
#   #get number of eQTL for genes
#   num_eqtl <- c()
#   for (i in 1:22){
#     load(paste0(results_dir, "/", analysis_id, "_expr_chr", i, ".exprqc.Rd"))
#     num_eqtl <- c(num_eqtl, unlist(lapply(wgtlist, nrow)))
#   }
#   ctwas_gene_res$num_eqtl <- num_eqtl[ctwas_gene_res$id]
#
#   #get number of SNPs from s1 results; adjust for thin argument
#   ctwas_res_s1 <- data.table::fread(paste0(results_dir, "/", analysis_id, "_ctwas.s1.susieIrss.txt"))
#   n_snps <- sum(ctwas_res_s1$type=="SNP")/thin
#   rm(ctwas_res_s1)
#
#   #load estimated parameters
#   load(paste0(results_dir, "/", analysis_id, "_ctwas.s2.susieIrssres.Rd"))
#
#   #estimated group prior
#   estimated_group_prior <- group_prior_rec[,ncol(group_prior_rec)]
#   names(estimated_group_prior) <- c("gene", "snp")
#   estimated_group_prior["snp"] <- estimated_group_prior["snp"]*thin #adjust parameter to account for thin argument
#
#   #estimated group prior variance
#   estimated_group_prior_var <- group_prior_var_rec[,ncol(group_prior_var_rec)]
#   names(estimated_group_prior_var) <- c("gene", "snp")
#
#   #report group size
#   group_size <- c(nrow(ctwas_gene_res), n_snps)
#
#   #estimated group PVE
#   estimated_group_pve <- estimated_group_prior_var*estimated_group_prior*group_size/sample_size
#   names(estimated_group_pve) <- c("gene", "snp")
#
#   #ctwas genes using PIP>0.8
#   ctwas_genes_index <- ctwas_gene_res$susie_pip>0.8
#   ctwas_genes <- ctwas_gene_res$genename[ctwas_genes_index]
#
#   #twas genes using bonferroni threshold
#   alpha <- 0.05
#   sig_thresh <- qnorm(1-(alpha/nrow(ctwas_gene_res)/2), lower=T)
#
#   twas_genes_index <- abs(ctwas_gene_res$z) > sig_thresh
#   twas_genes <- ctwas_gene_res$genename[twas_genes_index]
#
#   #gene PIPs and z scores
#   gene_pips <- ctwas_gene_res[,c("genename", "region_tag", "susie_pip", "z", "region_cs_tag", "num_eqtl")]
#
#   #total PIPs by region
#   regions <- unique(ctwas_gene_res$region_tag)
#   region_pips <- data.frame(region=regions, stringsAsFactors=F)
#   region_pips$gene_pip <- sapply(regions, function(x){sum(ctwas_gene_res$susie_pip[ctwas_gene_res$region_tag==x])})
#   region_pips$snp_pip <- sapply(regions, function(x){sum(ctwas_snp_res$susie_pip[ctwas_snp_res$region_tag==x])})
#   region_pips$snp_maxz <- sapply(regions, function(x){max(abs(ctwas_snp_res$z[ctwas_snp_res$region_tag==x]))})
#   region_pips$which_snp_maxz <- sapply(regions, function(x){ctwas_snp_res_index <- ctwas_snp_res$region_tag==x; ctwas_snp_res$id[ctwas_snp_res_index][which.max(abs(ctwas_snp_res$z[ctwas_snp_res_index]))]})
#
#   #total PIPs by causal set
#   regions_cs <- unique(ctwas_gene_res$region_cs_tag)
#   region_cs_pips <- data.frame(region_cs=regions_cs, stringsAsFactors=F)
#   region_cs_pips$gene_pip <- sapply(regions_cs, function(x){sum(ctwas_gene_res$susie_pip[ctwas_gene_res$region_cs_tag==x])})
#   region_cs_pips$snp_pip <- sapply(regions_cs, function(x){sum(ctwas_snp_res$susie_pip[ctwas_snp_res$region_cs_tag==x])})
#
#   df[[weight]] <- list(prior=estimated_group_prior,
#                      prior_var=estimated_group_prior_var,
#                      pve=estimated_group_pve,
#                      ctwas=ctwas_genes,
#                      twas=twas_genes,
#                      gene_pips=gene_pips,
#                      region_pips=region_pips,
#                      sig_thresh=sig_thresh,
#                      region_cs_pips=region_cs_pips)
# }
#
# save(df, file=paste(trait_dir, "results_df_nolnc.RData", sep="/"))
load(paste(trait_dir, "results_df_nolnc.RData", sep="/"))

output <- data.frame(weight=names(df),
                     prior_g=unlist(lapply(df, function(x){x$prior["gene"]})),
                     prior_s=unlist(lapply(df, function(x){x$prior["snp"]})),
                     prior_var_g=unlist(lapply(df, function(x){x$prior_var["gene"]})),
                     prior_var_s=unlist(lapply(df, function(x){x$prior_var["snp"]})),
                     pve_g=unlist(lapply(df, function(x){x$pve["gene"]})),
                     pve_s=unlist(lapply(df, function(x){x$pve["snp"]})),
                     n_ctwas=unlist(lapply(df, function(x){length(x$ctwas)})),
                     n_twas=unlist(lapply(df, function(x){length(x$twas)})),
                     row.names=NULL,
                     stringsAsFactors=F)
Plot estimated prior parameters and PVE
#plot estimated group prior

output <- output[order(-output$prior_g),]

par(mar=c(10.1, 4.1, 4.1, 2.1))

plot(output$prior_g, type="l", ylim=c(0, max(output$prior_g, output$prior_s)*1.1),
     xlab="", ylab="Estimated Group Prior", xaxt = "n", col="blue")
lines(output$prior_s)

axis(1, at = 1:nrow(output),
     labels = output$weight,
     las=2,
     cex.axis=0.6)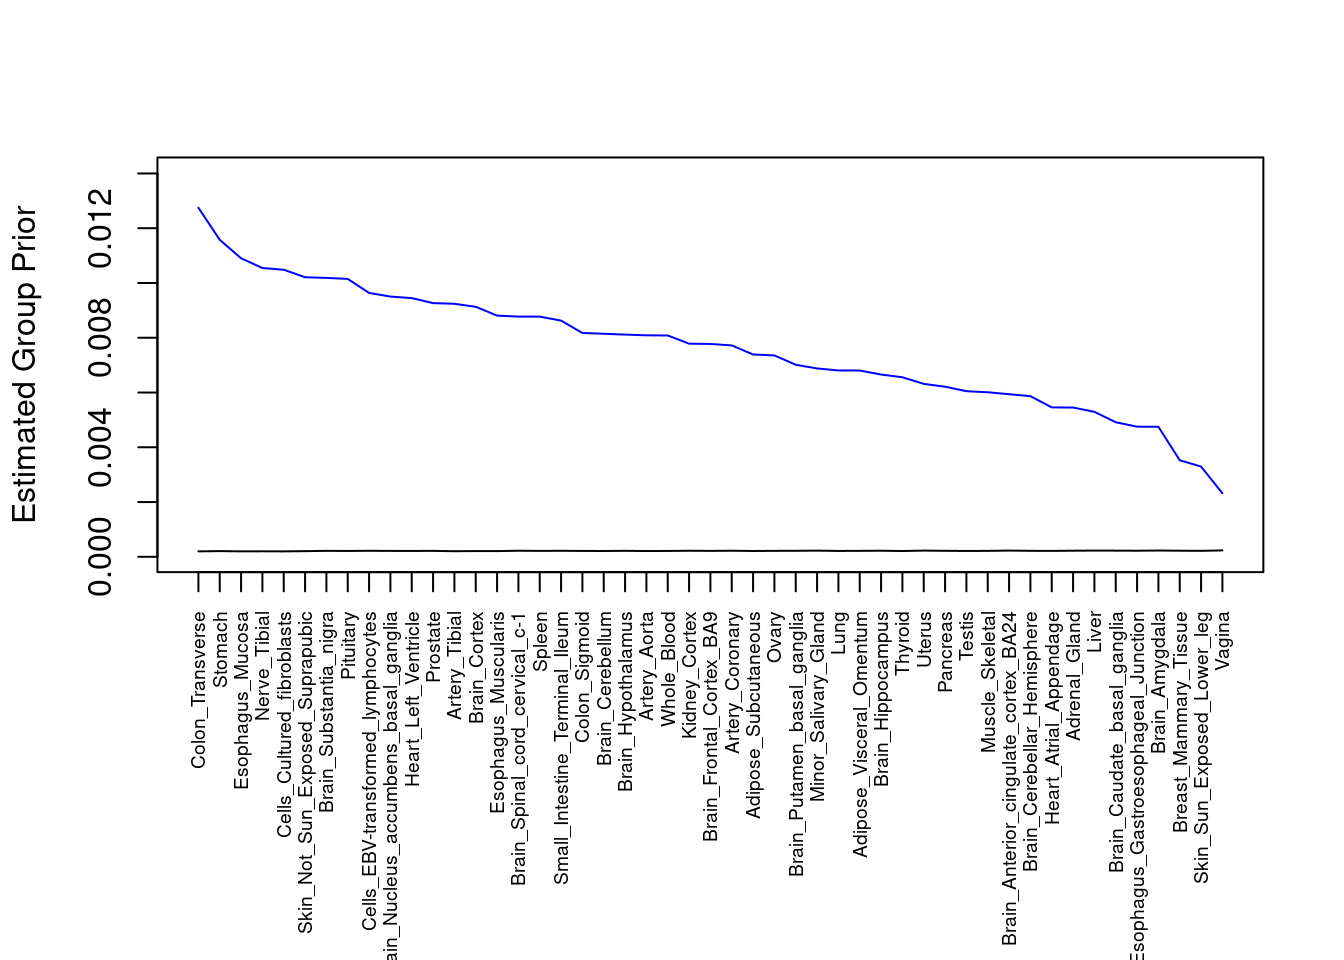
| Version | Author | Date |
|---|---|---|
| 0136d2e | wesleycrouse | 2022-06-10 |
####################
#plot estimated group prior variance

par(mar=c(10.1, 4.1, 4.1, 2.1))

plot(output$prior_var_g, type="l", ylim=c(0, max(output$prior_var_g, output$prior_var_s)*1.1),
     xlab="", ylab="Estimated Group Prior Variance", xaxt = "n", col="blue")
lines(output$prior_var_s)

axis(1, at = 1:nrow(output),
     labels = output$weight,
     las=2,
     cex.axis=0.6)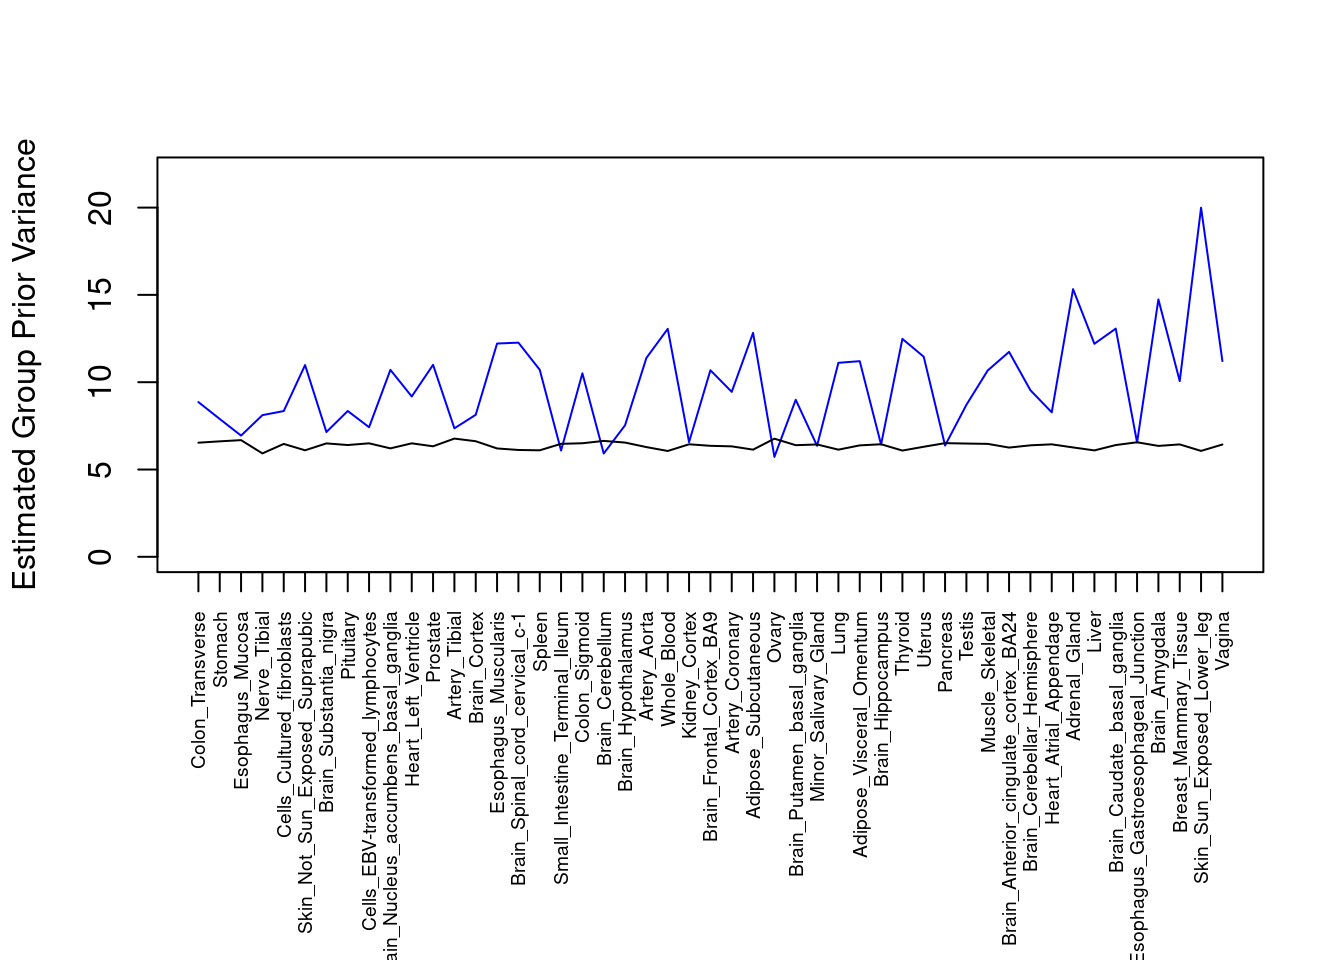
| Version | Author | Date |
|---|---|---|
| 0136d2e | wesleycrouse | 2022-06-10 |
####################
#plot PVE

output <- output[order(-output$pve_g),]

par(mar=c(10.1, 4.1, 4.1, 2.1))

plot(output$pve_g, type="l", ylim=c(0, max(output$pve_g+output$pve_s)*1.1),
     xlab="", ylab="Estimated PVE", xaxt = "n", col="blue")
lines(output$pve_s)
lines(output$pve_g+output$pve_s, lty=2)

axis(1, at = 1:nrow(output),
     labels = output$weight,
     las=2,
     cex.axis=0.6)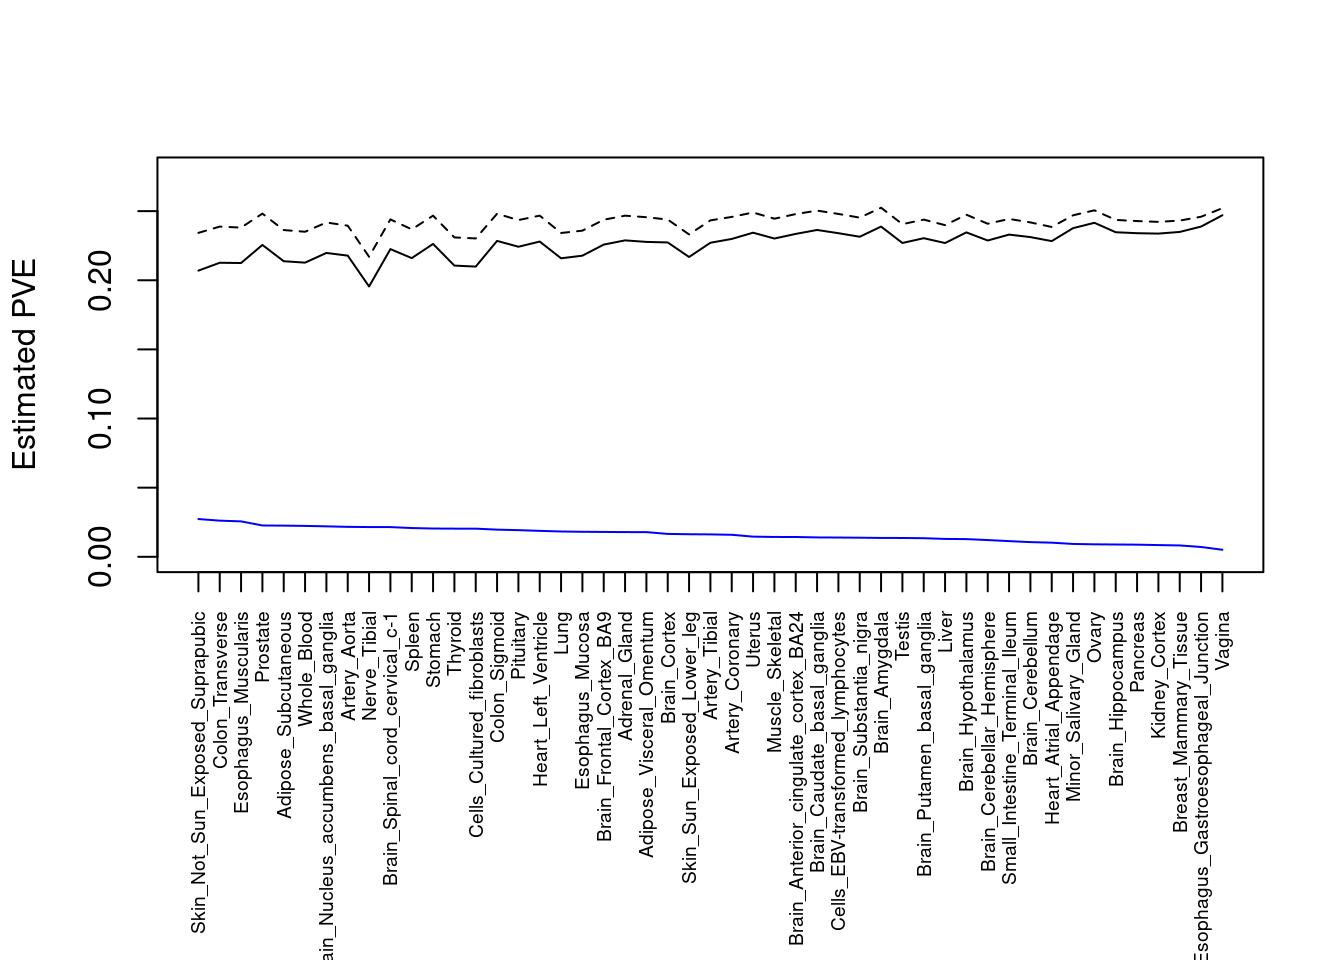
| Version | Author | Date |
|---|---|---|
| 0136d2e | wesleycrouse | 2022-06-10 |
Number of cTWAS and TWAS genes
cTWAS genes are the set of genes with PIP>0.8 in any tissue. TWAS genes are the set of genes with significant z score (Bonferroni within tissue) in any tissue.
#plot number of significant cTWAS and TWAS genes in each tissue
plot(output$n_ctwas, output$n_twas, xlab="Number of cTWAS Genes", ylab="Number of TWAS Genes")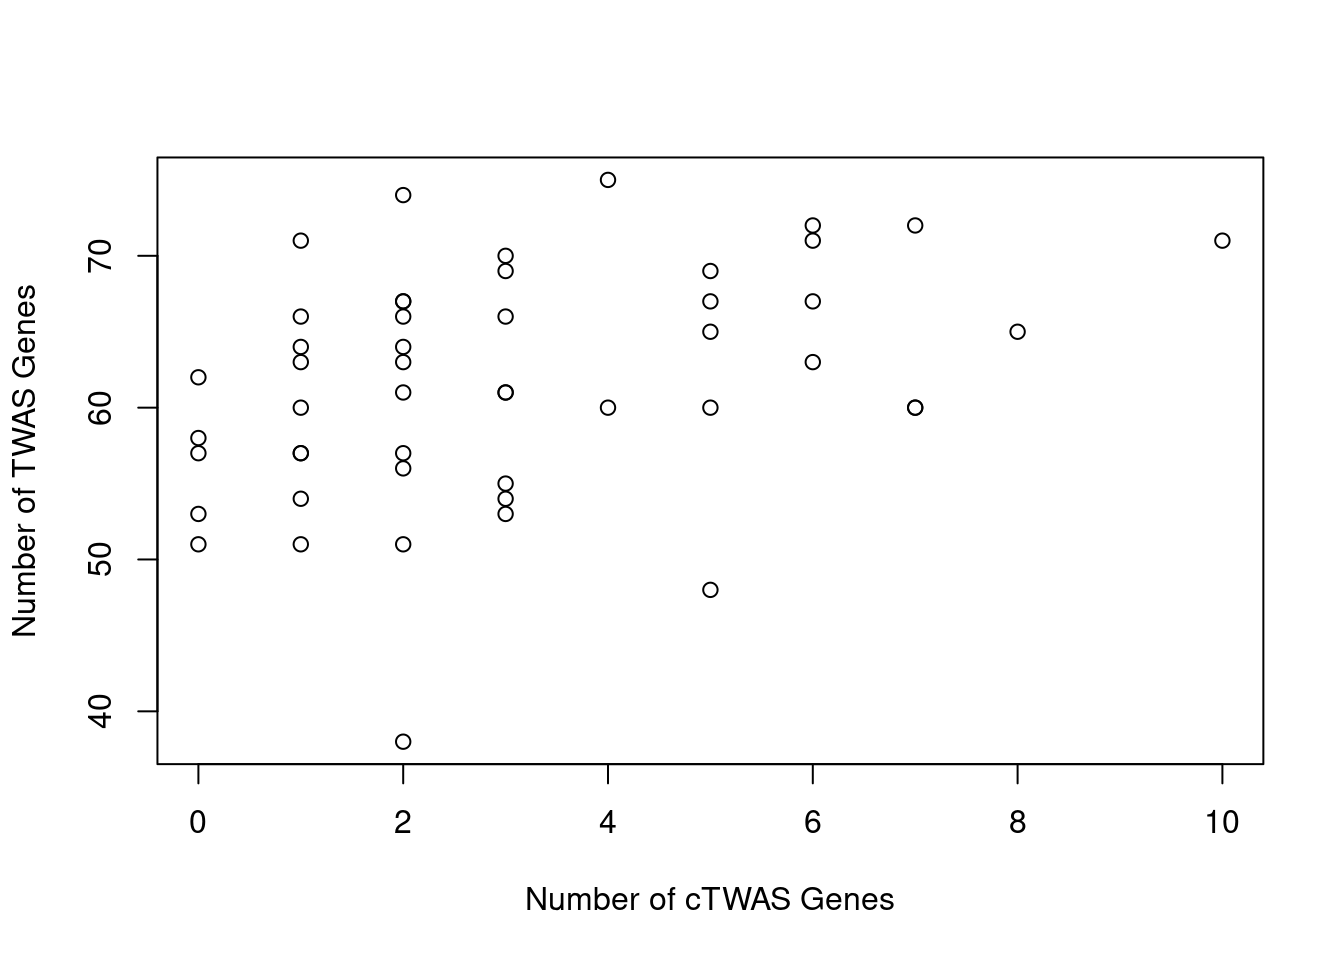
| Version | Author | Date |
|---|---|---|
| 0136d2e | wesleycrouse | 2022-06-10 |
#number of ctwas_genes
ctwas_genes <- unique(unlist(lapply(df, function(x){x$ctwas})))
length(ctwas_genes)
[1] 55#number of twas_genes
twas_genes <- unique(unlist(lapply(df, function(x){x$twas})))
length(twas_genes)[1] 301Enrichment analysis for cTWAS genes
GO
#enrichment for cTWAS genes using enrichR
library(enrichR)
Welcome to enrichR
Checking connection ... Enrichr ... Connection is Live!
FlyEnrichr ... Connection is available!
WormEnrichr ... Connection is available!
YeastEnrichr ... Connection is available!
FishEnrichr ... Connection is available!dbs <- c("GO_Biological_Process_2021", "GO_Cellular_Component_2021", "GO_Molecular_Function_2021")
GO_enrichment <- enrichr(ctwas_genes, dbs)Uploading data to Enrichr... Done.
Querying GO_Biological_Process_2021... Done.
Querying GO_Cellular_Component_2021... Done.
Querying GO_Molecular_Function_2021... Done.
Parsing results... Done.for (db in dbs){
cat(paste0(db, "\n\n"))
enrich_results <- GO_enrichment[[db]]
enrich_results <- enrich_results[enrich_results$Adjusted.P.value<0.05,c("Term", "Overlap", "Adjusted.P.value", "Genes")]
print(enrich_results)
print(plotEnrich(GO_enrichment[[db]]))
}GO_Biological_Process_2021
Term Overlap Adjusted.P.value Genes
1 cytokine-mediated signaling pathway (GO:0019221) 10/621 0.003501489 MUC1;TNFRSF6B;FCER1G;CCL20;TNFSF15;IRF8;IRF5;TNFRSF14;CXCL5;IP6K2
2 positive regulation of antigen receptor-mediated signaling pathway (GO:0050857) 3/21 0.006885777 PRKCB;RAB29;PRKD2
3 immunoglobulin mediated immune response (GO:0016064) 2/10 0.031293885 FCER1G;CARD9
4 negative regulation of transmembrane transport (GO:0034763) 2/10 0.031293885 PRKCB;OAZ3
5 positive regulation of vascular endothelial growth factor receptor signaling pathway (GO:0030949) 2/10 0.031293885 PRKCB;PRKD2
6 neutrophil mediated immunity (GO:0002446) 7/488 0.031293885 TSPAN14;FCER1G;FCGR2A;CARD9;HSPA6;ITGAL;APEH
7 B cell mediated immunity (GO:0019724) 2/11 0.031293885 FCER1G;CARD9
8 positive regulation of lymphocyte migration (GO:2000403) 2/14 0.037745461 CCL20;TNFRSF14
9 positive regulation of T cell receptor signaling pathway (GO:0050862) 2/14 0.037745461 RAB29;PRKD2
10 cellular response to type I interferon (GO:0071357) 3/65 0.037745461 IRF8;IRF5;IP6K2
11 type I interferon signaling pathway (GO:0060337) 3/65 0.037745461 IRF8;IRF5;IP6K2
12 neutrophil chemotaxis (GO:0030593) 3/70 0.042942271 FCER1G;CCL20;CXCL5
13 granulocyte chemotaxis (GO:0071621) 3/73 0.044776848 FCER1G;CCL20;CXCL5
14 neutrophil migration (GO:1990266) 3/77 0.048523533 FCER1G;CCL20;CXCL5
15 regulation of T cell migration (GO:2000404) 2/20 0.049655259 CCL20;TNFRSF14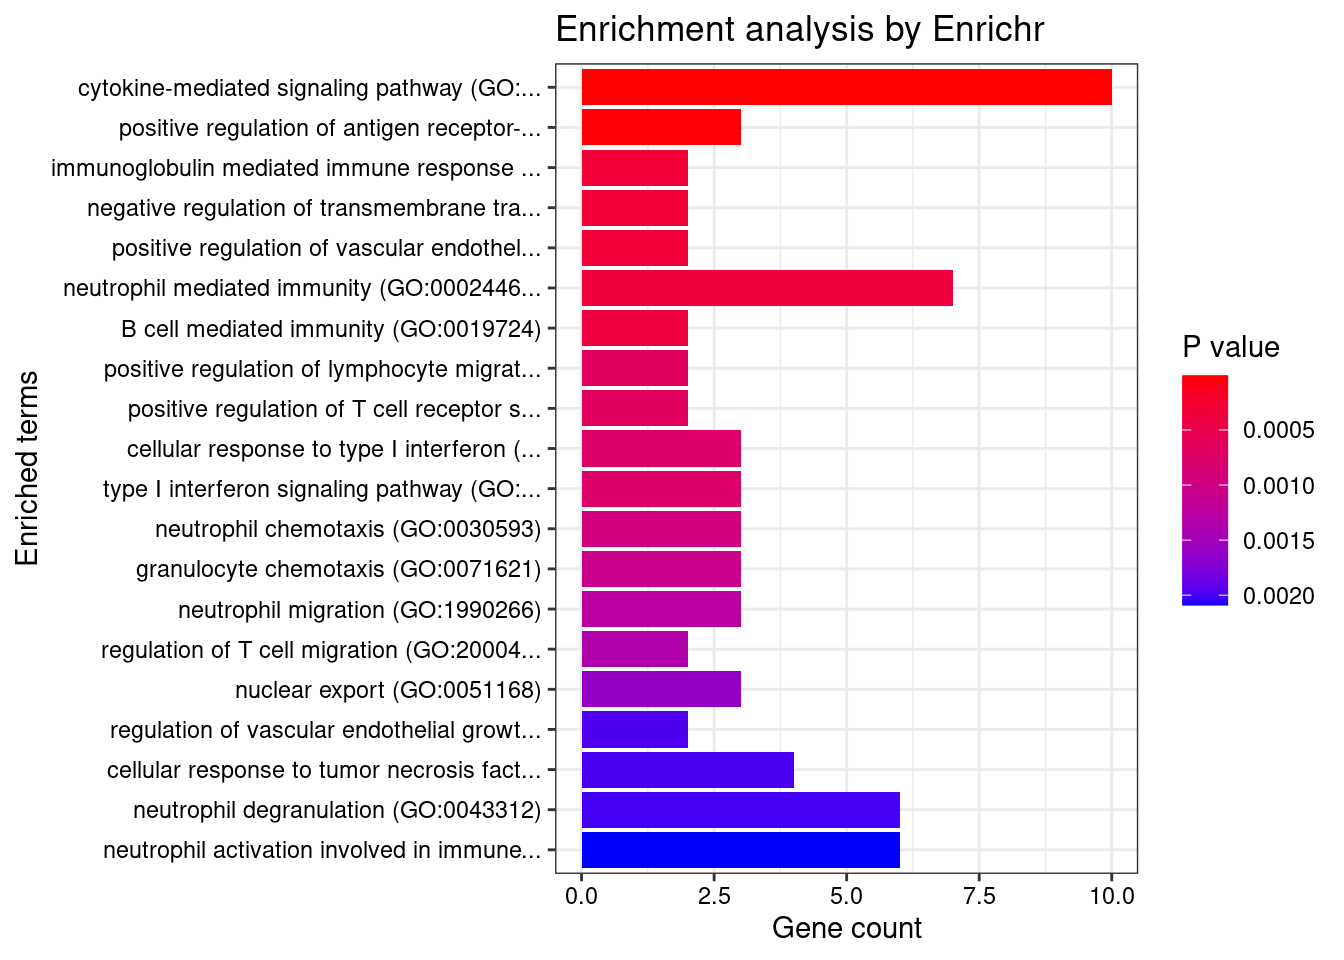
| Version | Author | Date |
|---|---|---|
| 0136d2e | wesleycrouse | 2022-06-10 |
GO_Cellular_Component_2021

[1] Term             Overlap          Adjusted.P.value Genes
<0 rows> (or 0-length row.names)
| Version | Author | Date |
|---|---|---|
| 0136d2e | wesleycrouse | 2022-06-10 |
GO_Molecular_Function_2021

[1] Term             Overlap          Adjusted.P.value Genes
<0 rows> (or 0-length row.names)
| Version | Author | Date |
|---|---|---|
| 0136d2e | wesleycrouse | 2022-06-10 |
KEGG
#enrichment for cTWAS genes using KEGG

library(WebGestaltR)******************************************* ** Welcome to WebGestaltR ! ** *******************************************background <- unique(unlist(lapply(df, function(x){x$gene_pips$genename})))
#listGeneSet()
databases <- c("pathway_KEGG")
enrichResult <- WebGestaltR(enrichMethod="ORA", organism="hsapiens",
interestGene=ctwas_genes, referenceGene=background,
enrichDatabase=databases, interestGeneType="genesymbol",
referenceGeneType="genesymbol", isOutput=F)Loading the functional categories...
Loading the ID list...
Loading the reference list...
Performing the enrichment analysis...Warning in oraEnrichment(interestGeneList, referenceGeneList, geneSet, minNum = minNum, : No significant gene set is identified based on FDR 0.05!enrichResult[,c("description", "size", "overlap", "FDR", "userId")]NULLDisGeNET
#enrichment for cTWAS genes using DisGeNET
# devtools::install_bitbucket("ibi_group/disgenet2r")
library(disgenet2r)
disgenet_api_key <- get_disgenet_api_key(
email = "wesleycrouse@gmail.com",
password = "uchicago1" )
Sys.setenv(DISGENET_API_KEY= disgenet_api_key)
res_enrich <- disease_enrichment(entities=ctwas_genes, vocabulary = "HGNC", database = "CURATED")FAM171B gene(s) from the input list not found in DisGeNET CURATEDLRP5L gene(s) from the input list not found in DisGeNET CURATEDC1orf74 gene(s) from the input list not found in DisGeNET CURATEDIPO8 gene(s) from the input list not found in DisGeNET CURATEDTSPAN14 gene(s) from the input list not found in DisGeNET CURATEDAPEH gene(s) from the input list not found in DisGeNET CURATEDMRPL20 gene(s) from the input list not found in DisGeNET CURATEDNXPE1 gene(s) from the input list not found in DisGeNET CURATEDHLA-DOB gene(s) from the input list not found in DisGeNET CURATEDCASC3 gene(s) from the input list not found in DisGeNET CURATEDRNF186 gene(s) from the input list not found in DisGeNET CURATEDSDCCAG3 gene(s) from the input list not found in DisGeNET CURATEDZGPAT gene(s) from the input list not found in DisGeNET CURATEDOAZ3 gene(s) from the input list not found in DisGeNET CURATEDLST1 gene(s) from the input list not found in DisGeNET CURATEDBIK gene(s) from the input list not found in DisGeNET CURATEDRAB29 gene(s) from the input list not found in DisGeNET CURATEDZNF736 gene(s) from the input list not found in DisGeNET CURATEDTMEM52 gene(s) from the input list not found in DisGeNET CURATEDDDX39B gene(s) from the input list not found in DisGeNET CURATEDTNFRSF6B gene(s) from the input list not found in DisGeNET CURATEDTTPAL gene(s) from the input list not found in DisGeNET CURATEDTMEM89 gene(s) from the input list not found in DisGeNET CURATEDC1orf106 gene(s) from the input list not found in DisGeNET CURATEDif (any(res_enrich@qresult$FDR < 0.05)){
print(res_enrich@qresult[res_enrich@qresult$FDR < 0.05, c("Description", "FDR", "Ratio", "BgRatio")])
} Description FDR Ratio BgRatio
21 Ulcerative Colitis 2.986863e-09 8/31 63/9703
10 Behcet Syndrome 6.059777e-03 3/31 24/9703
48 Inflammatory Bowel Diseases 1.275630e-02 3/31 35/9703
84 Ankylosing spondylitis 2.829695e-02 2/31 11/9703
5 Anovulation 3.565190e-02 1/31 1/9703
7 Rheumatoid Arthritis 3.565190e-02 4/31 174/9703
32 Enteritis 3.565190e-02 1/31 1/9703
82 Systemic Scleroderma 3.565190e-02 2/31 19/9703
91 Ureteral obstruction 3.565190e-02 2/31 24/9703
121 Congenital chloride diarrhea 3.565190e-02 1/31 1/9703
170 Deep seated dermatophytosis 3.565190e-02 1/31 1/9703
178 Retinitis Pigmentosa 26 3.565190e-02 1/31 1/9703
183 Medullary cystic kidney disease 1 3.565190e-02 1/31 1/9703
186 Inflammatory Bowel Disease 14 3.565190e-02 1/31 1/9703
187 SPINOCEREBELLAR ATAXIA, AUTOSOMAL RECESSIVE 9 3.565190e-02 1/31 1/9703
190 LOEYS-DIETZ SYNDROME 3 3.565190e-02 1/31 1/9703
198 IMMUNODEFICIENCY 32A 3.565190e-02 1/31 1/9703
201 IMMUNODEFICIENCY 32B 3.565190e-02 1/31 1/9703
205 MYOPIA 25, AUTOSOMAL DOMINANT 3.565190e-02 1/31 1/9703
71 Pancreatic Neoplasm 4.108434e-02 3/31 100/9703
136 Malignant neoplasm of pancreas 4.136916e-02 3/31 102/9703Gene sets curated by Macarthur Lab
gene_set_dir <- "/project2/mstephens/wcrouse/gene_sets/"
gene_set_files <- c("gwascatalog.tsv",
"mgi_essential.tsv",
"core_essentials_hart.tsv",
"clinvar_path_likelypath.tsv",
"fda_approved_drug_targets.tsv")
gene_sets <- lapply(gene_set_files, function(x){as.character(read.table(paste0(gene_set_dir, x))[,1])})
names(gene_sets) <- sapply(gene_set_files, function(x){unlist(strsplit(x, "[.]"))[1]})
gene_lists <- list(ctwas_genes=ctwas_genes)
#background is union of genes analyzed in all tissue
background <- unique(unlist(lapply(df, function(x){x$gene_pips$genename})))
#genes in gene_sets filtered to ensure inclusion in background
gene_sets <- lapply(gene_sets, function(x){x[x %in% background]})
####################
hyp_score <- data.frame()
size <- c()
ngenes <- c()
for (i in 1:length(gene_sets)) {
for (j in 1:length(gene_lists)){
group1 <- length(gene_sets[[i]])
group2 <- length(as.vector(gene_lists[[j]]))
size <- c(size, group1)
Overlap <- length(intersect(gene_sets[[i]],as.vector(gene_lists[[j]])))
ngenes <- c(ngenes, Overlap)
Total <- length(background)
hyp_score[i,j] <- phyper(Overlap-1, group2, Total-group2, group1,lower.tail=F)
}
}
rownames(hyp_score) <- names(gene_sets)
colnames(hyp_score) <- names(gene_lists)
hyp_score_padj <- apply(hyp_score,2, p.adjust, method="BH", n=(nrow(hyp_score)*ncol(hyp_score)))
hyp_score_padj <- as.data.frame(hyp_score_padj)
hyp_score_padj$gene_set <- rownames(hyp_score_padj)
hyp_score_padj$nset <- size
hyp_score_padj$ngenes <- ngenes
hyp_score_padj$percent <- ngenes/size
hyp_score_padj <- hyp_score_padj[order(hyp_score_padj$ctwas_genes),]
colnames(hyp_score_padj)[1] <- "padj"
hyp_score_padj <- hyp_score_padj[,c(2:5,1)]
rownames(hyp_score_padj)<- NULL
hyp_score_padj gene_set nset ngenes percent padj
1 gwascatalog 5969 37 0.006198693 5.236126e-06
2 fda_approved_drug_targets 352 4 0.011363636 6.653500e-02
3 mgi_essential 2304 6 0.002604167 9.629468e-01
4 clinvar_path_likelypath 2771 8 0.002887044 9.629468e-01
5 core_essentials_hart 264 0 0.000000000 1.000000e+00Enrichment analysis for TWAS genes
#enrichment for TWAS genes
dbs <- c("GO_Biological_Process_2021", "GO_Cellular_Component_2021", "GO_Molecular_Function_2021")
GO_enrichment <- enrichr(twas_genes, dbs)Uploading data to Enrichr... Done.
Querying GO_Biological_Process_2021... Done.
Querying GO_Cellular_Component_2021... Done.
Querying GO_Molecular_Function_2021... Done.
Parsing results... Done.for (db in dbs){
cat(paste0(db, "\n\n"))
enrich_results <- GO_enrichment[[db]]
enrich_results <- enrich_results[enrich_results$Adjusted.P.value<0.05,c("Term", "Overlap", "Adjusted.P.value", "Genes")]
print(enrich_results)
print(plotEnrich(GO_enrichment[[db]]))
}GO_Biological_Process_2021
Term Overlap Adjusted.P.value Genes
1 interferon-gamma-mediated signaling pathway (GO:0060333) 17/68 3.170318e-13 HLA-DRB5;CAMK2A;HLA-B;HLA-C;HLA-F;HLA-DPB1;IRF8;HLA-DRA;IRF5;JAK2;TRIM31;HLA-DQA2;HLA-DQB2;HLA-DQA1;HLA-DRB1;HLA-DPA1;HLA-DQB1
2 cytokine-mediated signaling pathway (GO:0019221) 42/621 3.170318e-13 CSF3;TNFRSF6B;TRAF3IP2;IL23R;CAMK2A;IL27;TNF;CXCL5;MUC1;PSMD3;CXCR2;TNFRSF14;JAK2;HLA-DQA2;HLA-DQA1;HLA-DPA1;IL12RB2;IP6K2;STAT5A;HLA-DRB5;FCER1G;IL1R1;TNFSF15;GPR35;CCL20;STAT3;HLA-B;HLA-C;PPBP;HLA-F;BOLA2;HLA-DPB1;LTA;HLA-DRA;IRF8;TNFSF8;IRF5;TRIM31;STX1A;HLA-DRB1;HLA-DQB2;HLA-DQB1
3 cellular response to interferon-gamma (GO:0071346) 20/121 1.214027e-12 HLA-DRB5;CCL20;CAMK2A;HLA-B;HLA-C;HLA-F;AIF1;HLA-DPB1;HLA-DRA;IRF8;IRF5;JAK2;TRIM31;HLA-DQA2;HLA-DQA1;HLA-DRB1;SLC26A6;HLA-DQB2;HLA-DPA1;HLA-DQB1
4 antigen processing and presentation of exogenous peptide antigen (GO:0002478) 17/103 1.275700e-10 HLA-DRB5;FCER1G;HLA-F;HLA-DMA;HLA-DMB;HLA-DPB1;HLA-DRA;HLA-DOA;FCGR2B;HLA-DOB;HLA-DQA2;AP1M2;HLA-DQA1;HLA-DRB1;HLA-DQB2;HLA-DPA1;HLA-DQB1
5 antigen processing and presentation of exogenous peptide antigen via MHC class II (GO:0019886) 16/98 6.231853e-10 HLA-DRB5;FCER1G;HLA-DMA;HLA-DMB;HLA-DPB1;HLA-DRA;HLA-DOA;FCGR2B;HLA-DOB;HLA-DQA2;AP1M2;HLA-DQA1;HLA-DRB1;HLA-DQB2;HLA-DPA1;HLA-DQB1
6 antigen processing and presentation of peptide antigen via MHC class II (GO:0002495) 16/100 7.177660e-10 HLA-DRB5;FCER1G;HLA-DMA;HLA-DMB;HLA-DPB1;HLA-DRA;HLA-DOA;FCGR2B;HLA-DOB;HLA-DQA2;AP1M2;HLA-DQA1;HLA-DRB1;HLA-DQB2;HLA-DPA1;HLA-DQB1
7 antigen receptor-mediated signaling pathway (GO:0050851) 15/185 4.355442e-05 HLA-DRB5;PRKCB;BTNL2;LIME1;PSMD3;HLA-DPB1;HLA-DRA;PRKD2;HLA-DQA2;ICOSLG;HLA-DQA1;HLA-DRB1;HLA-DQB2;HLA-DPA1;HLA-DQB1
8 regulation of T cell proliferation (GO:0042129) 10/76 5.465366e-05 CD274;HLA-DMB;IL23R;HLA-DPB1;IL27;TNFSF8;PDCD1LG2;AIF1;HLA-DRB1;HLA-DPA1
9 positive regulation of T cell proliferation (GO:0042102) 9/66 1.461404e-04 CD274;HLA-DMB;IL23R;HLA-DPB1;PDCD1LG2;AGER;AIF1;ICOSLG;HLA-DPA1
10 peptide antigen assembly with MHC protein complex (GO:0002501) 4/6 1.538075e-04 HLA-DMA;HLA-DMB;HLA-DRA;HLA-DRB1
11 T cell receptor signaling pathway (GO:0050852) 13/158 1.538075e-04 HLA-DRB5;BTNL2;PSMD3;HLA-DPB1;HLA-DRA;PRKD2;HLA-DQA2;ICOSLG;HLA-DQA1;HLA-DRB1;HLA-DQB2;HLA-DPA1;HLA-DQB1
12 positive regulation of cytokine production (GO:0001819) 19/335 1.538075e-04 CD274;FCER1G;IL1R1;IL23R;CARD9;STAT3;IL27;PARK7;AGPAT1;AIF1;TNF;AGER;HLA-DPB1;PRKD2;TNFRSF14;IRF5;HSPA1B;HLA-DPA1;IL12RB2
13 antigen processing and presentation of endogenous peptide antigen (GO:0002483) 5/14 2.206221e-04 TAP2;TAP1;HLA-DRA;HLA-F;HLA-DRB1
14 regulation of T cell mediated cytotoxicity (GO:0001914) 6/29 5.694715e-04 IL23R;HLA-B;HLA-DRA;HLA-F;AGER;HLA-DRB1
15 negative regulation of interleukin-10 production (GO:0032693) 5/17 5.694715e-04 CD274;IL23R;PDCD1LG2;FCGR2B;AGER
16 regulation of interferon-gamma production (GO:0032649) 9/86 7.852057e-04 CD274;IL1R1;IL23R;HLA-DPB1;IL27;PDCD1LG2;HLA-DRB1;HLA-DPA1;IL12RB2
17 regulation of interleukin-10 production (GO:0032653) 7/48 8.926355e-04 CD274;IL23R;STAT3;PDCD1LG2;FCGR2B;AGER;HLA-DRB1
18 antigen processing and presentation of peptide antigen via MHC class I (GO:0002474) 6/33 1.035786e-03 FCER1G;HLA-B;TAP2;HLA-C;TAP1;HLA-F
19 inflammatory response (GO:0006954) 14/230 1.236917e-03 PTGIR;TRAF3IP2;CCL20;PTGER3;STAT3;PPBP;ITGAL;AIF1;TNF;CXCL5;NCR3;CXCR2;REL;FCGR2B
20 regulation of immune effector process (GO:0002697) 7/53 1.489569e-03 C4B;C4A;HLA-DRA;FCGR2B;CFB;HLA-DRB1;C2
21 regulation of immune response (GO:0050776) 12/179 1.834965e-03 FCGR3A;NCR3;FCGR2A;HLA-B;HLA-C;HLA-DRA;ICAM5;HLA-F;ITGAL;FCGR2B;HLA-DRB1;MICB
22 positive regulation of T cell mediated cytotoxicity (GO:0001916) 5/26 3.693406e-03 IL23R;HLA-B;HLA-DRA;HLA-F;HLA-DRB1
23 positive regulation of leukocyte mediated cytotoxicity (GO:0001912) 6/43 3.932462e-03 NCR3;IL23R;HLA-B;HLA-DRA;HLA-F;HLA-DRB1
24 positive regulation of lymphocyte migration (GO:2000403) 4/14 3.992152e-03 CCL20;TNFRSF14;AIF1;RHOA
25 regulation of T-helper cell differentiation (GO:0045622) 3/6 5.382235e-03 HLA-DRA;IL27;HLA-DRB1
26 intracellular pH elevation (GO:0051454) 3/6 5.382235e-03 CLN3;SLC26A3;SLC26A6
27 regulation of cytokine production (GO:0001817) 10/150 7.407037e-03 PPP1R11;CARD9;HLA-B;IRF8;BTNL2;AGPAT1;FCGR2B;TNF;ICOSLG;HLA-DRB1
28 positive regulation of DNA-binding transcription factor activity (GO:0051091) 13/246 7.407037e-03 CSF3;CRTC3;SMAD3;PRKCB;CARD9;STAT3;CAMK2A;PARK7;TNF;AGER;PRKD2;TRIM31;HSPA1B
29 antigen processing and presentation of endogenous peptide antigen via MHC class I via ER pathway (GO:0002484) 3/7 8.072054e-03 HLA-B;HLA-C;HLA-F
30 antigen processing and presentation of endogenous peptide antigen via MHC class I via ER pathway, TAP-independent (GO:0002486) 3/7 8.072054e-03 HLA-B;HLA-C;HLA-F
31 positive regulation of lymphocyte proliferation (GO:0050671) 7/75 8.831607e-03 CD274;HLA-DMB;IL23R;HLA-DPB1;PDCD1LG2;AIF1;HLA-DPA1
32 positive regulation of T cell activation (GO:0050870) 7/75 8.831607e-03 CD274;HLA-DMB;IL23R;HLA-DPB1;PDCD1LG2;AIF1;HLA-DPA1
33 cellular response to cytokine stimulus (GO:0071345) 19/482 8.831607e-03 STAT5A;CSF3;SMAD3;IL1R1;CCL20;IL23R;GBA;STAT3;AIF1;TNF;RHOA;MUC1;IRF8;IRF5;JAK2;STX1A;SLC26A6;HLA-DPA1;IL12RB2
34 positive regulation of phagocytosis (GO:0050766) 6/53 8.831607e-03 C4B;C4A;FCER1G;FCGR2B;TNF;C2
35 regulation of activated T cell proliferation (GO:0046006) 5/34 8.899306e-03 CD274;IL23R;PDCD1LG2;AGER;ICOSLG
36 regulation of lymphocyte proliferation (GO:0050670) 4/19 9.344926e-03 LST1;IL27;TNFSF8;IKZF3
37 antigen processing and presentation of exogenous peptide antigen via MHC class I (GO:0042590) 7/78 9.344926e-03 FCER1G;PSMD3;HLA-B;TAP2;HLA-C;TAP1;HLA-F
38 antigen processing and presentation of exogenous peptide antigen via MHC class I, TAP-independent (GO:0002480) 3/8 9.344926e-03 HLA-B;HLA-C;HLA-F
39 regulation of apoptotic cell clearance (GO:2000425) 3/8 9.344926e-03 C4B;C4A;C2
40 regulation of CD4-positive, alpha-beta T cell activation (GO:2000514) 3/8 9.344926e-03 HLA-DRA;AGER;HLA-DRB1
41 positive regulation of apoptotic cell clearance (GO:2000427) 3/8 9.344926e-03 C4B;C4A;C2
42 macrophage activation (GO:0042116) 5/36 9.575632e-03 CRTC3;JAK2;AGER;AIF1;TNF
43 positive regulation of T cell mediated immunity (GO:0002711) 5/36 9.575632e-03 IL23R;HLA-B;HLA-DRA;HLA-F;HLA-DRB1
44 regulation of T cell migration (GO:2000404) 4/20 9.814450e-03 CCL20;TNFRSF14;AIF1;RHOA
45 positive regulation of interferon-gamma production (GO:0032729) 6/57 1.002996e-02 IL1R1;IL23R;HLA-DPB1;IL27;HLA-DPA1;IL12RB2
46 response to endoplasmic reticulum stress (GO:0034976) 8/110 1.183988e-02 BAG6;ATF6B;SEC16A;ATP2A1;QRICH1;RNF186;RNF5;USP19
47 interleukin-23-mediated signaling pathway (GO:0038155) 3/9 1.183988e-02 IL23R;STAT3;JAK2
48 positive regulation of memory T cell differentiation (GO:0043382) 3/9 1.183988e-02 IL23R;HLA-DRA;HLA-DRB1
49 negative regulation of lymphocyte proliferation (GO:0050672) 5/39 1.236935e-02 CD274;LST1;PDCD1LG2;FCGR2B;HLA-DRB1
50 microglial cell activation (GO:0001774) 4/22 1.273412e-02 JAK2;AGER;AIF1;TNF
51 tumor necrosis factor-mediated signaling pathway (GO:0033209) 8/116 1.514801e-02 TNFRSF6B;TNFSF15;PSMD3;LTA;TNFRSF14;TNFSF8;JAK2;TNF
52 regulation of memory T cell differentiation (GO:0043380) 3/10 1.514801e-02 IL23R;HLA-DRA;HLA-DRB1
53 immunoglobulin mediated immune response (GO:0016064) 3/10 1.514801e-02 FCER1G;CARD9;FCGR2B
54 immune response-activating cell surface receptor signaling pathway (GO:0002429) 4/24 1.659216e-02 BAG6;NCR3;FCER1G;MICB
55 cellular response to type I interferon (GO:0071357) 6/65 1.659216e-02 HLA-B;HLA-C;IRF8;IRF5;HLA-F;IP6K2
56 type I interferon signaling pathway (GO:0060337) 6/65 1.659216e-02 HLA-B;HLA-C;IRF8;IRF5;HLA-F;IP6K2
57 response to cytokine (GO:0034097) 9/150 1.721534e-02 CD274;CSF3;SMAD3;IL1R1;IL23R;STAT3;REL;JAK2;RHOA
58 positive regulation of T cell migration (GO:2000406) 4/25 1.789571e-02 CCL20;TNFRSF14;AIF1;RHOA
59 B cell mediated immunity (GO:0019724) 3/11 1.789571e-02 FCER1G;CARD9;FCGR2B
60 interleukin-35-mediated signaling pathway (GO:0070757) 3/11 1.789571e-02 STAT3;JAK2;IL12RB2
61 positive regulation of cellular respiration (GO:1901857) 3/11 1.789571e-02 PRELID1;NUPR1;PARK7
62 regulation of dendritic cell differentiation (GO:2001198) 3/12 2.321526e-02 HLA-B;FCGR2B;AGER
63 regulation of T cell activation (GO:0050863) 5/47 2.323737e-02 PRELID1;HLA-DPB1;IL27;TNFSF8;HLA-DPA1
64 cellular response to tumor necrosis factor (GO:0071356) 10/194 2.483200e-02 TNFRSF6B;TNFSF15;CCL20;PSMD3;GBA;LTA;TNFSF8;TNFRSF14;JAK2;TNF
65 antigen processing and presentation of exogenous peptide antigen via MHC class I, TAP-dependent (GO:0002479) 6/73 2.665055e-02 PSMD3;HLA-B;TAP2;HLA-C;TAP1;HLA-F
66 intrinsic apoptotic signaling pathway in response to endoplasmic reticulum stress (GO:0070059) 4/29 2.883301e-02 BAG6;ATP2A1;QRICH1;RNF186
67 positive regulation of endopeptidase activity (GO:0010950) 4/30 3.238756e-02 EFNA1;PRELID1;STAT3;AGER
68 regulation of response to endoplasmic reticulum stress (GO:1905897) 3/14 3.326994e-02 NUPR1;FCGR2B;USP19
69 growth hormone receptor signaling pathway via JAK-STAT (GO:0060397) 3/14 3.326994e-02 STAT5A;STAT3;JAK2
70 immune response-regulating cell surface receptor signaling pathway (GO:0002768) 3/14 3.326994e-02 BAG6;NCR3;MICB
71 steroid hormone biosynthetic process (GO:0120178) 4/31 3.419733e-02 STARD3;CYP21A2;FDX2;HSD17B8
72 positive regulation of leukocyte cell-cell adhesion (GO:1903039) 4/31 3.419733e-02 HLA-DPB1;TNF;RHOA;HLA-DPA1
73 neutrophil mediated immunity (GO:0002446) 17/488 3.623232e-02 FCER1G;CARD9;HSPA6;HLA-B;HLA-C;PPBP;APEH;ITGAL;RHOA;SYNGR1;FCGR2A;PSMD3;ORMDL3;CXCR2;TOM1;HSPA1B;ATP6V0A1
74 regulation of humoral immune response (GO:0002920) 5/54 3.686379e-02 C4B;C4A;FCGR2B;CFB;C2
75 positive regulation of immune effector process (GO:0002699) 4/32 3.686379e-02 HLA-DMB;IL23R;HLA-DRA;HLA-DRB1
76 response to interferon-gamma (GO:0034341) 6/80 3.686379e-02 CCL20;IL23R;IRF8;AIF1;SLC26A6;HLA-DPA1
77 interleukin-27-mediated signaling pathway (GO:0070106) 3/15 3.690828e-02 STAT3;IL27;JAK2
78 positive regulation of acute inflammatory response (GO:0002675) 3/15 3.690828e-02 PTGER3;PARK7;TNF
79 regulation of interleukin-6 production (GO:0032675) 7/110 3.758988e-02 GBA;CARD9;STAT3;HLA-B;TNF;AGER;AIF1
80 positive regulation of cellular component organization (GO:0051130) 7/114 4.562213e-02 GPX1;BIK;GBA;PARK7;TPPP;TNF;CBLL1
81 negative regulation of cytokine production (GO:0001818) 9/182 4.759392e-02 CD274;PPP1R11;IL23R;GBA;PDCD1LG2;FCGR2B;TNF;AGER;HLA-DRB1
82 negative regulation of T cell proliferation (GO:0042130) 4/35 4.766545e-02 CD274;TNFRSF14;PDCD1LG2;HLA-DRB1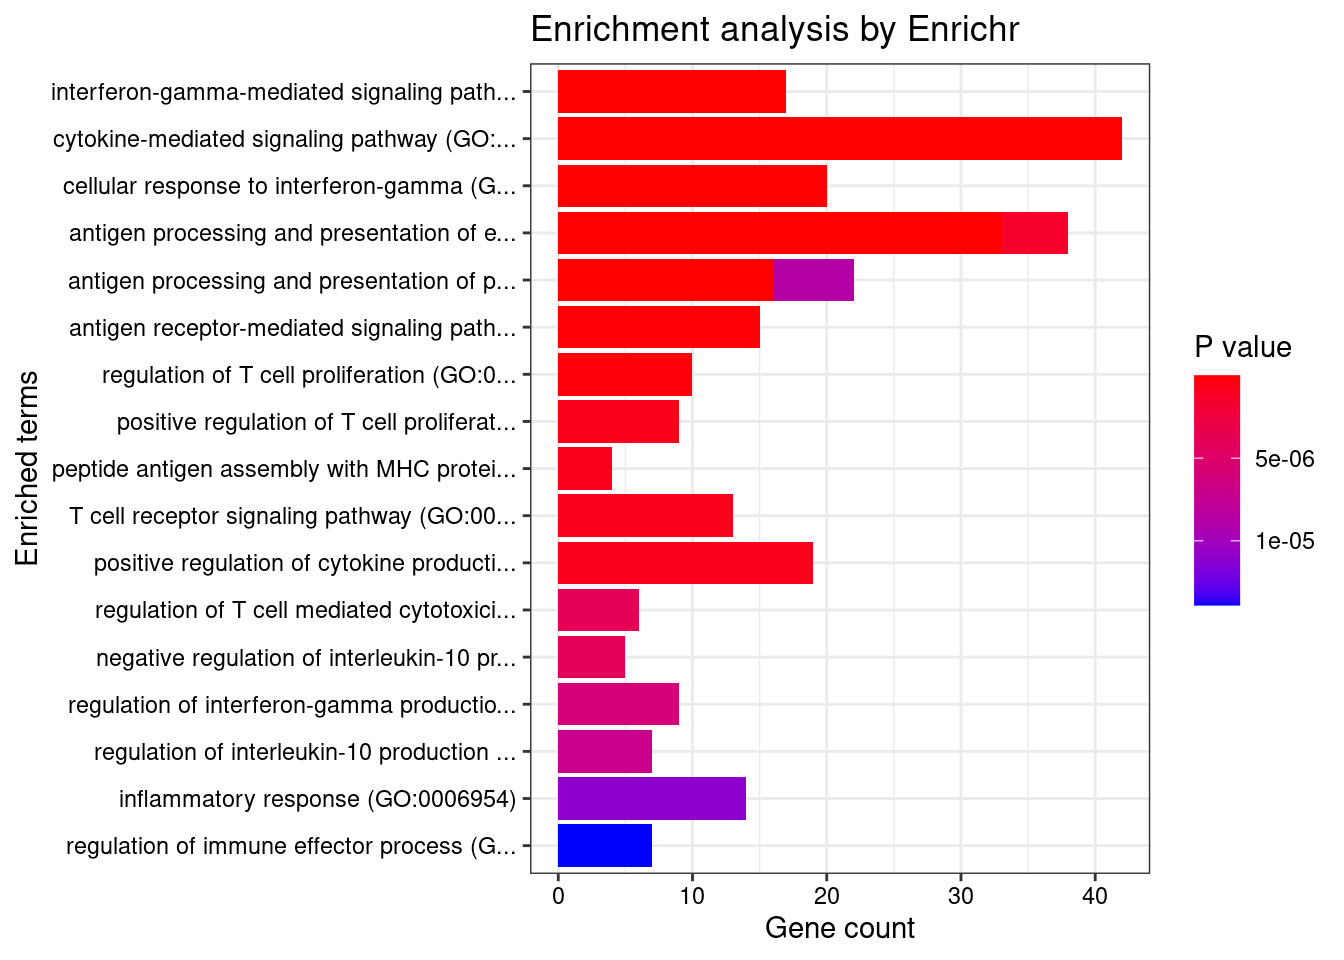
| Version | Author | Date |
|---|---|---|
| 0136d2e | wesleycrouse | 2022-06-10 |
GO_Cellular_Component_2021
Term Overlap Adjusted.P.value Genes
1 MHC protein complex (GO:0042611) 15/20 8.877986e-22 HLA-DRB5;HLA-B;HLA-C;HLA-F;HLA-DMA;HLA-DMB;HLA-DPB1;HLA-DRA;HLA-DOA;HLA-DOB;HLA-DQA1;HLA-DQB2;HLA-DRB1;HLA-DPA1;HLA-DQB1
2 MHC class II protein complex (GO:0042613) 12/13 1.313620e-19 HLA-DRB5;HLA-DMA;HLA-DMB;HLA-DPB1;HLA-DRA;HLA-DOA;HLA-DOB;HLA-DQA1;HLA-DQB2;HLA-DRB1;HLA-DPA1;HLA-DQB1
3 lumenal side of endoplasmic reticulum membrane (GO:0098553) 12/28 1.257241e-13 HLA-DRB5;HLA-B;HLA-DPB1;HLA-C;HLA-DRA;HLA-F;HLA-DQA2;HLA-DQA1;HLA-DQB2;HLA-DRB1;HLA-DPA1;HLA-DQB1
4 integral component of lumenal side of endoplasmic reticulum membrane (GO:0071556) 12/28 1.257241e-13 HLA-DRB5;HLA-B;HLA-DPB1;HLA-C;HLA-DRA;HLA-F;HLA-DQA2;HLA-DQA1;HLA-DQB2;HLA-DRB1;HLA-DPA1;HLA-DQB1
5 ER to Golgi transport vesicle membrane (GO:0012507) 13/54 3.782153e-11 HLA-DRB5;SEC16A;HLA-B;HLA-C;HLA-F;HLA-DPB1;HLA-DRA;HLA-DQA2;HLA-DQB2;HLA-DQA1;HLA-DRB1;HLA-DPA1;HLA-DQB1
6 coated vesicle membrane (GO:0030662) 13/55 4.072210e-11 HLA-DRB5;SEC16A;HLA-B;HLA-C;HLA-F;HLA-DPB1;HLA-DRA;HLA-DQA2;HLA-DQB2;HLA-DQA1;HLA-DRB1;HLA-DPA1;HLA-DQB1
7 transport vesicle membrane (GO:0030658) 13/60 1.161941e-10 HLA-DRB5;SEC16A;HLA-B;HLA-C;HLA-F;HLA-DPB1;HLA-DRA;HLA-DQA2;HLA-DQB2;HLA-DQA1;HLA-DRB1;HLA-DPA1;HLA-DQB1
8 COPII-coated ER to Golgi transport vesicle (GO:0030134) 13/79 4.022519e-09 HLA-DRB5;SEC16A;HLA-B;HLA-C;HLA-F;HLA-DPB1;HLA-DRA;HLA-DQA2;HLA-DQB2;HLA-DQA1;HLA-DRB1;HLA-DPA1;HLA-DQB1
9 integral component of endoplasmic reticulum membrane (GO:0030176) 16/142 9.652731e-09 HLA-DRB5;ATF6B;HLA-B;TAP2;HLA-C;TAP1;HLA-F;CLN3;HLA-DPB1;HLA-DRA;HLA-DQA2;HLA-DQA1;HLA-DRB1;HLA-DQB2;HLA-DPA1;HLA-DQB1
10 endocytic vesicle membrane (GO:0030666) 16/158 4.235671e-08 HLA-DRB5;CAMK2A;HLA-B;TAP2;HLA-C;TAP1;HLA-F;HLA-DPB1;HLA-DRA;HLA-DQA2;HLA-DQA1;HLA-DRB1;HLA-DQB2;ATP6V0A1;HLA-DPA1;HLA-DQB1
11 lytic vacuole membrane (GO:0098852) 19/267 4.347437e-07 STARD3;HLA-DRB5;GBA;HLA-F;CLN3;HLA-DMA;HLA-DMB;HLA-DPB1;HLA-DRA;HLA-DOA;HLA-DQA2;HLA-DOB;HLA-DQA1;HLA-DRB1;HLA-DQB2;AP1M2;ATP6V0A1;HLA-DPA1;HLA-DQB1
12 lysosomal membrane (GO:0005765) 21/330 5.085160e-07 STARD3;HLA-DRB5;GBA;HLA-F;CLN3;SYNGR1;HLA-DMA;HLA-DMB;HLA-DPB1;TOM1;HLA-DRA;HLA-DOA;HLA-DQA2;HLA-DOB;HLA-DQA1;HLA-DRB1;HLA-DQB2;AP1M2;ATP6V0A1;HLA-DPA1;HLA-DQB1
13 trans-Golgi network membrane (GO:0032588) 11/99 4.230080e-06 ARFRP1;HLA-DRB5;HLA-DPB1;HLA-DRA;HLA-DQA2;AP1M2;HLA-DQA1;HLA-DRB1;HLA-DQB2;HLA-DPA1;HLA-DQB1
14 clathrin-coated endocytic vesicle membrane (GO:0030669) 9/69 1.218942e-05 HLA-DRB5;HLA-DPB1;HLA-DRA;HLA-DQA2;HLA-DQB2;HLA-DQA1;HLA-DRB1;HLA-DPA1;HLA-DQB1
15 lysosome (GO:0005764) 22/477 4.624628e-05 STARD3;HLA-DRB5;USP4;GBA;HLA-F;CLN3;HLA-DMA;HLA-DMB;CXCR2;HLA-DPB1;HLA-DRA;PPT2;HLA-DOA;HLA-DQA2;HLA-DOB;HLA-DQA1;HLA-DRB1;HLA-DQB2;AP1M2;ATP6V0A1;HLA-DPA1;HLA-DQB1
16 clathrin-coated endocytic vesicle (GO:0045334) 9/85 6.081666e-05 HLA-DRB5;HLA-DPB1;HLA-DRA;HLA-DQA2;HLA-DQB2;HLA-DQA1;HLA-DRB1;HLA-DPA1;HLA-DQB1
17 cytoplasmic vesicle membrane (GO:0030659) 19/380 6.081666e-05 HLA-DRB5;CAMK2A;HLA-B;HLA-C;RHOA;FCGR2A;ORMDL3;CXCR2;HLA-DPB1;EXOC3;HLA-DRA;HLA-DQA2;HLA-DQA1;HLA-DRB1;HLA-DQB2;AP1M2;ATP6V0A1;HLA-DPA1;HLA-DQB1
18 clathrin-coated vesicle membrane (GO:0030665) 9/90 8.966095e-05 HLA-DRB5;HLA-DPB1;HLA-DRA;HLA-DQA2;HLA-DQB2;HLA-DQA1;HLA-DRB1;HLA-DPA1;HLA-DQB1
19 trans-Golgi network (GO:0005802) 14/239 1.679827e-04 HLA-DRB5;GBA;ARFRP1;CLN3;HLA-DPB1;RAB29;HLA-DRA;HLA-DQA2;HLA-DQA1;HLA-DRB1;HLA-DQB2;AP1M2;HLA-DPA1;HLA-DQB1
20 phagocytic vesicle membrane (GO:0030670) 6/45 5.193513e-04 HLA-B;TAP2;HLA-C;TAP1;HLA-F;ATP6V0A1
21 bounding membrane of organelle (GO:0098588) 26/767 9.424638e-04 GPSM1;NOTCH4;CAMK2A;ATP2A1;CLN3;ORMDL3;CXCR2;HLA-DQA2;HLA-DQA1;AP1M2;ATP6V0A1;HLA-DPA1;HLA-DRB5;HLA-B;TAP2;HLA-C;TAP1;HLA-F;RHOA;FCGR2A;HLA-DPB1;EXOC3;HLA-DRA;HLA-DRB1;HLA-DQB2;HLA-DQB1
22 integral component of plasma membrane (GO:0005887) 40/1454 1.345874e-03 GPR25;CNTNAP1;IL23R;NOTCH4;PTGER3;OPRL1;ICAM5;MST1R;SEMA3F;SLC7A10;TNF;AGER;FCRLA;FCGR3A;MUC1;CXCR2;SLC38A3;HLA-DQA2;HLA-DQA1;HLA-DPA1;IL12RB2;GABBR1;PTGIR;FCER1G;IL1R1;TNFSF15;GPR35;HLA-B;HLA-C;CLDN4;SLC6A7;NCR3;FCGR2A;HLA-DRA;CDHR4;TNFSF8;FCGR2B;SLC26A3;HLA-DRB1;SLC26A6
23 secretory granule membrane (GO:0030667) 13/274 2.297881e-03 FCER1G;HLA-B;HLA-C;ITGAL;RHOA;SYNGR1;FCGR2A;CXCR2;ORMDL3;TOM1;EXOC3;LY6G6F;ATP6V0A1
24 late endosome membrane (GO:0031902) 6/68 4.355470e-03 STARD3;HLA-DMA;HLA-DRB5;HLA-DMB;HLA-DRA;HLA-DRB1
25 endocytic vesicle (GO:0030139) 10/189 4.579159e-03 HLA-DRB5;CAMK2A;HLA-DPB1;HLA-DRA;HLA-DQA2;HLA-DQA1;HLA-DRB1;HLA-DQB2;HLA-DPA1;HLA-DQB1
26 Golgi membrane (GO:0000139) 17/472 6.246375e-03 GPSM1;HLA-DRB5;NOTCH4;HLA-B;HLA-C;HLA-F;ARFRP1;CLN3;HLA-DPB1;HLA-DRA;HLA-DQA2;HLA-DQA1;HLA-DRB1;HLA-DQB2;AP1M2;HLA-DPA1;HLA-DQB1
27 recycling endosome (GO:0055037) 8/145 1.128580e-02 CD274;CLN3;HLA-B;RAB29;HLA-C;HLA-F;TUBG1;TNF
28 MHC class I protein complex (GO:0042612) 2/6 2.196175e-02 HLA-B;HLA-C
29 endosome membrane (GO:0010008) 12/325 2.545611e-02 STARD3;CD274;CLN3;HLA-DRB5;HLA-DMA;HLA-DMB;HLA-B;HLA-C;HLA-DRA;HLA-F;HLA-DRB1;ATP6V0A1
30 phagocytic vesicle (GO:0045335) 6/100 2.545611e-02 HLA-B;TAP2;HLA-C;TAP1;HLA-F;ATP6V0A1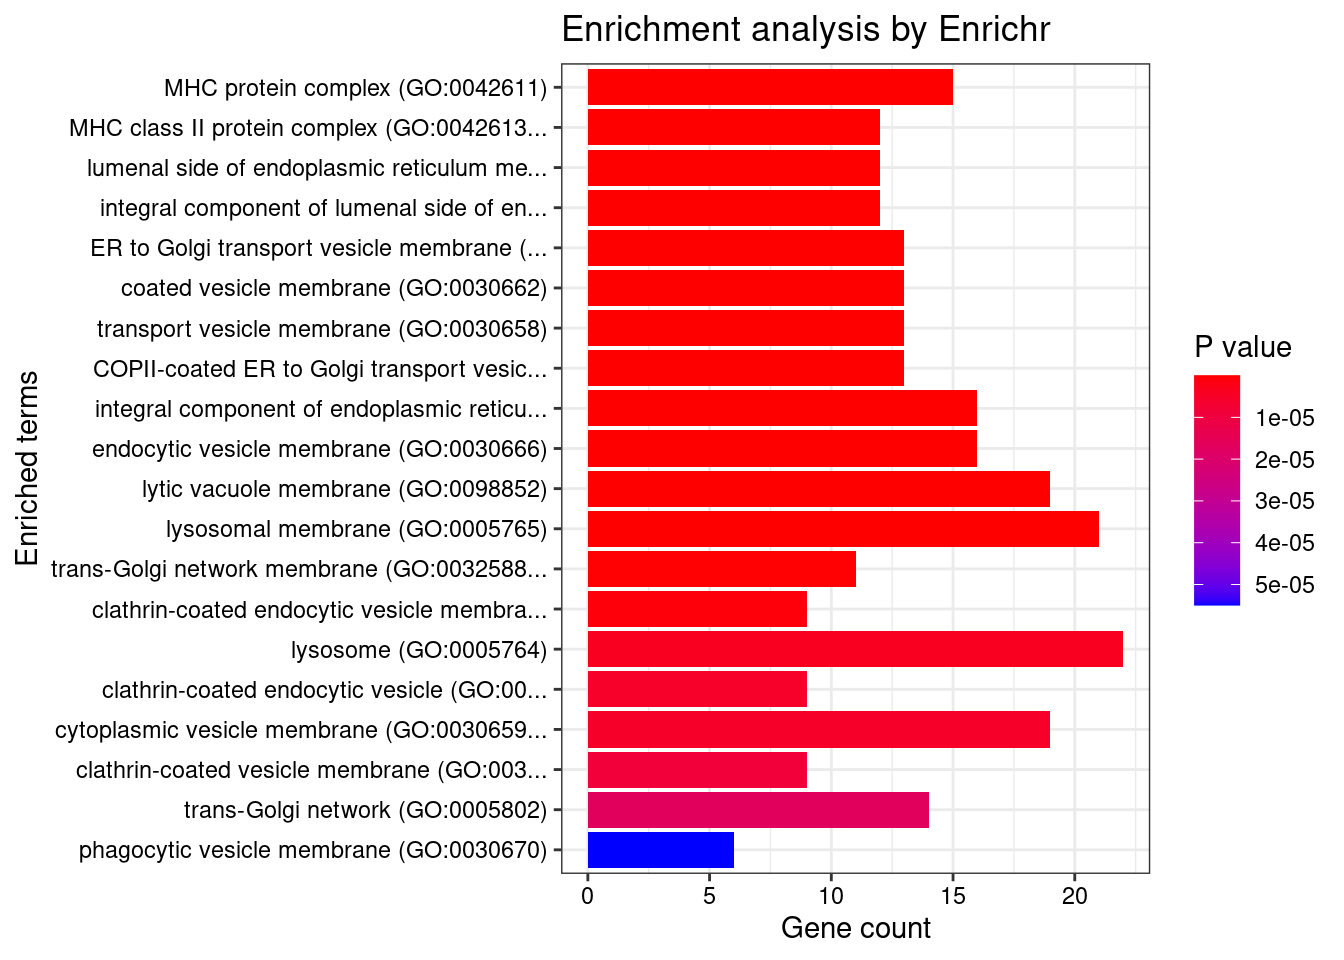
| Version | Author | Date |
|---|---|---|
| 0136d2e | wesleycrouse | 2022-06-10 |
GO_Molecular_Function_2021
Term Overlap Adjusted.P.value Genes
1 MHC class II receptor activity (GO:0032395) 9/10 1.089161e-13 HLA-DRA;HLA-DOA;HLA-DOB;HLA-DQA2;HLA-DQA1;HLA-DQB2;HLA-DRB1;HLA-DPA1;HLA-DQB1
2 MHC class II protein complex binding (GO:0023026) 6/17 1.868371e-05 HLA-DMA;HLA-DMB;HLA-DRA;HLA-DOA;HLA-DOB;HLA-DRB1
3 TAP1 binding (GO:0046978) 3/5 3.454308e-03 TAP2;TAP1;HLA-F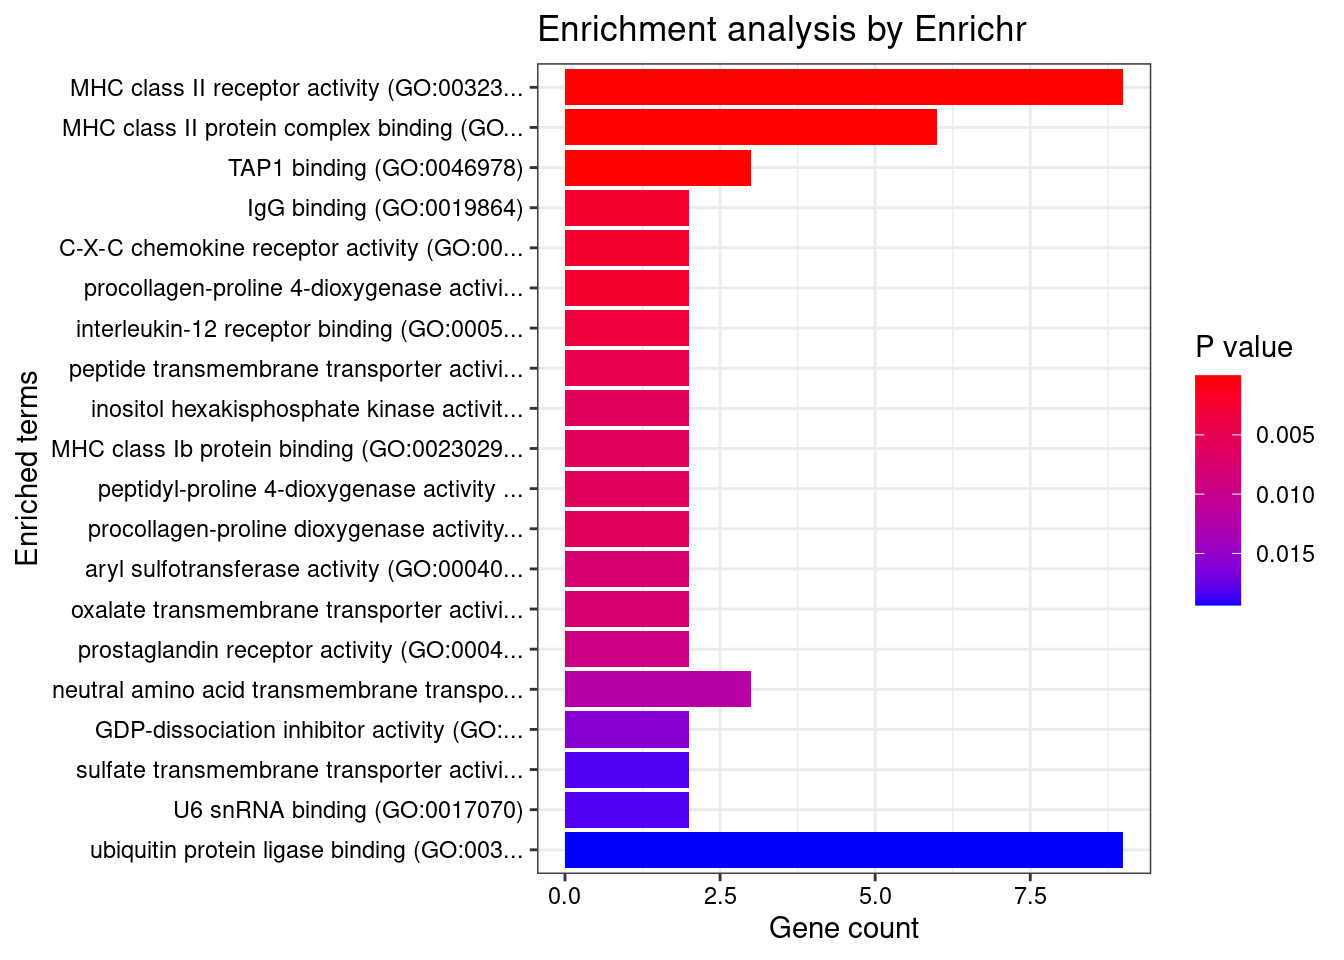
| Version | Author | Date |
|---|---|---|
| 0136d2e | wesleycrouse | 2022-06-10 |
Enrichment analysis for cTWAS genes in top tissues separately
GO
output <- output[order(-output$pve_g),]
top_tissues <- output$weight[1:5]
for (tissue in top_tissues){
cat(paste0(tissue, "\n\n"))
ctwas_genes_tissue <- df[[tissue]]$ctwas
cat(paste0("Number of cTWAS Genes in Tissue: ", length(ctwas_genes_tissue), "\n\n"))
dbs <- c("GO_Biological_Process_2021")
GO_enrichment <- enrichr(ctwas_genes_tissue, dbs)
for (db in dbs){
cat(paste0("\n", db, "\n\n"))
enrich_results <- GO_enrichment[[db]]
enrich_results <- enrich_results[enrich_results$Adjusted.P.value<0.05,c("Term", "Overlap", "Adjusted.P.value", "Genes")]
print(enrich_results)
print(plotEnrich(GO_enrichment[[db]]))
}
}Skin_Not_Sun_Exposed_Suprapubic
Number of cTWAS Genes in Tissue: 7
Uploading data to Enrichr... Done.
Querying GO_Biological_Process_2021... Done.
Parsing results... Done.
GO_Biological_Process_2021
Term Overlap Adjusted.P.value Genes
1 response to peptidoglycan (GO:0032494) 1/6 0.03815073 IRF5
2 intracellular pH elevation (GO:0051454) 1/6 0.03815073 SLC26A3
3 peptidyl-proline hydroxylation to 4-hydroxy-L-proline (GO:0018401) 1/8 0.03815073 P4HA2
4 peptidyl-proline hydroxylation (GO:0019511) 1/11 0.03815073 P4HA2
5 response to muramyl dipeptide (GO:0032495) 1/13 0.03815073 IRF5
6 positive regulation of interferon-alpha production (GO:0032727) 1/20 0.04175469 IRF5
7 regulation of interferon-alpha production (GO:0032647) 1/25 0.04175469 IRF5
8 cellular response to cAMP (GO:0071320) 1/31 0.04175469 SLC26A3
9 positive regulation of interleukin-12 production (GO:0032735) 1/34 0.04175469 IRF5
10 positive regulation of interferon-beta production (GO:0032728) 1/36 0.04175469 IRF5
11 regulation of intracellular pH (GO:0051453) 1/37 0.04175469 SLC26A3
12 response to cAMP (GO:0051591) 1/38 0.04175469 SLC26A3
13 response to peptide (GO:1901652) 1/39 0.04175469 IRF5
14 response to organonitrogen compound (GO:0010243) 1/40 0.04175469 IRF5
15 anion transport (GO:0006820) 1/43 0.04187505 SLC26A3
16 regulation of interferon-beta production (GO:0032648) 1/49 0.04377023 IRF5
17 regulation of interleukin-12 production (GO:0032655) 1/51 0.04377023 IRF5
18 cellular response to type I interferon (GO:0071357) 1/65 0.04948008 IRF5
19 type I interferon signaling pathway (GO:0060337) 1/65 0.04948008 IRF5
20 interferon-gamma-mediated signaling pathway (GO:0060333) 1/68 0.04948008 IRF5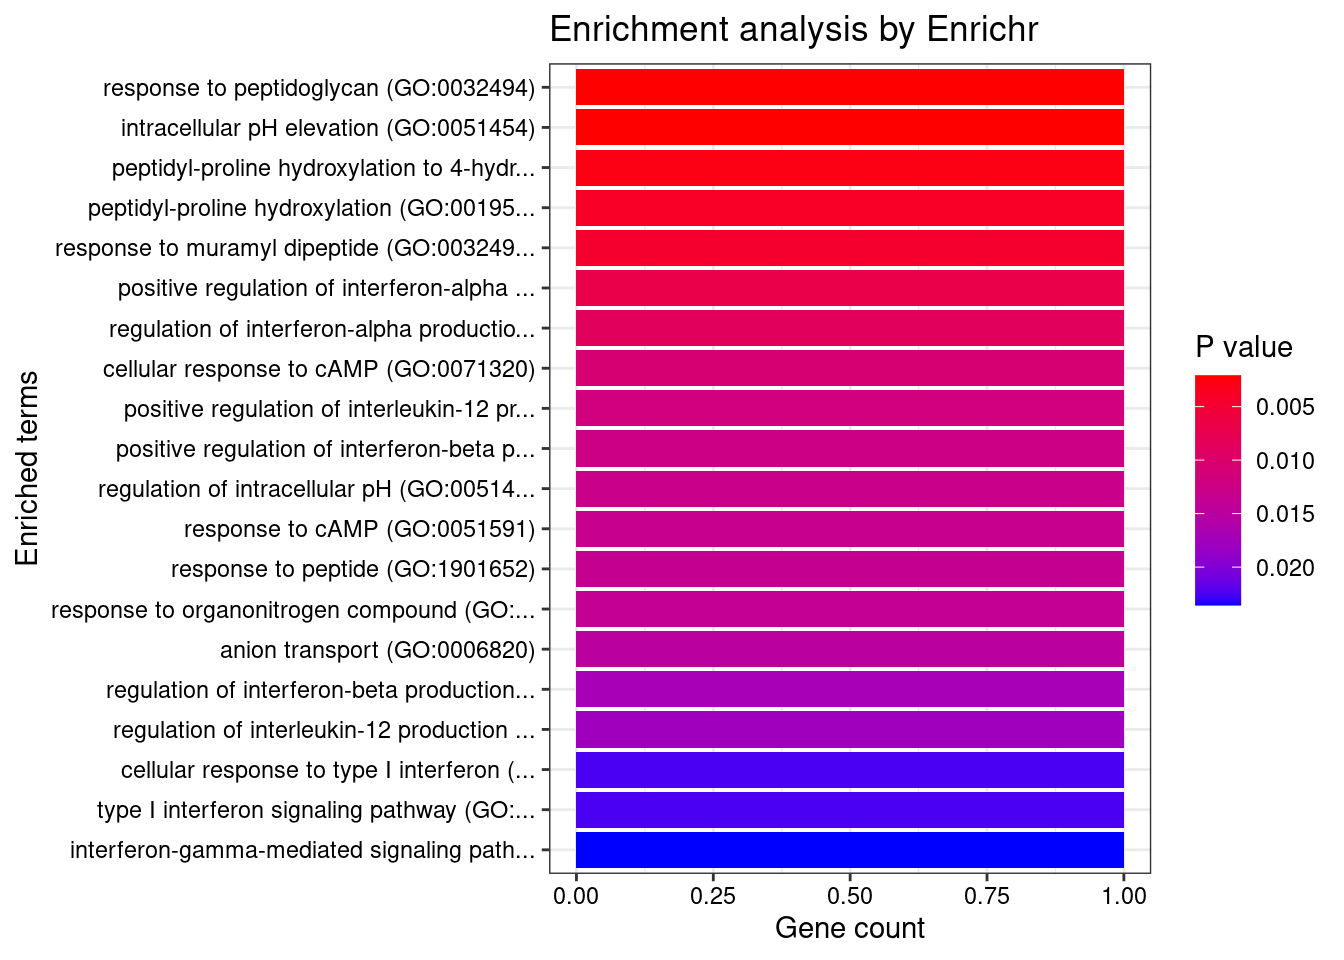
| Version | Author | Date |
|---|---|---|
| 0136d2e | wesleycrouse | 2022-06-10 |
Colon_Transverse
Number of cTWAS Genes in Tissue: 10
Uploading data to Enrichr... Done.
Querying GO_Biological_Process_2021... Done.
Parsing results... Done.
GO_Biological_Process_2021
Term Overlap Adjusted.P.value Genes
1 positive regulation of antigen receptor-mediated signaling pathway (GO:0050857) 3/21 2.370864e-05 PRKCB;RAB29;PRKD2
2 positive regulation of vascular endothelial growth factor receptor signaling pathway (GO:0030949) 2/10 1.005277e-03 PRKCB;PRKD2
3 positive regulation of T cell receptor signaling pathway (GO:0050862) 2/14 1.353827e-03 RAB29;PRKD2
4 regulation of vascular endothelial growth factor receptor signaling pathway (GO:0030947) 2/24 3.071413e-03 PRKCB;PRKD2
5 regulation of T cell receptor signaling pathway (GO:0050856) 2/35 5.281590e-03 RAB29;PRKD2
6 cellular response to type I interferon (GO:0071357) 2/65 1.252745e-02 IRF8;IRF5
7 type I interferon signaling pathway (GO:0060337) 2/65 1.252745e-02 IRF8;IRF5
8 interferon-gamma-mediated signaling pathway (GO:0060333) 2/68 1.252745e-02 IRF8;IRF5
9 phosphorylation (GO:0016310) 3/400 1.713207e-02 CERKL;PRKCB;PRKD2
10 regulation of type I interferon production (GO:0032479) 2/89 1.713207e-02 IRF8;IRF5
11 positive regulation of vasculature development (GO:1904018) 2/102 2.041551e-02 PRKCB;PRKD2
12 positive regulation of angiogenesis (GO:0045766) 2/116 2.228548e-02 PRKCB;PRKD2
13 sphingolipid metabolic process (GO:0006665) 2/116 2.228548e-02 CERKL;PRKD2
14 cellular response to interferon-gamma (GO:0071346) 2/121 2.249412e-02 IRF8;IRF5
15 positive regulation of endothelial cell chemotaxis by VEGF-activated vascular endothelial growth factor receptor signaling pathway (GO:0038033) 1/5 2.338252e-02 PRKD2
16 positive regulation of fibroblast growth factor receptor signaling pathway (GO:0045743) 1/5 2.338252e-02 PRKD2
17 histone-threonine phosphorylation (GO:0035405) 1/5 2.338252e-02 PRKCB
18 positive regulation of NF-kappaB transcription factor activity (GO:0051092) 2/155 2.338252e-02 PRKCB;PRKD2
19 peptidyl-serine phosphorylation (GO:0018105) 2/156 2.338252e-02 PRKCB;PRKD2
20 positive regulation of deacetylase activity (GO:0090045) 1/6 2.338252e-02 PRKD2
21 response to peptidoglycan (GO:0032494) 1/6 2.338252e-02 IRF5
22 morphogenesis of an endothelium (GO:0003159) 1/6 2.338252e-02 PRKD2
23 protein K29-linked ubiquitination (GO:0035519) 1/6 2.338252e-02 RNF186
24 intracellular pH elevation (GO:0051454) 1/6 2.338252e-02 SLC26A3
25 cytokine-mediated signaling pathway (GO:0019221) 3/621 2.338252e-02 IRF8;IRF5;CXCL5
26 peptidyl-serine modification (GO:0018209) 2/169 2.338252e-02 PRKCB;PRKD2
27 positive regulation of B cell receptor signaling pathway (GO:0050861) 1/7 2.398447e-02 PRKCB
28 regulation of histone deacetylase activity (GO:1901725) 1/7 2.398447e-02 PRKD2
29 protein localization to ciliary membrane (GO:1903441) 1/7 2.398447e-02 RAB29
30 antigen receptor-mediated signaling pathway (GO:0050851) 2/185 2.419261e-02 PRKCB;PRKD2
31 positive regulation of cell migration by vascular endothelial growth factor signaling pathway (GO:0038089) 1/8 2.563663e-02 PRKD2
32 regulation of angiogenesis (GO:0045765) 2/203 2.683713e-02 PRKCB;PRKD2
33 negative regulation of transmembrane transport (GO:0034763) 1/10 2.683713e-02 PRKCB
34 lipoprotein transport (GO:0042953) 1/10 2.683713e-02 PRKCB
35 positive regulation of receptor recycling (GO:0001921) 1/10 2.683713e-02 RAB29
36 toxin transport (GO:1901998) 1/10 2.683713e-02 RAB29
37 endothelial tube morphogenesis (GO:0061154) 1/10 2.683713e-02 PRKD2
38 lipoprotein localization (GO:0044872) 1/11 2.866659e-02 PRKCB
39 regulation of hemopoiesis (GO:1903706) 1/12 2.866659e-02 PRKCB
40 negative regulation of glucose transmembrane transport (GO:0010829) 1/12 2.866659e-02 PRKCB
41 mitotic nuclear membrane disassembly (GO:0007077) 1/12 2.866659e-02 PRKCB
42 positive regulation of DNA-binding transcription factor activity (GO:0051091) 2/246 2.866659e-02 PRKCB;PRKD2
43 positive regulation of histone deacetylation (GO:0031065) 1/13 2.866659e-02 PRKD2
44 response to muramyl dipeptide (GO:0032495) 1/13 2.866659e-02 IRF5
45 protein localization to mitochondrion (GO:0070585) 1/13 2.866659e-02 RNF186
46 positive regulation of signal transduction (GO:0009967) 2/252 2.879817e-02 PRKCB;PRKD2
47 nuclear membrane disassembly (GO:0051081) 1/14 2.955139e-02 PRKCB
48 positive regulation of endothelial cell chemotaxis (GO:2001028) 1/15 3.036305e-02 PRKD2
49 regulation of endothelial cell chemotaxis (GO:2001026) 1/15 3.036305e-02 PRKD2
50 regulation of receptor recycling (GO:0001919) 1/17 3.370808e-02 RAB29
51 positive regulation of transcription by RNA polymerase II (GO:0045944) 3/908 3.431047e-02 IRF8;IRF5;PRKD2
52 positive regulation of CREB transcription factor activity (GO:0032793) 1/18 3.431047e-02 PRKD2
53 regulation of glucose transmembrane transport (GO:0010827) 1/19 3.552529e-02 PRKCB
54 regulation of fibroblast growth factor receptor signaling pathway (GO:0040036) 1/20 3.602713e-02 PRKD2
55 positive regulation of interferon-alpha production (GO:0032727) 1/20 3.602713e-02 IRF5
56 cellular response to oxygen-containing compound (GO:1901701) 2/323 3.816691e-02 SLC26A3;CXCL5
57 membrane lipid metabolic process (GO:0006643) 1/22 3.822215e-02 CERKL
58 regulation of B cell receptor signaling pathway (GO:0050855) 1/23 3.884763e-02 PRKCB
59 positive regulation of cytokine production (GO:0001819) 2/335 3.884763e-02 IRF5;PRKD2
60 dendritic cell differentiation (GO:0097028) 1/24 3.959425e-02 IRF8
61 regulation of interferon-alpha production (GO:0032647) 1/25 4.055877e-02 IRF5
62 positive regulation of interleukin-2 production (GO:0032743) 1/26 4.083286e-02 PRKD2
63 mononuclear cell differentiation (GO:1903131) 1/26 4.083286e-02 IRF8
64 melanosome organization (GO:0032438) 1/27 4.108940e-02 RAB29
65 negative regulation of insulin receptor signaling pathway (GO:0046627) 1/27 4.108940e-02 PRKCB
66 protein transport (GO:0015031) 2/369 4.132997e-02 PRKCB;RAB29
67 negative regulation of cellular response to insulin stimulus (GO:1900077) 1/28 4.132997e-02 PRKCB
68 intrinsic apoptotic signaling pathway in response to endoplasmic reticulum stress (GO:0070059) 1/29 4.155595e-02 RNF186
69 regulation of DNA biosynthetic process (GO:2000278) 1/29 4.155595e-02 PRKD2
70 cellular response to cAMP (GO:0071320) 1/31 4.376761e-02 SLC26A3
71 regulation of intracellular protein transport (GO:0033157) 1/32 4.418368e-02 RAB29
72 epithelial tube morphogenesis (GO:0060562) 1/34 4.418368e-02 PRKD2
73 cellular response to vascular endothelial growth factor stimulus (GO:0035924) 1/34 4.418368e-02 PRKD2
74 regulation of transmembrane transport (GO:0034762) 1/34 4.418368e-02 PRKCB
75 B cell receptor signaling pathway (GO:0050853) 1/34 4.418368e-02 PRKCB
76 positive regulation of interleukin-12 production (GO:0032735) 1/34 4.418368e-02 IRF5
77 protein localization to cilium (GO:0061512) 1/35 4.488242e-02 RAB29
78 positive regulation of interferon-beta production (GO:0032728) 1/36 4.502621e-02 IRF5
79 regulation of transcription by RNA polymerase II (GO:0006357) 4/2206 4.502621e-02 PRKCB;IRF8;IRF5;PRKD2
80 positive regulation of transcription, DNA-templated (GO:0045893) 3/1183 4.502621e-02 IRF8;IRF5;PRKD2
81 regulation of intracellular pH (GO:0051453) 1/37 4.508381e-02 SLC26A3
82 positive regulation of signaling (GO:0023056) 1/38 4.517642e-02 RAB29
83 response to cAMP (GO:0051591) 1/38 4.517642e-02 SLC26A3
84 response to peptide (GO:1901652) 1/39 4.526416e-02 IRF5
85 positive regulation of intracellular transport (GO:0032388) 1/39 4.526416e-02 RAB29
86 response to organonitrogen compound (GO:0010243) 1/40 4.587465e-02 IRF5
87 anion transport (GO:0006820) 1/43 4.871558e-02 SLC26A3
88 protein K63-linked ubiquitination (GO:0070534) 1/44 4.925991e-02 RNF186
89 regulation of insulin receptor signaling pathway (GO:0046626) 1/45 4.925991e-02 PRKCB
90 positive regulation of chemotaxis (GO:0050921) 1/45 4.925991e-02 PRKD2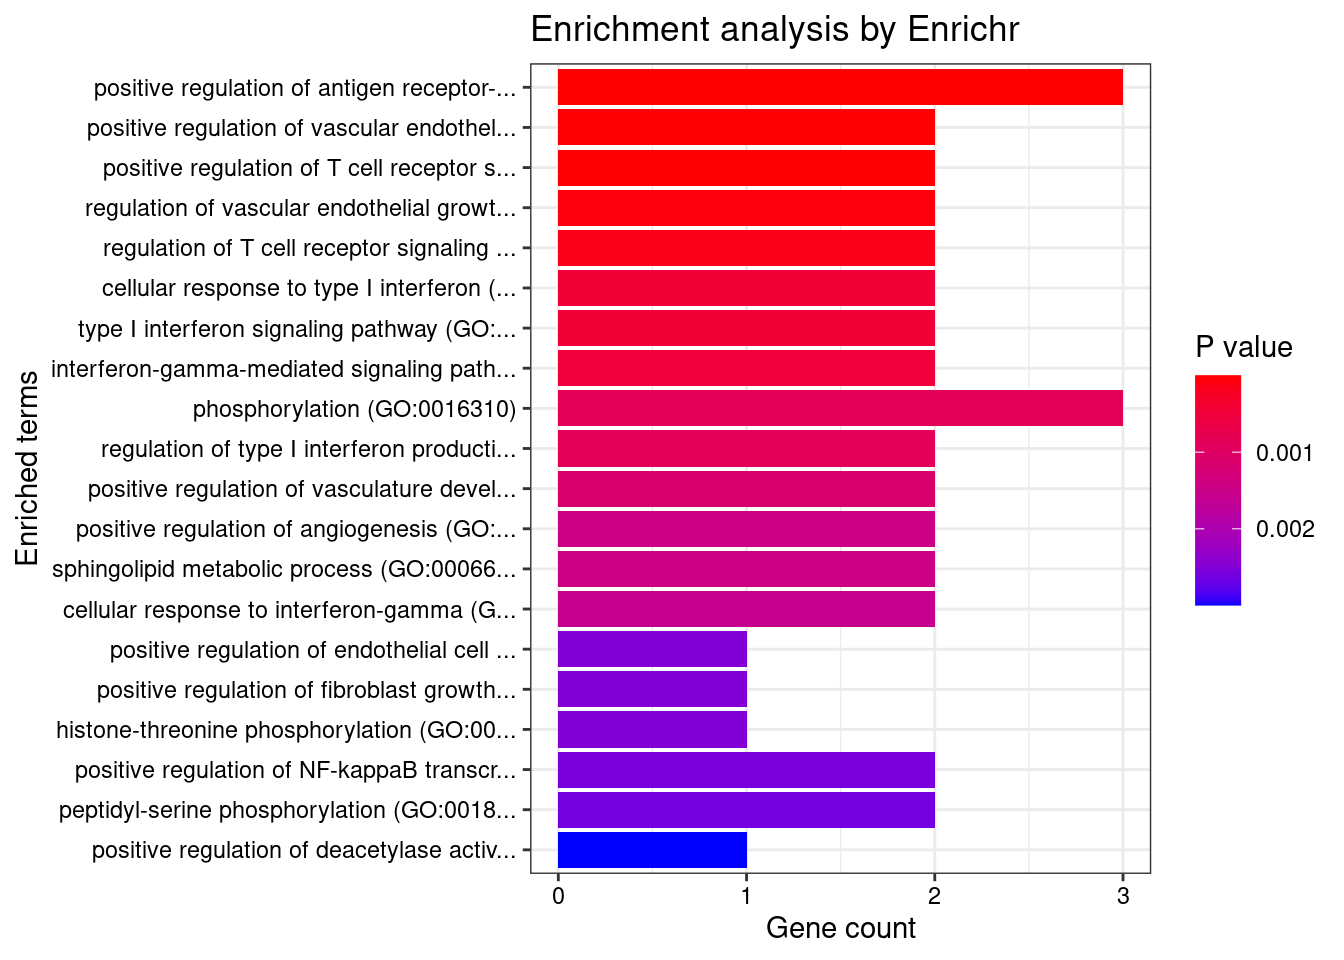
| Version | Author | Date |
|---|---|---|
| 0136d2e | wesleycrouse | 2022-06-10 |
Esophagus_Muscularis
Number of cTWAS Genes in Tissue: 6
Uploading data to Enrichr... Done.
Querying GO_Biological_Process_2021... Done.
Parsing results... Done.
GO_Biological_Process_2021
Term Overlap Adjusted.P.value Genes
1 neutrophil mediated immunity (GO:0002446) 3/488 0.01995347 HSPA6;CARD9;ITGAL
2 positive regulation of NF-kappaB transcription factor activity (GO:0051092) 2/155 0.01995347 CARD9;PRKD2
3 positive regulation of ERK1 and ERK2 cascade (GO:0070374) 2/172 0.01995347 CARD9;PRKD2
4 positive regulation of fibroblast growth factor receptor signaling pathway (GO:0045743) 1/5 0.01995347 PRKD2
5 T cell extravasation (GO:0072683) 1/5 0.01995347 ITGAL
6 positive regulation of endothelial cell chemotaxis by VEGF-activated vascular endothelial growth factor receptor signaling pathway (GO:0038033) 1/5 0.01995347 PRKD2
7 heat acclimation (GO:0010286) 1/6 0.01995347 HSPA6
8 morphogenesis of an endothelium (GO:0003159) 1/6 0.01995347 PRKD2
9 positive regulation of deacetylase activity (GO:0090045) 1/6 0.01995347 PRKD2
10 cellular heat acclimation (GO:0070370) 1/6 0.01995347 HSPA6
11 regulation of ERK1 and ERK2 cascade (GO:0070372) 2/238 0.01995347 CARD9;PRKD2
12 regulation of histone deacetylase activity (GO:1901725) 1/7 0.01995347 PRKD2
13 positive regulation of DNA-binding transcription factor activity (GO:0051091) 2/246 0.01995347 CARD9;PRKD2
14 positive regulation of cell migration by vascular endothelial growth factor signaling pathway (GO:0038089) 1/8 0.01995347 PRKD2
15 myeloid leukocyte mediated immunity (GO:0002444) 1/8 0.01995347 CARD9
16 positive regulation of MAPK cascade (GO:0043410) 2/274 0.01995347 CARD9;PRKD2
17 positive regulation of vascular endothelial growth factor receptor signaling pathway (GO:0030949) 1/10 0.01995347 PRKD2
18 regulation of T-helper 17 type immune response (GO:2000316) 1/10 0.01995347 CARD9
19 immunoglobulin mediated immune response (GO:0016064) 1/10 0.01995347 CARD9
20 endothelial tube morphogenesis (GO:0061154) 1/10 0.01995347 PRKD2
21 B cell mediated immunity (GO:0019724) 1/11 0.01995347 CARD9
22 positive regulation of T-helper 17 type immune response (GO:2000318) 1/12 0.01995347 CARD9
23 positive regulation of adaptive immune response based on somatic recombination of immune receptors built from immunoglobulin superfamily domains (GO:0002824) 1/13 0.01995347 CARD9
24 positive regulation of histone deacetylation (GO:0031065) 1/13 0.01995347 PRKD2
25 homeostasis of number of cells (GO:0048872) 1/13 0.01995347 CARD9
26 antifungal innate immune response (GO:0061760) 1/13 0.01995347 CARD9
27 positive regulation of cytokine production (GO:0001819) 2/335 0.01995347 CARD9;PRKD2
28 positive regulation of T cell receptor signaling pathway (GO:0050862) 1/14 0.01995347 PRKD2
29 positive regulation of granulocyte macrophage colony-stimulating factor production (GO:0032725) 1/14 0.01995347 CARD9
30 regulation of endothelial cell chemotaxis (GO:2001026) 1/15 0.01999695 PRKD2
31 positive regulation of endothelial cell chemotaxis (GO:2001028) 1/15 0.01999695 PRKD2
32 regulation of granulocyte macrophage colony-stimulating factor production (GO:0032645) 1/16 0.02066094 CARD9
33 positive regulation of cytokine production involved in inflammatory response (GO:1900017) 1/17 0.02124595 CARD9
34 positive regulation of CREB transcription factor activity (GO:0032793) 1/18 0.02124595 PRKD2
35 positive regulation of stress-activated protein kinase signaling cascade (GO:0070304) 1/18 0.02124595 CARD9
36 regulation of fibroblast growth factor receptor signaling pathway (GO:0040036) 1/20 0.02294515 PRKD2
37 positive regulation of antigen receptor-mediated signaling pathway (GO:0050857) 1/21 0.02343834 PRKD2
38 positive regulation of interleukin-17 production (GO:0032740) 1/23 0.02406836 CARD9
39 defense response to fungus (GO:0050832) 1/24 0.02406836 CARD9
40 regulation of vascular endothelial growth factor receptor signaling pathway (GO:0030947) 1/24 0.02406836 PRKD2
41 positive regulation of interleukin-2 production (GO:0032743) 1/26 0.02406836 PRKD2
42 chaperone cofactor-dependent protein refolding (GO:0051085) 1/26 0.02406836 HSPA6
43 cellular response to unfolded protein (GO:0034620) 1/27 0.02406836 HSPA6
44 neutrophil degranulation (GO:0043312) 2/481 0.02406836 HSPA6;ITGAL
45 neutrophil activation involved in immune response (GO:0002283) 2/485 0.02406836 HSPA6;ITGAL
46 leukocyte cell-cell adhesion (GO:0007159) 1/28 0.02406836 ITGAL
47 receptor clustering (GO:0043113) 1/28 0.02406836 ITGAL
48 T cell activation involved in immune response (GO:0002286) 1/28 0.02406836 ITGAL
49 regulation of DNA biosynthetic process (GO:2000278) 1/29 0.02441617 PRKD2
50 'de novo' posttranslational protein folding (GO:0051084) 1/31 0.02531299 HSPA6
51 cellular response to topologically incorrect protein (GO:0035967) 1/32 0.02531299 HSPA6
52 modulation by host of symbiont process (GO:0051851) 1/32 0.02531299 CARD9
53 regulation of interleukin-17 production (GO:0032660) 1/33 0.02531299 CARD9
54 epithelial tube morphogenesis (GO:0060562) 1/34 0.02531299 PRKD2
55 cellular response to vascular endothelial growth factor stimulus (GO:0035924) 1/34 0.02531299 PRKD2
56 positive regulation of intracellular signal transduction (GO:1902533) 2/546 0.02531299 CARD9;PRKD2
57 regulation of T cell receptor signaling pathway (GO:0050856) 1/35 0.02531299 PRKD2
58 cellular response to heat (GO:0034605) 1/36 0.02558412 HSPA6
59 heterophilic cell-cell adhesion via plasma membrane cell adhesion molecules (GO:0007157) 1/42 0.02932027 ITGAL
60 regulation of cytokine production involved in inflammatory response (GO:1900015) 1/43 0.02951438 CARD9
61 positive regulation of chemotaxis (GO:0050921) 1/45 0.03037321 PRKD2
62 positive regulation of blood vessel endothelial cell migration (GO:0043536) 1/48 0.03055225 PRKD2
63 regulation of interleukin-2 production (GO:0032663) 1/48 0.03055225 PRKD2
64 regulation of stress-activated MAPK cascade (GO:0032872) 1/49 0.03055225 CARD9
65 response to unfolded protein (GO:0006986) 1/49 0.03055225 HSPA6
66 cellular defense response (GO:0006968) 1/49 0.03055225 LSP1
67 regulation of blood vessel endothelial cell migration (GO:0043535) 1/55 0.03375619 PRKD2
68 membrane lipid biosynthetic process (GO:0046467) 1/58 0.03506081 PRKD2
69 peptidyl-threonine phosphorylation (GO:0018107) 1/60 0.03530300 PRKD2
70 positive regulation of interleukin-8 production (GO:0032757) 1/61 0.03530300 PRKD2
71 positive regulation of DNA biosynthetic process (GO:2000573) 1/61 0.03530300 PRKD2
72 positive regulation of cysteine-type endopeptidase activity (GO:2001056) 1/62 0.03537896 CARD9
73 positive regulation of DNA metabolic process (GO:0051054) 1/63 0.03545270 PRKD2
74 vascular endothelial growth factor receptor signaling pathway (GO:0048010) 1/67 0.03667991 PRKD2
75 peptidyl-threonine modification (GO:0018210) 1/67 0.03667991 PRKD2
76 positive regulation of JNK cascade (GO:0046330) 1/73 0.03940928 CARD9
77 sphingolipid biosynthetic process (GO:0030148) 1/74 0.03942539 PRKD2
78 positive regulation of interleukin-6 production (GO:0032755) 1/76 0.03996184 CARD9
79 positive regulation of endothelial cell proliferation (GO:0001938) 1/77 0.03997016 PRKD2
80 positive regulation of cell adhesion (GO:0045785) 1/80 0.04098787 PRKD2
81 regulation of interleukin-8 production (GO:0032677) 1/81 0.04098787 PRKD2
82 positive regulation of endothelial cell migration (GO:0010595) 1/86 0.04296044 PRKD2
83 regulation of cysteine-type endopeptidase activity involved in apoptotic process (GO:0043281) 1/89 0.04335017 CARD9
84 regulation of endothelial cell migration (GO:0010594) 1/89 0.04335017 PRKD2
85 protein complex oligomerization (GO:0051259) 1/90 0.04335017 CARD9
86 regulation of endothelial cell proliferation (GO:0001936) 1/92 0.04371147 PRKD2
87 positive regulation of peptidyl-serine phosphorylation (GO:0033138) 1/93 0.04371147 PRKD2
88 positive regulation of epithelial cell migration (GO:0010634) 1/94 0.04371147 PRKD2
89 regulation of peptidyl-serine phosphorylation (GO:0033135) 1/98 0.04493487 PRKD2
90 positive regulation of stress-activated MAPK cascade (GO:0032874) 1/99 0.04493487 CARD9
91 cell-matrix adhesion (GO:0007160) 1/100 0.04493487 ITGAL
92 positive regulation of vasculature development (GO:1904018) 1/102 0.04532405 PRKD2
93 regulation of JNK cascade (GO:0046328) 1/105 0.04613814 CARD9
94 regulation of interleukin-6 production (GO:0032675) 1/110 0.04779114 CARD9
95 cellular response to lectin (GO:1990858) 1/115 0.04781674 CARD9
96 stimulatory C-type lectin receptor signaling pathway (GO:0002223) 1/115 0.04781674 CARD9
97 positive regulation of protein metabolic process (GO:0051247) 1/115 0.04781674 CARD9
98 positive regulation of angiogenesis (GO:0045766) 1/116 0.04781674 PRKD2
99 sphingolipid metabolic process (GO:0006665) 1/116 0.04781674 PRKD2
100 positive regulation of cysteine-type endopeptidase activity involved in apoptotic process (GO:0043280) 1/119 0.04806402 CARD9
101 innate immune response activating cell surface receptor signaling pathway (GO:0002220) 1/119 0.04806402 CARD9
102 protein homooligomerization (GO:0051260) 1/121 0.04838060 CARD9
103 positive regulation of epithelial cell proliferation (GO:0050679) 1/123 0.04869064 PRKD2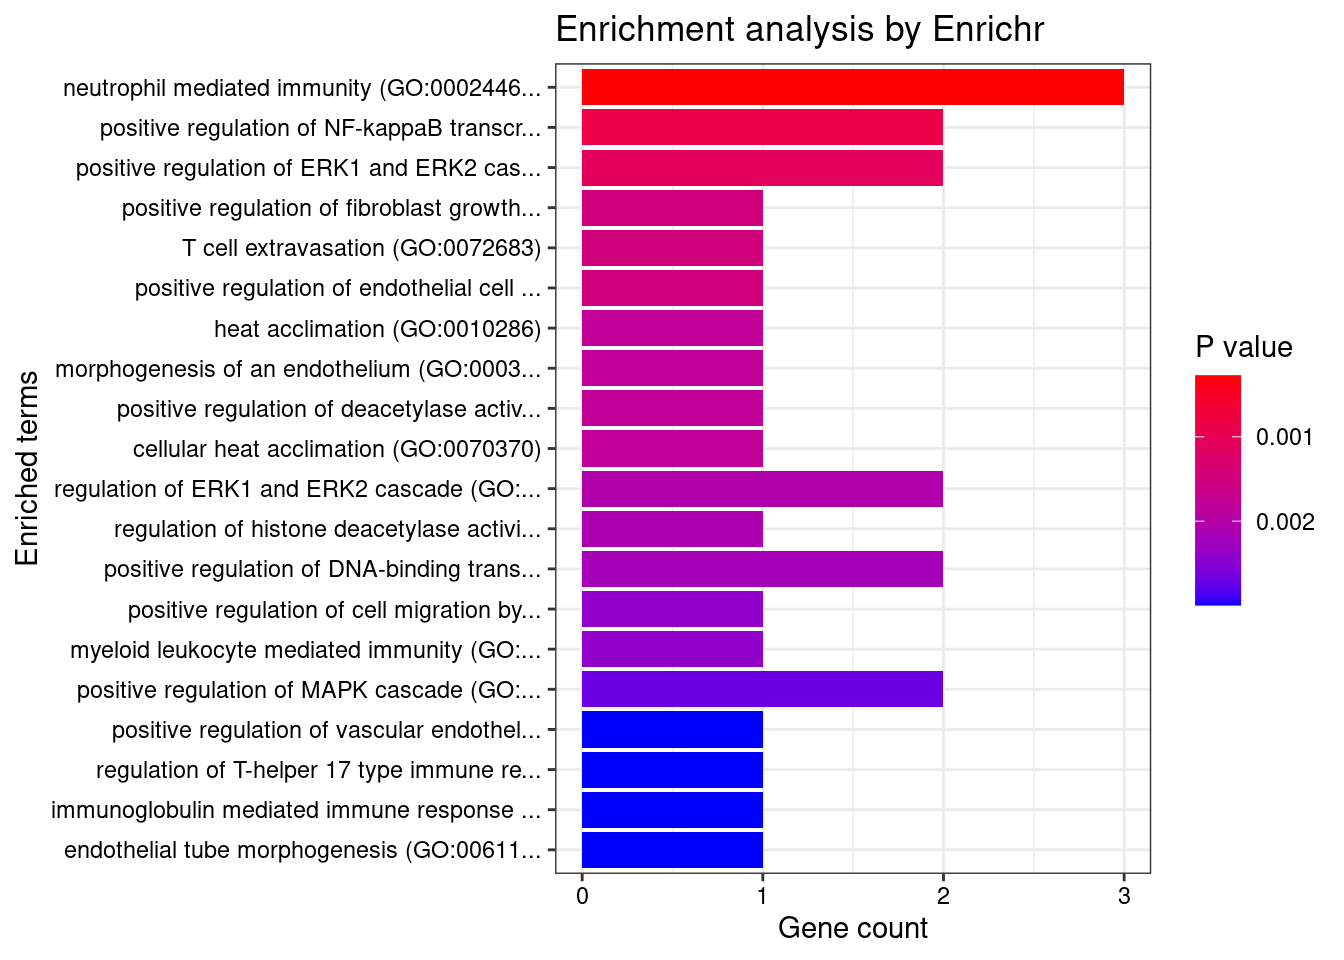
| Version | Author | Date |
|---|---|---|
| 0136d2e | wesleycrouse | 2022-06-10 |
Prostate
Number of cTWAS Genes in Tissue: 7
Uploading data to Enrichr... Done.
Querying GO_Biological_Process_2021... Done.
Parsing results... Done.
GO_Biological_Process_2021
Term Overlap Adjusted.P.value Genes
1 heat acclimation (GO:0010286) 1/6 0.03935969 HSPA6
2 cellular heat acclimation (GO:0070370) 1/6 0.03935969 HSPA6
3 protein localization to ciliary membrane (GO:1903441) 1/7 0.03935969 RAB29
4 positive regulation of receptor recycling (GO:0001921) 1/10 0.03935969 RAB29
5 toxin transport (GO:1901998) 1/10 0.03935969 RAB29
6 positive regulation of T cell receptor signaling pathway (GO:0050862) 1/14 0.03935969 RAB29
7 activation of NF-kappaB-inducing kinase activity (GO:0007250) 1/16 0.03935969 TNFSF15
8 regulation of receptor recycling (GO:0001919) 1/17 0.03935969 RAB29
9 positive regulation of antigen receptor-mediated signaling pathway (GO:0050857) 1/21 0.03935969 RAB29
10 chaperone cofactor-dependent protein refolding (GO:0051085) 1/26 0.03935969 HSPA6
11 melanosome organization (GO:0032438) 1/27 0.03935969 RAB29
12 cellular response to unfolded protein (GO:0034620) 1/27 0.03935969 HSPA6
13 'de novo' posttranslational protein folding (GO:0051084) 1/31 0.03935969 HSPA6
14 regulation of intracellular protein transport (GO:0033157) 1/32 0.03935969 RAB29
15 cellular response to topologically incorrect protein (GO:0035967) 1/32 0.03935969 HSPA6
16 regulation of T cell receptor signaling pathway (GO:0050856) 1/35 0.03935969 RAB29
17 protein localization to cilium (GO:0061512) 1/35 0.03935969 RAB29
18 cellular response to heat (GO:0034605) 1/36 0.03935969 HSPA6
19 positive regulation of signaling (GO:0023056) 1/38 0.03935969 RAB29
20 positive regulation of intracellular transport (GO:0032388) 1/39 0.03935969 RAB29
21 response to unfolded protein (GO:0006986) 1/49 0.04293729 HSPA6
22 cellular defense response (GO:0006968) 1/49 0.04293729 LSP1
23 negative regulation of cell projection organization (GO:0031345) 1/49 0.04293729 RAB29
24 negative regulation of neuron projection development (GO:0010977) 1/58 0.04864045 RAB29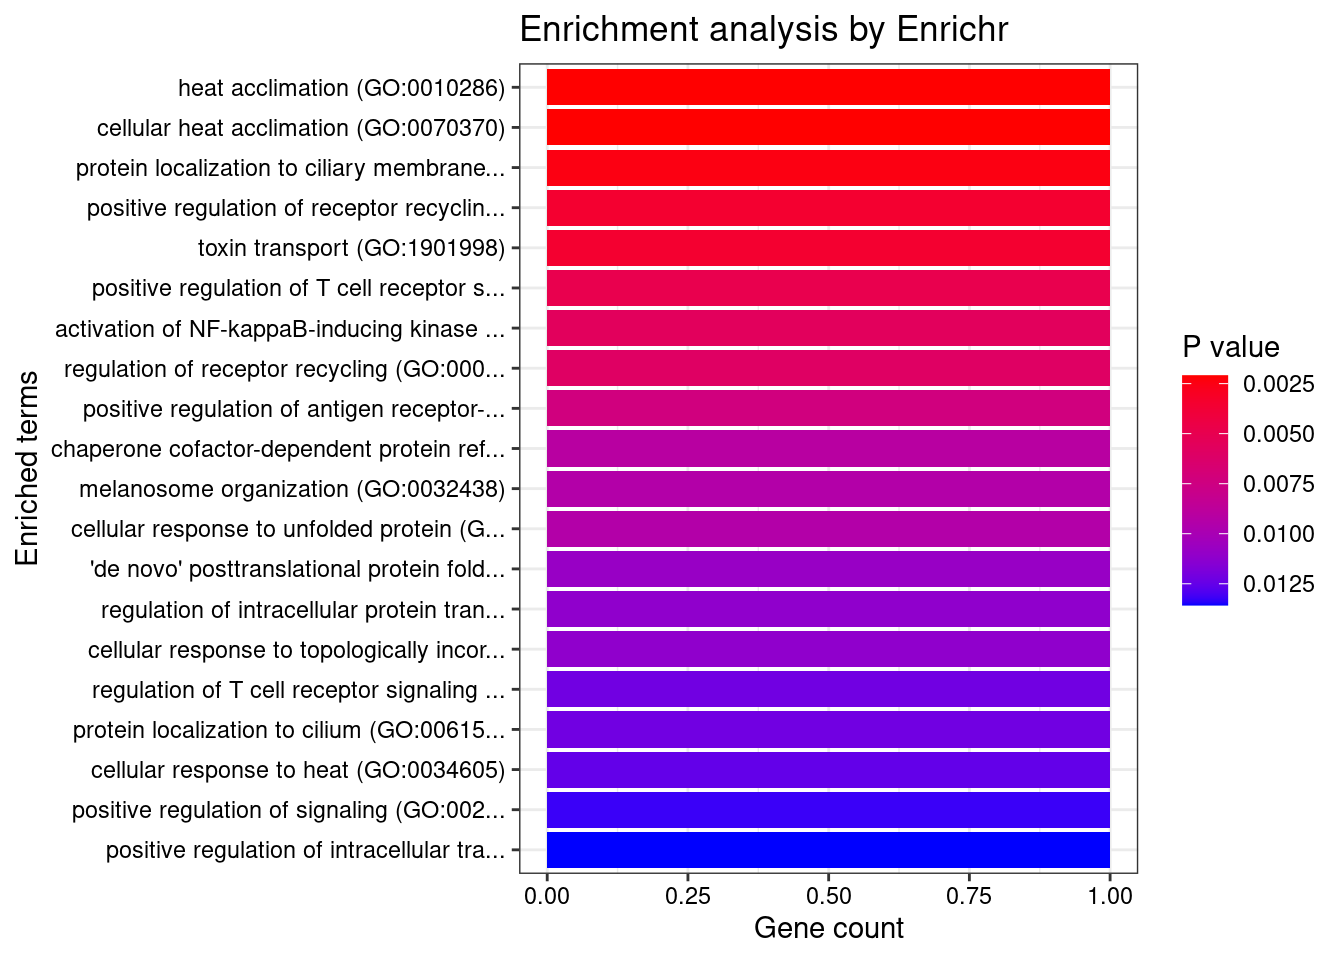
| Version | Author | Date |
|---|---|---|
| 0136d2e | wesleycrouse | 2022-06-10 |
Adipose_Subcutaneous
Number of cTWAS Genes in Tissue: 5
Uploading data to Enrichr... Done.
Querying GO_Biological_Process_2021... Done.
Parsing results... Done.
GO_Biological_Process_2021
Term Overlap Adjusted.P.value Genes
1 positive regulation of NF-kappaB transcription factor activity (GO:0051092) 2/155 0.01728852 CARD9;PRKD2
2 positive regulation of ERK1 and ERK2 cascade (GO:0070374) 2/172 0.01728852 CARD9;PRKD2
3 positive regulation of fibroblast growth factor receptor signaling pathway (GO:0045743) 1/5 0.01728852 PRKD2
4 positive regulation of endothelial cell chemotaxis by VEGF-activated vascular endothelial growth factor receptor signaling pathway (GO:0038033) 1/5 0.01728852 PRKD2
5 regulation of ERK1 and ERK2 cascade (GO:0070372) 2/238 0.01728852 CARD9;PRKD2
6 positive regulation of DNA-binding transcription factor activity (GO:0051091) 2/246 0.01728852 CARD9;PRKD2
7 morphogenesis of an endothelium (GO:0003159) 1/6 0.01728852 PRKD2
8 positive regulation of deacetylase activity (GO:0090045) 1/6 0.01728852 PRKD2
9 regulation of histone deacetylase activity (GO:1901725) 1/7 0.01728852 PRKD2
10 positive regulation of MAPK cascade (GO:0043410) 2/274 0.01728852 CARD9;PRKD2
11 positive regulation of cell migration by vascular endothelial growth factor signaling pathway (GO:0038089) 1/8 0.01728852 PRKD2
12 myeloid leukocyte mediated immunity (GO:0002444) 1/8 0.01728852 CARD9
13 positive regulation of vascular endothelial growth factor receptor signaling pathway (GO:0030949) 1/10 0.01728852 PRKD2
14 regulation of T-helper 17 type immune response (GO:2000316) 1/10 0.01728852 CARD9
15 immunoglobulin mediated immune response (GO:0016064) 1/10 0.01728852 CARD9
16 endothelial tube morphogenesis (GO:0061154) 1/10 0.01728852 PRKD2
17 positive regulation of cytokine production (GO:0001819) 2/335 0.01728852 CARD9;PRKD2
18 B cell mediated immunity (GO:0019724) 1/11 0.01728852 CARD9
19 positive regulation of T-helper 17 type immune response (GO:2000318) 1/12 0.01728852 CARD9
20 positive regulation of adaptive immune response based on somatic recombination of immune receptors built from immunoglobulin superfamily domains (GO:0002824) 1/13 0.01728852 CARD9
21 positive regulation of histone deacetylation (GO:0031065) 1/13 0.01728852 PRKD2
22 homeostasis of number of cells (GO:0048872) 1/13 0.01728852 CARD9
23 antifungal innate immune response (GO:0061760) 1/13 0.01728852 CARD9
24 positive regulation of T cell receptor signaling pathway (GO:0050862) 1/14 0.01728852 PRKD2
25 positive regulation of granulocyte macrophage colony-stimulating factor production (GO:0032725) 1/14 0.01728852 CARD9
26 regulation of endothelial cell chemotaxis (GO:2001026) 1/15 0.01728852 PRKD2
27 positive regulation of endothelial cell chemotaxis (GO:2001028) 1/15 0.01728852 PRKD2
28 regulation of granulocyte macrophage colony-stimulating factor production (GO:0032645) 1/16 0.01728852 CARD9
29 embryo development ending in birth or egg hatching (GO:0009792) 1/17 0.01728852 NR5A2
30 positive regulation of cytokine production involved in inflammatory response (GO:1900017) 1/17 0.01728852 CARD9
31 regulation of nucleic acid-templated transcription (GO:1903506) 2/430 0.01728852 NR5A2;ZNF736
32 positive regulation of CREB transcription factor activity (GO:0032793) 1/18 0.01728852 PRKD2
33 positive regulation of stress-activated protein kinase signaling cascade (GO:0070304) 1/18 0.01728852 CARD9
34 regulation of fibroblast growth factor receptor signaling pathway (GO:0040036) 1/20 0.01848358 PRKD2
35 regulation of cellular macromolecule biosynthetic process (GO:2000112) 2/468 0.01848358 NR5A2;ZNF736
36 positive regulation of antigen receptor-mediated signaling pathway (GO:0050857) 1/21 0.01848358 PRKD2
37 positive regulation of interleukin-17 production (GO:0032740) 1/23 0.01949332 CARD9
38 defense response to fungus (GO:0050832) 1/24 0.01949332 CARD9
39 regulation of vascular endothelial growth factor receptor signaling pathway (GO:0030947) 1/24 0.01949332 PRKD2
40 positive regulation of interleukin-2 production (GO:0032743) 1/26 0.02058571 PRKD2
41 positive regulation of intracellular signal transduction (GO:1902533) 2/546 0.02135266 CARD9;PRKD2
42 positive regulation of viral genome replication (GO:0045070) 1/29 0.02135266 NR5A2
43 regulation of DNA biosynthetic process (GO:2000278) 1/29 0.02135266 PRKD2
44 modulation by host of symbiont process (GO:0051851) 1/32 0.02289216 CARD9
45 regulation of interleukin-17 production (GO:0032660) 1/33 0.02289216 CARD9
46 epithelial tube morphogenesis (GO:0060562) 1/34 0.02289216 PRKD2
47 cellular response to vascular endothelial growth factor stimulus (GO:0035924) 1/34 0.02289216 PRKD2
48 regulation of T cell receptor signaling pathway (GO:0050856) 1/35 0.02307220 PRKD2
49 regulation of cytokine production involved in inflammatory response (GO:1900015) 1/43 0.02774518 CARD9
50 positive regulation of chemotaxis (GO:0050921) 1/45 0.02844925 PRKD2
51 positive regulation of blood vessel endothelial cell migration (GO:0043536) 1/48 0.02867194 PRKD2
52 regulation of interleukin-2 production (GO:0032663) 1/48 0.02867194 PRKD2
53 regulation of stress-activated MAPK cascade (GO:0032872) 1/49 0.02867194 CARD9
54 cellular defense response (GO:0006968) 1/49 0.02867194 LSP1
55 regulation of blood vessel endothelial cell migration (GO:0043535) 1/55 0.03157871 PRKD2
56 membrane lipid biosynthetic process (GO:0046467) 1/58 0.03206240 PRKD2
57 peptidyl-threonine phosphorylation (GO:0018107) 1/60 0.03206240 PRKD2
58 positive regulation of interleukin-8 production (GO:0032757) 1/61 0.03206240 PRKD2
59 positive regulation of DNA biosynthetic process (GO:2000573) 1/61 0.03206240 PRKD2
60 positive regulation of cysteine-type endopeptidase activity (GO:2001056) 1/62 0.03206240 CARD9
61 positive regulation of viral process (GO:0048524) 1/63 0.03206240 NR5A2
62 positive regulation of DNA metabolic process (GO:0051054) 1/63 0.03206240 PRKD2
63 vascular endothelial growth factor receptor signaling pathway (GO:0048010) 1/67 0.03251135 PRKD2
64 peptidyl-threonine modification (GO:0018210) 1/67 0.03251135 PRKD2
65 regulation of viral genome replication (GO:0045069) 1/67 0.03251135 NR5A2
66 positive regulation of JNK cascade (GO:0046330) 1/73 0.03466028 CARD9
67 sphingolipid biosynthetic process (GO:0030148) 1/74 0.03466028 PRKD2
68 positive regulation of transcription by RNA polymerase II (GO:0045944) 2/908 0.03466028 NR5A2;PRKD2
69 positive regulation of interleukin-6 production (GO:0032755) 1/76 0.03466028 CARD9
70 positive regulation of endothelial cell proliferation (GO:0001938) 1/77 0.03466028 PRKD2
71 positive regulation of cell adhesion (GO:0045785) 1/80 0.03543385 PRKD2
72 regulation of interleukin-8 production (GO:0032677) 1/81 0.03543385 PRKD2
73 positive regulation of endothelial cell migration (GO:0010595) 1/86 0.03708722 PRKD2
74 regulation of cysteine-type endopeptidase activity involved in apoptotic process (GO:0043281) 1/89 0.03726524 CARD9
75 regulation of endothelial cell migration (GO:0010594) 1/89 0.03726524 PRKD2
76 protein complex oligomerization (GO:0051259) 1/90 0.03726524 CARD9
77 regulation of endothelial cell proliferation (GO:0001936) 1/92 0.03742847 PRKD2
78 positive regulation of peptidyl-serine phosphorylation (GO:0033138) 1/93 0.03742847 PRKD2
79 positive regulation of epithelial cell migration (GO:0010634) 1/94 0.03742847 PRKD2
80 regulation of peptidyl-serine phosphorylation (GO:0033135) 1/98 0.03842682 PRKD2
81 positive regulation of stress-activated MAPK cascade (GO:0032874) 1/99 0.03842682 CARD9
82 positive regulation of vasculature development (GO:1904018) 1/102 0.03909672 PRKD2
83 regulation of JNK cascade (GO:0046328) 1/105 0.03941932 CARD9
84 regulation of gene expression (GO:0010468) 2/1079 0.03941932 NR5A2;ZNF736
85 regulation of interleukin-6 production (GO:0032675) 1/110 0.04045401 CARD9
86 cellular response to lectin (GO:1990858) 1/115 0.04045401 CARD9
87 stimulatory C-type lectin receptor signaling pathway (GO:0002223) 1/115 0.04045401 CARD9
88 positive regulation of protein metabolic process (GO:0051247) 1/115 0.04045401 CARD9
89 positive regulation of angiogenesis (GO:0045766) 1/116 0.04045401 PRKD2
90 sphingolipid metabolic process (GO:0006665) 1/116 0.04045401 PRKD2
91 positive regulation of cysteine-type endopeptidase activity involved in apoptotic process (GO:0043280) 1/119 0.04058588 CARD9
92 innate immune response activating cell surface receptor signaling pathway (GO:0002220) 1/119 0.04058588 CARD9
93 protein homooligomerization (GO:0051260) 1/121 0.04081609 CARD9
94 positive regulation of epithelial cell proliferation (GO:0050679) 1/123 0.04104114 PRKD2
95 positive regulation of transcription, DNA-templated (GO:0045893) 2/1183 0.04145539 NR5A2;PRKD2
96 positive regulation of macromolecule biosynthetic process (GO:0010557) 1/129 0.04212114 PRKD2
97 regulation of cell adhesion (GO:0030155) 1/133 0.04296233 PRKD2
98 transcription initiation from RNA polymerase II promoter (GO:0006367) 1/140 0.04473073 NR5A2
99 regulation of cytokine production (GO:0001817) 1/150 0.04739427 CARD9
100 peptidyl-serine phosphorylation (GO:0018105) 1/156 0.04777962 PRKD2
101 cellular response to growth factor stimulus (GO:0071363) 1/158 0.04777962 PRKD2
102 organonitrogen compound biosynthetic process (GO:1901566) 1/158 0.04777962 PRKD2
103 T cell receptor signaling pathway (GO:0050852) 1/158 0.04777962 PRKD2
104 protein autophosphorylation (GO:0046777) 1/159 0.04777962 PRKD2
105 DNA-templated transcription, initiation (GO:0006352) 1/168 0.04977663 NR5A2
106 peptidyl-serine modification (GO:0018209) 1/169 0.04977663 PRKD2
107 positive regulation of I-kappaB kinase/NF-kappaB signaling (GO:0043123) 1/171 0.04988502 CARD9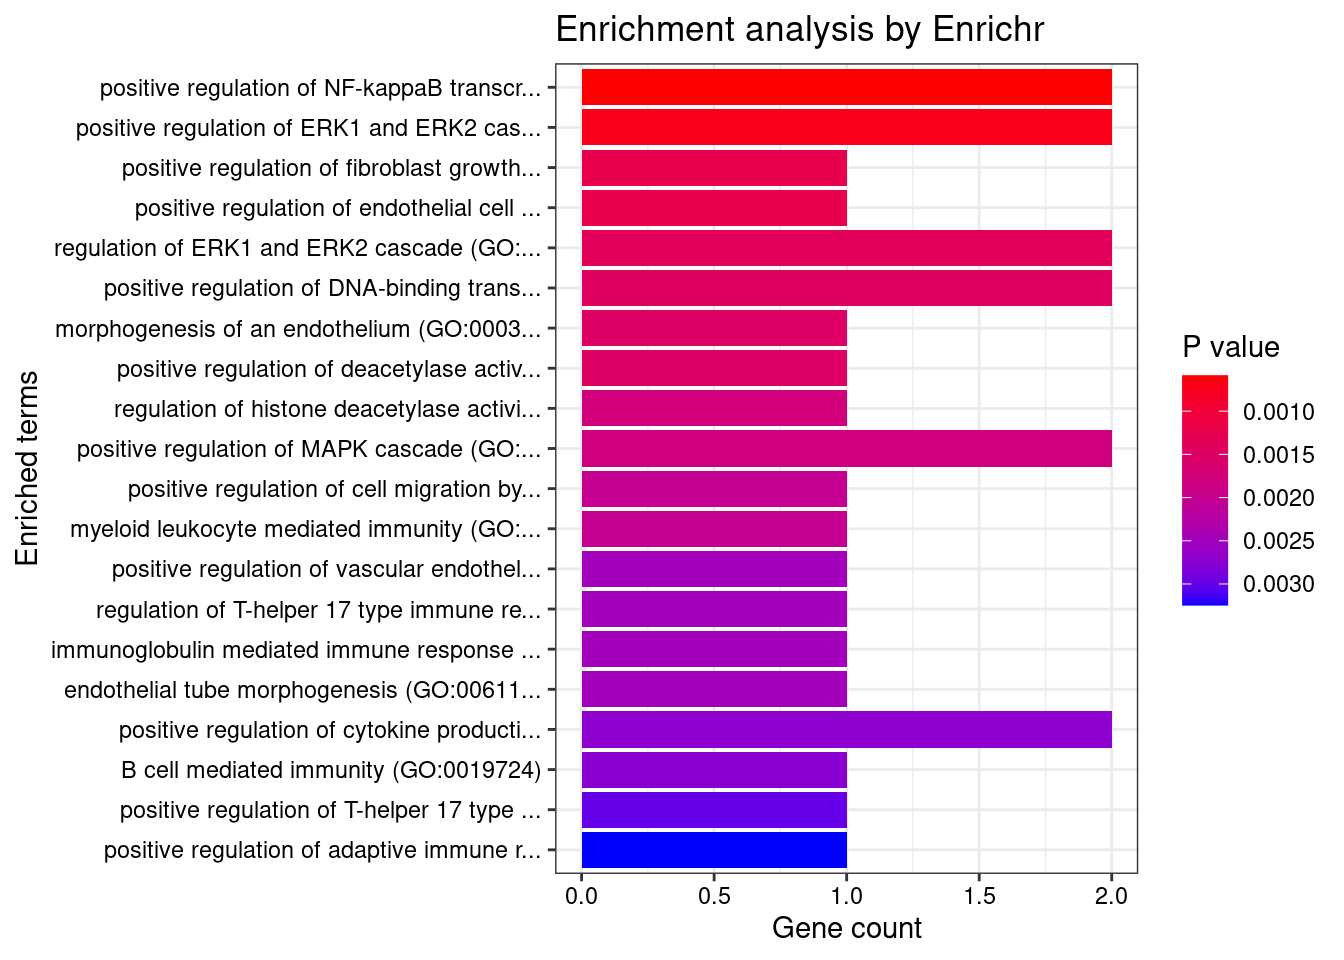
| Version | Author | Date |
|---|---|---|
| 0136d2e | wesleycrouse | 2022-06-10 |
KEGG
output <- output[order(-output$pve_g),]
top_tissues <- output$weight[1:5]
for (tissue in top_tissues){
cat(paste0(tissue, "\n\n"))
ctwas_genes_tissue <- df[[tissue]]$ctwas
background_tissue <- df[[tissue]]$gene_pips$genename
cat(paste0("Number of cTWAS Genes in Tissue: ", length(ctwas_genes_tissue), "\n\n"))
databases <- c("pathway_KEGG")
enrichResult <- NULL
try(enrichResult <- WebGestaltR(enrichMethod="ORA", organism="hsapiens",
interestGene=ctwas_genes_tissue, referenceGene=background_tissue,
enrichDatabase=databases, interestGeneType="genesymbol",
referenceGeneType="genesymbol", isOutput=F))
if (!is.null(enrichResult)){
print(enrichResult[,c("description", "size", "overlap", "FDR", "userId")])
}
cat("\n")
} Skin_Not_Sun_Exposed_Suprapubic
Number of cTWAS Genes in Tissue: 7
Loading the functional categories...
Loading the ID list...
Loading the reference list...
Performing the enrichment analysis...
Warning in oraEnrichment(interestGeneList, referenceGeneList, geneSet, minNum = minNum, : No significant gene set is identified based on FDR 0.05!
Colon_Transverse
Number of cTWAS Genes in Tissue: 10
Loading the functional categories...
Loading the ID list...
Loading the reference list...
Performing the enrichment analysis...Warning in oraEnrichment(interestGeneList, referenceGeneList, geneSet, minNum = minNum, : No significant gene set is identified based on FDR 0.05!
Esophagus_Muscularis
Number of cTWAS Genes in Tissue: 6
Loading the functional categories...
Loading the ID list...
Loading the reference list...
Performing the enrichment analysis...Warning in oraEnrichment(interestGeneList, referenceGeneList, geneSet, minNum = minNum, : No significant gene set is identified based on FDR 0.05!
Prostate
Number of cTWAS Genes in Tissue: 7
Loading the functional categories...
Loading the ID list...
Loading the reference list...
Performing the enrichment analysis...Warning in oraEnrichment(interestGeneList, referenceGeneList, geneSet, minNum = minNum, : No significant gene set is identified based on FDR 0.05!
Adipose_Subcutaneous
Number of cTWAS Genes in Tissue: 5
Loading the functional categories...
Loading the ID list...
Loading the reference list...
Performing the enrichment analysis...Warning in oraEnrichment(interestGeneList, referenceGeneList, geneSet, minNum = minNum, : No significant gene set is identified based on FDR 0.05!DisGeNET
output <- output[order(-output$pve_g),]
top_tissues <- output$weight[1:5]
for (tissue in top_tissues){
cat(paste0(tissue, "\n\n"))
ctwas_genes_tissue <- df[[tissue]]$ctwas
cat(paste0("Number of cTWAS Genes in Tissue: ", length(ctwas_genes_tissue), "\n\n"))
res_enrich <- disease_enrichment(entities=ctwas_genes_tissue, vocabulary = "HGNC", database = "CURATED")
if (any(res_enrich@qresult$FDR < 0.05)){
  print(res_enrich@qresult[res_enrich@qresult$FDR < 0.05, c("Description", "FDR", "Ratio",  "BgRatio")])
}
cat("\n")
} Skin_Not_Sun_Exposed_Suprapubic
Number of cTWAS Genes in Tissue: 7TMEM52 gene(s) from the input list not found in DisGeNET CURATEDC1orf74 gene(s) from the input list not found in DisGeNET CURATEDC1orf106 gene(s) from the input list not found in DisGeNET CURATED Description FDR Ratio BgRatio
3 Ulcerative Colitis 0.002267574 2/4 63/9703
12 Congenital chloride diarrhea 0.002267574 1/4 1/9703
17 Inflammatory Bowel Disease 14 0.002267574 1/4 1/9703
20 MYOPIA 25, AUTOSOMAL DOMINANT 0.002267574 1/4 1/9703
9 CREST Syndrome 0.007768529 1/4 6/9703
14 Scleroderma, Limited 0.007768529 1/4 6/9703
15 Diffuse Scleroderma 0.007768529 1/4 5/9703
7 Systemic Scleroderma 0.021482064 1/4 19/9703
2 Primary biliary cirrhosis 0.047031229 1/4 47/9703
Colon_Transverse
Number of cTWAS Genes in Tissue: 10NXPE1 gene(s) from the input list not found in DisGeNET CURATEDRAB29 gene(s) from the input list not found in DisGeNET CURATEDRNF186 gene(s) from the input list not found in DisGeNET CURATED Description FDR Ratio BgRatio
5 Ulcerative Colitis 0.006970959 2/7 63/9703
31 Congenital chloride diarrhea 0.006970959 1/7 1/9703
44 Retinitis Pigmentosa 26 0.006970959 1/7 1/9703
46 Inflammatory Bowel Disease 14 0.006970959 1/7 1/9703
48 IMMUNODEFICIENCY 32A 0.006970959 1/7 1/9703
49 IMMUNODEFICIENCY 32B 0.006970959 1/7 1/9703
18 Meniere Disease 0.015142146 1/7 3/9703
29 CREST Syndrome 0.021179345 1/7 6/9703
33 Scleroderma, Limited 0.021179345 1/7 6/9703
37 Diffuse Scleroderma 0.021179345 1/7 5/9703
1 Rheumatoid Arthritis 0.028201907 2/7 174/9703
Esophagus_Muscularis
Number of cTWAS Genes in Tissue: 6FAM171B gene(s) from the input list not found in DisGeNET CURATED Description FDR Ratio BgRatio
7 Inflammatory Bowel Diseases 0.003642493 2/5 35/9703
4 Ulcerative Colitis 0.004981791 2/5 63/9703
21 Deep seated dermatophytosis 0.004981791 1/5 1/9703
23 Candidiasis, Familial, 2 0.007471145 1/5 2/9703
24 clinical depression 0.017915967 1/5 6/9703
12 Ankylosing spondylitis 0.027343413 1/5 11/9703
1 Behcet Syndrome 0.048322730 1/5 24/9703
6 Heart valve disease 0.048322730 1/5 26/9703
3 Calcinosis 0.048652707 1/5 42/9703
5 IGA Glomerulonephritis 0.048652707 1/5 34/9703
9 Acute Promyelocytic Leukemia 0.048652707 1/5 46/9703
15 Tumoral calcinosis 0.048652707 1/5 42/9703
16 Gastric Adenocarcinoma 0.048652707 1/5 45/9703
17 Microcalcification 0.048652707 1/5 42/9703
Prostate
Number of cTWAS Genes in Tissue: 7NXPE1 gene(s) from the input list not found in DisGeNET CURATEDRAB29 gene(s) from the input list not found in DisGeNET CURATED Description FDR Ratio BgRatio
6 Ulcerative Colitis 0.006957328 2/5 63/9703
7 Enteritis 0.006957328 1/5 1/9703
Adipose_Subcutaneous
Number of cTWAS Genes in Tissue: 5ZNF736 gene(s) from the input list not found in DisGeNET CURATED Description FDR Ratio BgRatio
1 Anovulation 0.005359720 1/4 1/9703
4 Ulcerative Colitis 0.005359720 2/4 63/9703
32 Deep seated dermatophytosis 0.005359720 1/4 1/9703
34 Candidiasis, Familial, 2 0.008038336 1/4 2/9703
6 Heart valve disease 0.034487710 1/4 26/9703
9 Female infertility 0.034487710 1/4 28/9703
14 Ankylosing spondylitis 0.034487710 1/4 11/9703
15 Sterility, Postpartum 0.034487710 1/4 28/9703
17 Dyslipidemias 0.034487710 1/4 24/9703
19 Impaired glucose tolerance 0.034487710 1/4 25/9703
21 Subfertility, Female 0.034487710 1/4 28/9703
25 Dyslipoproteinemias 0.034487710 1/4 24/9703
28 Female sterility 0.034487710 1/4 28/9703
3 Calcinosis 0.037280843 1/4 42/9703
5 IGA Glomerulonephritis 0.037280843 1/4 34/9703
10 Inflammatory Bowel Diseases 0.037280843 1/4 35/9703
18 Tumoral calcinosis 0.037280843 1/4 42/9703
24 Microcalcification 0.037280843 1/4 42/9703
20 Gastric Adenocarcinoma 0.037823894 1/4 45/9703
8 Hepatomegaly 0.041761741 1/4 54/9703
11 Chronic Lymphocytic Leukemia 0.041761741 1/4 55/9703
23 Non-alcoholic Fatty Liver Disease 0.048416902 1/4 70/9703
35 Nonalcoholic Steatohepatitis 0.048416902 1/4 70/9703Gene sets curated by Macarthur Lab
output <- output[order(-output$pve_g),]
top_tissues <- output$weight[1:5]

gene_set_dir <- "/project2/mstephens/wcrouse/gene_sets/"
gene_set_files <- c("gwascatalog.tsv",
                    "mgi_essential.tsv",
                    "core_essentials_hart.tsv",
                    "clinvar_path_likelypath.tsv",
                    "fda_approved_drug_targets.tsv")

for (tissue in top_tissues){
  cat(paste0(tissue, "\n\n"))

  ctwas_genes_tissue <- df[[tissue]]$ctwas
  background_tissue <- df[[tissue]]$gene_pips$genename

  cat(paste0("Number of cTWAS Genes in Tissue: ", length(ctwas_genes_tissue), "\n\n"))

  gene_sets <- lapply(gene_set_files, function(x){as.character(read.table(paste0(gene_set_dir, x))[,1])})
  names(gene_sets) <- sapply(gene_set_files, function(x){unlist(strsplit(x, "[.]"))[1]})

  gene_lists <- list(ctwas_genes_tissue=ctwas_genes_tissue)

  #genes in gene_sets filtered to ensure inclusion in background
  gene_sets <- lapply(gene_sets, function(x){x[x %in% background_tissue]})

  ##########
  hyp_score <- data.frame()
  size <- c()
  ngenes <- c()

  for (i in 1:length(gene_sets)) {
    for (j in 1:length(gene_lists)){
      group1 <- length(gene_sets[[i]])
      group2 <- length(as.vector(gene_lists[[j]]))
      size <- c(size, group1)
      Overlap <- length(intersect(gene_sets[[i]],as.vector(gene_lists[[j]])))
      ngenes <- c(ngenes, Overlap)
      Total <- length(background_tissue)
      hyp_score[i,j] <- phyper(Overlap-1, group2, Total-group2, group1,lower.tail=F)
    }
  }
  rownames(hyp_score) <- names(gene_sets)
  colnames(hyp_score) <- names(gene_lists)

  hyp_score_padj <- apply(hyp_score,2, p.adjust, method="BH", n=(nrow(hyp_score)*ncol(hyp_score)))
  hyp_score_padj <- as.data.frame(hyp_score_padj)
  hyp_score_padj$gene_set <- rownames(hyp_score_padj)
  hyp_score_padj$nset <- size
  hyp_score_padj$ngenes <- ngenes
  hyp_score_padj$percent <- ngenes/size

  hyp_score_padj <- hyp_score_padj[order(hyp_score_padj$ctwas_genes),]
  colnames(hyp_score_padj)[1] <- "padj"
  hyp_score_padj <- hyp_score_padj[,c(2:5,1)]
  rownames(hyp_score_padj)<- NULL

  print(hyp_score_padj)

  cat("\n")
}
Skin_Not_Sun_Exposed_Suprapubic
Number of cTWAS Genes in Tissue: 7
gene_set nset ngenes percent padj
1 gwascatalog 3935 3 0.0007623888 1
2 mgi_essential 1461 2 0.0013689254 1
3 core_essentials_hart 172 0 0.0000000000 1
4 clinvar_path_likelypath 1832 1 0.0005458515 1
5 fda_approved_drug_targets 207 0 0.0000000000 1
Colon_Transverse
Number of cTWAS Genes in Tissue: 10
gene_set nset ngenes percent padj
1 gwascatalog 3741 7 0.001871157 0.1331123
2 clinvar_path_likelypath 1762 4 0.002270148 0.1705429
3 mgi_essential 1374 2 0.001455604 0.6283044
4 core_essentials_hart 178 0 0.000000000 1.0000000
5 fda_approved_drug_targets 197 0 0.000000000 1.0000000
Esophagus_Muscularis
Number of cTWAS Genes in Tissue: 6
gene_set nset ngenes percent padj
1 gwascatalog 3889 5 0.0012856776 0.1192966
2 fda_approved_drug_targets 194 1 0.0051546392 0.2543569
3 clinvar_path_likelypath 1783 2 0.0011217050 0.4234150
4 mgi_essential 1412 1 0.0007082153 0.7042288
5 core_essentials_hart 175 0 0.0000000000 1.0000000
Prostate
Number of cTWAS Genes in Tissue: 7
gene_set nset ngenes percent padj
1 gwascatalog 3587 5 0.001393922 0.2805367
2 mgi_essential 1250 0 0.000000000 1.0000000
3 core_essentials_hart 168 0 0.000000000 1.0000000
4 clinvar_path_likelypath 1667 0 0.000000000 1.0000000
5 fda_approved_drug_targets 192 0 0.000000000 1.0000000
Adipose_Subcutaneous
Number of cTWAS Genes in Tissue: 5
gene_set nset ngenes percent padj
1 gwascatalog 3851 4 0.001038691 0.2756418
2 mgi_essential 1405 2 0.001423488 0.3158545
3 clinvar_path_likelypath 1785 2 0.001120448 0.3158545
4 core_essentials_hart 172 0 0.000000000 1.0000000
5 fda_approved_drug_targets 205 0 0.000000000 1.0000000Summary of results across tissues
weight_groups <- as.data.frame(matrix(c("Adipose_Subcutaneous", "Adipose",
                                        "Adipose_Visceral_Omentum", "Adipose",
                                        "Adrenal_Gland", "Endocrine",
                                        "Artery_Aorta", "Cardiovascular",
                                        "Artery_Coronary", "Cardiovascular",
                                        "Artery_Tibial", "Cardiovascular",
                                        "Brain_Amygdala", "CNS",
                                        "Brain_Anterior_cingulate_cortex_BA24", "CNS",
                                        "Brain_Caudate_basal_ganglia", "CNS",
                                        "Brain_Cerebellar_Hemisphere", "CNS",
                                        "Brain_Cerebellum", "CNS",
                                        "Brain_Cortex", "CNS",
                                        "Brain_Frontal_Cortex_BA9", "CNS",
                                        "Brain_Hippocampus", "CNS",
                                        "Brain_Hypothalamus", "CNS",
                                        "Brain_Nucleus_accumbens_basal_ganglia", "CNS",
                                        "Brain_Putamen_basal_ganglia", "CNS",
                                        "Brain_Spinal_cord_cervical_c-1", "CNS",
                                        "Brain_Substantia_nigra", "CNS",
                                        "Breast_Mammary_Tissue", "None",
                                        "Cells_Cultured_fibroblasts", "Skin",
                                        "Cells_EBV-transformed_lymphocytes", "Blood or Immune",
                                        "Colon_Sigmoid", "Digestive",
                                        "Colon_Transverse", "Digestive",
                                        "Esophagus_Gastroesophageal_Junction", "Digestive",
                                        "Esophagus_Mucosa", "Digestive",
                                        "Esophagus_Muscularis", "Digestive",
                                        "Heart_Atrial_Appendage", "Cardiovascular",
                                        "Heart_Left_Ventricle", "Cardiovascular",
                                        "Kidney_Cortex", "None",
                                        "Liver", "None",
                                        "Lung", "None",
                                        "Minor_Salivary_Gland", "None",
                                        "Muscle_Skeletal", "None",
                                        "Nerve_Tibial", "None",
                                        "Ovary", "None",
                                        "Pancreas", "None",
                                        "Pituitary", "Endocrine",
                                        "Prostate", "None",
                                        "Skin_Not_Sun_Exposed_Suprapubic", "Skin",
                                        "Skin_Sun_Exposed_Lower_leg", "Skin",
                                        "Small_Intestine_Terminal_Ileum", "Digestive",
                                        "Spleen", "Blood or Immune",
                                        "Stomach", "Digestive",
                                        "Testis", "Endocrine",
                                        "Thyroid", "Endocrine",
                                        "Uterus", "None",
                                        "Vagina", "None",
                                        "Whole_Blood", "Blood or Immune"),
                                      nrow=49, ncol=2, byrow=T), stringsAsFactors=F)
colnames(weight_groups) <- c("weight", "group")

#display tissue groups
print(weight_groups)
weight group
1 Adipose_Subcutaneous Adipose
2 Adipose_Visceral_Omentum Adipose
3 Adrenal_Gland Endocrine
4 Artery_Aorta Cardiovascular
5 Artery_Coronary Cardiovascular
6 Artery_Tibial Cardiovascular
7 Brain_Amygdala CNS
8 Brain_Anterior_cingulate_cortex_BA24 CNS
9 Brain_Caudate_basal_ganglia CNS
10 Brain_Cerebellar_Hemisphere CNS
11 Brain_Cerebellum CNS
12 Brain_Cortex CNS
13 Brain_Frontal_Cortex_BA9 CNS
14 Brain_Hippocampus CNS
15 Brain_Hypothalamus CNS
16 Brain_Nucleus_accumbens_basal_ganglia CNS
17 Brain_Putamen_basal_ganglia CNS
18 Brain_Spinal_cord_cervical_c-1 CNS
19 Brain_Substantia_nigra CNS
20 Breast_Mammary_Tissue None
21 Cells_Cultured_fibroblasts Skin
22 Cells_EBV-transformed_lymphocytes Blood or Immune
23 Colon_Sigmoid Digestive
24 Colon_Transverse Digestive
25 Esophagus_Gastroesophageal_Junction Digestive
26 Esophagus_Mucosa Digestive
27 Esophagus_Muscularis Digestive
28 Heart_Atrial_Appendage Cardiovascular
29 Heart_Left_Ventricle Cardiovascular
30 Kidney_Cortex None
31 Liver None
32 Lung None
33 Minor_Salivary_Gland None
34 Muscle_Skeletal None
35 Nerve_Tibial None
36 Ovary None
37 Pancreas None
38 Pituitary Endocrine
39 Prostate None
40 Skin_Not_Sun_Exposed_Suprapubic Skin
41 Skin_Sun_Exposed_Lower_leg Skin
42 Small_Intestine_Terminal_Ileum Digestive
43 Spleen Blood or Immune
44 Stomach Digestive
45 Testis Endocrine
46 Thyroid Endocrine
47 Uterus None
48 Vagina None
49 Whole_Blood Blood or Immunegroups <- unique(weight_groups$group)
df_group <- list()
for (i in 1:length(groups)){
group <- groups[i]
weights <- weight_groups$weight[weight_groups$group==group]
df_group[[group]] <- list(ctwas=unique(unlist(lapply(df[weights], function(x){x$ctwas}))),
background=unique(unlist(lapply(df[weights], function(x){x$gene_pips$genename}))))
}
output <- output[sapply(weight_groups$weight, match, output$weight),,drop=F]
output$group <- weight_groups$group
output$n_ctwas_group <- sapply(output$group, function(x){length(df_group[[x]][["ctwas"]])})
output$n_ctwas_group[output$group=="None"] <- 0
#barplot of number of cTWAS genes in each tissue
output <- output[order(-output$n_ctwas),,drop=F]
par(mar=c(10.1, 4.1, 4.1, 2.1))
barplot(output$n_ctwas, names.arg=output$weight, las=2, ylab="Number of cTWAS Genes", cex.names=0.6, main="Number of cTWAS Genes by Tissue")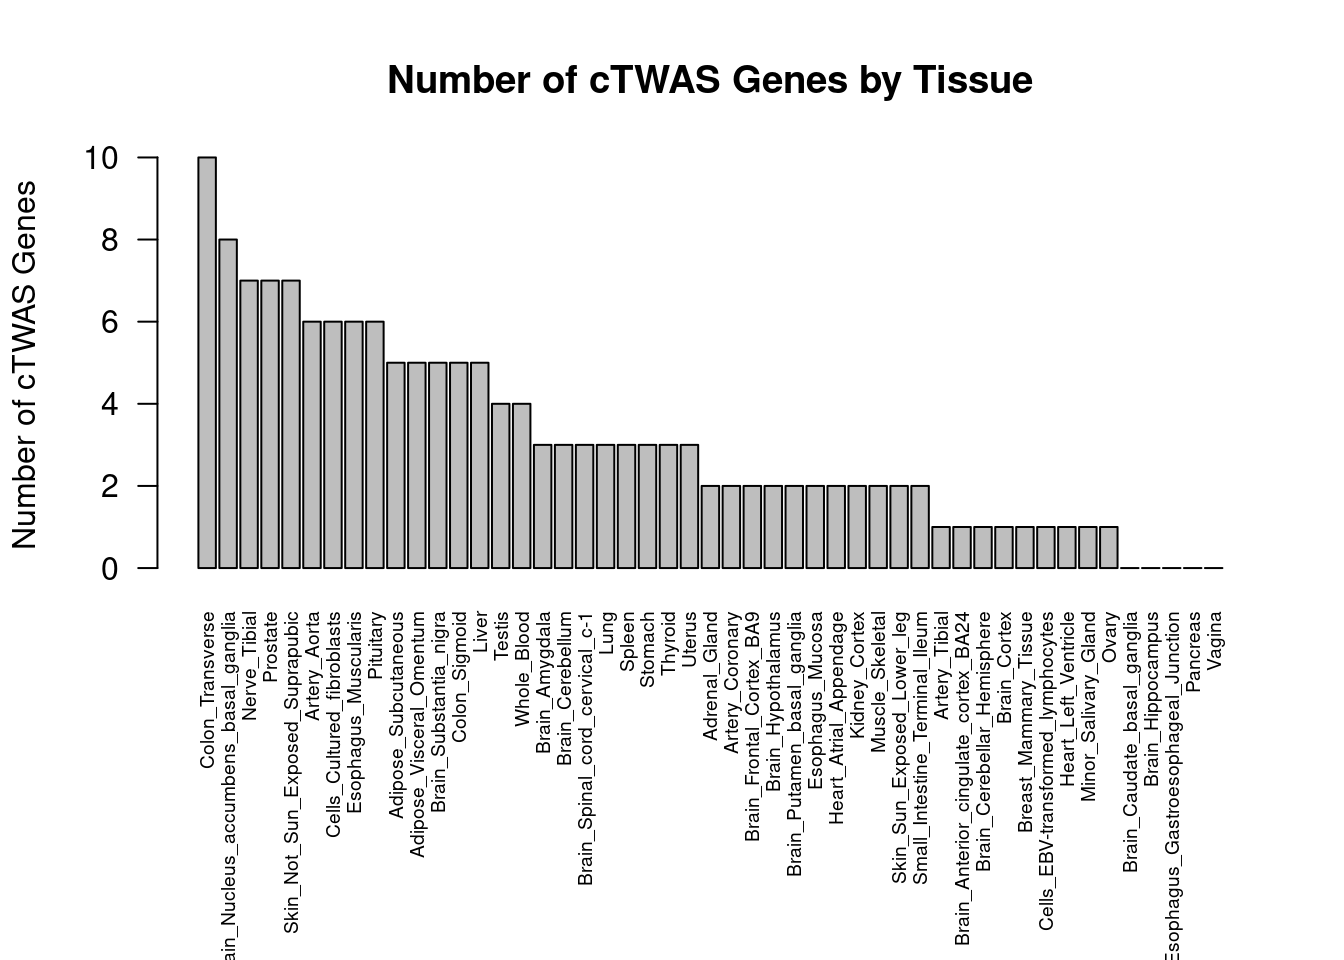
| Version | Author | Date |
|---|---|---|
| 0136d2e | wesleycrouse | 2022-06-10 |
#barplot of number of cTWAS genes in each tissue
df_plot <- -sort(-sapply(groups[groups!="None"], function(x){length(df_group[[x]][["ctwas"]])}))

par(mar=c(10.1, 4.1, 4.1, 2.1))
barplot(df_plot, las=2, ylab="Number of cTWAS Genes", main="Number of cTWAS Genes by Tissue Group")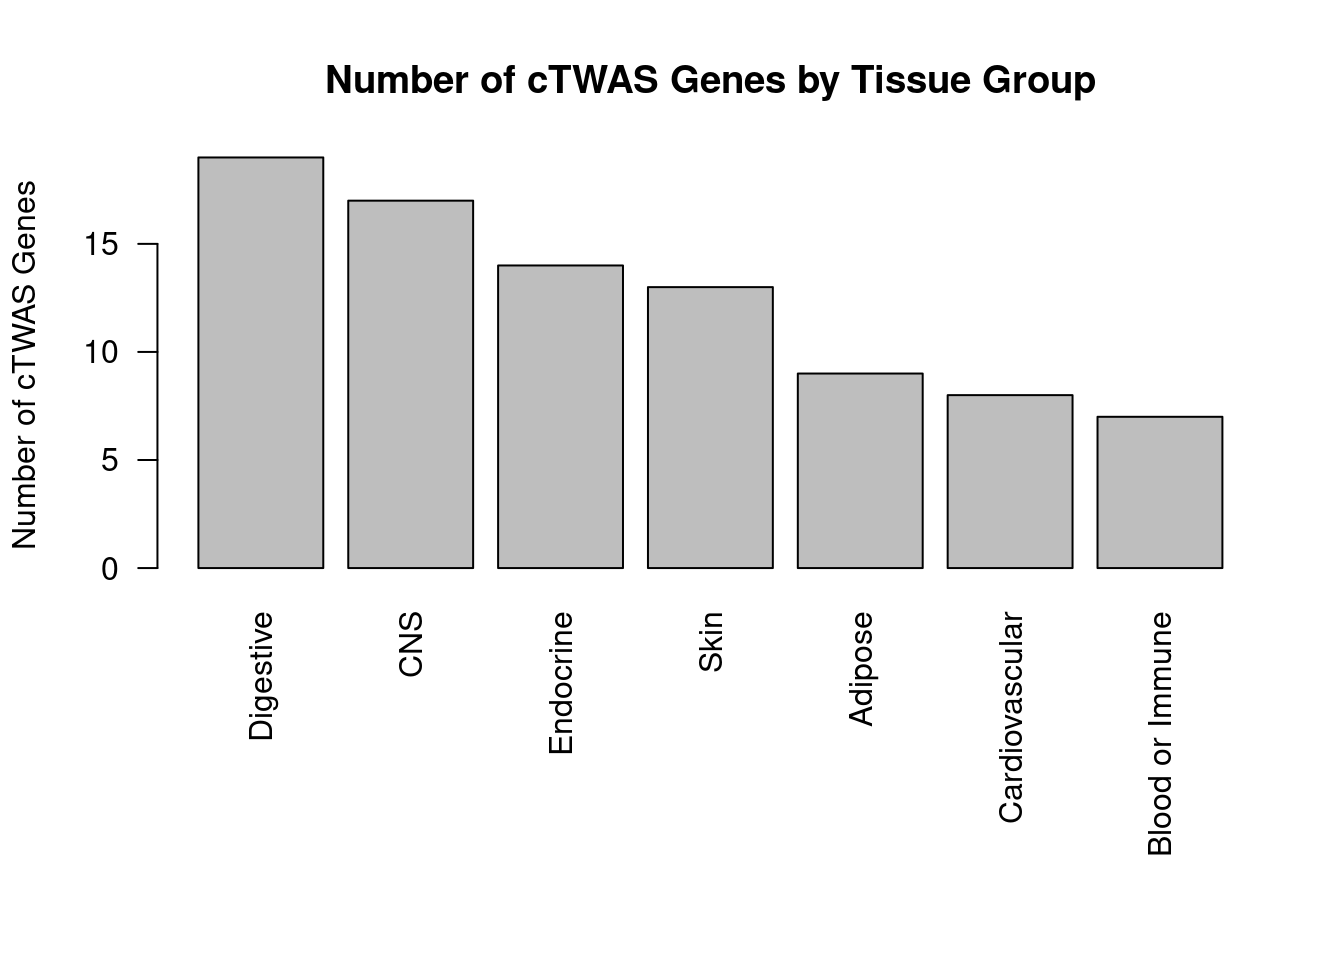
| Version | Author | Date |
|---|---|---|
| 0136d2e | wesleycrouse | 2022-06-10 |
Enrichment analysis for cTWAS genes in each tissue group
GO
suppressWarnings(rm(group_enrichment_results))

for (group in names(df_group)){
  cat(paste0(group, "\n\n"))

  ctwas_genes_group <- df_group[[group]]$ctwas

  cat(paste0("Number of cTWAS Genes in Tissue Group: ", length(ctwas_genes_group), "\n\n"))

  dbs <- c("GO_Biological_Process_2021")
  GO_enrichment <- enrichr(ctwas_genes_group, dbs)

  for (db in dbs){
    cat(paste0("\n", db, "\n\n"))
    enrich_results <- GO_enrichment[[db]]
    enrich_results <- enrich_results[enrich_results$Adjusted.P.value<0.05,c("Term", "Overlap", "Adjusted.P.value", "Genes")]
    print(enrich_results)
    print(plotEnrich(GO_enrichment[[db]]))

    if (nrow(enrich_results)>0){
      if (!exists("group_enrichment_results")){
        group_enrichment_results <- cbind(group, db, enrich_results)
      } else {
        group_enrichment_results <- rbind(group_enrichment_results, cbind(group, db, enrich_results))
      }
    }
  }

}
Adipose
Number of cTWAS Genes in Tissue Group: 9
Uploading data to Enrichr... Done.
Querying GO_Biological_Process_2021... Done.
Parsing results... Done.
GO_Biological_Process_2021
Term Overlap Adjusted.P.value Genes
1 positive regulation of cytokine production (GO:0001819) 3/335 0.03197247 CARD9;PRKD2;TNFRSF14
2 positive regulation of NF-kappaB transcription factor activity (GO:0051092) 2/155 0.03197247 CARD9;PRKD2
3 positive regulation of fibroblast growth factor receptor signaling pathway (GO:0045743) 1/5 0.03197247 PRKD2
4 positive regulation of endothelial cell chemotaxis by VEGF-activated vascular endothelial growth factor receptor signaling pathway (GO:0038033) 1/5 0.03197247 PRKD2
5 negative regulation of adaptive immune response (GO:0002820) 1/5 0.03197247 TNFRSF14
6 positive regulation of ERK1 and ERK2 cascade (GO:0070374) 2/172 0.03197247 CARD9;PRKD2
7 morphogenesis of an endothelium (GO:0003159) 1/6 0.03197247 PRKD2
8 positive regulation of deacetylase activity (GO:0090045) 1/6 0.03197247 PRKD2
9 regulation of histone deacetylase activity (GO:1901725) 1/7 0.03197247 PRKD2
10 positive regulation of cell migration by vascular endothelial growth factor signaling pathway (GO:0038089) 1/8 0.03197247 PRKD2
11 regulation of alpha-beta T cell proliferation (GO:0046640) 1/8 0.03197247 TNFRSF14
12 myeloid leukocyte mediated immunity (GO:0002444) 1/8 0.03197247 CARD9
13 negative regulation of alpha-beta T cell activation (GO:0046636) 1/9 0.03197247 TNFRSF14
14 positive regulation of vascular endothelial growth factor receptor signaling pathway (GO:0030949) 1/10 0.03197247 PRKD2
15 regulation of T-helper 17 type immune response (GO:2000316) 1/10 0.03197247 CARD9
16 immunoglobulin mediated immune response (GO:0016064) 1/10 0.03197247 CARD9
17 endothelial tube morphogenesis (GO:0061154) 1/10 0.03197247 PRKD2
18 negative regulation of alpha-beta T cell proliferation (GO:0046642) 1/10 0.03197247 TNFRSF14
19 regulation of ERK1 and ERK2 cascade (GO:0070372) 2/238 0.03197247 CARD9;PRKD2
20 B cell mediated immunity (GO:0019724) 1/11 0.03197247 CARD9
21 positive regulation of DNA-binding transcription factor activity (GO:0051091) 2/246 0.03197247 CARD9;PRKD2
22 positive regulation of T-helper 17 type immune response (GO:2000318) 1/12 0.03197247 CARD9
23 positive regulation of adaptive immune response based on somatic recombination of immune receptors built from immunoglobulin superfamily domains (GO:0002824) 1/13 0.03197247 CARD9
24 positive regulation of histone deacetylation (GO:0031065) 1/13 0.03197247 PRKD2
25 homeostasis of number of cells (GO:0048872) 1/13 0.03197247 CARD9
26 antifungal innate immune response (GO:0061760) 1/13 0.03197247 CARD9
27 positive regulation of T cell receptor signaling pathway (GO:0050862) 1/14 0.03197247 PRKD2
28 positive regulation of granulocyte macrophage colony-stimulating factor production (GO:0032725) 1/14 0.03197247 CARD9
29 positive regulation of lymphocyte migration (GO:2000403) 1/14 0.03197247 TNFRSF14
30 positive regulation of MAPK cascade (GO:0043410) 2/274 0.03197247 CARD9;PRKD2
31 regulation of endothelial cell chemotaxis (GO:2001026) 1/15 0.03197247 PRKD2
32 positive regulation of endothelial cell chemotaxis (GO:2001028) 1/15 0.03197247 PRKD2
33 regulation of granulocyte macrophage colony-stimulating factor production (GO:0032645) 1/16 0.03306391 CARD9
34 embryo development ending in birth or egg hatching (GO:0009792) 1/17 0.03311634 NR5A2
35 positive regulation of cytokine production involved in inflammatory response (GO:1900017) 1/17 0.03311634 CARD9
36 positive regulation of CREB transcription factor activity (GO:0032793) 1/18 0.03316237 PRKD2
37 positive regulation of stress-activated protein kinase signaling cascade (GO:0070304) 1/18 0.03316237 CARD9
38 regulation of fibroblast growth factor receptor signaling pathway (GO:0040036) 1/20 0.03494353 PRKD2
39 regulation of T cell migration (GO:2000404) 1/20 0.03494353 TNFRSF14
40 positive regulation of antigen receptor-mediated signaling pathway (GO:0050857) 1/21 0.03576629 PRKD2
41 positive regulation of interleukin-17 production (GO:0032740) 1/23 0.03713753 CARD9
42 defense response to fungus (GO:0050832) 1/24 0.03713753 CARD9
43 regulation of cytokine production involved in immune response (GO:0002718) 1/24 0.03713753 TNFRSF14
44 regulation of vascular endothelial growth factor receptor signaling pathway (GO:0030947) 1/24 0.03713753 PRKD2
45 positive regulation of T cell migration (GO:2000406) 1/25 0.03745122 TNFRSF14
46 positive regulation of protein phosphorylation (GO:0001934) 2/371 0.03745122 PRKD2;TNFRSF14
47 positive regulation of interleukin-2 production (GO:0032743) 1/26 0.03764926 PRKD2
48 positive regulation of viral genome replication (GO:0045070) 1/29 0.04025527 NR5A2
49 regulation of DNA biosynthetic process (GO:2000278) 1/29 0.04025527 PRKD2
50 modulation by host of symbiont process (GO:0051851) 1/32 0.04171513 CARD9
51 regulation of interleukin-17 production (GO:0032660) 1/33 0.04171513 CARD9
52 positive regulation of cytokine production involved in immune response (GO:0002720) 1/33 0.04171513 TNFRSF14
53 regulation of nucleic acid-templated transcription (GO:1903506) 2/430 0.04171513 NR5A2;ZNF736
54 epithelial tube morphogenesis (GO:0060562) 1/34 0.04171513 PRKD2
55 cellular response to vascular endothelial growth factor stimulus (GO:0035924) 1/34 0.04171513 PRKD2
56 negative regulation of T cell proliferation (GO:0042130) 1/35 0.04171513 TNFRSF14
57 regulation of T cell receptor signaling pathway (GO:0050856) 1/35 0.04171513 PRKD2
58 positive regulation of potassium ion transport (GO:0043268) 1/38 0.04372923 GABBR1
59 positive regulation of production of molecular mediator of immune response (GO:0002702) 1/38 0.04372923 TNFRSF14
60 regulation of cellular macromolecule biosynthetic process (GO:2000112) 2/468 0.04468871 NR5A2;ZNF736
61 positive regulation of cation transmembrane transport (GO:1904064) 1/41 0.04560727 GABBR1
62 regulation of cytokine production involved in inflammatory response (GO:1900015) 1/43 0.04704174 CARD9
63 positive regulation of potassium ion transmembrane transport (GO:1901381) 1/44 0.04736222 GABBR1
64 positive regulation of chemotaxis (GO:0050921) 1/45 0.04767226 PRKD2
65 positive regulation of blood vessel endothelial cell migration (GO:0043536) 1/48 0.04881728 PRKD2
66 regulation of interleukin-2 production (GO:0032663) 1/48 0.04881728 PRKD2
67 regulation of stress-activated MAPK cascade (GO:0032872) 1/49 0.04881728 CARD9
68 cellular defense response (GO:0006968) 1/49 0.04881728 LSP1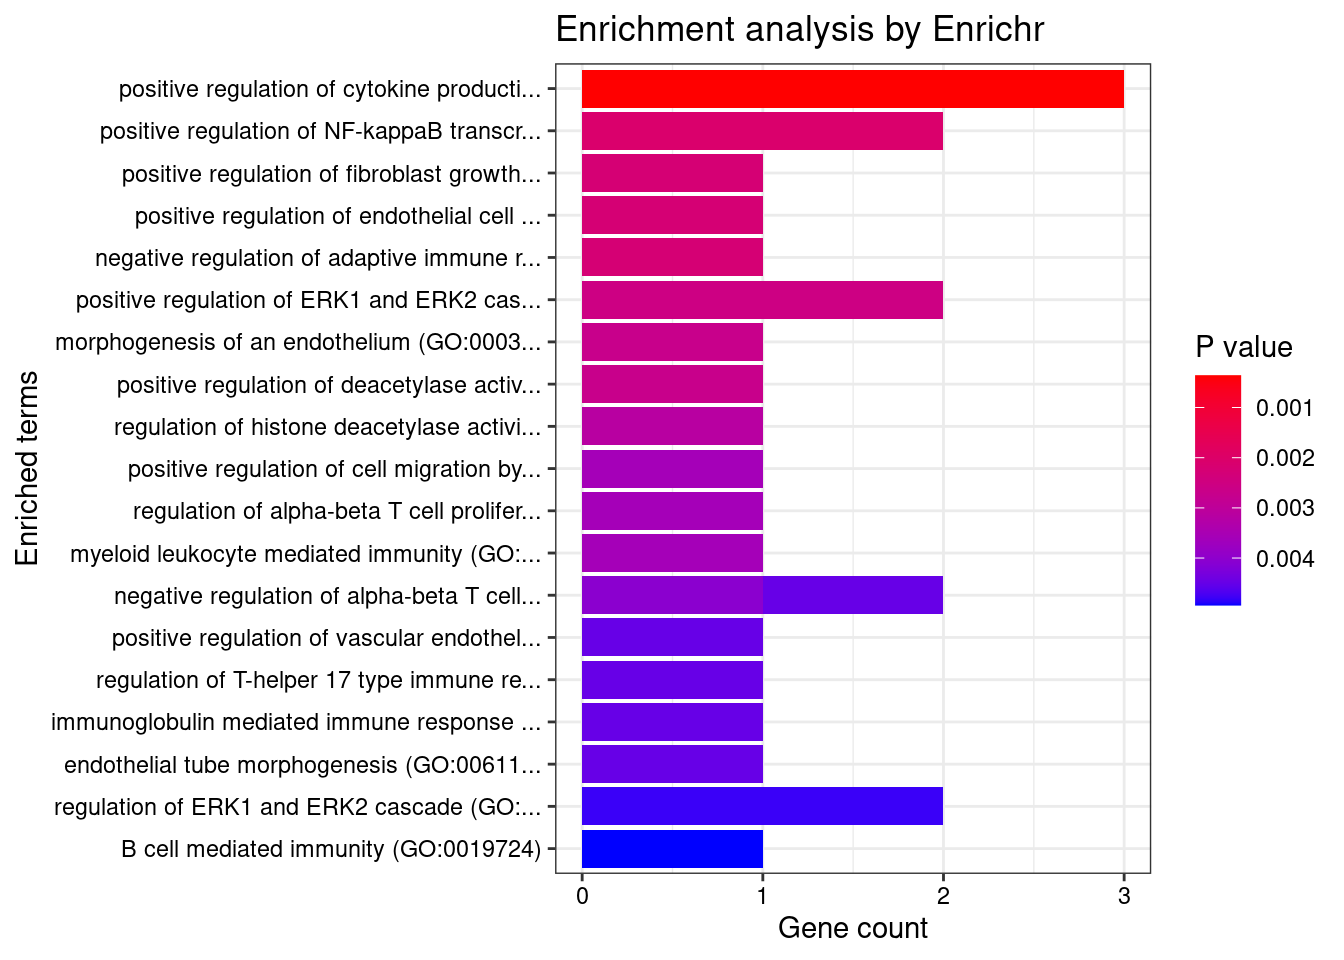
| Version | Author | Date |
|---|---|---|
| 0136d2e | wesleycrouse | 2022-06-10 |
Endocrine
Number of cTWAS Genes in Tissue Group: 14
Uploading data to Enrichr... Done.
Querying GO_Biological_Process_2021... Done.
Parsing results... Done.
GO_Biological_Process_2021
Term Overlap Adjusted.P.value Genes
1 positive regulation of lymphocyte migration (GO:2000403) 2/14 0.005321482 CCL20;TNFRSF14
2 cytokine-mediated signaling pathway (GO:0019221) 5/621 0.005321482 MUC1;TNFSF15;CCL20;TNFRSF14;CXCL5
3 positive regulation of cysteine-type endopeptidase activity involved in apoptotic process (GO:0043280) 3/119 0.005321482 SMAD3;TNFSF15;CARD9
4 regulation of T cell migration (GO:2000404) 2/20 0.005321482 CCL20;TNFRSF14
5 positive regulation of T cell migration (GO:2000406) 2/25 0.006708467 CCL20;TNFRSF14
6 cellular response to tumor necrosis factor (GO:0071356) 3/194 0.012495520 TNFSF15;CCL20;TNFRSF14
7 positive regulation of DNA-binding transcription factor activity (GO:0051091) 3/246 0.021258073 SMAD3;PRKCB;CARD9
8 chemokine-mediated signaling pathway (GO:0070098) 2/56 0.021258073 CCL20;CXCL5
9 cellular response to chemokine (GO:1990869) 2/60 0.021683517 CCL20;CXCL5
10 neutrophil chemotaxis (GO:0030593) 2/70 0.026204483 CCL20;CXCL5
11 granulocyte chemotaxis (GO:0071621) 2/73 0.026204483 CCL20;CXCL5
12 neutrophil migration (GO:1990266) 2/77 0.026701880 CCL20;CXCL5
13 activation of cysteine-type endopeptidase activity involved in apoptotic process (GO:0006919) 2/81 0.027249360 SMAD3;TNFSF15
14 cellular response to lectin (GO:1990858) 2/115 0.037628467 MUC1;CARD9
15 stimulatory C-type lectin receptor signaling pathway (GO:0002223) 2/115 0.037628467 MUC1;CARD9
16 tumor necrosis factor-mediated signaling pathway (GO:0033209) 2/116 0.037628467 TNFSF15;TNFRSF14
17 innate immune response activating cell surface receptor signaling pathway (GO:0002220) 2/119 0.037628467 MUC1;CARD9
18 histone-threonine phosphorylation (GO:0035405) 1/5 0.037628467 PRKCB
19 negative regulation of adaptive immune response (GO:0002820) 1/5 0.037628467 TNFRSF14
20 cellular response to cytokine stimulus (GO:0071345) 3/482 0.037628467 MUC1;SMAD3;CCL20
21 negative regulation of cytosolic calcium ion concentration (GO:0051481) 1/6 0.037628467 SMAD3
22 regulation of extracellular matrix assembly (GO:1901201) 1/7 0.037628467 SMAD3
23 SMAD protein complex assembly (GO:0007183) 1/7 0.037628467 SMAD3
24 positive regulation of B cell receptor signaling pathway (GO:0050861) 1/7 0.037628467 PRKCB
25 regulation of transforming growth factor beta2 production (GO:0032909) 1/7 0.037628467 SMAD3
26 nodal signaling pathway (GO:0038092) 1/7 0.037628467 SMAD3
27 positive regulation of histone H4 acetylation (GO:0090240) 1/7 0.037628467 MUC1
28 positive regulation of NF-kappaB transcription factor activity (GO:0051092) 2/155 0.037628467 PRKCB;CARD9
29 regulation of alpha-beta T cell proliferation (GO:0046640) 1/8 0.037628467 TNFRSF14
30 myeloid leukocyte mediated immunity (GO:0002444) 1/8 0.037628467 CARD9
31 positive regulation of I-kappaB kinase/NF-kappaB signaling (GO:0043123) 2/171 0.037628467 PRKCB;CARD9
32 positive regulation of ERK1 and ERK2 cascade (GO:0070374) 2/172 0.037628467 CCL20;CARD9
33 regulation of histone H4 acetylation (GO:0090239) 1/9 0.037628467 MUC1
34 positive regulation of extracellular matrix assembly (GO:1901203) 1/9 0.037628467 SMAD3
35 regulation of DNA-templated transcription in response to stress (GO:0043620) 1/9 0.037628467 MUC1
36 negative regulation of alpha-beta T cell activation (GO:0046636) 1/9 0.037628467 TNFRSF14
37 negative regulation of cell adhesion mediated by integrin (GO:0033629) 1/10 0.037628467 MUC1
38 negative regulation of transcription by competitive promoter binding (GO:0010944) 1/10 0.037628467 MUC1
39 negative regulation of transmembrane transport (GO:0034763) 1/10 0.037628467 PRKCB
40 lipoprotein transport (GO:0042953) 1/10 0.037628467 PRKCB
41 regulation of T-helper 17 type immune response (GO:2000316) 1/10 0.037628467 CARD9
42 positive regulation of vascular endothelial growth factor receptor signaling pathway (GO:0030949) 1/10 0.037628467 PRKCB
43 DNA damage response, signal transduction by p53 class mediator resulting in transcription of p21 class mediator (GO:0006978) 1/10 0.037628467 MUC1
44 primary miRNA processing (GO:0031053) 1/10 0.037628467 SMAD3
45 immunoglobulin mediated immune response (GO:0016064) 1/10 0.037628467 CARD9
46 negative regulation of alpha-beta T cell proliferation (GO:0046642) 1/10 0.037628467 TNFRSF14
47 lipoprotein localization (GO:0044872) 1/11 0.038844548 PRKCB
48 B cell mediated immunity (GO:0019724) 1/11 0.038844548 CARD9
49 DNA damage response, signal transduction resulting in transcription (GO:0042772) 1/11 0.038844548 MUC1
50 regulation of hemopoiesis (GO:1903706) 1/12 0.039164983 PRKCB
51 negative regulation of glucose transmembrane transport (GO:0010829) 1/12 0.039164983 PRKCB
52 positive regulation of T-helper 17 type immune response (GO:2000318) 1/12 0.039164983 CARD9
53 mitotic nuclear membrane disassembly (GO:0007077) 1/12 0.039164983 PRKCB
54 positive regulation of adaptive immune response based on somatic recombination of immune receptors built from immunoglobulin superfamily domains (GO:0002824) 1/13 0.039438479 CARD9
55 antifungal innate immune response (GO:0061760) 1/13 0.039438479 CARD9
56 negative regulation of intrinsic apoptotic signaling pathway in response to DNA damage by p53 class mediator (GO:1902166) 1/13 0.039438479 MUC1
57 homeostasis of number of cells (GO:0048872) 1/13 0.039438479 CARD9
58 quinone biosynthetic process (GO:1901663) 1/14 0.039674270 COQ8A
59 regulation of intrinsic apoptotic signaling pathway in response to DNA damage by p53 class mediator (GO:1902165) 1/14 0.039674270 MUC1
60 nuclear membrane disassembly (GO:0051081) 1/14 0.039674270 PRKCB
61 positive regulation of granulocyte macrophage colony-stimulating factor production (GO:0032725) 1/14 0.039674270 CARD9
62 regulation of I-kappaB kinase/NF-kappaB signaling (GO:0043122) 2/224 0.040502434 PRKCB;CARD9
63 ubiquinone biosynthetic process (GO:0006744) 1/15 0.040502434 COQ8A
64 ubiquinone metabolic process (GO:0006743) 1/15 0.040502434 COQ8A
65 inflammatory response (GO:0006954) 2/230 0.041254764 CCL20;CXCL5
66 activation of NF-kappaB-inducing kinase activity (GO:0007250) 1/16 0.041254764 TNFSF15
67 regulation of granulocyte macrophage colony-stimulating factor production (GO:0032645) 1/16 0.041254764 CARD9
68 regulation of ERK1 and ERK2 cascade (GO:0070372) 2/238 0.041941011 CCL20;CARD9
69 positive regulation of cytokine production involved in inflammatory response (GO:1900017) 1/17 0.041941011 CARD9
70 negative regulation of intrinsic apoptotic signaling pathway by p53 class mediator (GO:1902254) 1/17 0.041941011 MUC1
71 T cell migration (GO:0072678) 1/18 0.041994063 CCL20
72 regulation of transforming growth factor beta production (GO:0071634) 1/18 0.041994063 SMAD3
73 positive regulation of stress-activated protein kinase signaling cascade (GO:0070304) 1/18 0.041994063 CARD9
74 positive regulation of extracellular matrix organization (GO:1903055) 1/18 0.041994063 SMAD3
75 activin receptor signaling pathway (GO:0032924) 1/19 0.043146564 SMAD3
76 regulation of glucose transmembrane transport (GO:0010827) 1/19 0.043146564 PRKCB
77 regulation of transcription by RNA polymerase II (GO:0006357) 5/2206 0.044583673 MUC1;SMAD3;PRKCB;MED16;NKX2-3
78 positive regulation of antigen receptor-mediated signaling pathway (GO:0050857) 1/21 0.045443485 PRKCB
79 calcium-mediated signaling using intracellular calcium source (GO:0035584) 1/21 0.045443485 CCL20
80 regulation of transcription, DNA-templated (GO:0006355) 5/2244 0.045443485 SMAD3;PRKCB;ZNF736;MED16;NKX2-3
81 positive regulation of MAPK cascade (GO:0043410) 2/274 0.045443485 CCL20;CARD9
82 positive regulation of DNA-templated transcription, initiation (GO:2000144) 1/22 0.045443485 MED16
83 regulation of B cell receptor signaling pathway (GO:0050855) 1/23 0.045443485 PRKCB
84 positive regulation of transcription initiation from RNA polymerase II promoter (GO:0060261) 1/23 0.045443485 MED16
85 positive regulation of histone acetylation (GO:0035066) 1/23 0.045443485 MUC1
86 positive regulation of interleukin-17 production (GO:0032740) 1/23 0.045443485 CARD9
87 regulation of vascular endothelial growth factor receptor signaling pathway (GO:0030947) 1/24 0.045443485 PRKCB
88 defense response to fungus (GO:0050832) 1/24 0.045443485 CARD9
89 positive regulation of transcription from RNA polymerase II promoter in response to stress (GO:0036003) 1/24 0.045443485 MUC1
90 regulation of cellular response to transforming growth factor beta stimulus (GO:1903844) 1/24 0.045443485 SMAD3
91 regulation of cytokine production involved in immune response (GO:0002718) 1/24 0.045443485 TNFRSF14
92 negative regulation of intrinsic apoptotic signaling pathway in response to DNA damage (GO:1902230) 1/26 0.048663750 MUC1
93 positive regulation of nitric oxide biosynthetic process (GO:0045429) 1/27 0.049444173 SMAD3
94 negative regulation of insulin receptor signaling pathway (GO:0046627) 1/27 0.049444173 PRKCB
95 positive regulation of nitric oxide metabolic process (GO:1904407) 1/28 0.049673488 SMAD3
96 negative regulation of cellular response to insulin stimulus (GO:1900077) 1/28 0.049673488 PRKCB
97 positive regulation of protein import into nucleus (GO:0042307) 1/28 0.049673488 SMAD3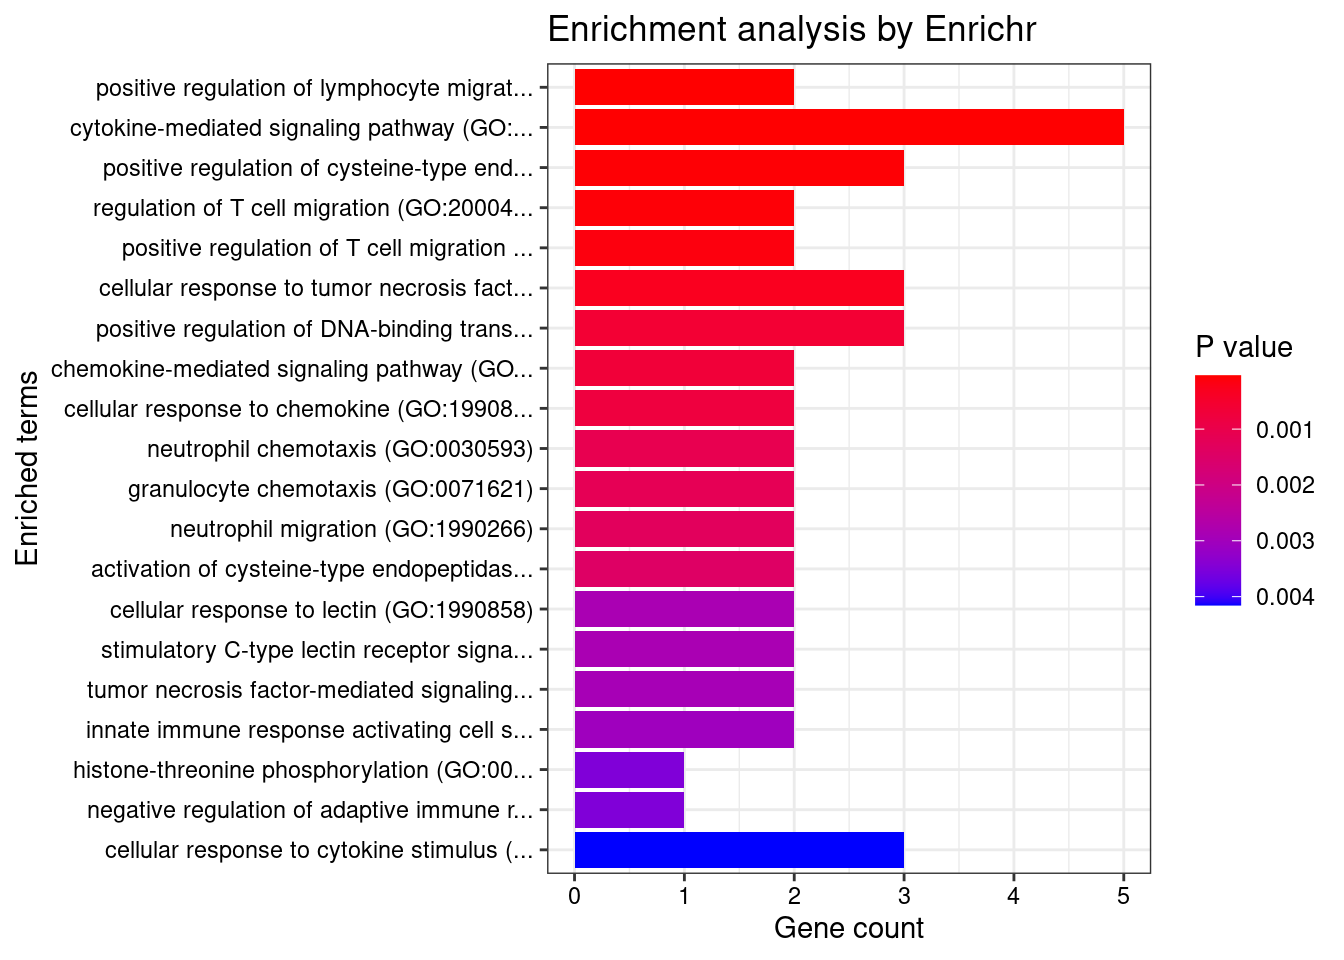
| Version | Author | Date |
|---|---|---|
| 0136d2e | wesleycrouse | 2022-06-10 |
Cardiovascular
Number of cTWAS Genes in Tissue Group: 8
Uploading data to Enrichr... Done.
Querying GO_Biological_Process_2021... Done.
Parsing results... Done.
GO_Biological_Process_2021
Term Overlap Adjusted.P.value Genes
1 positive regulation of T cell receptor signaling pathway (GO:0050862) 2/14 0.002160584 RAB29;PRKD2
2 positive regulation of antigen receptor-mediated signaling pathway (GO:0050857) 2/21 0.002489514 RAB29;PRKD2
3 regulation of T cell receptor signaling pathway (GO:0050856) 2/35 0.004689305 RAB29;PRKD2
4 positive regulation of fibroblast growth factor receptor signaling pathway (GO:0045743) 1/5 0.035732624 PRKD2
5 T cell extravasation (GO:0072683) 1/5 0.035732624 ITGAL
6 positive regulation of endothelial cell chemotaxis by VEGF-activated vascular endothelial growth factor receptor signaling pathway (GO:0038033) 1/5 0.035732624 PRKD2
7 regulation of immune response (GO:0050776) 2/179 0.035732624 ERAP1;ITGAL
8 response to peptidoglycan (GO:0032494) 1/6 0.035732624 IRF5
9 morphogenesis of an endothelium (GO:0003159) 1/6 0.035732624 PRKD2
10 positive regulation of deacetylase activity (GO:0090045) 1/6 0.035732624 PRKD2
11 protein localization to membrane (GO:0072657) 2/195 0.035732624 RAB29;ITGAL
12 regulation of histone deacetylase activity (GO:1901725) 1/7 0.035732624 PRKD2
13 protein localization to ciliary membrane (GO:1903441) 1/7 0.035732624 RAB29
14 positive regulation of cell migration by vascular endothelial growth factor signaling pathway (GO:0038089) 1/8 0.035732624 PRKD2
15 antigen processing and presentation of endogenous peptide antigen via MHC class I (GO:0019885) 1/8 0.035732624 ERAP1
16 positive regulation of vascular endothelial growth factor receptor signaling pathway (GO:0030949) 1/10 0.035732624 PRKD2
17 positive regulation of receptor recycling (GO:0001921) 1/10 0.035732624 RAB29
18 toxin transport (GO:1901998) 1/10 0.035732624 RAB29
19 endothelial tube morphogenesis (GO:0061154) 1/10 0.035732624 PRKD2
20 positive regulation of histone deacetylation (GO:0031065) 1/13 0.042006372 PRKD2
21 response to muramyl dipeptide (GO:0032495) 1/13 0.042006372 IRF5
22 antigen processing and presentation of endogenous peptide antigen (GO:0002483) 1/14 0.042395470 ERAP1
23 regulation of endothelial cell chemotaxis (GO:2001026) 1/15 0.042395470 PRKD2
24 positive regulation of endothelial cell chemotaxis (GO:2001028) 1/15 0.042395470 PRKD2
25 regulation of receptor recycling (GO:0001919) 1/17 0.045182354 RAB29
26 positive regulation of CREB transcription factor activity (GO:0032793) 1/18 0.045182354 PRKD2
27 positive regulation of cytokine production (GO:0001819) 2/335 0.045182354 IRF5;PRKD2
28 regulation of lymphocyte proliferation (GO:0050670) 1/19 0.045182354 LST1
29 regulation of fibroblast growth factor receptor signaling pathway (GO:0040036) 1/20 0.045182354 PRKD2
30 positive regulation of interferon-alpha production (GO:0032727) 1/20 0.045182354 IRF5
31 negative regulation of lymphocyte activation (GO:0051250) 1/22 0.046722470 LST1
32 membrane protein ectodomain proteolysis (GO:0006509) 1/23 0.046722470 ERAP1
33 regulation of vascular endothelial growth factor receptor signaling pathway (GO:0030947) 1/24 0.046722470 PRKD2
34 peptide catabolic process (GO:0043171) 1/25 0.046722470 ERAP1
35 regulation of interferon-alpha production (GO:0032647) 1/25 0.046722470 IRF5
36 positive regulation of interleukin-2 production (GO:0032743) 1/26 0.046722470 PRKD2
37 melanosome organization (GO:0032438) 1/27 0.046722470 RAB29
38 leukocyte cell-cell adhesion (GO:0007159) 1/28 0.046722470 ITGAL
39 receptor clustering (GO:0043113) 1/28 0.046722470 ITGAL
40 T cell activation involved in immune response (GO:0002286) 1/28 0.046722470 ITGAL
41 regulation of response to biotic stimulus (GO:0002831) 1/29 0.046722470 ERAP1
42 regulation of DNA biosynthetic process (GO:2000278) 1/29 0.046722470 PRKD2
43 regulation of intracellular protein transport (GO:0033157) 1/32 0.048785296 RAB29
44 antigen processing and presentation of peptide antigen via MHC class I (GO:0002474) 1/33 0.048785296 ERAP1
45 epithelial tube morphogenesis (GO:0060562) 1/34 0.048785296 PRKD2
46 cellular response to vascular endothelial growth factor stimulus (GO:0035924) 1/34 0.048785296 PRKD2
47 positive regulation of interleukin-12 production (GO:0032735) 1/34 0.048785296 IRF5
48 protein localization to cilium (GO:0061512) 1/35 0.048785296 RAB29
49 positive regulation of interferon-beta production (GO:0032728) 1/36 0.048785296 IRF5
50 positive regulation of signaling (GO:0023056) 1/38 0.048785296 RAB29
51 negative regulation of lymphocyte proliferation (GO:0050672) 1/39 0.048785296 LST1
52 response to peptide (GO:1901652) 1/39 0.048785296 IRF5
53 positive regulation of intracellular transport (GO:0032388) 1/39 0.048785296 RAB29
54 membrane protein proteolysis (GO:0033619) 1/39 0.048785296 ERAP1
55 response to organonitrogen compound (GO:0010243) 1/40 0.049117867 IRF5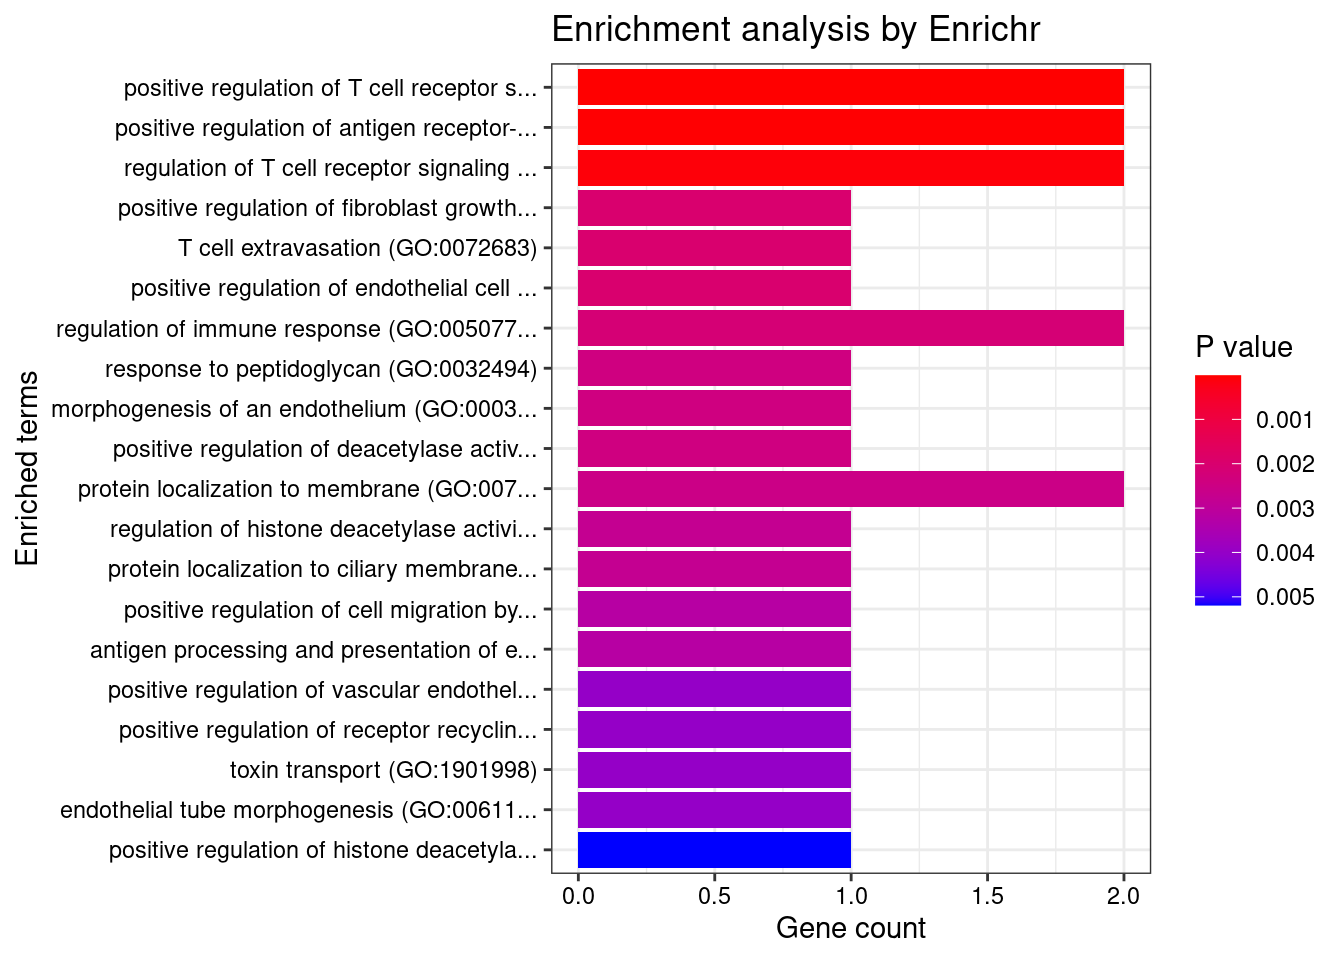
| Version | Author | Date |
|---|---|---|
| 0136d2e | wesleycrouse | 2022-06-10 |
CNS
Number of cTWAS Genes in Tissue Group: 17
Uploading data to Enrichr... Done.
Querying GO_Biological_Process_2021... Done.
Parsing results... Done.
GO_Biological_Process_2021
Term Overlap Adjusted.P.value Genes
1 positive regulation of antigen receptor-mediated signaling pathway (GO:0050857) 3/21 0.0001955384 PRKCB;RAB29;PRKD2
2 cytokine-mediated signaling pathway (GO:0019221) 6/621 0.0011756768 MUC1;TNFRSF6B;FCER1G;CCL20;CXCL5;IP6K2
3 neutrophil chemotaxis (GO:0030593) 3/70 0.0017405524 FCER1G;CCL20;CXCL5
4 positive regulation of vascular endothelial growth factor receptor signaling pathway (GO:0030949) 2/10 0.0017405524 PRKCB;PRKD2
5 granulocyte chemotaxis (GO:0071621) 3/73 0.0017405524 FCER1G;CCL20;CXCL5
6 neutrophil migration (GO:1990266) 3/77 0.0017405524 FCER1G;CCL20;CXCL5
7 positive regulation of T cell receptor signaling pathway (GO:0050862) 2/14 0.0025570609 RAB29;PRKD2
8 regulation of vascular endothelial growth factor receptor signaling pathway (GO:0030947) 2/24 0.0067522672 PRKCB;PRKD2
9 antigen processing and presentation of peptide antigen via MHC class I (GO:0002474) 2/33 0.0114306357 FCER1G;ERAP1
10 regulation of T cell receptor signaling pathway (GO:0050856) 2/35 0.0115814308 RAB29;PRKD2
11 chemokine-mediated signaling pathway (GO:0070098) 2/56 0.0269661766 CCL20;CXCL5
12 cellular response to chemokine (GO:1990869) 2/60 0.0283541132 CCL20;CXCL5
13 Fc-gamma receptor signaling pathway (GO:0038094) 2/72 0.0368286305 FCER1G;FCGR2A
14 Fc receptor mediated stimulatory signaling pathway (GO:0002431) 2/74 0.0368286305 FCER1G;FCGR2A
15 peptide metabolic process (GO:0006518) 2/83 0.0431130820 ERAP1;APEH
16 cellular response to oxygen-containing compound (GO:1901701) 3/323 0.0436287287 SLC26A3;CXCL5;IP6K2
17 positive regulation of vasculature development (GO:1904018) 2/102 0.0475431891 PRKCB;PRKD2
18 cellular response to lectin (GO:1990858) 2/115 0.0475431891 MUC1;FCER1G
19 stimulatory C-type lectin receptor signaling pathway (GO:0002223) 2/115 0.0475431891 MUC1;FCER1G
20 positive regulation of endothelial cell chemotaxis by VEGF-activated vascular endothelial growth factor receptor signaling pathway (GO:0038033) 1/5 0.0475431891 PRKD2
21 positive regulation of fibroblast growth factor receptor signaling pathway (GO:0045743) 1/5 0.0475431891 PRKD2
22 histone-threonine phosphorylation (GO:0035405) 1/5 0.0475431891 PRKCB
23 positive regulation of angiogenesis (GO:0045766) 2/116 0.0475431891 PRKCB;PRKD2
24 innate immune response activating cell surface receptor signaling pathway (GO:0002220) 2/119 0.0475431891 MUC1;FCER1G
25 positive regulation of deacetylase activity (GO:0090045) 1/6 0.0475431891 PRKD2
26 morphogenesis of an endothelium (GO:0003159) 1/6 0.0475431891 PRKD2
27 intracellular pH elevation (GO:0051454) 1/6 0.0475431891 SLC26A3
28 positive regulation of B cell receptor signaling pathway (GO:0050861) 1/7 0.0475431891 PRKCB
29 regulation of histone deacetylase activity (GO:1901725) 1/7 0.0475431891 PRKD2
30 positive regulation of histone H4 acetylation (GO:0090240) 1/7 0.0475431891 MUC1
31 cellular protein complex disassembly (GO:0043624) 1/7 0.0475431891 APEH
32 protein localization to ciliary membrane (GO:1903441) 1/7 0.0475431891 RAB29
33 positive regulation of cell migration by vascular endothelial growth factor signaling pathway (GO:0038089) 1/8 0.0475431891 PRKD2
34 antigen processing and presentation of endogenous peptide antigen via MHC class I (GO:0019885) 1/8 0.0475431891 ERAP1
35 neutrophil degranulation (GO:0043312) 3/481 0.0475431891 FCER1G;FCGR2A;APEH
36 neutrophil activation involved in immune response (GO:0002283) 3/485 0.0475431891 FCER1G;FCGR2A;APEH
37 positive regulation of NF-kappaB transcription factor activity (GO:0051092) 2/155 0.0475431891 PRKCB;PRKD2
38 neutrophil mediated immunity (GO:0002446) 3/488 0.0475431891 FCER1G;FCGR2A;APEH
39 peptidyl-serine phosphorylation (GO:0018105) 2/156 0.0475431891 PRKCB;PRKD2
40 regulation of histone H4 acetylation (GO:0090239) 1/9 0.0475431891 MUC1
41 regulation of DNA-templated transcription in response to stress (GO:0043620) 1/9 0.0475431891 MUC1
42 negative regulation of cell adhesion mediated by integrin (GO:0033629) 1/10 0.0475431891 MUC1
43 negative regulation of transcription by competitive promoter binding (GO:0010944) 1/10 0.0475431891 MUC1
44 negative regulation of transmembrane transport (GO:0034763) 1/10 0.0475431891 PRKCB
45 lipoprotein transport (GO:0042953) 1/10 0.0475431891 PRKCB
46 positive regulation of receptor recycling (GO:0001921) 1/10 0.0475431891 RAB29
47 toxin transport (GO:1901998) 1/10 0.0475431891 RAB29
48 regulation of cell activation (GO:0050865) 1/10 0.0475431891 FCER1G
49 DNA damage response, signal transduction by p53 class mediator resulting in transcription of p21 class mediator (GO:0006978) 1/10 0.0475431891 MUC1
50 immunoglobulin mediated immune response (GO:0016064) 1/10 0.0475431891 FCER1G
51 endothelial tube morphogenesis (GO:0061154) 1/10 0.0475431891 PRKD2
52 peptidyl-serine modification (GO:0018209) 2/169 0.0475431891 PRKCB;PRKD2
53 positive regulation of ERK1 and ERK2 cascade (GO:0070374) 2/172 0.0475431891 CCL20;PRKD2
54 lipoprotein localization (GO:0044872) 1/11 0.0475431891 PRKCB
55 B cell mediated immunity (GO:0019724) 1/11 0.0475431891 FCER1G
56 DNA damage response, signal transduction resulting in transcription (GO:0042772) 1/11 0.0475431891 MUC1
57 inositol phosphate biosynthetic process (GO:0032958) 1/11 0.0475431891 IP6K2
58 regulation of immune response (GO:0050776) 2/179 0.0484449448 FCGR2A;ERAP1
59 regulation of hemopoiesis (GO:1903706) 1/12 0.0484449448 PRKCB
60 negative regulation of glucose transmembrane transport (GO:0010829) 1/12 0.0484449448 PRKCB
61 mitotic nuclear membrane disassembly (GO:0007077) 1/12 0.0484449448 PRKCB
62 antigen receptor-mediated signaling pathway (GO:0050851) 2/185 0.0492130414 PRKCB;PRKD2
63 negative regulation of intrinsic apoptotic signaling pathway in response to DNA damage by p53 class mediator (GO:1902166) 1/13 0.0492130414 MUC1
64 positive regulation of histone deacetylation (GO:0031065) 1/13 0.0492130414 PRKD2
65 cellular response to tumor necrosis factor (GO:0071356) 2/194 0.0492130414 TNFRSF6B;CCL20
66 cellular response to low-density lipoprotein particle stimulus (GO:0071404) 1/14 0.0492130414 FCER1G
67 antigen processing and presentation of endogenous peptide antigen (GO:0002483) 1/14 0.0492130414 ERAP1
68 regulation of intrinsic apoptotic signaling pathway in response to DNA damage by p53 class mediator (GO:1902165) 1/14 0.0492130414 MUC1
69 nuclear membrane disassembly (GO:0051081) 1/14 0.0492130414 PRKCB
70 positive regulation of lymphocyte migration (GO:2000403) 1/14 0.0492130414 CCL20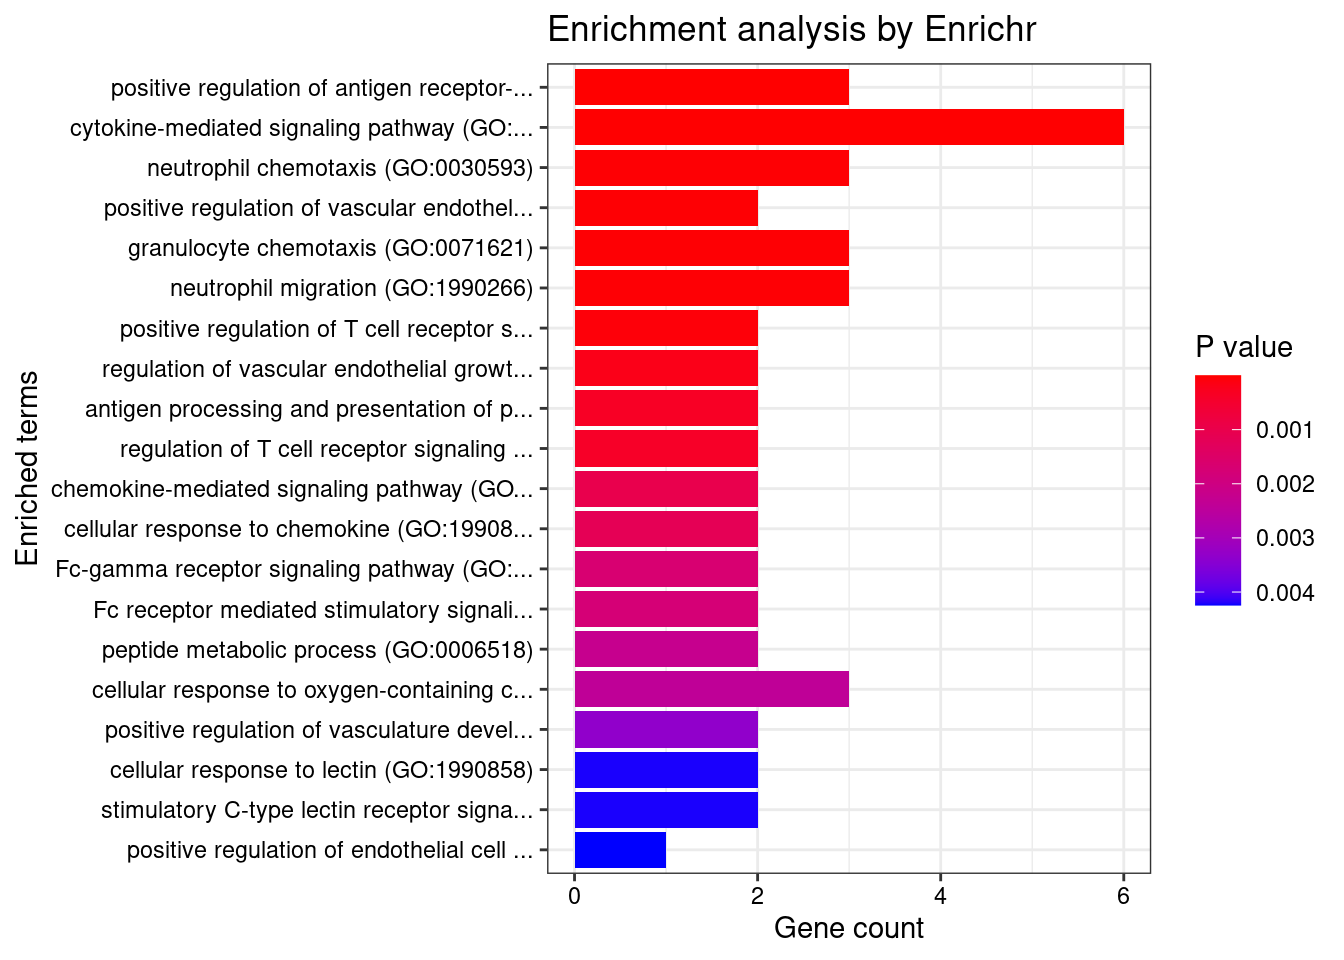
| Version | Author | Date |
|---|---|---|
| 0136d2e | wesleycrouse | 2022-06-10 |
None

Number of cTWAS Genes in Tissue Group: 22

Uploading data to Enrichr... Done.
  Querying GO_Biological_Process_2021... Done.
Parsing results... Done.

GO_Biological_Process_2021

                                                                              Term Overlap Adjusted.P.value                              Genes
1                                 cytokine-mediated signaling pathway (GO:0019221)   6/621       0.01314044 MUC1;CCL20;TNFSF15;IRF8;IRF5;CXCL5
2            positive regulation of T cell receptor signaling pathway (GO:0050862)    2/14       0.01605733                        RAB29;PRKD2
3  positive regulation of antigen receptor-mediated signaling pathway (GO:0050857)    2/21       0.02354895                        RAB29;PRKD2
4                               cellular response to interferon-gamma (GO:0071346)   3/121       0.02354895                    CCL20;IRF8;IRF5
5                     regulation of T cell receptor signaling pathway (GO:0050856)    2/35       0.04141318                        RAB29;PRKD2
6                        positive regulation of ERK1 and ERK2 cascade (GO:0070374)   3/172       0.04381002                  CCL20;CARD9;PRKD2
7                                chemokine-mediated signaling pathway (GO:0070098)    2/56       0.04851311                        CCL20;CXCL5
8                              cellular response to cytokine stimulus (GO:0071345)   4/482       0.04851311               MUC1;CCL20;IRF8;IRF5
9                                        neutrophil mediated immunity (GO:0002446)   4/488       0.04851311            FCGR2A;CARD9;HSPA6;APEH
10                                     cellular response to chemokine (GO:1990869)    2/60       0.04851311                        CCL20;CXCL5
11                                regulation of ERK1 and ERK2 cascade (GO:0070372)   3/238       0.04851311                  CCL20;CARD9;PRKD2
12                             cellular response to type I interferon (GO:0071357)    2/65       0.04851311                          IRF8;IRF5
13                                type I interferon signaling pathway (GO:0060337)    2/65       0.04851311                          IRF8;IRF5
14                        interferon-gamma-mediated signaling pathway (GO:0060333)    2/68       0.04851311                          IRF8;IRF5
15                                              RNA 3'-end processing (GO:0031123)    2/69       0.04851311                       DDX39B;CASC3
16                                              neutrophil chemotaxis (GO:0030593)    2/70       0.04851311                        CCL20;CXCL5
17                                             granulocyte chemotaxis (GO:0071621)    2/73       0.04851311                        CCL20;CXCL5
18                                                      RNA transport (GO:0050658)    2/76       0.04851311                       DDX39B;CASC3
19                                               neutrophil migration (GO:1990266)    2/77       0.04851311                        CCL20;CXCL5
20                                positive regulation of MAPK cascade (GO:0043410)   3/274       0.04851311                  CCL20;CARD9;PRKD2
21                                             mRNA 3'-end processing (GO:0031124)    2/79       0.04851311                       DDX39B;CASC3
22                                       response to interferon-gamma (GO:0034341)    2/80       0.04851311                         CCL20;IRF8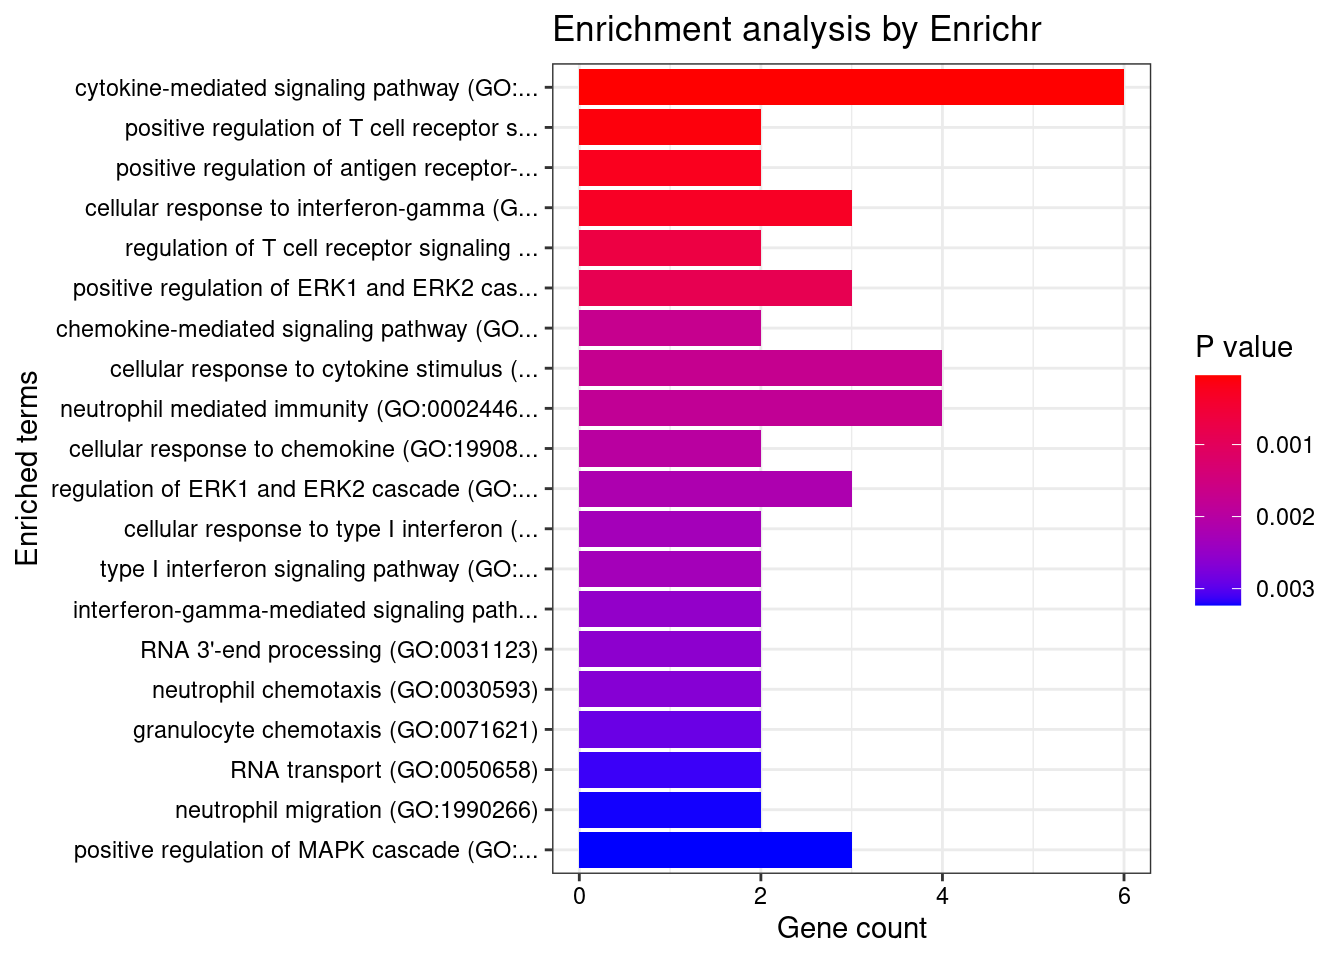
| Version | Author | Date |
|---|---|---|
| 0136d2e | wesleycrouse | 2022-06-10 |
Skin

Number of cTWAS Genes in Tissue Group: 13

Uploading data to Enrichr... Done.
  Querying GO_Biological_Process_2021... Done.
Parsing results... Done.

GO_Biological_Process_2021

[1] Term             Overlap          Adjusted.P.value Genes
<0 rows> (or 0-length row.names)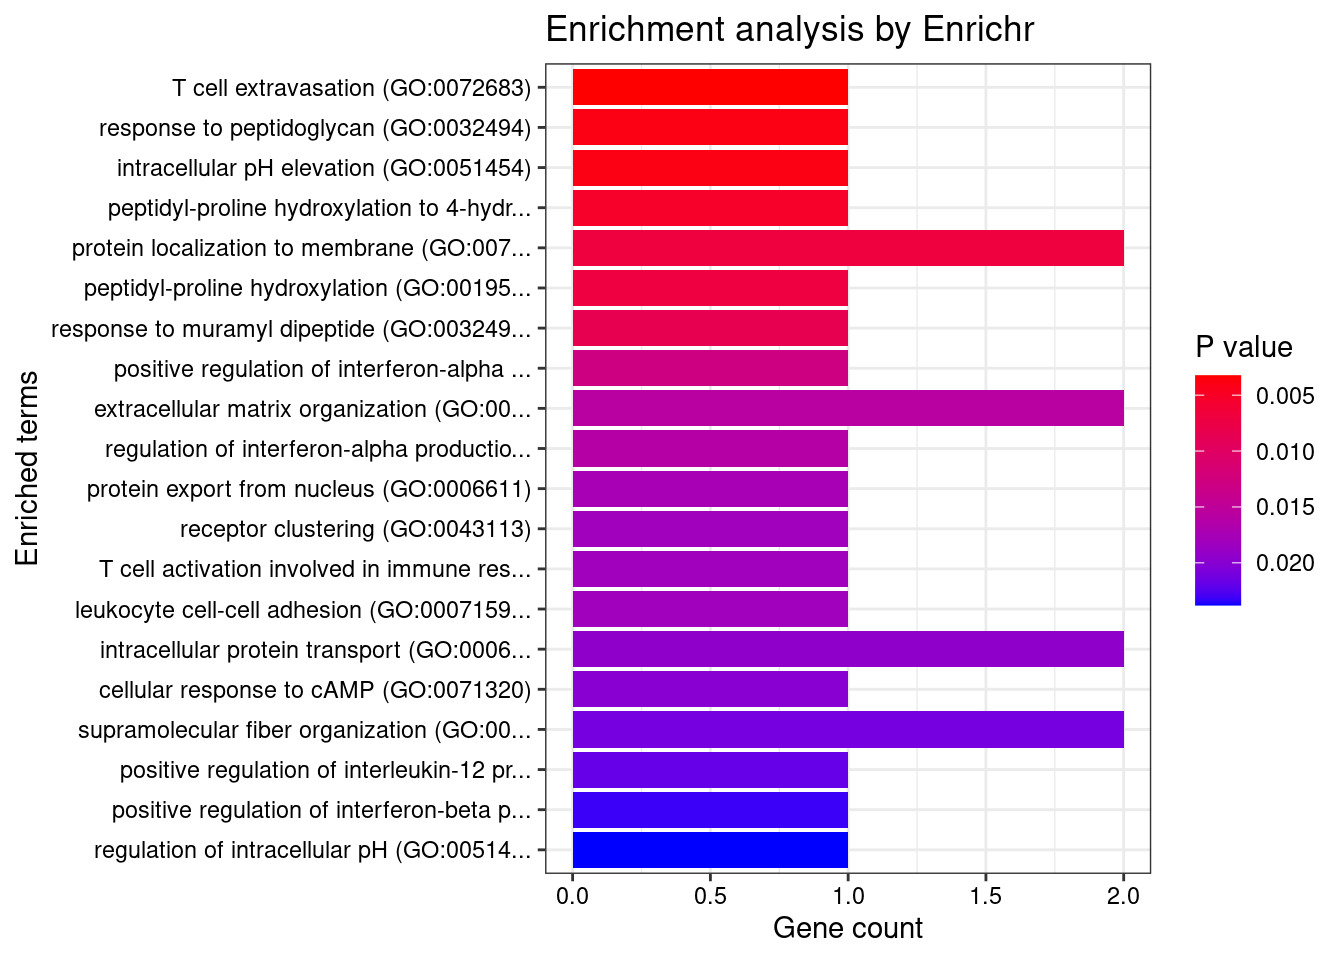
| Version | Author | Date |
|---|---|---|
| 0136d2e | wesleycrouse | 2022-06-10 |
Blood or Immune
Number of cTWAS Genes in Tissue Group: 7
Uploading data to Enrichr... Done.
Querying GO_Biological_Process_2021... Done.
Parsing results... Done.
GO_Biological_Process_2021
Term Overlap Adjusted.P.value Genes
1 cellular response to lectin (GO:1990858) 2/115 0.02623026 MUC1;CARD9
2 stimulatory C-type lectin receptor signaling pathway (GO:0002223) 2/115 0.02623026 MUC1;CARD9
3 innate immune response activating cell surface receptor signaling pathway (GO:0002220) 2/119 0.02623026 MUC1;CARD9
4 intracellular pH elevation (GO:0051454) 1/6 0.02623026 SLC26A3
5 positive regulation of histone H4 acetylation (GO:0090240) 1/7 0.02623026 MUC1
6 myeloid leukocyte mediated immunity (GO:0002444) 1/8 0.02623026 CARD9
7 regulation of histone H4 acetylation (GO:0090239) 1/9 0.02623026 MUC1
8 regulation of DNA-templated transcription in response to stress (GO:0043620) 1/9 0.02623026 MUC1
9 negative regulation of cell adhesion mediated by integrin (GO:0033629) 1/10 0.02623026 MUC1
10 negative regulation of transcription by competitive promoter binding (GO:0010944) 1/10 0.02623026 MUC1
11 DNA damage response, signal transduction by p53 class mediator resulting in transcription of p21 class mediator (GO:0006978) 1/10 0.02623026 MUC1
12 regulation of T-helper 17 type immune response (GO:2000316) 1/10 0.02623026 CARD9
13 immunoglobulin mediated immune response (GO:0016064) 1/10 0.02623026 CARD9
14 DNA damage response, signal transduction resulting in transcription (GO:0042772) 1/11 0.02623026 MUC1
15 B cell mediated immunity (GO:0019724) 1/11 0.02623026 CARD9
16 positive regulation of T-helper 17 type immune response (GO:2000318) 1/12 0.02623026 CARD9
17 positive regulation of adaptive immune response based on somatic recombination of immune receptors built from immunoglobulin superfamily domains (GO:0002824) 1/13 0.02623026 CARD9
18 negative regulation of intrinsic apoptotic signaling pathway in response to DNA damage by p53 class mediator (GO:1902166) 1/13 0.02623026 MUC1
19 homeostasis of number of cells (GO:0048872) 1/13 0.02623026 CARD9
20 antifungal innate immune response (GO:0061760) 1/13 0.02623026 CARD9
21 positive regulation of granulocyte macrophage colony-stimulating factor production (GO:0032725) 1/14 0.02623026 CARD9
22 regulation of intrinsic apoptotic signaling pathway in response to DNA damage by p53 class mediator (GO:1902165) 1/14 0.02623026 MUC1
23 cellular response to oxygen-containing compound (GO:1901701) 2/323 0.02655138 SLC26A3;CXCL5
24 regulation of granulocyte macrophage colony-stimulating factor production (GO:0032645) 1/16 0.02693877 CARD9
25 negative regulation of intrinsic apoptotic signaling pathway by p53 class mediator (GO:1902254) 1/17 0.02693877 MUC1
26 positive regulation of cytokine production involved in inflammatory response (GO:1900017) 1/17 0.02693877 CARD9
27 positive regulation of stress-activated protein kinase signaling cascade (GO:0070304) 1/18 0.02746287 CARD9
28 positive regulation of histone acetylation (GO:0035066) 1/23 0.03117511 MUC1
29 positive regulation of interleukin-17 production (GO:0032740) 1/23 0.03117511 CARD9
30 defense response to fungus (GO:0050832) 1/24 0.03117511 CARD9
31 positive regulation of transcription from RNA polymerase II promoter in response to stress (GO:0036003) 1/24 0.03117511 MUC1
32 ribosomal large subunit assembly (GO:0000027) 1/25 0.03117511 MRPL20
33 positive regulation of release of cytochrome c from mitochondria (GO:0090200) 1/25 0.03117511 BIK
34 negative regulation of intrinsic apoptotic signaling pathway in response to DNA damage (GO:1902230) 1/26 0.03146381 MUC1
35 cellular response to cAMP (GO:0071320) 1/31 0.03569372 SLC26A3
36 modulation by host of symbiont process (GO:0051851) 1/32 0.03569372 CARD9
37 regulation of interleukin-17 production (GO:0032660) 1/33 0.03569372 CARD9
38 apoptotic mitochondrial changes (GO:0008637) 1/33 0.03569372 BIK
39 regulation of cell adhesion mediated by integrin (GO:0033628) 1/34 0.03582703 MUC1
40 regulation of intracellular pH (GO:0051453) 1/37 0.03799645 SLC26A3
41 response to cAMP (GO:0051591) 1/38 0.03806588 SLC26A3
42 regulation of release of cytochrome c from mitochondria (GO:0090199) 1/41 0.03836379 BIK
43 development of primary male sexual characteristics (GO:0046546) 1/43 0.03836379 BIK
44 anion transport (GO:0006820) 1/43 0.03836379 SLC26A3
45 regulation of cytokine production involved in inflammatory response (GO:1900015) 1/43 0.03836379 CARD9
46 male gonad development (GO:0008584) 1/43 0.03836379 BIK
47 regulation of stress-activated MAPK cascade (GO:0032872) 1/49 0.04181099 CARD9
48 cellular defense response (GO:0006968) 1/49 0.04181099 LSP1
49 ribosome assembly (GO:0042255) 1/50 0.04181099 MRPL20
50 gonad development (GO:0008406) 1/51 0.04181099 BIK
51 cytokine-mediated signaling pathway (GO:0019221) 2/621 0.04216314 MUC1;CXCL5
52 DNA damage response, signal transduction by p53 class mediator resulting in cell cycle arrest (GO:0006977) 1/56 0.04318174 MUC1
53 chemokine-mediated signaling pathway (GO:0070098) 1/56 0.04318174 CXCL5
54 ribosomal large subunit biogenesis (GO:0042273) 1/57 0.04318174 MRPL20
55 positive regulation of mitochondrion organization (GO:0010822) 1/58 0.04318174 BIK
56 cellular response to chemokine (GO:1990869) 1/60 0.04374599 CXCL5
57 O-glycan processing (GO:0016266) 1/61 0.04374599 MUC1
58 positive regulation of cysteine-type endopeptidase activity (GO:2001056) 1/62 0.04374599 CARD9
59 antimicrobial humoral immune response mediated by antimicrobial peptide (GO:0061844) 1/64 0.04431406 CXCL5
60 mitotic G1 DNA damage checkpoint signaling (GO:0031571) 1/65 0.04431406 MUC1
61 neutrophil chemotaxis (GO:0030593) 1/70 0.04650635 CXCL5
62 granulocyte chemotaxis (GO:0071621) 1/73 0.04650635 CXCL5
63 negative regulation of cell adhesion (GO:0007162) 1/73 0.04650635 MUC1
64 positive regulation of JNK cascade (GO:0046330) 1/73 0.04650635 CARD9
65 DNA damage response, signal transduction by p53 class mediator (GO:0030330) 1/74 0.04650635 MUC1
66 positive regulation of interleukin-6 production (GO:0032755) 1/76 0.04692612 CARD9
67 neutrophil migration (GO:1990266) 1/77 0.04692612 CXCL5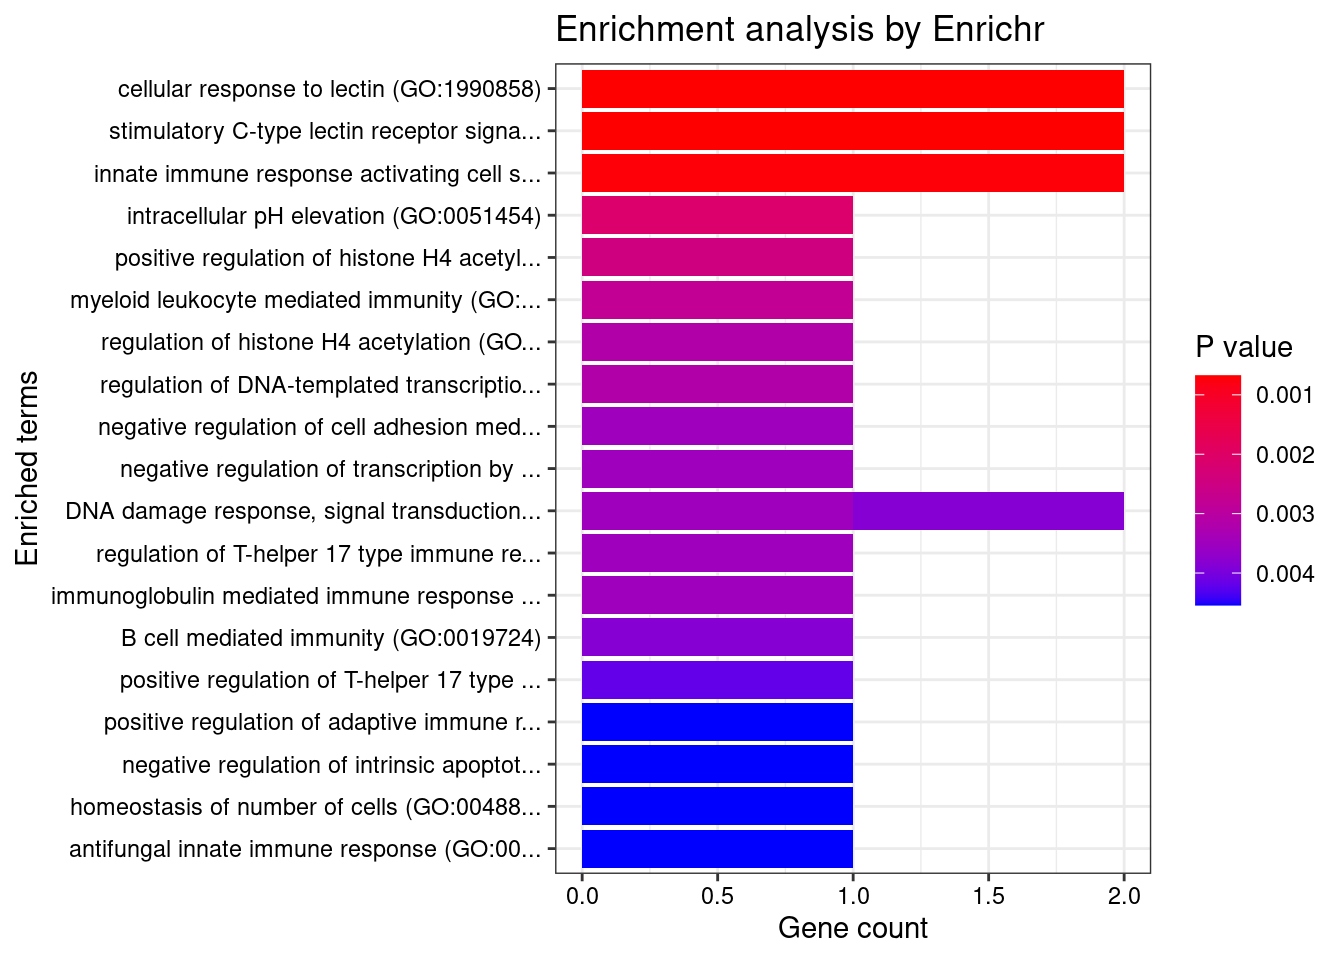
| Version | Author | Date |
|---|---|---|
| 0136d2e | wesleycrouse | 2022-06-10 |
Digestive
Number of cTWAS Genes in Tissue Group: 19
Uploading data to Enrichr... Done.
Querying GO_Biological_Process_2021... Done.
Parsing results... Done.
GO_Biological_Process_2021
Term Overlap Adjusted.P.value Genes
1 positive regulation of antigen receptor-mediated signaling pathway (GO:0050857) 3/21 0.0002840049 PRKCB;RAB29;PRKD2
2 positive regulation of vascular endothelial growth factor receptor signaling pathway (GO:0030949) 2/10 0.0056876906 PRKCB;PRKD2
3 positive regulation of T cell receptor signaling pathway (GO:0050862) 2/14 0.0076505375 RAB29;PRKD2
4 cellular response to interferon-gamma (GO:0071346) 3/121 0.0138437685 CCL20;IRF8;IRF5
5 regulation of vascular endothelial growth factor receptor signaling pathway (GO:0030947) 2/24 0.0138437685 PRKCB;PRKD2
6 positive regulation of NF-kappaB transcription factor activity (GO:0051092) 3/155 0.0199899137 PRKCB;CARD9;PRKD2
7 regulation of T cell receptor signaling pathway (GO:0050856) 2/35 0.0203175599 RAB29;PRKD2
8 positive regulation of ERK1 and ERK2 cascade (GO:0070374) 3/172 0.0203175599 CCL20;CARD9;PRKD2
9 neutrophil mediated immunity (GO:0002446) 4/488 0.0318555351 FCGR2A;HSPA6;CARD9;ITGAL
10 inflammatory response (GO:0006954) 3/230 0.0318555351 CCL20;ITGAL;CXCL5
11 chemokine-mediated signaling pathway (GO:0070098) 2/56 0.0318555351 CCL20;CXCL5
12 regulation of ERK1 and ERK2 cascade (GO:0070372) 3/238 0.0318555351 CCL20;CARD9;PRKD2
13 cellular response to chemokine (GO:1990869) 2/60 0.0318555351 CCL20;CXCL5
14 positive regulation of DNA-binding transcription factor activity (GO:0051091) 3/246 0.0318555351 PRKCB;CARD9;PRKD2
15 cellular response to type I interferon (GO:0071357) 2/65 0.0318555351 IRF8;IRF5
16 type I interferon signaling pathway (GO:0060337) 2/65 0.0318555351 IRF8;IRF5
17 interferon-gamma-mediated signaling pathway (GO:0060333) 2/68 0.0320532733 IRF8;IRF5
18 neutrophil chemotaxis (GO:0030593) 2/70 0.0320532733 CCL20;CXCL5
19 positive regulation of MAPK cascade (GO:0043410) 3/274 0.0320532733 CCL20;CARD9;PRKD2
20 granulocyte chemotaxis (GO:0071621) 2/73 0.0320532733 CCL20;CXCL5
21 neutrophil migration (GO:1990266) 2/77 0.0332089162 CCL20;CXCL5
22 cytokine-mediated signaling pathway (GO:0019221) 4/621 0.0332089162 CCL20;IRF8;IRF5;CXCL5
23 response to interferon-gamma (GO:0034341) 2/80 0.0333824098 CCL20;IRF8
24 regulation of type I interferon production (GO:0032479) 2/89 0.0394439879 IRF8;IRF5
25 positive regulation of cytokine production (GO:0001819) 3/335 0.0411969116 CARD9;PRKD2;IRF5
26 positive regulation of vasculature development (GO:1904018) 2/102 0.0411969116 PRKCB;PRKD2
27 T cell extravasation (GO:0072683) 1/5 0.0411969116 ITGAL
28 positive regulation of endothelial cell chemotaxis by VEGF-activated vascular endothelial growth factor receptor signaling pathway (GO:0038033) 1/5 0.0411969116 PRKD2
29 positive regulation of fibroblast growth factor receptor signaling pathway (GO:0045743) 1/5 0.0411969116 PRKD2
30 histone-threonine phosphorylation (GO:0035405) 1/5 0.0411969116 PRKCB
31 positive regulation of angiogenesis (GO:0045766) 2/116 0.0411969116 PRKCB;PRKD2
32 sphingolipid metabolic process (GO:0006665) 2/116 0.0411969116 CERKL;PRKD2
33 positive regulation of deacetylase activity (GO:0090045) 1/6 0.0411969116 PRKD2
34 regulation of transmission of nerve impulse (GO:0051969) 1/6 0.0411969116 TYMP
35 heat acclimation (GO:0010286) 1/6 0.0411969116 HSPA6
36 response to peptidoglycan (GO:0032494) 1/6 0.0411969116 IRF5
37 morphogenesis of an endothelium (GO:0003159) 1/6 0.0411969116 PRKD2
38 regulation of digestive system process (GO:0044058) 1/6 0.0411969116 TYMP
39 cellular heat acclimation (GO:0070370) 1/6 0.0411969116 HSPA6
40 protein K29-linked ubiquitination (GO:0035519) 1/6 0.0411969116 RNF186
41 intracellular pH elevation (GO:0051454) 1/6 0.0411969116 SLC26A3
42 phosphorylation (GO:0016310) 3/400 0.0428794124 CERKL;PRKCB;PRKD2
43 positive regulation of B cell receptor signaling pathway (GO:0050861) 1/7 0.0437711278 PRKCB
44 regulation of histone deacetylase activity (GO:1901725) 1/7 0.0437711278 PRKD2
45 protein localization to ciliary membrane (GO:1903441) 1/7 0.0437711278 RAB29
46 positive regulation of cell migration by vascular endothelial growth factor signaling pathway (GO:0038089) 1/8 0.0441022109 PRKD2
47 myeloid leukocyte mediated immunity (GO:0002444) 1/8 0.0441022109 CARD9
48 regulation of cytokine production (GO:0001817) 2/150 0.0441022109 CARD9;IRF8
49 negative regulation of transmembrane transport (GO:0034763) 1/10 0.0441022109 PRKCB
50 lipoprotein transport (GO:0042953) 1/10 0.0441022109 PRKCB
51 regulation of T-helper 17 type immune response (GO:2000316) 1/10 0.0441022109 CARD9
52 positive regulation of receptor recycling (GO:0001921) 1/10 0.0441022109 RAB29
53 toxin transport (GO:1901998) 1/10 0.0441022109 RAB29
54 nucleoside metabolic process (GO:0009116) 1/10 0.0441022109 TYMP
55 immunoglobulin mediated immune response (GO:0016064) 1/10 0.0441022109 CARD9
56 endothelial tube morphogenesis (GO:0061154) 1/10 0.0441022109 PRKD2
57 peptidyl-serine phosphorylation (GO:0018105) 2/156 0.0441022109 PRKCB;PRKD2
58 neutrophil degranulation (GO:0043312) 3/481 0.0441022109 FCGR2A;HSPA6;ITGAL
59 cellular response to cytokine stimulus (GO:0071345) 3/482 0.0441022109 CCL20;IRF8;IRF5
60 neutrophil activation involved in immune response (GO:0002283) 3/485 0.0441022109 FCGR2A;HSPA6;ITGAL
61 lipoprotein localization (GO:0044872) 1/11 0.0441022109 PRKCB
62 pyrimidine nucleoside catabolic process (GO:0046135) 1/11 0.0441022109 TYMP
63 pyrimidine nucleoside salvage (GO:0043097) 1/11 0.0441022109 TYMP
64 pyrimidine-containing compound salvage (GO:0008655) 1/11 0.0441022109 TYMP
65 B cell mediated immunity (GO:0019724) 1/11 0.0441022109 CARD9
66 peptidyl-serine modification (GO:0018209) 2/169 0.0441022109 PRKCB;PRKD2
67 positive regulation of I-kappaB kinase/NF-kappaB signaling (GO:0043123) 2/171 0.0441022109 PRKCB;CARD9
68 regulation of hemopoiesis (GO:1903706) 1/12 0.0441022109 PRKCB
69 pyrimidine-containing compound metabolic process (GO:0072527) 1/12 0.0441022109 TYMP
70 negative regulation of glucose transmembrane transport (GO:0010829) 1/12 0.0441022109 PRKCB
71 nucleoside catabolic process (GO:0009164) 1/12 0.0441022109 TYMP
72 nucleoside salvage (GO:0043174) 1/12 0.0441022109 TYMP
73 positive regulation of T-helper 17 type immune response (GO:2000318) 1/12 0.0441022109 CARD9
74 mitochondrial genome maintenance (GO:0000002) 1/12 0.0441022109 TYMP
75 mitotic nuclear membrane disassembly (GO:0007077) 1/12 0.0441022109 PRKCB
76 mitochondrion organization (GO:0007005) 2/175 0.0441022109 RAB29;TYMP
77 positive regulation of adaptive immune response based on somatic recombination of immune receptors built from immunoglobulin superfamily domains (GO:0002824) 1/13 0.0441022109 CARD9
78 antifungal innate immune response (GO:0061760) 1/13 0.0441022109 CARD9
79 positive regulation of histone deacetylation (GO:0031065) 1/13 0.0441022109 PRKD2
80 response to muramyl dipeptide (GO:0032495) 1/13 0.0441022109 IRF5
81 homeostasis of number of cells (GO:0048872) 1/13 0.0441022109 CARD9
82 protein localization to mitochondrion (GO:0070585) 1/13 0.0441022109 RNF186
83 regulation of immune response (GO:0050776) 2/179 0.0441022109 FCGR2A;ITGAL
84 antigen receptor-mediated signaling pathway (GO:0050851) 2/185 0.0446253778 PRKCB;PRKD2
85 pyrimidine nucleoside biosynthetic process (GO:0046134) 1/14 0.0446253778 TYMP
86 nuclear membrane disassembly (GO:0051081) 1/14 0.0446253778 PRKCB
87 positive regulation of granulocyte macrophage colony-stimulating factor production (GO:0032725) 1/14 0.0446253778 CARD9
88 positive regulation of lymphocyte migration (GO:2000403) 1/14 0.0446253778 CCL20
89 positive regulation of intracellular signal transduction (GO:1902533) 3/546 0.0457135451 PRKCB;CARD9;PRKD2
90 pyrimidine nucleoside metabolic process (GO:0006213) 1/15 0.0457135451 TYMP
91 positive regulation of endothelial cell chemotaxis (GO:2001028) 1/15 0.0457135451 PRKD2
92 regulation of endothelial cell chemotaxis (GO:2001026) 1/15 0.0457135451 PRKD2
93 protein localization to membrane (GO:0072657) 2/195 0.0463132696 RAB29;ITGAL
94 regulation of granulocyte macrophage colony-stimulating factor production (GO:0032645) 1/16 0.0477022145 CARD9
95 regulation of angiogenesis (GO:0045765) 2/203 0.0485930561 PRKCB;PRKD2
96 regulation of receptor recycling (GO:0001919) 1/17 0.0485930561 RAB29
97 pyrimidine-containing compound catabolic process (GO:0072529) 1/17 0.0485930561 TYMP
98 positive regulation of cytokine production involved in inflammatory response (GO:1900017) 1/17 0.0485930561 CARD9
99 positive regulation of CREB transcription factor activity (GO:0032793) 1/18 0.0499007957 PRKD2
100 T cell migration (GO:0072678) 1/18 0.0499007957 CCL20
101 positive regulation of stress-activated protein kinase signaling cascade (GO:0070304) 1/18 0.0499007957 CARD9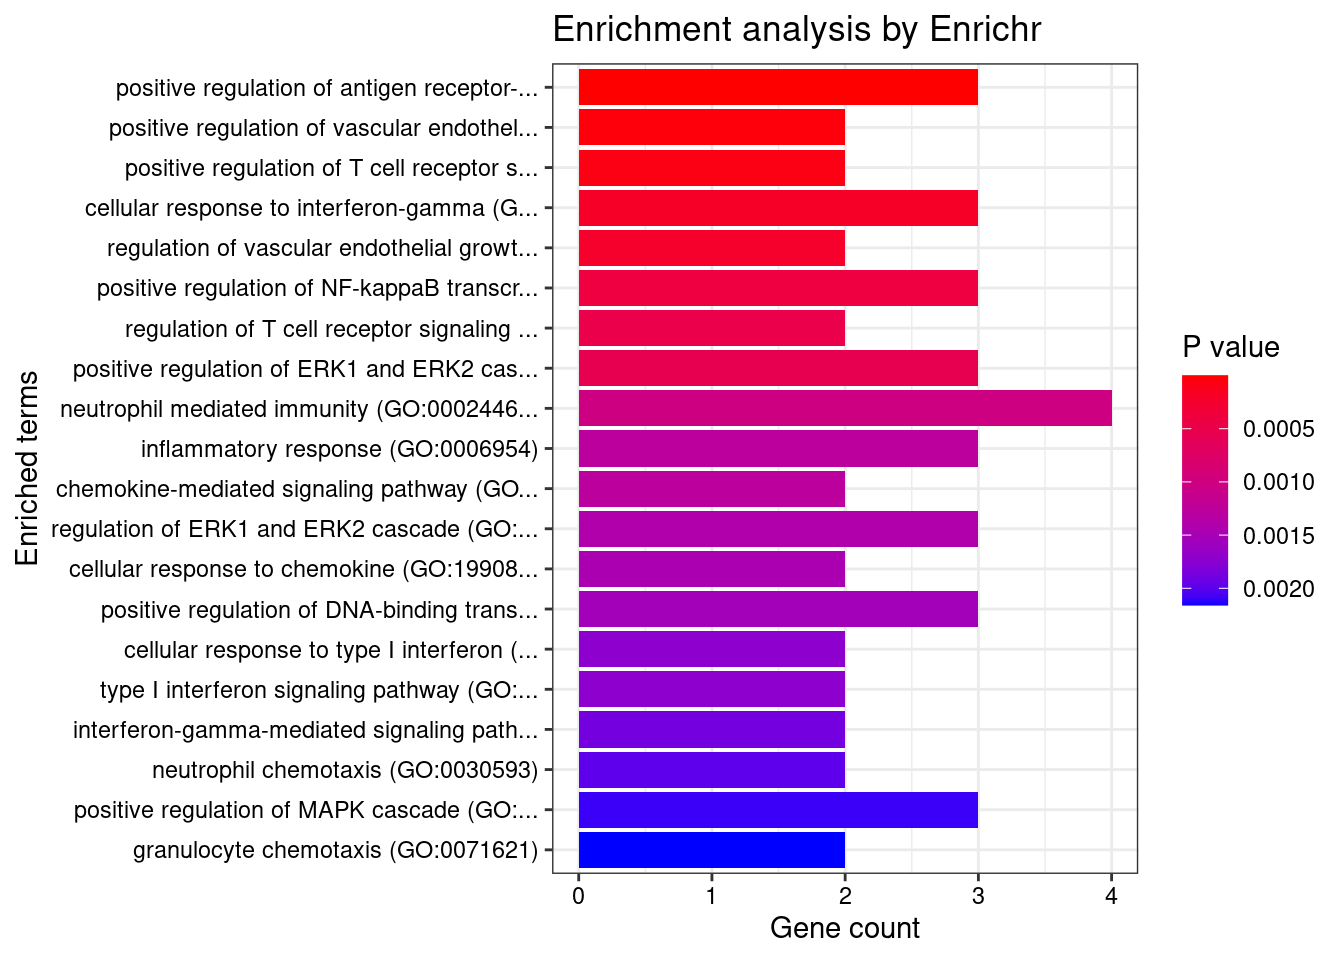
| Version | Author | Date |
|---|---|---|
| 0136d2e | wesleycrouse | 2022-06-10 |
if (exists("group_enrichment_results")){
  save(group_enrichment_results, file="group_enrichment_results.RData")
}
KEGG
for (group in names(df_group)){
  cat(paste0(group, "\n\n"))

  ctwas_genes_group <- df_group[[group]]$ctwas
  background_group <- df_group[[group]]$background

  cat(paste0("Number of cTWAS Genes in Tissue Group: ", length(ctwas_genes_group), "\n\n"))

  databases <- c("pathway_KEGG")

  enrichResult <- WebGestaltR(enrichMethod="ORA", organism="hsapiens",
                              interestGene=ctwas_genes_group, referenceGene=background_group,
                              enrichDatabase=databases, interestGeneType="genesymbol",
                              referenceGeneType="genesymbol", isOutput=F)

  if (!is.null(enrichResult)){
    print(enrichResult[,c("description", "size", "overlap", "FDR", "userId")])
  }

  cat("\n")
}
Adipose
Number of cTWAS Genes in Tissue Group: 9
Loading the functional categories...
Loading the ID list...
Loading the reference list...
Performing the enrichment analysis...Warning in oraEnrichment(interestGeneList, referenceGeneList, geneSet, minNum = minNum, : No significant gene set is identified based on FDR 0.05!
Endocrine

Number of cTWAS Genes in Tissue Group: 14

Loading the functional categories...
Loading the ID list...
Loading the reference list...
Performing the enrichment analysis...
Warning in oraEnrichment(interestGeneList, referenceGeneList, geneSet, minNum = minNum, : No significant gene set is identified based on FDR 0.05!
Cardiovascular

Number of cTWAS Genes in Tissue Group: 8

Loading the functional categories...
Loading the ID list...
Loading the reference list...
Performing the enrichment analysis...
Warning in oraEnrichment(interestGeneList, referenceGeneList, geneSet, minNum = minNum, : No significant gene set is identified based on FDR 0.05!
CNS

Number of cTWAS Genes in Tissue Group: 17

Loading the functional categories...
Loading the ID list...
Loading the reference list...
Performing the enrichment analysis...
Warning in oraEnrichment(interestGeneList, referenceGeneList, geneSet, minNum = minNum, : No significant gene set is identified based on FDR 0.05!
None

Number of cTWAS Genes in Tissue Group: 22

Loading the functional categories...
Loading the ID list...
Loading the reference list...
Performing the enrichment analysis...
Warning in oraEnrichment(interestGeneList, referenceGeneList, geneSet, minNum = minNum, : No significant gene set is identified based on FDR 0.05!
Skin

Number of cTWAS Genes in Tissue Group: 13

Loading the functional categories...
Loading the ID list...
Loading the reference list...
Performing the enrichment analysis...
Warning in oraEnrichment(interestGeneList, referenceGeneList, geneSet, minNum = minNum, : No significant gene set is identified based on FDR 0.05!
Blood or Immune

Number of cTWAS Genes in Tissue Group: 7

Loading the functional categories...
Loading the ID list...
Loading the reference list...
Performing the enrichment analysis...
Warning in oraEnrichment(interestGeneList, referenceGeneList, geneSet, minNum = minNum, : No significant gene set is identified based on FDR 0.05!
Digestive

Number of cTWAS Genes in Tissue Group: 19

Loading the functional categories...
Loading the ID list...
Loading the reference list...
Performing the enrichment analysis...
Warning in oraEnrichment(interestGeneList, referenceGeneList, geneSet, minNum = minNum, : No significant gene set is identified based on FDR 0.05!DisGeNET
for (group in names(df_group)){
  cat(paste0(group, "\n\n"))

  ctwas_genes_group <- df_group[[group]]$ctwas

  cat(paste0("Number of cTWAS Genes in Tissue Group: ", length(ctwas_genes_group), "\n\n"))

  res_enrich <- disease_enrichment(entities=ctwas_genes_group, vocabulary = "HGNC", database = "CURATED")

  if (any(res_enrich@qresult$FDR < 0.05)){
    print(res_enrich@qresult[res_enrich@qresult$FDR < 0.05, c("Description", "FDR", "Ratio",  "BgRatio")])
  }

  cat("\n")
}
Adipose
Number of cTWAS Genes in Tissue Group: 9LRP5L gene(s) from the input list not found in DisGeNET CURATEDSDCCAG3 gene(s) from the input list not found in DisGeNET CURATEDZNF736 gene(s) from the input list not found in DisGeNET CURATED Description FDR Ratio BgRatio
3 Anovulation 0.01071944 1/6 1/9703
10 Ulcerative Colitis 0.01071944 2/6 63/9703
44 Deep seated dermatophytosis 0.01071944 1/6 1/9703
46 Candidiasis, Familial, 2 0.01607502 1/6 2/9703
Endocrine
Number of cTWAS Genes in Tissue Group: 14ZNF736 gene(s) from the input list not found in DisGeNET CURATED Description FDR Ratio BgRatio
13 Ulcerative Colitis 1.288450e-08 6/13 63/9703
23 Enteritis 1.671201e-02 1/13 1/9703
32 Inflammatory Bowel Diseases 1.671201e-02 2/13 35/9703
63 Ureteral obstruction 1.671201e-02 2/13 24/9703
72 Crohn's disease of large bowel 1.671201e-02 2/13 44/9703
78 Crohn's disease of the ileum 1.671201e-02 2/13 44/9703
96 Regional enteritis 1.671201e-02 2/13 44/9703
101 IIeocolitis 1.671201e-02 2/13 44/9703
106 Deep seated dermatophytosis 1.671201e-02 1/13 1/9703
117 Medullary cystic kidney disease 1 1.671201e-02 1/13 1/9703
118 SPINOCEREBELLAR ATAXIA, AUTOSOMAL RECESSIVE 9 1.671201e-02 1/13 1/9703
120 LOEYS-DIETZ SYNDROME 3 1.671201e-02 1/13 1/9703
17 Crohn Disease 1.771036e-02 2/13 50/9703
52 Pneumonia 1.771036e-02 2/13 54/9703
53 Lobar Pneumonia 1.771036e-02 2/13 54/9703
100 Experimental Lung Inflammation 1.771036e-02 2/13 54/9703
123 Pneumonitis 1.771036e-02 2/13 54/9703
116 Candidiasis, Familial, 2 1.964015e-02 1/13 2/9703
30 Hypersensitivity 2.104823e-02 2/13 64/9703
108 Allergic Reaction 2.104823e-02 2/13 63/9703
43 Meniere Disease 2.304157e-02 1/13 3/9703
114 COENZYME Q10 DEFICIENCY 2.304157e-02 1/13 3/9703
122 COENZYME Q10 DEFICIENCY, PRIMARY, 1 2.304157e-02 1/13 3/9703
2 Aneurysm, Dissecting 2.845704e-02 1/13 5/9703
45 Mucocutaneous Lymph Node Syndrome 2.845704e-02 1/13 4/9703
48 Degenerative polyarthritis 2.845704e-02 2/13 93/9703
67 Osteoarthrosis Deformans 2.845704e-02 2/13 93/9703
84 Dissection of aorta 2.845704e-02 1/13 5/9703
113 Loeys-Dietz Aortic Aneurysm Syndrome 2.845704e-02 1/13 5/9703
126 Dissection, Blood Vessel 2.845704e-02 1/13 5/9703
127 Loeys-Dietz Syndrome, Type 1a 2.845704e-02 1/13 5/9703
33 Fibroid Tumor 3.306086e-02 1/13 6/9703
3 Aortic Aneurysm 3.524313e-02 1/13 7/9703
64 Uterine Fibroids 3.524313e-02 1/13 7/9703
119 Loeys-Dietz Syndrome 3.524313e-02 1/13 7/9703
65 Uterine Neoplasms 4.168372e-02 1/13 9/9703
90 Pulmonary Cystic Fibrosis 4.168372e-02 1/13 9/9703
110 Fibrocystic Disease of Pancreas 4.168372e-02 1/13 9/9703
51 Peritoneal Neoplasms 4.289980e-02 1/13 10/9703
71 Uterine Cancer 4.289980e-02 1/13 10/9703
88 Carcinomatosis of peritoneal cavity 4.289980e-02 1/13 10/9703
18 Cystic Fibrosis 4.496711e-02 1/13 11/9703
57 Ankylosing spondylitis 4.496711e-02 1/13 11/9703
Cardiovascular
Number of cTWAS Genes in Tissue Group: 8RAB29 gene(s) from the input list not found in DisGeNET CURATEDLST1 gene(s) from the input list not found in DisGeNET CURATEDZNF736 gene(s) from the input list not found in DisGeNET CURATED Description FDR Ratio BgRatio
2 Behcet Syndrome 0.001927051 2/5 24/9703
6 Ulcerative Colitis 0.005668934 2/5 63/9703
32 Inflammatory Bowel Disease 14 0.005668934 1/5 1/9703
20 CREST Syndrome 0.014562239 1/5 6/9703
26 Scleroderma, Limited 0.014562239 1/5 6/9703
29 Diffuse Scleroderma 0.014562239 1/5 5/9703
31 clinical depression 0.014562239 1/5 6/9703
18 Ankylosing spondylitis 0.023336188 1/5 11/9703
17 Systemic Scleroderma 0.035770248 1/5 19/9703
7 Heart valve disease 0.043990348 1/5 26/9703
4 Calcinosis 0.046422372 1/5 42/9703
5 Primary biliary cirrhosis 0.046422372 1/5 47/9703
9 Inflammatory Bowel Diseases 0.046422372 1/5 35/9703
10 Chronic Lymphocytic Leukemia 0.046422372 1/5 55/9703
11 Acute Promyelocytic Leukemia 0.046422372 1/5 46/9703
14 Pustulosis of Palms and Soles 0.046422372 1/5 57/9703
16 Psoriasis 0.046422372 1/5 57/9703
21 Libman-Sacks Disease 0.046422372 1/5 58/9703
22 Tumoral calcinosis 0.046422372 1/5 42/9703
23 Gastric Adenocarcinoma 0.046422372 1/5 45/9703
24 Microcalcification 0.046422372 1/5 42/9703
CNS
Number of cTWAS Genes in Tissue Group: 17APEH gene(s) from the input list not found in DisGeNET CURATEDCASC3 gene(s) from the input list not found in DisGeNET CURATEDTNFRSF6B gene(s) from the input list not found in DisGeNET CURATEDRAB29 gene(s) from the input list not found in DisGeNET CURATEDC1orf74 gene(s) from the input list not found in DisGeNET CURATEDTTPAL gene(s) from the input list not found in DisGeNET CURATED Description FDR Ratio BgRatio
9 Ulcerative Colitis 0.0000494912 4/11 63/9703
41 Pneumonia 0.0222148111 2/11 54/9703
42 Lobar Pneumonia 0.0222148111 2/11 54/9703
61 Congenital chloride diarrhea 0.0222148111 1/11 1/9703
79 Experimental Lung Inflammation 0.0222148111 2/11 54/9703
92 Medullary cystic kidney disease 1 0.0222148111 1/11 1/9703
93 Pneumonitis 0.0222148111 2/11 54/9703
24 Hypersensitivity 0.0241914390 2/11 64/9703
86 Allergic Reaction 0.0241914390 2/11 63/9703
33 Meniere Disease 0.0326194122 1/11 3/9703
35 Mucocutaneous Lymph Node Syndrome 0.0395183069 1/11 4/9703
None
Number of cTWAS Genes in Tissue Group: 22APEH gene(s) from the input list not found in DisGeNET CURATEDDDX39B gene(s) from the input list not found in DisGeNET CURATEDCASC3 gene(s) from the input list not found in DisGeNET CURATEDOAZ3 gene(s) from the input list not found in DisGeNET CURATEDZGPAT gene(s) from the input list not found in DisGeNET CURATEDNXPE1 gene(s) from the input list not found in DisGeNET CURATEDRAB29 gene(s) from the input list not found in DisGeNET CURATEDC1orf74 gene(s) from the input list not found in DisGeNET CURATED Description FDR Ratio BgRatio
10 Ulcerative Colitis 1.171910e-10 7/14 63/9703
15 Enteritis 1.471861e-02 1/14 1/9703
22 Inflammatory Bowel Diseases 1.471861e-02 2/14 35/9703
41 Systemic Scleroderma 1.471861e-02 2/14 19/9703
61 Congenital chloride diarrhea 1.471861e-02 1/14 1/9703
82 Deep seated dermatophytosis 1.471861e-02 1/14 1/9703
89 Medullary cystic kidney disease 1 1.471861e-02 1/14 1/9703
91 Inflammatory Bowel Disease 14 1.471861e-02 1/14 1/9703
96 IMMUNODEFICIENCY 32A 1.471861e-02 1/14 1/9703
98 IMMUNODEFICIENCY 32B 1.471861e-02 1/14 1/9703
2 Rheumatoid Arthritis 1.655428e-02 3/14 174/9703
9 Primary biliary cirrhosis 1.690365e-02 2/14 47/9703
37 Pneumonia 1.690365e-02 2/14 54/9703
38 Lobar Pneumonia 1.690365e-02 2/14 54/9703
78 Experimental Lung Inflammation 1.690365e-02 2/14 54/9703
94 Pneumonitis 1.690365e-02 2/14 54/9703
59 Libman-Sacks Disease 1.729935e-02 2/14 58/9703
88 Candidiasis, Familial, 2 1.729935e-02 1/14 2/9703
20 Hypersensitivity 1.889484e-02 2/14 64/9703
84 Allergic Reaction 1.889484e-02 2/14 63/9703
26 Lupus Erythematosus, Systemic 2.205392e-02 2/14 71/9703
30 Mucocutaneous Lymph Node Syndrome 2.670737e-02 1/14 4/9703
81 Diffuse Scleroderma 3.191134e-02 1/14 5/9703
57 CREST Syndrome 3.520653e-02 1/14 6/9703
74 Scleroderma, Limited 3.520653e-02 1/14 6/9703
71 Pulmonary Cystic Fibrosis 4.879982e-02 1/14 9/9703
86 Fibrocystic Disease of Pancreas 4.879982e-02 1/14 9/9703
Skin
Number of cTWAS Genes in Tissue Group: 13HLA-DOB gene(s) from the input list not found in DisGeNET CURATEDC1orf74 gene(s) from the input list not found in DisGeNET CURATEDTNFRSF6B gene(s) from the input list not found in DisGeNET CURATEDIPO8 gene(s) from the input list not found in DisGeNET CURATEDTSPAN14 gene(s) from the input list not found in DisGeNET CURATEDTMEM52 gene(s) from the input list not found in DisGeNET CURATEDC1orf106 gene(s) from the input list not found in DisGeNET CURATED Description FDR Ratio BgRatio
4 Ulcerative Colitis 0.005102041 2/6 63/9703
20 Congenital chloride diarrhea 0.005102041 1/6 1/9703
28 Inflammatory Bowel Disease 14 0.005102041 1/6 1/9703
31 MYOPIA 25, AUTOSOMAL DOMINANT 0.005102041 1/6 1/9703
14 CREST Syndrome 0.015286411 1/6 6/9703
24 Scleroderma, Limited 0.015286411 1/6 6/9703
25 Diffuse Scleroderma 0.015286411 1/6 5/9703
27 clinical depression 0.015286411 1/6 6/9703
12 Systemic Scleroderma 0.042884513 1/6 19/9703
2 Behcet Syndrome 0.048690155 1/6 24/9703
Blood or Immune
Number of cTWAS Genes in Tissue Group: 7BIK gene(s) from the input list not found in DisGeNET CURATEDMRPL20 gene(s) from the input list not found in DisGeNET CURATED Description FDR Ratio BgRatio
4 Ulcerative Colitis 8.796713e-05 3/5 63/9703
19 Congenital chloride diarrhea 4.380540e-03 1/5 1/9703
27 Deep seated dermatophytosis 4.380540e-03 1/5 1/9703
32 Medullary cystic kidney disease 1 4.380540e-03 1/5 1/9703
31 Candidiasis, Familial, 2 7.007419e-03 1/5 2/9703
12 Peritoneal Neoplasms 2.404335e-02 1/5 10/9703
16 Ankylosing spondylitis 2.404335e-02 1/5 11/9703
22 Carcinomatosis of peritoneal cavity 2.404335e-02 1/5 10/9703
2 Calcinosis 4.560848e-02 1/5 42/9703
5 IGA Glomerulonephritis 4.560848e-02 1/5 34/9703
6 Heart valve disease 4.560848e-02 1/5 26/9703
8 Inflammatory Bowel Diseases 4.560848e-02 1/5 35/9703
10 Mesothelioma 4.560848e-02 1/5 41/9703
11 Multiple Myeloma 4.560848e-02 1/5 42/9703
18 Tumoral calcinosis 4.560848e-02 1/5 42/9703
23 Microcalcification 4.560848e-02 1/5 42/9703
13 Pneumonia 4.679566e-02 1/5 54/9703
14 Lobar Pneumonia 4.679566e-02 1/5 54/9703
25 Experimental Lung Inflammation 4.679566e-02 1/5 54/9703
33 Pneumonitis 4.679566e-02 1/5 54/9703
Digestive
Number of cTWAS Genes in Tissue Group: 19FAM171B gene(s) from the input list not found in DisGeNET CURATEDRAB29 gene(s) from the input list not found in DisGeNET CURATEDNXPE1 gene(s) from the input list not found in DisGeNET CURATEDRNF186 gene(s) from the input list not found in DisGeNET CURATEDTMEM89 gene(s) from the input list not found in DisGeNET CURATED Description FDR Ratio BgRatio
12 Ulcerative Colitis 1.988487e-08 6/14 63/9703
2 Rheumatoid Arthritis 1.984338e-02 3/14 174/9703
28 Inflammatory Bowel Diseases 1.984338e-02 2/14 35/9703
42 Pneumonia 1.984338e-02 2/14 54/9703
43 Lobar Pneumonia 1.984338e-02 2/14 54/9703
67 Libman-Sacks Disease 1.984338e-02 2/14 58/9703
69 Congenital chloride diarrhea 1.984338e-02 1/14 1/9703
86 Experimental Lung Inflammation 1.984338e-02 2/14 54/9703
93 Deep seated dermatophytosis 1.984338e-02 1/14 1/9703
100 Retinitis Pigmentosa 26 1.984338e-02 1/14 1/9703
101 Visceral myopathy familial external ophthalmoplegia 1.984338e-02 1/14 2/9703
103 Candidiasis, Familial, 2 1.984338e-02 1/14 2/9703
105 Inflammatory Bowel Disease 14 1.984338e-02 1/14 1/9703
106 MITOCHONDRIAL DNA DEPLETION SYNDROME 5 (ENCEPHALOMYOPATHIC WITH OR WITHOUT METHYLMALONIC ACIDURIA) 1.984338e-02 1/14 2/9703
108 Pneumonitis 1.984338e-02 2/14 54/9703
110 IMMUNODEFICIENCY 32A 1.984338e-02 1/14 1/9703
112 IMMUNODEFICIENCY 32B 1.984338e-02 1/14 1/9703
113 Mitochondrial DNA Depletion Syndrome 1 1.984338e-02 1/14 2/9703
27 Hypersensitivity 2.167350e-02 2/14 64/9703
95 Allergic Reaction 2.167350e-02 2/14 63/9703
37 Meniere Disease 2.299159e-02 1/14 3/9703
85 MITOCHONDRIAL NEUROGASTROINTESTINAL ENCEPHALOPATHY SYNDROME 2.299159e-02 1/14 3/9703
34 Lupus Erythematosus, Systemic 2.309739e-02 2/14 71/9703
38 Mucocutaneous Lymph Node Syndrome 2.808201e-02 1/14 4/9703
89 Diffuse Scleroderma 3.367585e-02 1/14 5/9703
41 Pancreatic Neoplasm 3.562893e-02 2/14 100/9703
66 CREST Syndrome 3.562893e-02 1/14 6/9703
81 Scleroderma, Limited 3.562893e-02 1/14 6/9703
104 clinical depression 3.562893e-02 1/14 6/9703
77 Malignant neoplasm of pancreas 3.578089e-02 2/14 102/9703
78 Pulmonary Cystic Fibrosis 4.722997e-02 1/14 9/9703
97 Fibrocystic Disease of Pancreas 4.722997e-02 1/14 9/9703Gene sets curated by Macarthur Lab
gene_set_dir <- "/project2/mstephens/wcrouse/gene_sets/"
gene_set_files <- c("gwascatalog.tsv",
                    "mgi_essential.tsv",
                    "core_essentials_hart.tsv",
                    "clinvar_path_likelypath.tsv",
                    "fda_approved_drug_targets.tsv")

for (group in names(df_group)){
  cat(paste0(group, "\n\n"))

  ctwas_genes_group <- df_group[[group]]$ctwas
  background_group <- df_group[[group]]$background

  cat(paste0("Number of cTWAS Genes in Tissue Group: ", length(ctwas_genes_group), "\n\n"))

  gene_sets <- lapply(gene_set_files, function(x){as.character(read.table(paste0(gene_set_dir, x))[,1])})
  names(gene_sets) <- sapply(gene_set_files, function(x){unlist(strsplit(x, "[.]"))[1]})

  gene_lists <- list(ctwas_genes_group=ctwas_genes_group)

  #genes in gene_sets filtered to ensure inclusion in background
  gene_sets <- lapply(gene_sets, function(x){x[x %in% background_group]})

  #hypergeometric test
  hyp_score <- data.frame()
  size <- c()
  ngenes <- c()

  for (i in 1:length(gene_sets)) {
    for (j in 1:length(gene_lists)){
      group1 <- length(gene_sets[[i]])
      group2 <- length(as.vector(gene_lists[[j]]))
      size <- c(size, group1)
      Overlap <- length(intersect(gene_sets[[i]],as.vector(gene_lists[[j]])))
      ngenes <- c(ngenes, Overlap)
      Total <- length(background_group)
      hyp_score[i,j] <- phyper(Overlap-1, group2, Total-group2, group1,lower.tail=F)
    }
  }
  rownames(hyp_score) <- names(gene_sets)
  colnames(hyp_score) <- names(gene_lists)

  #multiple testing correction
  hyp_score_padj <- apply(hyp_score,2, p.adjust, method="BH", n=(nrow(hyp_score)*ncol(hyp_score)))
  hyp_score_padj <- as.data.frame(hyp_score_padj)
  hyp_score_padj$gene_set <- rownames(hyp_score_padj)
  hyp_score_padj$nset <- size
  hyp_score_padj$ngenes <- ngenes
  hyp_score_padj$percent <- ngenes/size

  hyp_score_padj <- hyp_score_padj[order(hyp_score_padj$ctwas_genes),]
  colnames(hyp_score_padj)[1] <- "padj"
  hyp_score_padj <- hyp_score_padj[,c(2:5,1)]
  rownames(hyp_score_padj)<- NULL

  print(hyp_score_padj)

  cat("\n")
}
Adipose
Number of cTWAS Genes in Tissue Group: 9
gene_set nset ngenes percent padj
1 gwascatalog 4574 6 0.0013117621 0.2660360
2 mgi_essential 1716 3 0.0017482517 0.2660360
3 fda_approved_drug_targets 257 1 0.0038910506 0.2760778
4 clinvar_path_likelypath 2135 2 0.0009367681 0.5665855
5 core_essentials_hart 207 0 0.0000000000 1.0000000
Endocrine
Number of cTWAS Genes in Tissue Group: 14
gene_set nset ngenes percent padj
1 gwascatalog 5394 11 0.0020393029 0.00578425
2 mgi_essential 2023 1 0.0004943154 1.00000000
3 core_essentials_hart 236 0 0.0000000000 1.00000000
4 clinvar_path_likelypath 2488 3 0.0012057878 1.00000000
5 fda_approved_drug_targets 305 0 0.0000000000 1.00000000
Cardiovascular
Number of cTWAS Genes in Tissue Group: 8
gene_set nset ngenes percent padj
1 gwascatalog 5192 7 0.0013482280 0.02090929
2 fda_approved_drug_targets 287 1 0.0034843206 0.37015143
3 mgi_essential 1969 1 0.0005078720 0.95772755
4 clinvar_path_likelypath 2404 1 0.0004159734 0.95772755
5 core_essentials_hart 241 0 0.0000000000 1.00000000
CNS
Number of cTWAS Genes in Tissue Group: 17
gene_set nset ngenes percent padj
1 gwascatalog 5425 12 0.0022119816 0.01688629
2 fda_approved_drug_targets 316 1 0.0031645570 0.74657099
3 mgi_essential 2090 2 0.0009569378 0.86995501
4 clinvar_path_likelypath 2529 3 0.0011862396 0.86995501
5 core_essentials_hart 244 0 0.0000000000 1.00000000
None
Number of cTWAS Genes in Tissue Group: 22
gene_set nset ngenes percent padj
1 gwascatalog 5633 15 0.0026628795 0.009239608
2 clinvar_path_likelypath 2608 5 0.0019171779 0.724455417
3 mgi_essential 2146 2 0.0009319664 1.000000000
4 core_essentials_hart 255 0 0.0000000000 1.000000000
5 fda_approved_drug_targets 323 0 0.0000000000 1.000000000
Skin
Number of cTWAS Genes in Tissue Group: 13
gene_set nset ngenes percent padj
1 gwascatalog 5103 8 0.0015677053 0.2547662
2 fda_approved_drug_targets 276 1 0.0036231884 0.5586318
3 mgi_essential 1922 2 0.0010405827 0.8942327
4 core_essentials_hart 228 0 0.0000000000 1.0000000
5 clinvar_path_likelypath 2341 1 0.0004271679 1.0000000
Blood or Immune
Number of cTWAS Genes in Tissue Group: 7
gene_set nset ngenes percent padj
1 gwascatalog 4762 5 0.0010499790 0.2306809
2 clinvar_path_likelypath 2189 3 0.0013704888 0.2306809
3 mgi_essential 1774 1 0.0005636979 1.0000000
4 core_essentials_hart 217 0 0.0000000000 1.0000000
5 fda_approved_drug_targets 254 0 0.0000000000 1.0000000
Digestive
Number of cTWAS Genes in Tissue Group: 19
gene_set nset ngenes percent padj
1 gwascatalog 5398 15 0.0027788070 0.0006906302
2 clinvar_path_likelypath 2491 6 0.0024086712 0.1283372461
3 fda_approved_drug_targets 308 2 0.0064935065 0.1283372461
4 mgi_essential 2053 2 0.0009741841 0.9355072846
5 core_essentials_hart 244 0 0.0000000000 1.0000000000Analysis of TWAS False Positives by Region
library(ggplot2)

pip_threshold <- 0.5

df_plot <- data.frame(Outcome=c("SNPs", "Genes", "Both", "Neither"), Frequency=rep(0,4))

for (i in 1:length(df)){
  gene_pips <- df[[i]]$gene_pips[df[[i]]$gene_pips$genename %in% df[[i]]$twas,,drop=F]
  gene_pips <- gene_pips[gene_pips$susie_pip < pip_threshold,,drop=F]

  region_pips <- df[[i]]$region_pips
  rownames(region_pips) <- region_pips$region

  gene_pips <- cbind(gene_pips, t(sapply(gene_pips$region_tag, function(x){unlist(region_pips[x,c("gene_pip", "snp_pip")])})))
  gene_pips$gene_pip <- gene_pips$gene_pip - gene_pips$susie_pip #subtract gene pip from region total to get combined pip for other genes in region

  df_plot$Frequency[df_plot$Outcome=="Neither"] <- df_plot$Frequency[df_plot$Outcome=="Neither"] + sum(gene_pips$gene_pip < 0.5 & gene_pips$snp_pip < 0.5)
  df_plot$Frequency[df_plot$Outcome=="Both"] <- df_plot$Frequency[df_plot$Outcome=="Both"] + sum(gene_pips$gene_pip > 0.5 & gene_pips$snp_pip > 0.5)
  df_plot$Frequency[df_plot$Outcome=="SNPs"] <- df_plot$Frequency[df_plot$Outcome=="SNPs"] + sum(gene_pips$gene_pip < 0.5 & gene_pips$snp_pip > 0.5)
  df_plot$Frequency[df_plot$Outcome=="Genes"] <- df_plot$Frequency[df_plot$Outcome=="Genes"] + sum(gene_pips$gene_pip > 0.5 & gene_pips$snp_pip < 0.5)
}

pie <- ggplot(df_plot, aes(x="", y=Frequency, fill=Outcome)) + geom_bar(width = 1, stat = "identity")
pie <- pie + coord_polar("y", start=0) + theme_minimal() + theme(axis.title.y=element_blank())
pie
| Version | Author | Date |
|---|---|---|
| 0136d2e | wesleycrouse | 2022-06-10 |
Analysis of TWAS False Positives by Credible Set
cTWAS is using susie settings that mask credible sets consisting of variables with minimum pairwise correlations below a specified threshold. The default threshold is 0.5. I think this is intended to mask credible sets with “diffuse” support. As a consequence, many of the genes considered here (TWAS false positives; significant z score but low PIP) are not assigned to a credible set (have cs_index=0). For this reason, the first figure is not really appropriate for answering the question “are TWAS false positives due to SNPs or genes”.
The second figure includes only TWAS genes that are assigned to a reported causal set (i.e. they are in a “pure” causal set with high pairwise correlations). I think that this figure is closer to the intended analysis. However, it may be biased in some way because we have excluded many TWAS false positive genes that are in “impure” credible sets.
Some alternatives to these figures include the region-based analysis in the previous section; or re-analysis with lower/no minimum pairwise correlation threshold (“min_abs_corr” option in susie_get_cs) for reporting credible sets.
library(ggplot2)

####################
#using only genes assigned to a credible set

pip_threshold <- 0.5

df_plot <- data.frame(Outcome=c("SNPs", "Genes", "Both", "Neither"), Frequency=rep(0,4))

for (i in 1:length(df)){
  gene_pips <- df[[i]]$gene_pips[df[[i]]$gene_pips$genename %in% df[[i]]$twas,,drop=F]
  gene_pips <- gene_pips[gene_pips$susie_pip < pip_threshold,,drop=F]

  #exclude genes that are not assigned to a credible set, cs_index==0
  gene_pips <- gene_pips[as.numeric(sapply(gene_pips$region_cs_tag, function(x){rev(unlist(strsplit(x, "_")))[1]}))!=0,]

  region_cs_pips <- df[[i]]$region_cs_pips
  rownames(region_cs_pips) <- region_cs_pips$region_cs

  gene_pips <- cbind(gene_pips, t(sapply(gene_pips$region_cs_tag, function(x){unlist(region_cs_pips[x,c("gene_pip", "snp_pip")])})))
  gene_pips$gene_pip <- gene_pips$gene_pip - gene_pips$susie_pip #subtract gene pip from causal set total to get combined pip for other genes in causal set

  plot_cutoff <- 0.5

  df_plot$Frequency[df_plot$Outcome=="Neither"] <- df_plot$Frequency[df_plot$Outcome=="Neither"] + sum(gene_pips$gene_pip < plot_cutoff & gene_pips$snp_pip < plot_cutoff)
  df_plot$Frequency[df_plot$Outcome=="Both"] <- df_plot$Frequency[df_plot$Outcome=="Both"] + sum(gene_pips$gene_pip > plot_cutoff & gene_pips$snp_pip > plot_cutoff)
  df_plot$Frequency[df_plot$Outcome=="SNPs"] <- df_plot$Frequency[df_plot$Outcome=="SNPs"] + sum(gene_pips$gene_pip < plot_cutoff & gene_pips$snp_pip > plot_cutoff)
  df_plot$Frequency[df_plot$Outcome=="Genes"] <- df_plot$Frequency[df_plot$Outcome=="Genes"] + sum(gene_pips$gene_pip > plot_cutoff & gene_pips$snp_pip < plot_cutoff)
}

pie <- ggplot(df_plot, aes(x="", y=Frequency, fill=Outcome)) + geom_bar(width = 1, stat = "identity")
pie <- pie + coord_polar("y", start=0) + theme_minimal() + theme(axis.title.y=element_blank())
pie
| Version | Author | Date |
|---|---|---|
| 0136d2e | wesleycrouse | 2022-06-10 |
cTWAS genes without genome-wide significant SNP nearby
novel_genes <- data.frame(genename=as.character(), weight=as.character(), susie_pip=as.numeric(), snp_maxz=as.numeric())

for (i in 1:length(df)){
  gene_pips <- df[[i]]$gene_pips[df[[i]]$gene_pips$genename %in% df[[i]]$ctwas,,drop=F]

  region_pips <- df[[i]]$region_pips
  rownames(region_pips) <- region_pips$region

  gene_pips <- cbind(gene_pips, sapply(gene_pips$region_tag, function(x){region_pips[x,"snp_maxz"]}))
  names(gene_pips)[ncol(gene_pips)] <- "snp_maxz"

  if (nrow(gene_pips)>0){
    gene_pips$weight <- names(df)[i]
    gene_pips <- gene_pips[gene_pips$snp_maxz < qnorm(1-(5E-8/2), lower=T),c("genename", "weight", "susie_pip", "snp_maxz")]

    novel_genes <- rbind(novel_genes, gene_pips)
  }
}

novel_genes_summary <- data.frame(genename=unique(novel_genes$genename))
novel_genes_summary$nweights <- sapply(novel_genes_summary$genename, function(x){length(novel_genes$weight[novel_genes$genename==x])})
novel_genes_summary$weights <- sapply(novel_genes_summary$genename, function(x){paste(novel_genes$weight[novel_genes$genename==x],collapse=", ")})

novel_genes_summary <- novel_genes_summary[order(-novel_genes_summary$nweights),]
novel_genes_summary[,c("genename","nweights")]
genename nweights
2 LSP1 14
5 RAB29 11
3 PRKD2 7
8 CXCL5 7
7 MUC1 6
9 C1orf74 5
1 ZNF736 3
6 ITGAL 3
10 ERAP1 2
4 LRP5L 1
11 TSPAN14 1
12 IPO8 1
13 CERKL 1
14 FAM171B 1
15 TMEM52 1
16 FOSL2 1
17 P4HA2 1
18 COQ8A 1
19 MED16 1
20 MRPL20 1
21 BIK 1Tissue-specificity for cTWAS genes
gene_pips_by_weight <- data.frame(genename=as.character(ctwas_genes))

for (i in 1:length(df)){
  gene_pips <- df[[i]]$gene_pips
  gene_pips <- gene_pips[match(ctwas_genes, gene_pips$genename),,drop=F]

  gene_pips_by_weight <- cbind(gene_pips_by_weight, gene_pips$susie_pip)
  names(gene_pips_by_weight)[ncol(gene_pips_by_weight)] <- names(df)[i]
}

gene_pips_by_weight <- as.matrix(gene_pips_by_weight[,-1])
rownames(gene_pips_by_weight) <- ctwas_genes

#handing missing values
gene_pips_by_weight_bkup <- gene_pips_by_weight
gene_pips_by_weight[is.na(gene_pips_by_weight)] <- 0

#number of tissues with PIP>0.5 for cTWAS genes
ctwas_frequency <- rowSums(gene_pips_by_weight>0.5)
hist(ctwas_frequency, col="grey", breaks=0:max(ctwas_frequency), xlim=c(0,ncol(gene_pips_by_weight)),
     xlab="Number of Tissues with PIP>0.5",
     ylab="Number of cTWAS Genes",
     main="Tissue Specificity for cTWAS Genes")
| Version | Author | Date |
|---|---|---|
| 0136d2e | wesleycrouse | 2022-06-10 |
#heatmap of gene PIPs
cluster_ctwas_genes <- hclust(dist(gene_pips_by_weight))
cluster_ctwas_weights <- hclust(dist(t(gene_pips_by_weight)))

plot(cluster_ctwas_weights, cex=0.6)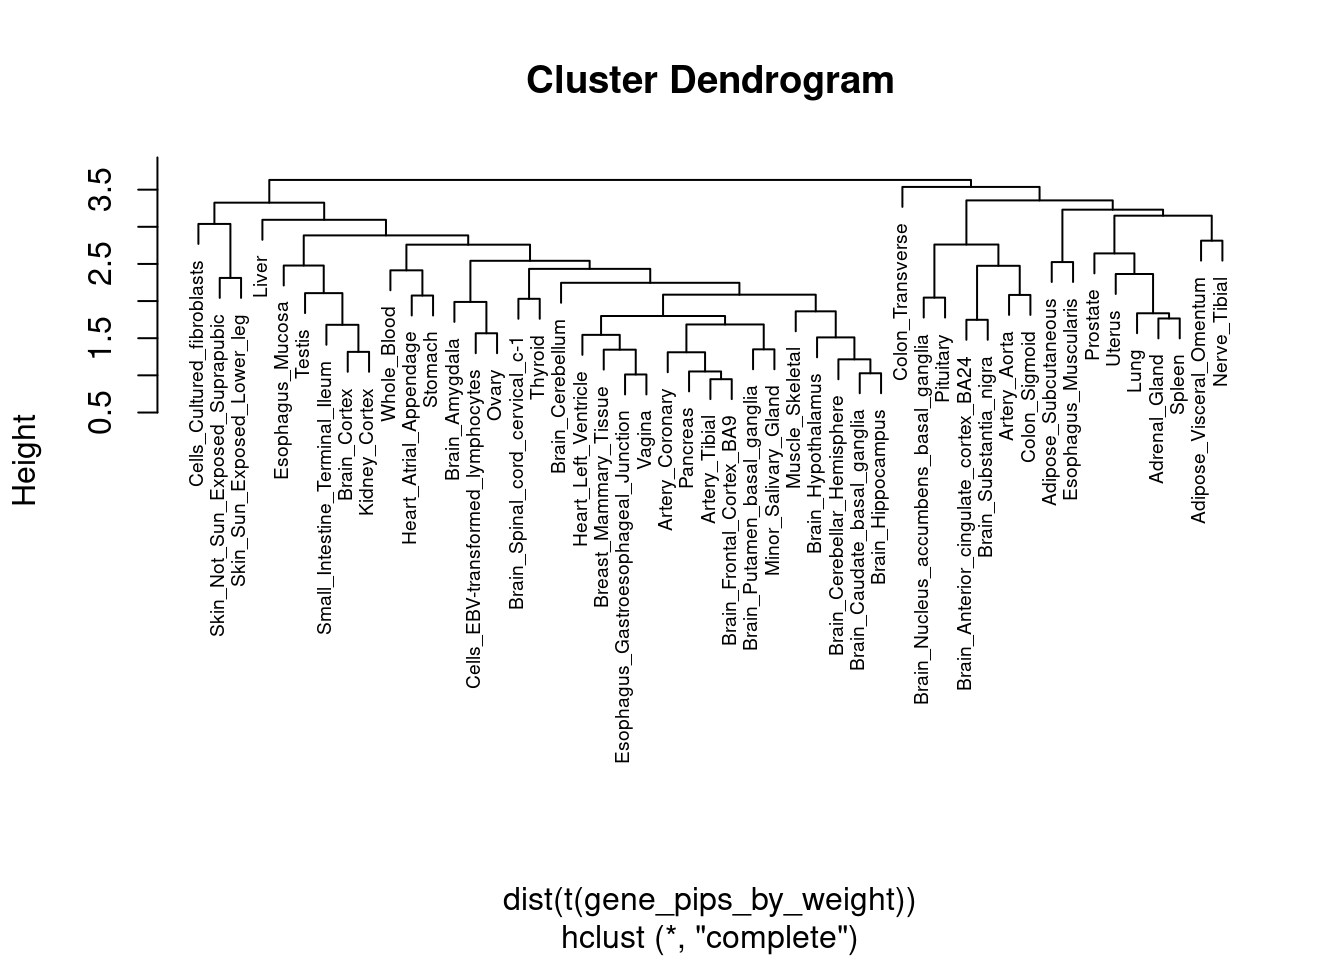
| Version | Author | Date |
|---|---|---|
| 0136d2e | wesleycrouse | 2022-06-10 |
plot(cluster_ctwas_genes, cex=0.6, labels=F)
| Version | Author | Date |
|---|---|---|
| 0136d2e | wesleycrouse | 2022-06-10 |
par(mar=c(14.1, 4.1, 4.1, 2.1))

image(t(gene_pips_by_weight[rev(cluster_ctwas_genes$order),rev(cluster_ctwas_weights$order)]),
      axes=F)
mtext(text=colnames(gene_pips_by_weight)[cluster_ctwas_weights$order], side=1, line=0.3, at=seq(0,1,1/(ncol(gene_pips_by_weight)-1)), las=2, cex=0.8)
mtext(text=rownames(gene_pips_by_weight)[cluster_ctwas_genes$order], side=2, line=0.3, at=seq(0,1,1/(nrow(gene_pips_by_weight)-1)), las=1, cex=0.4)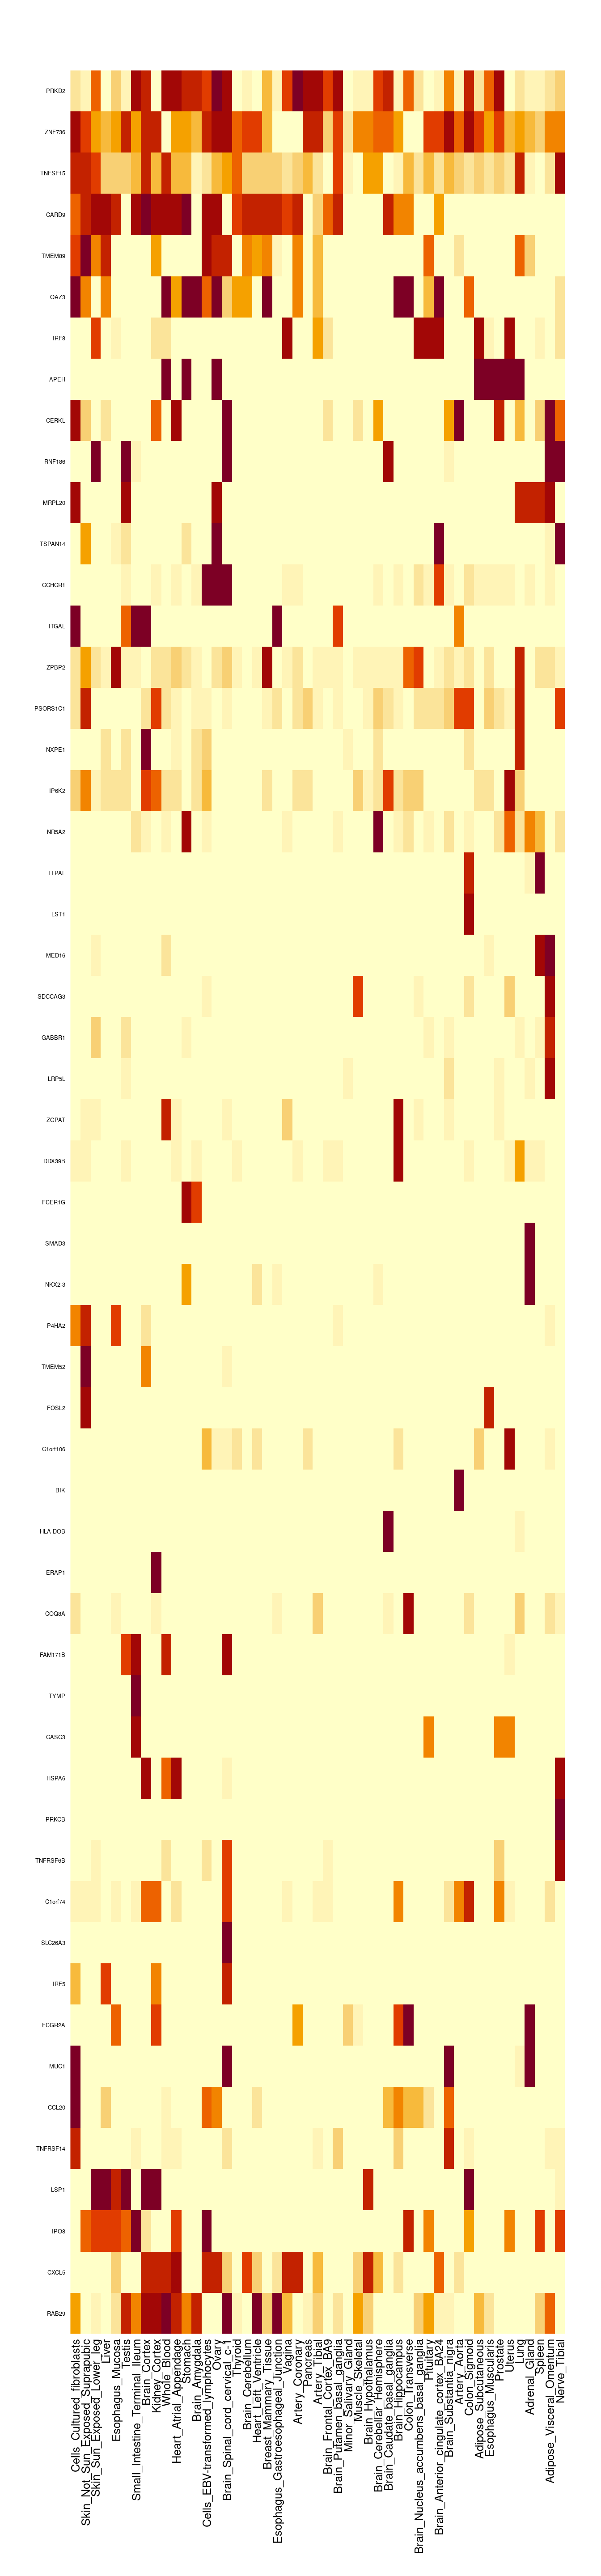
| Version | Author | Date |
|---|---|---|
| 0136d2e | wesleycrouse | 2022-06-10 |
cTWAS genes with highest proportion of total PIP on a single tissue
#genes with highest proportion of PIP on a single tissue
gene_pips_proportion <- gene_pips_by_weight/rowSums(gene_pips_by_weight)

proportion_table <- data.frame(genename=as.character(rownames(gene_pips_proportion)))
proportion_table$max_pip_prop <- apply(gene_pips_proportion,1,max)
proportion_table$max_weight <- colnames(gene_pips_proportion)[apply(gene_pips_proportion,1,which.max)]

proportion_table[order(-proportion_table$max_pip_prop),]
genename max_pip_prop max_weight
38 DDX39B 0.99990083 Liver
27 CCHCR1 0.99924862 Cells_Cultured_fibroblasts
30 RNF186 0.99213148 Colon_Transverse
42 PSORS1C1 0.92345876 Prostate
37 LST1 0.89962609 Heart_Atrial_Appendage
17 TTPAL 0.74339215 Brain_Cerebellum
1 NR5A2 0.69156490 Adipose_Subcutaneous
55 BIK 0.62203331 Whole_Blood
48 HLA-DOB 0.51235363 Skin_Sun_Exposed_Lower_leg
7 GABBR1 0.45025885 Adipose_Visceral_Omentum
25 FCER1G 0.45021312 Brain_Substantia_nigra
8 SDCCAG3 0.43533733 Adipose_Visceral_Omentum
39 ZGPAT 0.41973495 Liver
43 ZPBP2 0.34615724 Prostate
45 C1orf106 0.34592531 Skin_Not_Sun_Exposed_Suprapubic
46 FOSL2 0.34146849 Skin_Not_Sun_Exposed_Suprapubic
47 P4HA2 0.34007617 Skin_Not_Sun_Exposed_Suprapubic
52 NKX2-3 0.32991991 Thyroid
44 TMEM52 0.27346784 Skin_Not_Sun_Exposed_Suprapubic
31 CERKL 0.27191313 Colon_Transverse
28 TSPAN14 0.26087355 Cells_Cultured_fibroblasts
32 NXPE1 0.25821835 Colon_Transverse
51 MED16 0.25804658 Testis
49 TMEM89 0.23991758 Stomach
12 ITGAL 0.23914327 Esophagus_Muscularis
53 SMAD3 0.23332186 Thyroid
36 FAM171B 0.23014932 Esophagus_Muscularis
23 IP6K2 0.22271034 Brain_Spinal_cord_cervical_c-1
15 TNFRSF6B 0.22024392 Brain_Amygdala
9 LRP5L 0.21427981 Adipose_Visceral_Omentum
33 IRF8 0.19719805 Colon_Transverse
24 APEH 0.17924531 Brain_Spinal_cord_cervical_c-1
35 HSPA6 0.16463895 Esophagus_Muscularis
40 OAZ3 0.16451408 Nerve_Tibial
22 PRKCB 0.15945890 Brain_Nucleus_accumbens_basal_ganglia
16 SLC26A3 0.15779424 Skin_Not_Sun_Exposed_Suprapubic
21 C1orf74 0.15079889 Skin_Not_Sun_Exposed_Suprapubic
26 ERAP1 0.13969079 Heart_Left_Ventricle
18 FCGR2A 0.12390753 Brain_Nucleus_accumbens_basal_ganglia
3 CARD9 0.12181476 Spleen
54 MRPL20 0.12051367 Whole_Blood
13 MUC1 0.11482084 Cells_EBV-transformed_lymphocytes
11 IRF5 0.10288050 Skin_Not_Sun_Exposed_Suprapubic
50 COQ8A 0.09986164 Testis
41 TNFSF15 0.09464844 Prostate
20 CASC3 0.09173034 Lung
6 TNFRSF14 0.08945783 Adipose_Visceral_Omentum
34 TYMP 0.08561483 Esophagus_Mucosa
2 ZNF736 0.07604613 Artery_Aorta
14 CCL20 0.06875547 Brain_Spinal_cord_cervical_c-1
5 PRKD2 0.06603934 Colon_Transverse
29 IPO8 0.05146863 Cells_Cultured_fibroblasts
4 LSP1 0.04615918 Esophagus_Muscularis
10 RAB29 0.04232146 Brain_Putamen_basal_ganglia
19 CXCL5 0.03365665 Colon_Transversesave.image("workspace6.RData")Genes nearby and nearest to GWAS peaks
#####load positions for all genes on autosomes in ENSEMBL, subset to only protein coding and lncRNA with non-missing HGNC symbol
library(biomaRt)

ensembl <- useEnsembl(biomart="ENSEMBL_MART_ENSEMBL", dataset="hsapiens_gene_ensembl")
G_list <- getBM(filters= "chromosome_name", attributes= c("hgnc_symbol","chromosome_name","start_position","end_position","gene_biotype", "ensembl_gene_id"), values=1:22, mart=ensembl)

save(G_list, file=paste0("G_list_", trait_id, ".RData"))
load(paste0("G_list_", trait_id, ".RData"))

G_list <- G_list[G_list$gene_biotype %in% c("protein_coding"),]
G_list$hgnc_symbol[G_list$hgnc_symbol==""] <- "-"

#####load z scores from the analysis and add positions from the LD reference
# results_dir <- results_dirs[1]
# load(paste0(results_dir, "/", analysis_id, "_expr_z_snp.Rd"))
#
# LDR_dir <- "/project2/mstephens/wcrouse/UKB_LDR_0.1/"
# LDR_files <- list.files(LDR_dir)
# LDR_files <- LDR_files[grep(".Rvar" ,LDR_files)]
#
# z_snp$chrom <- as.integer(NA)
# z_snp$pos <- as.integer(NA)
#
# for (i in 1:length(LDR_files)){
#   print(i)
#
#   LDR_info <- read.table(paste0(LDR_dir, LDR_files[i]), header=T)
#   z_snp_index <- which(z_snp$id %in% LDR_info$id)
#   z_snp[z_snp_index,c("chrom", "pos")] <- t(sapply(z_snp_index, function(x){unlist(LDR_info[match(z_snp$id[x], LDR_info$id),c("chrom", "pos")])}))
# }
#
# z_snp <- z_snp[,c("id", "z", "chrom","pos")]
# save(z_snp, file=paste0("z_snp_pos_", trait_id, ".RData"))
load(paste0("z_snp_pos_", trait_id, ".RData"))

####################
#identify genes within 500kb of genome-wide significant variant ("nearby")
G_list$nearby <- NA

window_size <- 500000

for (chr in 1:22){
  #index genes on chromosome
  G_list_index <- which(G_list$chromosome_name==chr)

  #subset z_snp to chromosome, then subset to significant genome-wide significant variants
  z_snp_chr <- z_snp[z_snp$chrom==chr,,drop=F]
  z_snp_chr <- z_snp_chr[abs(z_snp_chr$z)>qnorm(1-(5E-8/2), lower=T),,drop=F]

  #iterate over genes on chromsome and check if a genome-wide significant SNP is within the window
  for (i in G_list_index){
    window_start <- G_list$start_position[i] - window_size
    window_end <- G_list$end_position[i] + window_size
    G_list$nearby[i] <- any(z_snp_chr$pos>=window_start & z_snp_chr$pos<=window_end)
  }
}

####################
#identify genes that are nearest to lead genome-wide significant variant ("nearest")
G_list$nearest <- F
G_list$distance <- Inf
G_list$which_nearest <- NA

window_size <- 500000

n_peaks <- 0

for (chr in 1:22){
  #index genes on chromosome
  G_list_index <- which(G_list$chromosome_name==chr & G_list$gene_biotype=="protein_coding")

  #subset z_snp to chromosome, then subset to significant genome-wide significant variants
  z_snp_chr <- z_snp[z_snp$chrom==chr,,drop=F]
  z_snp_chr <- z_snp_chr[abs(z_snp_chr$z)>qnorm(1-(5E-8/2), lower=T),,drop=F]

  while (nrow(z_snp_chr)>0){
    n_peaks <- n_peaks + 1

    lead_index <- which.max(abs(z_snp_chr$z))
    lead_position <- z_snp_chr$pos[lead_index]

    distances <- sapply(G_list_index, function(i){
      if (lead_position >= G_list$start_position[i] & lead_position <= G_list$end_position[i]){
        distance <- 0
      } else {
        distance <- min(abs(G_list$start_position[i] - lead_position), abs(G_list$end_position[i] - lead_position))
      }
      distance
    })

    min_distance <- min(distances)

    G_list$nearest[G_list_index[distances==min_distance]] <- T

    nearest_genes <- paste0(G_list$hgnc_symbol[G_list_index[distances==min_distance]], collapse=", ")

    update_index <- which(G_list$distance[G_list_index] > distances)
    G_list$distance[G_list_index][update_index] <- distances[update_index]
    G_list$which_nearest[G_list_index][update_index] <- nearest_genes

    window_start <- lead_position - window_size
    window_end <- lead_position + window_size
    z_snp_chr <- z_snp_chr[!(z_snp_chr$pos>=window_start & z_snp_chr$pos<=window_end),,drop=F]
  }
}

G_list$distance[G_list$distance==Inf] <- NA

#report number of GWAS peaks
sum(n_peaks)
[1] 64Enrichment analysis using known IBD genes from ABC paper
known_genes <- data.table::fread("nasser_2021_ABC_IBD_genes.txt")
known_genes <- unique(known_genes$KnownGene)

# dbs <- c("GO_Biological_Process_2021")
# GO_enrichment <- enrichr(known_genes, dbs)
#
# for (db in dbs){
#   cat(paste0(db, "\n\n"))
#   enrich_results <- GO_enrichment[[db]]
#   enrich_results <- enrich_results[enrich_results$Adjusted.P.value<0.05,c("Term", "Overlap", "Adjusted.P.value", "Genes")]
#   print(enrich_results)
#   print(plotEnrich(GO_enrichment[[db]]))
# }
#
# save(enrich_results, file="ABC_IBD_genes_enrichment.RData")
# write.csv(enrich_results, file="ABC_IBD_genes_enrichment.csv")

enrich_results <- as.data.frame(data.table::fread("ABC_IBD_genes_enrichment.csv"))

#report number of known IBD genes in annotations
length(known_genes)
[1] 26Summary table for selected tissue groups
#mapping genename to ensembl
genename_mapping <- data.frame(genename=as.character(), ensembl_id=as.character(), weight=as.character())

for (i in 1:length(results_dirs)){
  results_dir <- results_dirs[i]
  weight <- rev(unlist(strsplit(results_dir, "/")))[1]
  analysis_id <- paste(trait_id, weight, sep="_")

  sqlite <- RSQLite::dbDriver("SQLite")
  db = RSQLite::dbConnect(sqlite, paste0("/project2/mstephens/wcrouse/predictdb_nolnc/mashr_", weight, ".db"))
  query <- function(...) RSQLite::dbGetQuery(db, ...)
  gene_info <- query("select gene, genename, gene_type from extra")
  RSQLite::dbDisconnect(db)

  genename_mapping <- rbind(genename_mapping, cbind(gene_info[,c("gene","genename")],weight))
}

genename_mapping <- genename_mapping[,c("gene","genename"),drop=F]
genename_mapping <- genename_mapping[!duplicated(genename_mapping),]
selected_groups <- c("Blood or Immune", "Digestive")
selected_genes <- unique(unlist(sapply(df_group[selected_groups], function(x){x$ctwas})))
weight_groups <- weight_groups[order(weight_groups$group),]
selected_weights <- weight_groups$weight[weight_groups$group %in% selected_groups]
gene_pips_by_weight <- gene_pips_by_weight_bkup
results_table <- as.data.frame(round(gene_pips_by_weight[selected_genes,selected_weights],3))
results_table$n_discovered <- apply(results_table>0.8,1,sum,na.rm=T)
results_table$n_imputed <- apply(results_table, 1, function(x){sum(!is.na(x))-1})
results_table$ensembl_gene_id <- genename_mapping$gene[sapply(rownames(results_table), match, table=genename_mapping$genename)]
results_table$ensembl_gene_id <- sapply(results_table$ensembl_gene_id, function(x){unlist(strsplit(x, "[.]"))[1]})
results_table <- cbind(results_table, G_list[sapply(results_table$ensembl_gene_id, match, table=G_list$ensembl_gene_id),c("chromosome_name","start_position","end_position","nearby","nearest","distance","which_nearest")])
results_table$known <- rownames(results_table) %in% known_genes
load("group_enrichment_results.RData")
group_enrichment_results$group <- as.character(group_enrichment_results$group)
group_enrichment_results$db <- as.character(group_enrichment_results$db)
group_enrichment_results <- group_enrichment_results[group_enrichment_results$group %in% selected_groups,,drop=F]
results_table$enriched_terms <- sapply(rownames(results_table), function(x){paste(group_enrichment_results$Term[grep(x, group_enrichment_results$Genes)],collapse="; ")})
write.csv(results_table, file=paste0("summary_table_ulcerative_colitis_nolnc.csv"))Overlap of enrichment analysis
#collect GO terms for selected genes
db <- "GO_Biological_Process_2021"
GO_enrichment <- enrichr(selected_genes, db)
Uploading data to Enrichr... Done.
Querying GO_Biological_Process_2021... Done.
Parsing results... Done.enrich_results_selected_genes <- GO_enrichment[[db]]
load("ABC_IBD_genes_enrichment.RData")
enrich_results_known_genes <- enrich_results
overlap_table <- as.data.frame(matrix(F, nrow(enrich_results_known_genes), length(selected_genes)))
overlap_table <- cbind(enrich_results_known_genes$Term, overlap_table)
colnames(overlap_table) <- c("Term", selected_genes)
for (i in 1:nrow(overlap_table)){
Term <- overlap_table$Term[i]
if (Term %in% enrich_results_selected_genes$Term){
Term_genes <- enrich_results_selected_genes$Genes[enrich_results_selected_genes$Term==Term]
overlap_table[i, unlist(strsplit(Term_genes, ";"))] <- T
}
}
write.csv(overlap_table, file="GO_overlap_ulcerative_colitis_nolnc.csv")Results and figures for the paper
Gene expression explains a small proportion of heritability
Note that the published MESC results in Yao et al. analyzed the same traits from Finucane 2015, which used ulcerative colitis summary statistics from Jostin’s 2012. We used more recent results from de Lange 2017. MESC also used prediction models from GTEx v7 while we used prediction models from GTEx v8.
Trend lines are fit with (red) and without (blue) an intercept.
library(ggrepel)

mesc_results <- as.data.frame(readxl::read_xlsx("MESC_published_results.xlsx", sheet="Table S4", skip=1))
mesc_results <- mesc_results[mesc_results$Trait %in% "Ulcerative Colitis",]
rownames(mesc_results) <- mesc_results$`Expression score tissue`
mesc_results <- mesc_results[sapply(selected_weights, function(x){paste(unlist(strsplit(x,"_")),collapse=" ")}),]


output$pve_med <- output$pve_g / (output$pve_g + output$pve_s)
rownames(output) <- output$weight
df_plot <- output[selected_weights,]

df_plot <- data.frame(tissue=as.character(mesc_results$`Expression score tissue`),  mesc=as.numeric(mesc_results$`h2med/h2g`), ctwas=(df_plot$pve_med))

p <- ggplot(df_plot, aes(mesc, ctwas, label = tissue)) + geom_point(color = "blue", size=3)
p <- p + geom_text_repel() + labs(title = "Heritability Explained by Gene Expression in Tissues") + ylab("(Gene PVE) / (Total PVE) using cTWAS") + xlab("(h2med) / (h2g) using MESC")
p <- p + geom_abline(slope=1, intercept=0, linetype=3)
p <- p + xlim(0,0.2) + ylim(0,0.2)

fit <- lm(ctwas~0+mesc, data=df_plot)
p <- p + geom_abline(slope=summary(fit)$coefficients["mesc","Estimate"], intercept=0, linetype=2, color="blue")

fit <- lm(ctwas~mesc, data=df_plot)
p <- p + geom_abline(slope=summary(fit)$coefficients["mesc","Estimate"], intercept=summary(fit)$coefficients["(Intercept)","Estimate"], linetype=3, color="red")

p <- p + theme_bw()

p

#report correlation between cTWAS and MESC
cor(df_plot$mesc, df_plot$ctwas)
cTWAS finds fewer genes than TWAS
Trend lines are fit with (red) and without (blue) an intercept.
library(ggrepel)

df_plot <- output
#df_plot <- df_plot[selected_weights,,drop=F]
df_plot$tissue <- sapply(df_plot$weight, function(x){paste(unlist(strsplit(x,"_")),collapse=" ")})

p <- ggplot(df_plot, aes(n_twas, n_ctwas, label = tissue)) + geom_point(color = "blue", size=3)
p <- p + geom_text_repel(size=3) + labs(title = "Number of Genes Discovered using cTWAS and TWAS by Tissue") + ylab("Number of cTWAS genes") + xlab("Number of TWAS genes")
p <- p + scale_y_continuous(breaks=seq(0,max(df_plot$n_ctwas),2))
p <- p + scale_x_continuous(breaks=seq(0,max(df_plot$n_twas),5))
p <- p + theme_bw()

fit <- lm(n_ctwas~0+n_twas, data=df_plot)
p <- p + geom_abline(slope=summary(fit)$coefficients["n_twas","Estimate"], intercept=0, linetype=2, color="blue")

p
Warning: ggrepel: 6 unlabeled data points (too many overlaps). Consider increasing max.overlaps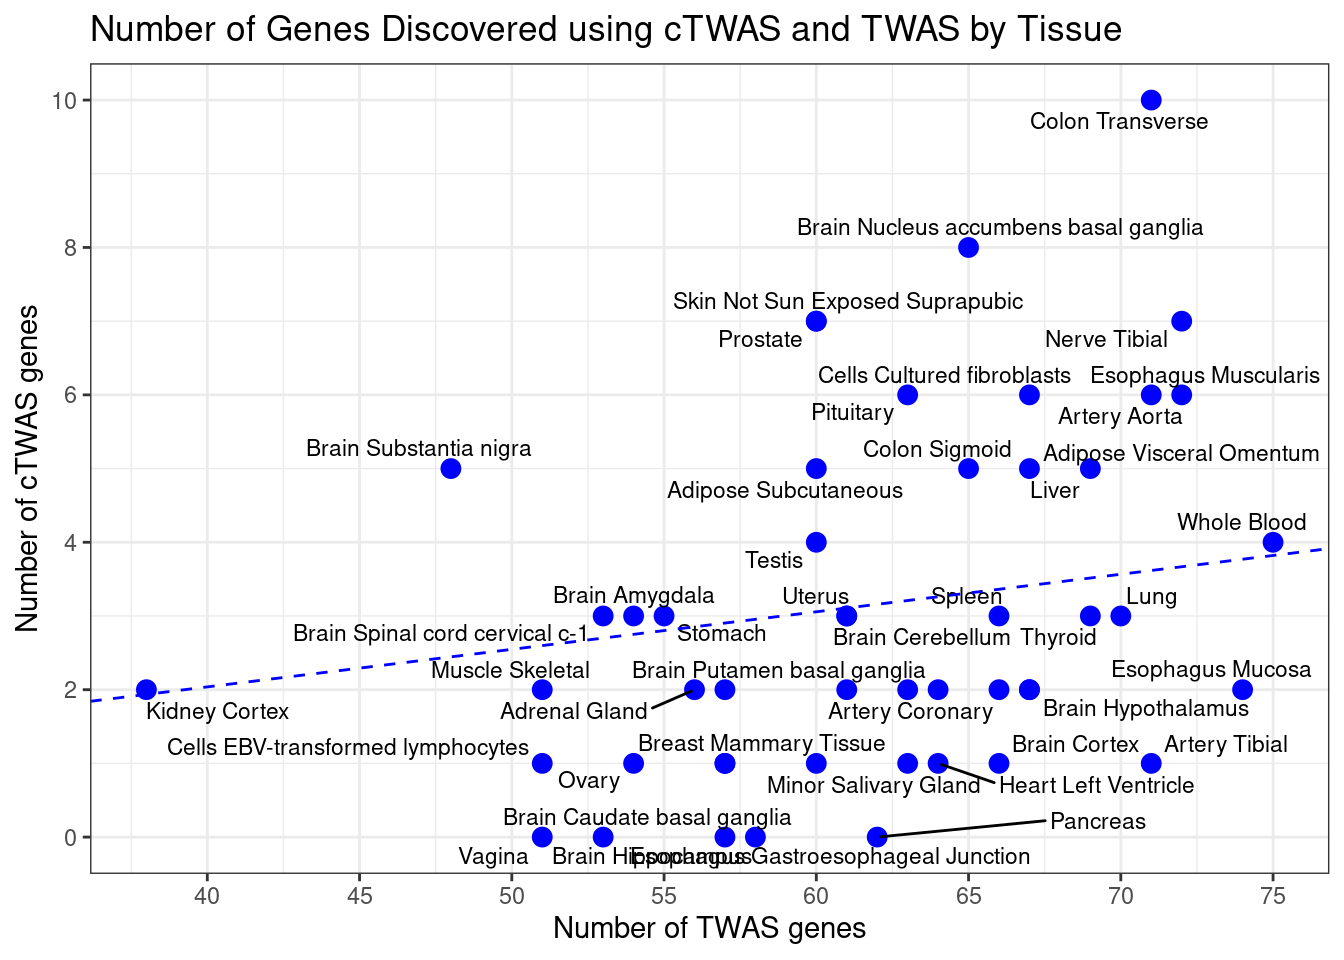
| Version | Author | Date |
|---|---|---|
| 0136d2e | wesleycrouse | 2022-06-10 |
#report correlation between cTWAS and TWAS
cor(df_plot$n_ctwas, df_plot$n_twas)
[1] 0.3736515####################
#using cutpoint for number of ctwas and twas genes to determine which tissues to label
df_plot <- output
df_plot$tissue <- sapply(df_plot$weight, function(x){paste(unlist(strsplit(x,"_")),collapse=" ")})
df_plot$tissue[df_plot$n_ctwas < 7.5 & df_plot$n_twas < 115] <- ""
p <- ggplot(df_plot, aes(n_twas, n_ctwas, label = tissue)) + geom_point(color = "blue", size=3)
p <- p + geom_text_repel(size=3) + labs(title = "Number of Genes Discovered using cTWAS and TWAS by Tissue") + ylab("Number of cTWAS genes") + xlab("Number of TWAS genes")
p <- p + scale_y_continuous(breaks=seq(0,max(df_plot$n_ctwas),2))
p <- p + scale_x_continuous(breaks=seq(0,max(df_plot$n_twas),5))
p <- p + theme_bw()
fit <- lm(n_ctwas~0+n_twas, data=df_plot)
p <- p + geom_abline(slope=summary(fit)$coefficients["n_twas","Estimate"], intercept=0, linetype=2, color="blue")
p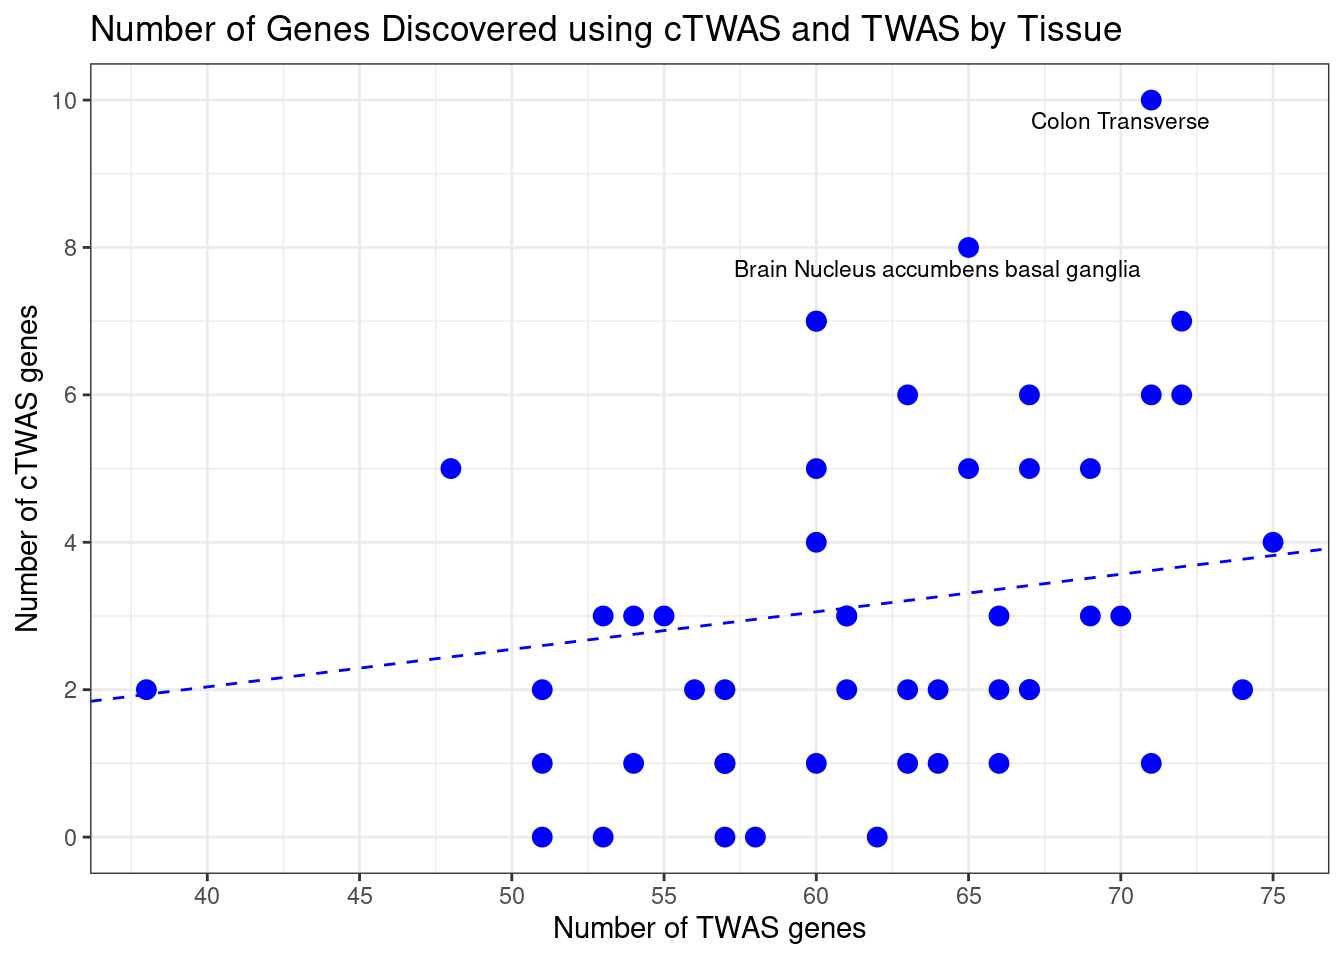
####################
#only labeling genes in "Blood or Immune" or "Digestive" groups

df_plot <- output
df_plot$tissue <- sapply(df_plot$weight, function(x){paste(unlist(strsplit(x,"_")),collapse=" ")})

df_plot[!(df_plot$weight %in% selected_weights),"tissue"] <- ""

p <- ggplot(df_plot, aes(n_twas, n_ctwas, label = tissue)) + geom_point(color = "blue", size=3)
p <- p + geom_text_repel(size=3) + labs(title = "Number of Genes Discovered using cTWAS and TWAS by Tissue") + ylab("Number of cTWAS genes") + xlab("Number of TWAS genes")
p <- p + scale_y_continuous(breaks=seq(0,max(df_plot$n_ctwas),2))
p <- p + scale_x_continuous(breaks=seq(0,max(df_plot$n_twas),5))
p <- p + theme_bw()

fit <- lm(n_ctwas~0+n_twas, data=df_plot)
p <- p + geom_abline(slope=summary(fit)$coefficients["n_twas","Estimate"], intercept=0, linetype=2, color="blue")

p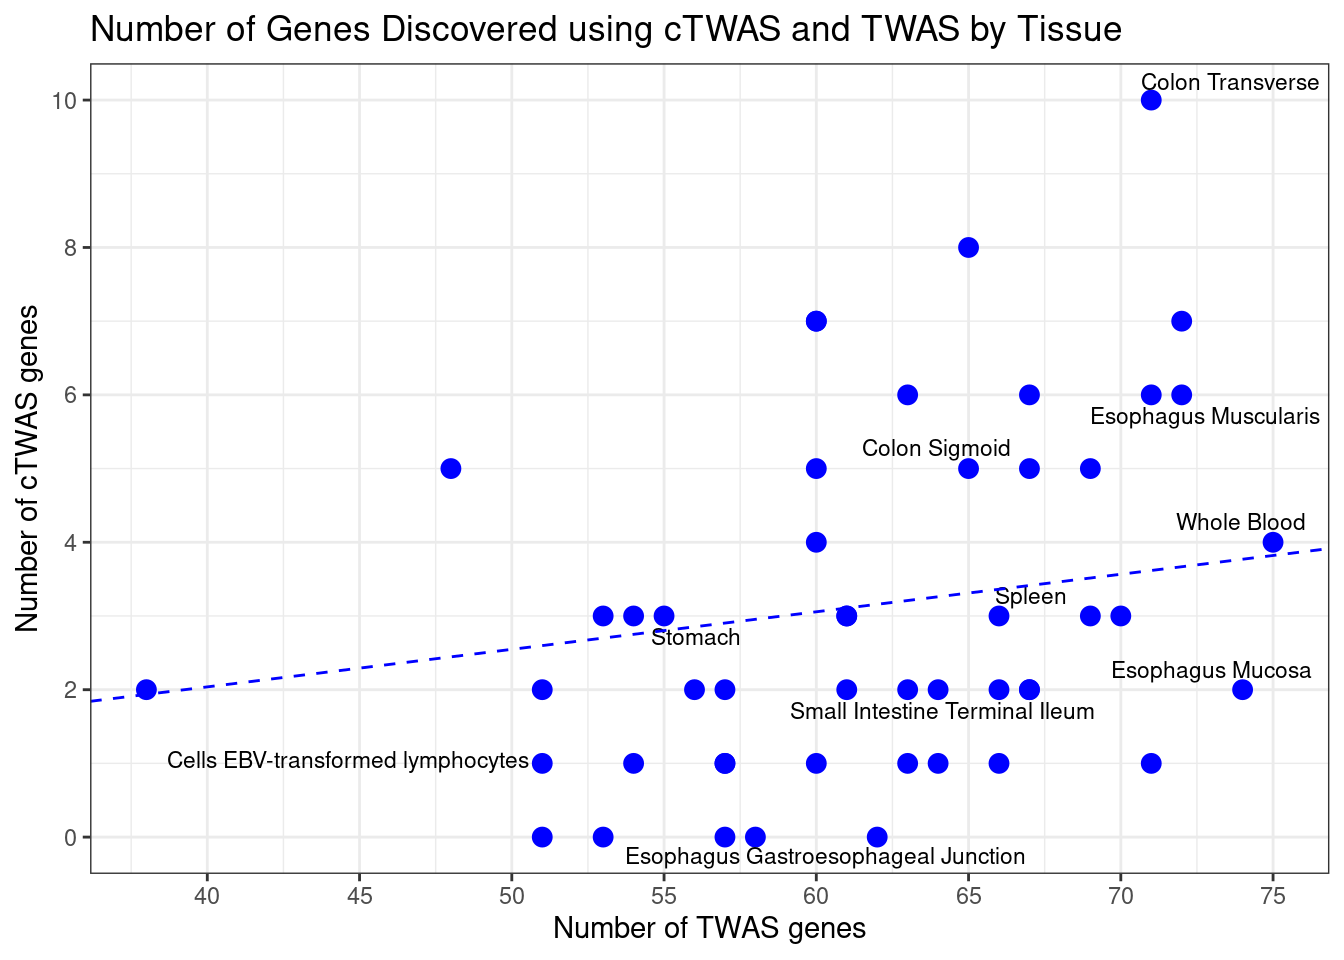
Most cTWAS genes were found in a small number of tissues
#number of tissues with PIP>0.5 for cTWAS genes
gene_pips_by_weight_bkup <- gene_pips_by_weight
gene_pips_by_weight[is.na(gene_pips_by_weight)] <- 0

#gene_pips_by_weight <- gene_pips_by_weight[,selected_weights,drop=F]

ctwas_frequency <- rowSums(gene_pips_by_weight>0.5)
hist(ctwas_frequency, col="grey", breaks=0:max(ctwas_frequency), xlim=c(0,ncol(gene_pips_by_weight)),
     xlab="Number of Tissues with PIP>0.5",
     ylab="Number of cTWAS Genes",
     main="Tissue Specificity for cTWAS Genes")
| Version | Author | Date |
|---|---|---|
| 0136d2e | wesleycrouse | 2022-06-10 |
#report number of genes in each tissue bin
table(ctwas_frequency)
ctwas_frequency
1 2 3 4 5 6 7 8 9 11 12 13 14 23 25 27
14 10 3 6 4 2 4 3 1 1 2 1 1 1 1 1 Many cTWAS genes are novel
“Novel” is defined as 1) not in the silver standard, and 2) not the gene nearest to a genome-wide significant GWAS peak
#barplot of number of cTWAS genes in each tissue
output <- output[output$weight %in% selected_weights,,drop=F]
output <- output[order(-output$n_ctwas),,drop=F]

output$tissue <- sapply(output$weight, function(x){paste(unlist(strsplit(x,"_")),collapse=" ")})

par(mar=c(10.1, 4.1, 4.1, 2.1))
barplot(output$n_ctwas, names.arg=output$tissue, las=2, ylab="Number of cTWAS Genes", cex.names=0.6, main="Number of cTWAS Genes by Tissue")


results_table$novel <- !(results_table$nearest | results_table$known)
output$n_novel <- sapply(output$weight, function(x){sum(results_table[df[[x]]$ctwas,"novel"], na.rm=T)})

barplot(output$n_novel, names.arg=output$tissue, las=2, col="blue", add=T, xaxt='n', yaxt='n')

legend("topright",
       legend = c("Silver Standard or\nNearest to GWAS Peak", "Novel"),
       fill = c("grey", "blue"))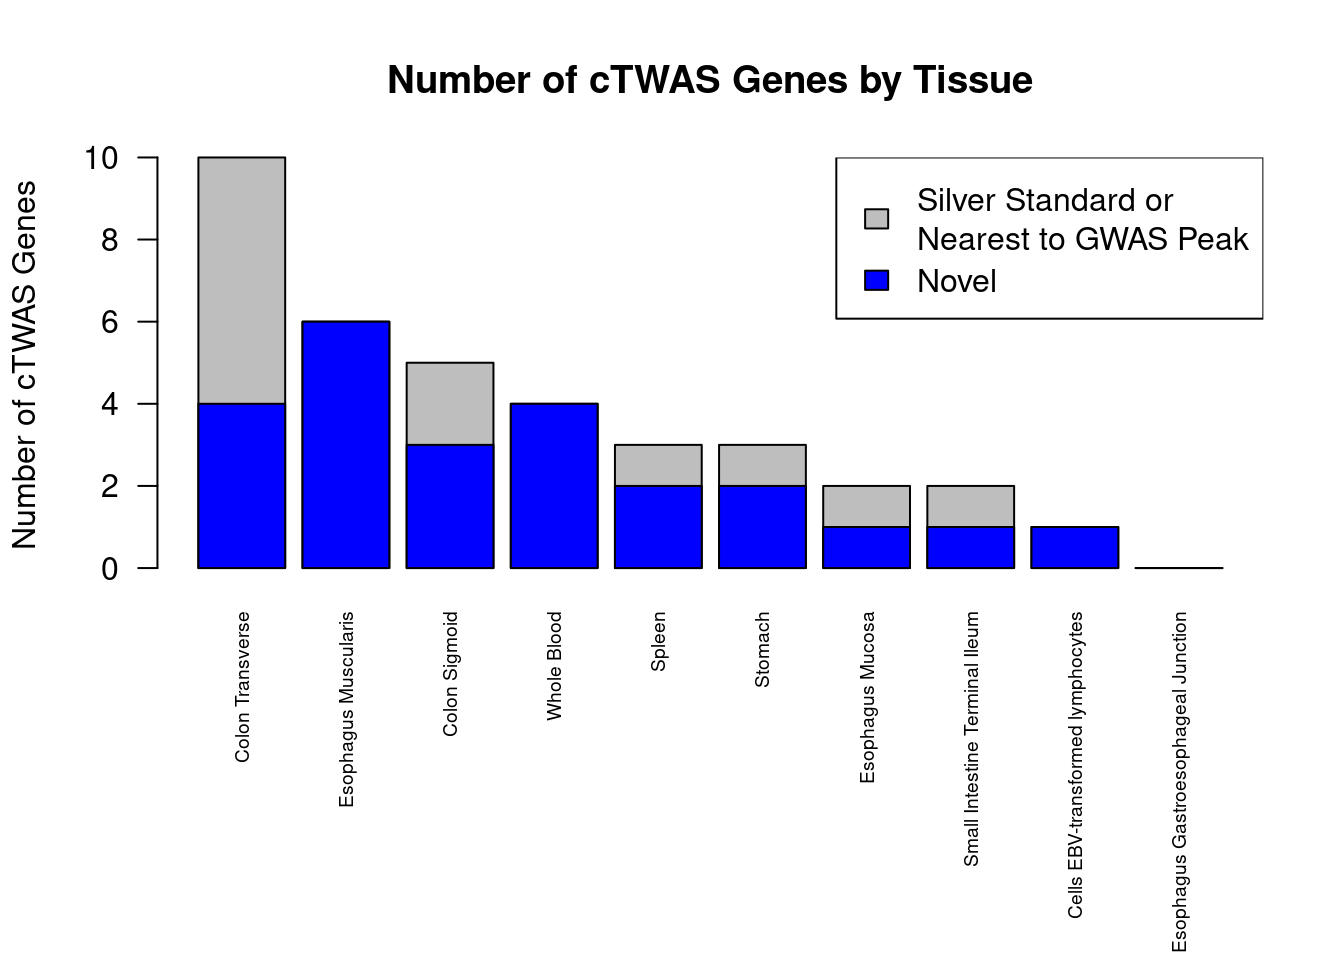
| Version | Author | Date |
|---|---|---|
| 0136d2e | wesleycrouse | 2022-06-10 |
Summary table of results
selected_weights_whitespace <- sapply(selected_weights, function(x){paste(unlist(strsplit(x, "_")), collapse=" ")})

results_summary <- data.frame(genename=as.character(rownames(results_table)),
                              ensembl_gene_id=results_table$ensembl_gene_id,
                              gene_biotype=G_list$gene_biotype[sapply(results_table$ensembl_gene_id, match, table=G_list$ensembl_gene_id)],
                              chromosome=results_table$chromosome_name,
                              start_position=results_table$start_position,
                              max_pip_tissue=selected_weights_whitespace[apply(results_table[,selected_weights], 1, which.max)],
                              max_pip=apply(results_table[,selected_weights], 1, max, na.rm=T),
                              other_tissues_detected=apply(results_table[,selected_weights],1,function(x){paste(selected_weights_whitespace[which(x>0.8 & x!=max(x,na.rm=T))], collapse="; ")}),
                              nearby=results_table$nearby,
                              nearest=results_table$nearest,
                              distance=G_list$distance[sapply(results_table$ensembl_gene_id, match, table=G_list$ensembl_gene_id)],
                              known=results_table$known,
                              enriched_terms=results_table$enriched_terms)

results_summary <- results_summary[order(results_summary$chromosome, results_summary$start_position),]

write.csv(results_summary, file=paste0("results_summary_ulcerative_colitis_nolnc.csv"))
GO enrichment for genes in selected tissues
#enrichment for cTWAS genes using enrichR
library(enrichR)

dbs <- c("GO_Biological_Process_2021")

GO_enrichment <- enrichr(selected_genes, dbs)
Uploading data to Enrichr... Done.
Querying GO_Biological_Process_2021... Done.
Parsing results... Done.for (db in dbs){
cat(paste0(db, "\n\n"))
enrich_results <- GO_enrichment[[db]]
enrich_results <- enrich_results[enrich_results$Adjusted.P.value<0.05,c("Term", "Overlap", "Adjusted.P.value", "Genes")]
print(enrich_results)
print(plotEnrich(GO_enrichment[[db]]))
}GO_Biological_Process_2021
Term Overlap Adjusted.P.value Genes
1 positive regulation of antigen receptor-mediated signaling pathway (GO:0050857) 3/21 0.0005141488 PRKCB;RAB29;PRKD2
2 positive regulation of vascular endothelial growth factor receptor signaling pathway (GO:0030949) 2/10 0.0087629186 PRKCB;PRKD2
3 positive regulation of T cell receptor signaling pathway (GO:0050862) 2/14 0.0117823256 RAB29;PRKD2
4 cellular response to interferon-gamma (GO:0071346) 3/121 0.0212990135 CCL20;IRF8;IRF5
5 regulation of vascular endothelial growth factor receptor signaling pathway (GO:0030947) 2/24 0.0212990135 PRKCB;PRKD2
6 cytokine-mediated signaling pathway (GO:0019221) 5/621 0.0272385710 MUC1;CCL20;IRF8;IRF5;CXCL5
7 positive regulation of NF-kappaB transcription factor activity (GO:0051092) 3/155 0.0284883655 PRKCB;CARD9;PRKD2
8 regulation of T cell receptor signaling pathway (GO:0050856) 2/35 0.0284883655 RAB29;PRKD2
9 positive regulation of ERK1 and ERK2 cascade (GO:0070374) 3/172 0.0304162985 CCL20;CARD9;PRKD2
10 mitochondrion organization (GO:0007005) 3/175 0.0304162985 BIK;RAB29;TYMP
11 chemokine-mediated signaling pathway (GO:0070098) 2/56 0.0424886457 CCL20;CXCL5
12 cellular response to cytokine stimulus (GO:0071345) 4/482 0.0424886457 MUC1;CCL20;IRF8;IRF5
13 neutrophil mediated immunity (GO:0002446) 4/488 0.0424886457 FCGR2A;CARD9;HSPA6;ITGAL
14 inflammatory response (GO:0006954) 3/230 0.0424886457 CCL20;ITGAL;CXCL5
15 cellular response to chemokine (GO:1990869) 2/60 0.0424886457 CCL20;CXCL5
16 regulation of ERK1 and ERK2 cascade (GO:0070372) 3/238 0.0424886457 CCL20;CARD9;PRKD2
17 cellular response to type I interferon (GO:0071357) 2/65 0.0424886457 IRF8;IRF5
18 type I interferon signaling pathway (GO:0060337) 2/65 0.0424886457 IRF8;IRF5
19 positive regulation of DNA-binding transcription factor activity (GO:0051091) 3/246 0.0424886457 PRKCB;CARD9;PRKD2
20 interferon-gamma-mediated signaling pathway (GO:0060333) 2/68 0.0426806441 IRF8;IRF5
21 neutrophil chemotaxis (GO:0030593) 2/70 0.0430355844 CCL20;CXCL5
22 granulocyte chemotaxis (GO:0071621) 2/73 0.0446135285 CCL20;CXCL5
23 neutrophil migration (GO:1990266) 2/77 0.0456204192 CCL20;CXCL5
24 positive regulation of MAPK cascade (GO:0043410) 3/274 0.0456204192 CCL20;CARD9;PRKD2
25 response to interferon-gamma (GO:0034341) 2/80 0.0469884165 CCL20;IRF8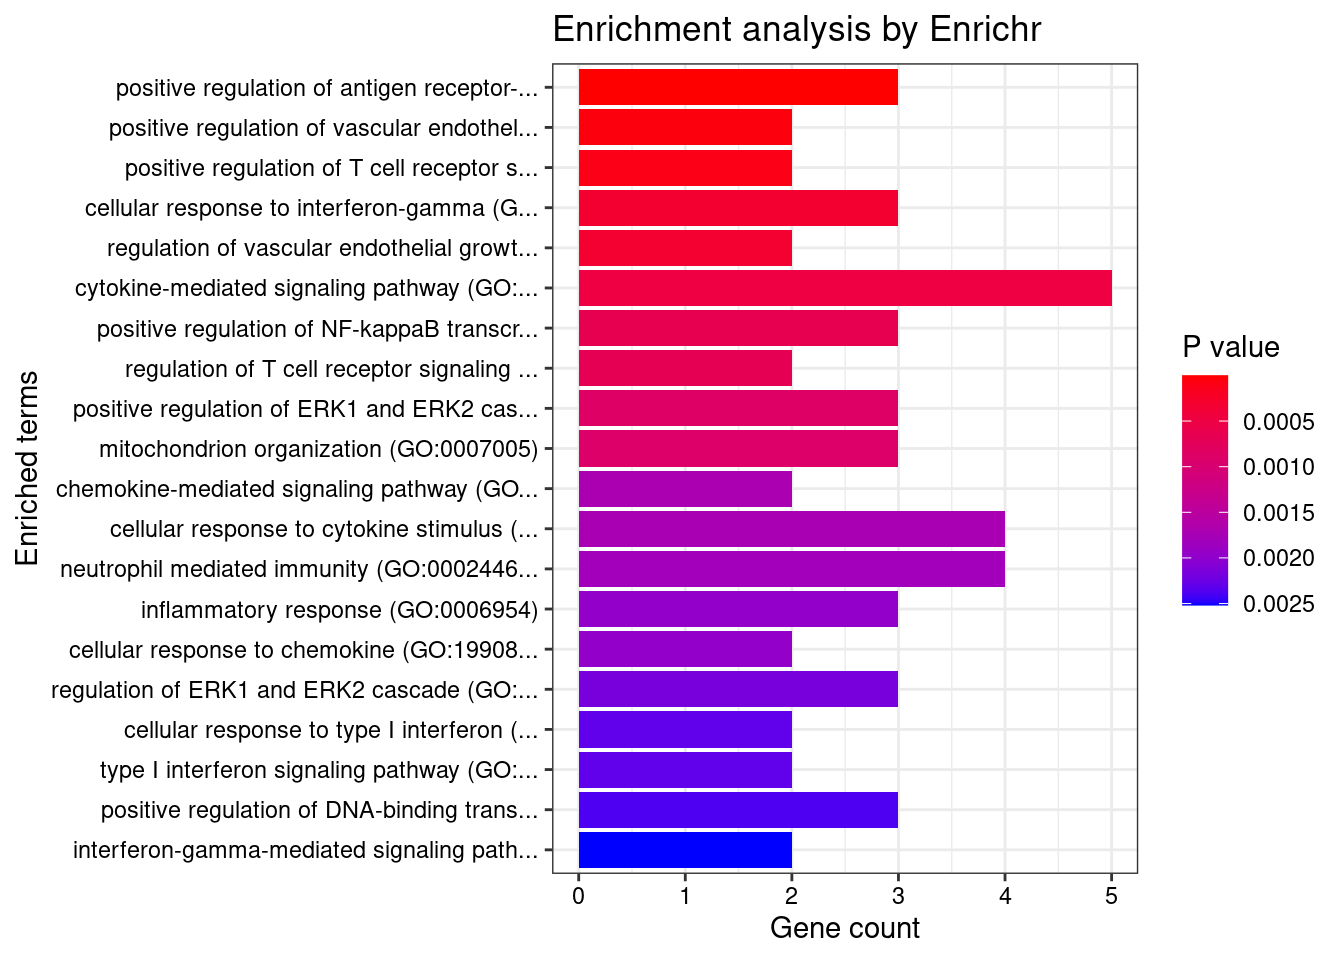
| Version | Author | Date |
|---|---|---|
| 0136d2e | wesleycrouse | 2022-06-10 |
Locus plots for HSPA6
locus_plot <- function(genename, tissue, plot_eqtl = T, label="cTWAS", xlim=NULL){
  results_dir <- results_dirs[grep(tissue, results_dirs)]
  weight <- rev(unlist(strsplit(results_dir, "/")))[1]
  analysis_id <- paste(trait_id, weight, sep="_")

  #load ctwas results
  ctwas_res <- data.table::fread(paste0(results_dir, "/", analysis_id, "_ctwas.susieIrss.txt"))

  #make unique identifier for regions and effects
  ctwas_res$region_tag <- paste(ctwas_res$region_tag1, ctwas_res$region_tag2, sep="_")
  ctwas_res$region_cs_tag <- paste(ctwas_res$region_tag, ctwas_res$cs_index, sep="_")

  #load z scores for SNPs
  load(paste0(results_dir, "/", analysis_id, "_expr_z_snp.Rd"))

  #separate gene and SNP results
  ctwas_gene_res <- ctwas_res[ctwas_res$type == "gene", ]
  ctwas_gene_res <- data.frame(ctwas_gene_res)
  ctwas_snp_res <- ctwas_res[ctwas_res$type == "SNP", ]
  ctwas_snp_res <- data.frame(ctwas_snp_res)

  #add gene information to results
  sqlite <- RSQLite::dbDriver("SQLite")
  db = RSQLite::dbConnect(sqlite, paste0("/project2/mstephens/wcrouse/predictdb_nolnc/mashr_", weight, ".db"))
  query <- function(...) RSQLite::dbGetQuery(db, ...)
  gene_info <- query("select gene, genename, gene_type from extra")
  RSQLite::dbDisconnect(db)

  ctwas_gene_res <- cbind(ctwas_gene_res, gene_info[sapply(ctwas_gene_res$id, match, gene_info$gene), c("genename", "gene_type")])

  #add z scores to results
  load(paste0(results_dir, "/", analysis_id, "_expr_z_gene.Rd"))
  ctwas_gene_res$z <- z_gene[ctwas_gene_res$id,]$z

  z_snp <- z_snp[z_snp$id %in% ctwas_snp_res$id,]
  ctwas_snp_res$z <- z_snp$z[match(ctwas_snp_res$id, z_snp$id)]

  #merge gene and snp results with added information
  ctwas_snp_res$genename=NA
  ctwas_snp_res$gene_type=NA

  ctwas_res <- rbind(ctwas_gene_res, ctwas_snp_res[,colnames(ctwas_gene_res)])

  region_tag <- ctwas_res$region_tag[which(ctwas_res$genename==genename)]

  region_tag1 <- unlist(strsplit(region_tag, "_"))[1]
  region_tag2 <- unlist(strsplit(region_tag, "_"))[2]

  a <- ctwas_res[ctwas_res$region_tag==region_tag,]

  rm(ctwas_res)

  regionlist <- readRDS(paste0(results_dir, "/", analysis_id, "_ctwas.regionlist.RDS"))
  region <- regionlist[[as.numeric(region_tag1)]][[region_tag2]]

  R_snp_info <- do.call(rbind, lapply(region$regRDS, function(x){data.table::fread(paste0(tools::file_path_sans_ext(x), ".Rvar"))}))

  a$pos[a$type=="gene"] <- G_list$start_position[match(sapply(a$id[a$type=="gene"], function(x){unlist(strsplit(x, "[.]"))[1]}) ,G_list$ensembl_gene_id)]
  a$pos <- a$pos/1000000

  if (!is.null(xlim)){
    if (is.na(xlim[1])){
      xlim[1] <- min(a$pos)
    }
    if (is.na(xlim[2])){
      xlim[2] <- max(a$pos)
    }
    a <- a[a$pos>=xlim[1] & a$pos<=xlim[2],,drop=F]
  }

  focus <- a$id[which(a$genename==genename)]
  a$iffocus <- as.numeric(a$id==focus)

  a$PVALUE <- (-log(2) - pnorm(abs(a$z), lower.tail=F, log.p=T))/log(10)

  R_gene <- readRDS(region$R_g_file)
  R_snp_gene <- readRDS(region$R_sg_file)
  R_snp <- as.matrix(Matrix::bdiag(lapply(region$regRDS, readRDS)))

  rownames(R_gene) <- region$gid
  colnames(R_gene) <- region$gid
  rownames(R_snp_gene) <- R_snp_info$id
  colnames(R_snp_gene) <- region$gid
  rownames(R_snp) <- R_snp_info$id
  colnames(R_snp) <- R_snp_info$id

  a$r2max <- NA

  a$r2max[a$type=="gene"] <- R_gene[focus,a$id[a$type=="gene"]]
  a$r2max[a$type=="SNP"] <- R_snp_gene[a$id[a$type=="SNP"],focus]

  r2cut <- 0.4
  colorsall <- c("#7fc97f", "#beaed4", "#fdc086")

  layout(matrix(1:2, ncol = 1), widths = 1, heights = c(1.5,1.5), respect = FALSE)
  par(mar = c(0, 4.1, 4.1, 2.1))

  plot(a$pos[a$type=="SNP"], a$PVALUE[a$type == "SNP"], pch = 21, xlab=paste0("Chromosome ", region_tag1, " position (Mb)"), frame.plot=FALSE, bg = colorsall[1], ylab = "-log10(p value)", panel.first = grid(), ylim =c(-(1/6)*max(a$PVALUE), max(a$PVALUE)*1.2), xaxt = 'n')

  points(a$pos[a$type=="SNP" & a$r2max > r2cut], a$PVALUE[a$type == "SNP"  & a$r2max > r2cut], pch = 21, bg = "purple")
  points(a$pos[a$type=="SNP" & a$iffocus == 1], a$PVALUE[a$type == "SNP" & a$iffocus == 1], pch = 21, bg = "salmon")
  points(a$pos[a$type=="gene"], a$PVALUE[a$type == "gene"], pch = 22, bg = colorsall[1], cex = 2)
  points(a$pos[a$type=="gene" & a$r2max > r2cut], a$PVALUE[a$type == "gene"  & a$r2max > r2cut], pch = 22, bg = "purple", cex = 2)
  points(a$pos[a$type=="gene" & a$iffocus == 1], a$PVALUE[a$type == "gene" & a$iffocus == 1], pch = 22, bg = "salmon", cex = 2)

  alpha=0.05
  abline(h=-log10(alpha/nrow(ctwas_gene_res)), col ="red", lty = 2)

  if (isTRUE(plot_eqtl)){
    for (cgene in a[a$type=="gene" & a$iffocus == 1, ]$id){
      load(paste0(results_dir, "/",analysis_id, "_expr_chr", region_tag1, ".exprqc.Rd"))
      eqtls <- rownames(wgtlist[[cgene]])
      points(a[a$id %in% eqtls,]$pos, rep( -(1/6)*max(a$PVALUE), nrow(a[a$id %in% eqtls,])), pch = "|", col = "salmon", cex = 1.5)
    }
  }

  if (label=="TWAS"){
    text(a$pos[a$id==focus], a$PVALUE[a$id==focus], labels=ctwas_gene_res$genename[ctwas_gene_res$id==focus], pos=3, cex=0.6)
  }

  par(mar = c(4.1, 4.1, 0.5, 2.1))

  plot(a$pos[a$type=="SNP"], a$PVALUE[a$type == "SNP"], pch = 19, xlab=paste0("Chromosome ", region_tag1, " position (Mb)"),frame.plot=FALSE, col = "white", ylim= c(0,1.1), ylab = "cTWAS PIP")

  grid()
  points(a$pos[a$type=="SNP"], a$susie_pip[a$type == "SNP"], pch = 21, xlab="Genomic position", bg = colorsall[1])
  points(a$pos[a$type=="SNP" & a$r2max > r2cut], a$susie_pip[a$type == "SNP"  & a$r2max >r2cut], pch = 21, bg = "purple")
  points(a$pos[a$type=="SNP" & a$iffocus == 1], a$susie_pip[a$type == "SNP" & a$iffocus == 1], pch = 21, bg = "salmon")
  points(a$pos[a$type=="gene"], a$susie_pip[a$type == "gene"], pch = 22, bg = colorsall[1], cex = 2)
  points(a$pos[a$type=="gene" & a$r2max > r2cut], a$susie_pip[a$type == "gene"  & a$r2max > r2cut], pch = 22, bg = "purple", cex = 2)
  points(a$pos[a$type=="gene" & a$iffocus == 1], a$susie_pip[a$type == "gene" & a$iffocus == 1], pch = 22, bg = "salmon", cex = 2)

  legend(max(a$pos)-0.2*(max(a$pos)-min(a$pos)), y= 1 ,c("Gene", "SNP","Lead TWAS Gene", "R2 > 0.4", "R2 <= 0.4"), pch = c(22,21,19,19,19), col = c("black", "black", "salmon", "purple", colorsall[1]), cex=0.7, title.adj = 0)

  if (label=="cTWAS"){
    text(a$pos[a$id==focus], a$susie_pip[a$id==focus], labels=ctwas_gene_res$genename[ctwas_gene_res$id==focus], pos=3, cex=0.6)
  }

  return(a)
}
genename <- "HSPA6"
tissue <- "Esophagus_Muscularis"
a <- locus_plot(genename, tissue, xlim=c(161.25, 161.75))
#ctwas results
head(a[order(-a$susie_pip), c("chrom", "pos", "id", "genename", "type", "susie_pip", "PVALUE") ], 10)
#nearest gene to GWAS peak
G_list[G_list$chromosome_name==unique(a$chrom) & G_list$start_position > min(a$pos*1000000) & G_list$end_position < max(a$pos*1000000),]
####################
#checking additional tissue
a <- locus_plot(genename, "Esophagus_Mucosa", xlim=c(161.25, 161.75))
#ctwas results
head(a[order(-a$susie_pip), c("chrom", "pos", "id", "genename", "type", "susie_pip", "PVALUE") ], 10)Locus plots for IRF8
genename <- "IRF8"
tissue <- names(which.max(results_table[genename,selected_weights]))

print(tissue)

a <- locus_plot(genename, tissue, xlim=c(85.75, 86.25))

#ctwas results
head(a[order(-a$susie_pip), c("chrom", "pos", "id", "genename", "type", "susie_pip", "PVALUE") ], 10)

#nearest gene to GWAS peak
G_list[G_list$chromosome_name==unique(a$chrom) & G_list$start_position > min(a$pos*1000000) & G_list$end_position < max(a$pos*1000000),]
Locus plots for CERKL
genename <- "CERKL"

tissue <- "Colon_Transverse"

print(tissue)

a <- locus_plot(genename, tissue, xlim=c(NA, 181.75))

#ctwas results
head(a[order(-a$susie_pip), c("chrom", "pos", "id", "genename", "type", "susie_pip", "PVALUE") ], 10)

#nearest gene to GWAS peak
G_list[G_list$chromosome_name==unique(a$chrom) & G_list$start_position > min(a$pos*1000000) & G_list$end_position < max(a$pos*1000000),]
Summary table of results - version 2
save.image("workspace7.RData")
#load("workspace7.RData")

results_summary <- data.frame(genename=as.character(rownames(results_table)),
                              ensembl_gene_id=results_table$ensembl_gene_id,
                              chromosome=results_table$chromosome_name,
                              start_position=results_table$start_position,
                              max_pip_tissue=selected_weights_whitespace[apply(results_table[,selected_weights], 1, which.max)],
                              max_pip_tissue_nospace=selected_weights[apply(results_table[,selected_weights], 1, which.max)],
                              max_pip=apply(results_table[,selected_weights], 1, max, na.rm=T),
                              other_tissues_detected=apply(results_table[,selected_weights],1,function(x){paste(selected_weights_whitespace[which(x>0.8 & x!=max(x,na.rm=T))], collapse="; ")}),
                              region_tag_tissue=NA,
                              z_tissue=NA,
                              num_eqtl_tissue=NA,
                              twas_fp_tissue=NA,
                              gene_nearest_region_peak_tissue=NA,
                              nearby=results_table$nearby,
                              nearest=results_table$nearest,
                              distance=results_table$distance,
                              which_nearest=results_table$which_nearest,
                              known=results_table$known,
                              stringsAsFactors=F)

for (i in 1:nrow(results_summary)){
  tissue <- results_summary$max_pip_tissue_nospace[i]
  gene <- results_summary$genename[i]
  gene_pips <- df[[tissue]]$gene_pips
  results_summary[i,c("region_tag_tissue", "z_tissue", "num_eqtl_tissue")] <- gene_pips[gene_pips$genename==gene,c("region_tag", "z", "num_eqtl")]
  region_tag <- results_summary$region_tag_tissue[i]
  results_summary$twas_fp_tissue[i] <- any(gene_pips$genename[gene_pips$region_tag==region_tag & gene_pips$genename!=gene] %in% df[[tissue]]$twas)


  region_pips <- df[[tissue]]$region_pips
  lead_snp <- region_pips$which_snp_maxz[region_pips$region==region_tag]

  chromosome <- results_summary$chromosome[i]
  lead_position <- z_snp$pos[z_snp$id==lead_snp]

  G_list_index <- which(G_list$chromosome_name==chromosome)

  distances <- sapply(G_list_index, function(i){
    if (lead_position >= G_list$start_position[i] & lead_position <= G_list$end_position[i]){
      distance <- 0
    } else {
      distance <- min(abs(G_list$start_position[i] - lead_position), abs(G_list$end_position[i] - lead_position))
    }
    distance
  })

  results_summary$gene_nearest_region_peak_tissue[i] <- paste0(G_list$hgnc_symbol[G_list_index[which(distances==min(distances))]], collapse="; ")

}

####################
#GO enrichment of cTWAS genes
genes <- results_summary$genename

dbs <- c("GO_Biological_Process_2021", "GO_Cellular_Component_2021", "GO_Molecular_Function_2021")
GO_enrichment <- enrichr(genes, dbs)
Uploading data to Enrichr... Done.
Querying GO_Biological_Process_2021... Done.
Querying GO_Cellular_Component_2021... Done.
Querying GO_Molecular_Function_2021... Done.
Parsing results... Done.save(GO_enrichment, file=paste0(trait_id, "_enrichment_results.RData"))
####################
#enrichment of silver standard genes
genes <- known_genes
dbs <- c("GO_Biological_Process_2021", "GO_Cellular_Component_2021", "GO_Molecular_Function_2021")
GO_enrichment_silver_standard <- enrichr(genes, dbs)Uploading data to Enrichr... Done.
Querying GO_Biological_Process_2021... Done.
Querying GO_Cellular_Component_2021... Done.
Querying GO_Molecular_Function_2021... Done.
Parsing results... Done.save(GO_enrichment_silver_standard, file=paste0(trait_id, "silver_standard_enrichment_results.RData"))
####################
#report GO cTWAS
load(paste0(trait_id, "_enrichment_results.RData"))
GO_enrichment <- do.call(rbind, GO_enrichment)
GO_enrichment$db <- sapply(rownames(GO_enrichment), function(x){unlist(strsplit(x, split="[.]"))[1]})
rownames(GO_enrichment) <- NULL
GO_enrichment <- GO_enrichment[GO_enrichment$Adjusted.P.value < 0.05,]
GO_enrichment <- GO_enrichment[order(-GO_enrichment$Odds.Ratio),]
results_summary$GO <- sapply(results_summary$genename, function(x){terms <- GO_enrichment$Term[grep(x, GO_enrichment$Genes)];
if (length(terms)>0){terms <- terms[1:min(length(terms),5)]};
paste0(terms, collapse="; ")})
####################
#report GO silver standard
load(paste0(trait_id, "silver_standard_enrichment_results.RData"))
GO_enrichment_silver_standard <- do.call(rbind, GO_enrichment_silver_standard)
GO_enrichment_silver_standard$db <- sapply(rownames(GO_enrichment_silver_standard), function(x){unlist(strsplit(x, split="[.]"))[1]})
rownames(GO_enrichment_silver_standard) <- NULL
GO_enrichment_silver_standard <- GO_enrichment_silver_standard[GO_enrichment_silver_standard$Adjusted.P.value < 0.05,]
GO_enrichment_silver_standard <- GO_enrichment_silver_standard[order(-GO_enrichment_silver_standard$Odds.Ratio),]
#reload GO cTWAS for GO crosswalk
load(paste0(trait_id, "_enrichment_results.RData"))
GO_enrichment <- do.call(rbind, GO_enrichment)
GO_enrichment$db <- sapply(rownames(GO_enrichment), function(x){unlist(strsplit(x, split="[.]"))[1]})
rownames(GO_enrichment) <- NULL
#overlap between sets
GO_enrichment <- GO_enrichment[GO_enrichment$Term %in% GO_enrichment_silver_standard$Term,,drop=F]
GO_enrichment_silver_standard <- GO_enrichment_silver_standard[GO_enrichment_silver_standard$Term %in% GO_enrichment$Term,,drop=F]
GO_enrichment <- GO_enrichment[match(GO_enrichment_silver_standard$Term, GO_enrichment$Term),]
results_summary$GO_silver <- sapply(results_summary$genename, function(x){terms <- GO_enrichment$Term[grep(x, GO_enrichment$Genes)];
if (length(terms)>0){terms <- terms[1:min(length(terms),5)]};
paste0(terms, collapse="; ")})
####################
#report FUMA
FUMA <- data.table::fread(paste0("/project2/xinhe/shengqian/cTWAS/cTWAS_analysis/data/FUMA_output/", trait_id, "/GS.txt"))
FUMA <- FUMA[FUMA$Category %in% c("GO_bp", "GO_cc", "GO_mf"),,drop=F]
FUMA <- FUMA[order(FUMA$p),]
#reload GO cTWAS for GO crosswalk
load(paste0(trait_id, "_enrichment_results.RData"))
GO_enrichment <- do.call(rbind, GO_enrichment)
GO_enrichment$db <- sapply(rownames(GO_enrichment), function(x){unlist(strsplit(x, split="[.]"))[1]})
rownames(GO_enrichment) <- NULL
GO_enrichment$Term_FUMA <- sapply(GO_enrichment$Term, function(x){rev(rev(unlist(strsplit(x, split=" [(]GO")))[-1])})
GO_enrichment$Term_FUMA <- paste0("GO_", toupper(gsub(" ", "_", GO_enrichment$Term_FUMA)))
#overlap between sets
GO_enrichment <- GO_enrichment[GO_enrichment$Term_FUMA %in% FUMA$GeneSet,,drop=F]
FUMA <- FUMA[FUMA$GeneSet %in% GO_enrichment$Term_FUMA]
GO_enrichment <- GO_enrichment[match(FUMA$GeneSet, GO_enrichment$Term_FUMA),]
results_summary$GO_MAGMA <- sapply(results_summary$genename, function(x){terms <- GO_enrichment$Term[grep(x, GO_enrichment$Genes)];
if (length(terms)>0){terms <- terms[1:min(length(terms),5)]};
paste0(terms, collapse="; ")})
####################
#report FUMA + susieGO
gsesusie <- as.data.frame(readxl::read_xlsx("gsesusie_enrichment.xlsx", sheet=trait_id))
gsesusie$GeneSet <- paste0("(", gsesusie$GeneSet, ")")
#reload GO cTWAS for GO crosswalk
load(paste0(trait_id, "_enrichment_results.RData"))
GO_enrichment <- do.call(rbind, GO_enrichment)
GO_enrichment$db <- sapply(rownames(GO_enrichment), function(x){unlist(strsplit(x, split="[.]"))[1]})
rownames(GO_enrichment) <- NULL
GO_enrichment$GeneSet <- sapply(GO_enrichment$Term, function(x){rev(unlist(strsplit(x, " ")))[1]})
#overlap between sets
GO_enrichment <- GO_enrichment[GO_enrichment$GeneSet %in% gsesusie$GeneSet,,drop=F]
gsesusie <- gsesusie[gsesusie$GeneSet %in% GO_enrichment$GeneSet,,drop=F]
GO_enrichment <- GO_enrichment[match(gsesusie$GeneSet, GO_enrichment$GeneSet),]
results_summary$GO_MAGMA_SuSiE <- sapply(results_summary$genename, function(x){terms <- GO_enrichment$Term[grep(x, GO_enrichment$Genes)];
if (length(terms)>0){terms <- terms[1:min(length(terms),5)]};
paste0(terms, collapse="; ")})
results_summary <- results_summary[order(results_summary$chromosome, results_summary$start_position),]
results_summary <- results_summary[,!(colnames(results_summary) %in% c("max_pip_tissue_nospace"))]
write.csv(results_summary, file=paste0("results_summary_ulcerative_colitis_nolnc_v2.csv"))
sessionInfo()R version 3.6.1 (2019-07-05)
Platform: x86_64-pc-linux-gnu (64-bit)
Running under: Scientific Linux 7.4 (Nitrogen)
Matrix products: default
BLAS/LAPACK: /software/openblas-0.2.19-el7-x86_64/lib/libopenblas_haswellp-r0.2.19.so
locale:
[1] LC_CTYPE=en_US.UTF-8 LC_NUMERIC=C LC_TIME=en_US.UTF-8 LC_COLLATE=en_US.UTF-8 LC_MONETARY=en_US.UTF-8 LC_MESSAGES=en_US.UTF-8 LC_PAPER=en_US.UTF-8 LC_NAME=C LC_ADDRESS=C LC_TELEPHONE=C LC_MEASUREMENT=en_US.UTF-8 LC_IDENTIFICATION=C
attached base packages:
[1] stats graphics grDevices utils datasets methods base
other attached packages:
[1] ggrepel_0.9.1 biomaRt_2.40.1 ggplot2_3.3.5 disgenet2r_0.99.2 WebGestaltR_0.4.4 enrichR_3.0
loaded via a namespace (and not attached):
[1] bitops_1.0-6 fs_1.5.2 bit64_4.0.5 doParallel_1.0.16 progress_1.2.2 httr_1.4.1 rprojroot_2.0.2 tools_3.6.1 doRNG_1.8.2 utf8_1.2.1 R6_2.5.0 DBI_1.1.1 BiocGenerics_0.30.0 colorspace_1.4-1 withr_2.4.1 tidyselect_1.1.2 prettyunits_1.0.2 bit_4.0.4 curl_3.3 compiler_3.6.1 git2r_0.26.1 cli_3.3.0 Biobase_2.44.0 labeling_0.3 scales_1.2.0 readr_1.4.0 stringr_1.4.0 apcluster_1.4.8 digest_0.6.20 rmarkdown_1.13 svglite_1.2.2 pkgconfig_2.0.3 htmltools_0.5.2 fastmap_1.1.0 rlang_1.0.2 readxl_1.3.1 RSQLite_2.2.7 farver_2.1.0 generics_0.0.2 jsonlite_1.6 dplyr_1.0.9 RCurl_1.98-1.1 magrittr_2.0.3 Matrix_1.2-18 Rcpp_1.0.6 munsell_0.5.0 S4Vectors_0.22.1
[48] fansi_0.5.0 gdtools_0.1.9 lifecycle_1.0.1 stringi_1.4.3 whisker_0.3-2 yaml_2.2.0 plyr_1.8.4 grid_3.6.1 blob_1.2.1 parallel_3.6.1 promises_1.0.1 crayon_1.4.1 lattice_0.20-38 hms_1.1.0 knitr_1.23 pillar_1.7.0 igraph_1.2.4.1 rjson_0.2.20 rngtools_1.5 reshape2_1.4.3 codetools_0.2-16 stats4_3.6.1 XML_3.98-1.20 glue_1.6.2 evaluate_0.14 data.table_1.14.0 vctrs_0.4.1 httpuv_1.5.1 foreach_1.5.1 cellranger_1.1.0 gtable_0.3.0 purrr_0.3.4 assertthat_0.2.1 cachem_1.0.5 xfun_0.8 later_0.8.0 tibble_3.1.7 iterators_1.0.13 AnnotationDbi_1.46.0 memoise_2.0.0 IRanges_2.18.1 workflowr_1.6.2 ellipsis_0.3.2