Ulcerative colitis - all weights
wesleycrouse
2022-04-04
Last updated: 2022-05-24
Checks: 7 0
Knit directory: ctwas_applied/
This reproducible R Markdown analysis was created with workflowr (version 1.6.2). The Checks tab describes the reproducibility checks that were applied when the results were created. The Past versions tab lists the development history.
Great! Since the R Markdown file has been committed to the Git repository, you know the exact version of the code that produced these results.
Great job! The global environment was empty. Objects defined in the global environment can affect the analysis in your R Markdown file in unknown ways. For reproduciblity it’s best to always run the code in an empty environment.
The command set.seed(20210726) was run prior to running the code in the R Markdown file. Setting a seed ensures that any results that rely on randomness, e.g. subsampling or permutations, are reproducible.
Great job! Recording the operating system, R version, and package versions is critical for reproducibility.
Nice! There were no cached chunks for this analysis, so you can be confident that you successfully produced the results during this run.
Great job! Using relative paths to the files within your workflowr project makes it easier to run your code on other machines.
Great! You are using Git for version control. Tracking code development and connecting the code version to the results is critical for reproducibility.
The results in this page were generated with repository version d46127d. See the Past versions tab to see a history of the changes made to the R Markdown and HTML files.
Note that you need to be careful to ensure that all relevant files for the analysis have been committed to Git prior to generating the results (you can use wflow_publish or wflow_git_commit). workflowr only checks the R Markdown file, but you know if there are other scripts or data files that it depends on. Below is the status of the Git repository when the results were generated:
Untracked files:
    Untracked:  G_list_ebi-a-GCST004131.RData
    Untracked:  group_enrichment_results.RData
    Untracked:  results_summary_inflammatory_bowel_disease.csv
    Untracked:  z_snp_pos_ebi-a-GCST004131.RData
    Untracked:  z_snp_pos_ebi-a-GCST004132.RData
    Untracked:  z_snp_pos_ebi-a-GCST004133.RData

Unstaged changes:
    Modified:   analysis/ebi-a-GCST004131_allweights.Rmd
    Modified:   code/automate_Rmd.R
Note that any generated files, e.g. HTML, png, CSS, etc., are not included in this status report because it is ok for generated content to have uncommitted changes.
These are the previous versions of the repository in which changes were made to the R Markdown (analysis/ebi-a-GCST004133_allweights.Rmd) and HTML (docs/ebi-a-GCST004133_allweights.html) files. If you’ve configured a remote Git repository (see ?wflow_git_remote), click on the hyperlinks in the table below to view the files as they were in that past version.
| File | Version | Author | Date | Message |
|---|---|---|---|---|
| Rmd | ba857b1 | wesleycrouse | 2022-05-20 | parameter figures |
| html | ba857b1 | wesleycrouse | 2022-05-20 | parameter figures |
| Rmd | b90cffc | wesleycrouse | 2022-05-16 | fixing typo |
| html | b90cffc | wesleycrouse | 2022-05-16 | fixing typo |
| Rmd | 5d013d9 | wesleycrouse | 2022-05-15 | locus plots for colitis |
| html | 5d013d9 | wesleycrouse | 2022-05-15 | locus plots for colitis |
| Rmd | f9d592e | wesleycrouse | 2022-05-15 | cleaning enrichment code |
| html | f9d592e | wesleycrouse | 2022-05-15 | cleaning enrichment code |
| Rmd | 25b7218 | wesleycrouse | 2022-05-14 | enrichment |
| html | 5fa1bdd | wesleycrouse | 2022-05-14 | enrichment |
| Rmd | 6f82cb0 | wesleycrouse | 2022-05-13 | matching ons emsembl |
| html | 6f82cb0 | wesleycrouse | 2022-05-13 | matching ons emsembl |
| Rmd | 5c9fc0e | wesleycrouse | 2022-05-13 | additional figures for ulcerative colitis |
| html | 5c9fc0e | wesleycrouse | 2022-05-13 | additional figures for ulcerative colitis |
| Rmd | f65b31c | wesleycrouse | 2022-05-05 | enrichment for known IBD genes and overlap |
| html | f65b31c | wesleycrouse | 2022-05-05 | enrichment for known IBD genes and overlap |
| html | 177114d | wesleycrouse | 2022-05-04 | updating output |
| Rmd | ad70daf | wesleycrouse | 2022-05-04 | fixing file name |
| Rmd | 3354d64 | wesleycrouse | 2022-05-04 | adding known IBD genes from ABC paper |
| html | e6f6eb0 | wesleycrouse | 2022-05-02 | cleanup |
| Rmd | fe4215e | wesleycrouse | 2022-05-02 | cleanup |
| html | ce5831c | wesleycrouse | 2022-05-02 | regenerate reports |
| Rmd | 041c7d2 | wesleycrouse | 2022-05-02 | fixing notebooks after merge |
| Rmd | c048c27 | wesleycrouse | 2022-05-02 | Merge branch ‘master’ of https://github.com/wesleycrouse/ctwas_applied |
| html | c048c27 | wesleycrouse | 2022-05-02 | Merge branch ‘master’ of https://github.com/wesleycrouse/ctwas_applied |
| Rmd | 0fd1bd6 | wesleycrouse | 2022-05-02 | genes nearby and nearest to peak |
| html | 0fd1bd6 | wesleycrouse | 2022-05-02 | genes nearby and nearest to peak |
| html | 46544ec | wesleycrouse | 2022-04-12 | more enrichment |
| html | f40da10 | wesleycrouse | 2022-04-12 | more enrichment |
| Rmd | 107bb6d | wesleycrouse | 2022-04-12 | gene set enrichment for supplied gene sets |
| Rmd | 8c71a43 | wesleycrouse | 2022-04-12 | gene set enrichment for supplied gene sets |
| html | 95e0f8e | wesleycrouse | 2022-04-07 | scroll bar |
| html | 4409757 | wesleycrouse | 2022-04-07 | scroll bar |
| Rmd | a4575d7 | wesleycrouse | 2022-04-07 | formating |
| Rmd | ea23be2 | wesleycrouse | 2022-04-07 | formating |
| Rmd | d772243 | wesleycrouse | 2022-04-06 | adding subsections |
| Rmd | cedc812 | wesleycrouse | 2022-04-06 | adding subsections |
| html | d772243 | wesleycrouse | 2022-04-06 | adding subsections |
| html | cedc812 | wesleycrouse | 2022-04-06 | adding subsections |
| Rmd | f7e9822 | wesleycrouse | 2022-04-06 | testing subsections |
| Rmd | 93c8916 | wesleycrouse | 2022-04-06 | testing subsections |
| html | f7e9822 | wesleycrouse | 2022-04-06 | testing subsections |
| html | 93c8916 | wesleycrouse | 2022-04-06 | testing subsections |
| html | 94dd5d2 | wesleycrouse | 2022-04-05 | adding results for colitis |
| html | 2eeb53b | wesleycrouse | 2022-04-05 | adding results for colitis |
| Rmd | 60ea899 | wesleycrouse | 2022-04-05 | edge cases for kegg |
| Rmd | 981e5bc | wesleycrouse | 2022-04-05 | edge cases for kegg |
| Rmd | d14af05 | wesleycrouse | 2022-04-04 | kegg results for other traits |
| Rmd | 8222701 | wesleycrouse | 2022-04-04 | kegg results for other traits |
options(width=1000)trait_id <- "ebi-a-GCST004133"
trait_name <- "Ulcerative colitis"
source("/project2/mstephens/wcrouse/UKB_analysis_allweights/ctwas_config.R")
trait_dir <- paste0("/project2/mstephens/wcrouse/UKB_analysis_allweights/", trait_id)
results_dirs <- list.dirs(trait_dir, recursive=F)Load cTWAS results for all weights
# df <- list()
#
# for (i in 1:length(results_dirs)){
#   print(i)
#
#   results_dir <- results_dirs[i]
#   weight <- rev(unlist(strsplit(results_dir, "/")))[1]
#   analysis_id <- paste(trait_id, weight, sep="_")
#
#   #load ctwas results
#   ctwas_res <- data.table::fread(paste0(results_dir, "/", analysis_id, "_ctwas.susieIrss.txt"))
#
#   #make unique identifier for regions and effects
#   ctwas_res$region_tag <- paste(ctwas_res$region_tag1, ctwas_res$region_tag2, sep="_")
#   ctwas_res$region_cs_tag <- paste(ctwas_res$region_tag, ctwas_res$cs_index, sep="_")
#
#   #load z scores for SNPs and collect sample size
#   load(paste0(results_dir, "/", analysis_id, "_expr_z_snp.Rd"))
#
#   sample_size <- z_snp$ss
#   sample_size <- as.numeric(names(which.max(table(sample_size))))
#
#   #separate gene and SNP results
#   ctwas_gene_res <- ctwas_res[ctwas_res$type == "gene", ]
#   ctwas_gene_res <- data.frame(ctwas_gene_res)
#   ctwas_snp_res <- ctwas_res[ctwas_res$type == "SNP", ]
#   ctwas_snp_res <- data.frame(ctwas_snp_res)
#
#   #add gene information to results
#   sqlite <- RSQLite::dbDriver("SQLite")
#   db = RSQLite::dbConnect(sqlite, paste0("/project2/compbio/predictdb/mashr_models/mashr_", weight, ".db"))
#   query <- function(...) RSQLite::dbGetQuery(db, ...)
#   gene_info <- query("select gene, genename, gene_type from extra")
#   RSQLite::dbDisconnect(db)
#
#   ctwas_gene_res <- cbind(ctwas_gene_res, gene_info[sapply(ctwas_gene_res$id, match, gene_info$gene), c("genename", "gene_type")])
#
#   #add z scores to results
#   load(paste0(results_dir, "/", analysis_id, "_expr_z_gene.Rd"))
#   ctwas_gene_res$z <- z_gene[ctwas_gene_res$id,]$z
#
#   z_snp <- z_snp[z_snp$id %in% ctwas_snp_res$id,]
#   ctwas_snp_res$z <- z_snp$z[match(ctwas_snp_res$id, z_snp$id)]
#
#   #merge gene and snp results with added information
#   ctwas_snp_res$genename=NA
#   ctwas_snp_res$gene_type=NA
#
#   ctwas_res <- rbind(ctwas_gene_res,
#                    ctwas_snp_res[,colnames(ctwas_gene_res)])
#
#   #get number of SNPs from s1 results; adjust for thin argument
#   ctwas_res_s1 <- data.table::fread(paste0(results_dir, "/", analysis_id, "_ctwas.s1.susieIrss.txt"))
#   n_snps <- sum(ctwas_res_s1$type=="SNP")/thin
#   rm(ctwas_res_s1)
#
#   #load estimated parameters
#   load(paste0(results_dir, "/", analysis_id, "_ctwas.s2.susieIrssres.Rd"))
#
#   #estimated group prior
#   estimated_group_prior <- group_prior_rec[,ncol(group_prior_rec)]
#   names(estimated_group_prior) <- c("gene", "snp")
#   estimated_group_prior["snp"] <- estimated_group_prior["snp"]*thin #adjust parameter to account for thin argument
#
#   #estimated group prior variance
#   estimated_group_prior_var <- group_prior_var_rec[,ncol(group_prior_var_rec)]
#   names(estimated_group_prior_var) <- c("gene", "snp")
#
#   #report group size
#   group_size <- c(nrow(ctwas_gene_res), n_snps)
#
#   #estimated group PVE
#   estimated_group_pve <- estimated_group_prior_var*estimated_group_prior*group_size/sample_size
#   names(estimated_group_pve) <- c("gene", "snp")
#
#   #ctwas genes using PIP>0.8
#   ctwas_genes_index <- ctwas_gene_res$susie_pip>0.8
#   ctwas_genes <- ctwas_gene_res$genename[ctwas_genes_index]
#
#   #twas genes using bonferroni threshold
#   alpha <- 0.05
#   sig_thresh <- qnorm(1-(alpha/nrow(ctwas_gene_res)/2), lower=T)
#
#   twas_genes_index <- abs(ctwas_gene_res$z) > sig_thresh
#   twas_genes <- ctwas_gene_res$genename[twas_genes_index]
#
#   #gene PIPs and z scores
#   gene_pips <- ctwas_gene_res[,c("genename", "region_tag", "susie_pip", "z", "region_cs_tag")]
#
#   #total PIPs by region
#   regions <- unique(ctwas_gene_res$region_tag)
#   region_pips <- data.frame(region=regions, stringsAsFactors=F)
#   region_pips$gene_pip <- sapply(regions, function(x){sum(ctwas_gene_res$susie_pip[ctwas_gene_res$region_tag==x])})
#   region_pips$snp_pip <- sapply(regions, function(x){sum(ctwas_snp_res$susie_pip[ctwas_snp_res$region_tag==x])})
#   region_pips$snp_maxz <- sapply(regions, function(x){max(abs(ctwas_snp_res$z[ctwas_snp_res$region_tag==x]))})
#
#   #total PIPs by causal set
#   regions_cs <- unique(ctwas_gene_res$region_cs_tag)
#   region_cs_pips <- data.frame(region_cs=regions_cs, stringsAsFactors=F)
#   region_cs_pips$gene_pip <- sapply(regions_cs, function(x){sum(ctwas_gene_res$susie_pip[ctwas_gene_res$region_cs_tag==x])})
#   region_cs_pips$snp_pip <- sapply(regions_cs, function(x){sum(ctwas_snp_res$susie_pip[ctwas_snp_res$region_cs_tag==x])})
#
#   df[[weight]] <- list(prior=estimated_group_prior,
#                      prior_var=estimated_group_prior_var,
#                      pve=estimated_group_pve,
#                      ctwas=ctwas_genes,
#                      twas=twas_genes,
#                      gene_pips=gene_pips,
#                      region_pips=region_pips,
#                      sig_thresh=sig_thresh,
#                      region_cs_pips=region_cs_pips)
# }
#
# save(df, file=paste(trait_dir, "results_df.RData", sep="/"))
load(paste(trait_dir, "results_df.RData", sep="/"))

output <- data.frame(weight=names(df),
                     prior_g=unlist(lapply(df, function(x){x$prior["gene"]})),
                     prior_s=unlist(lapply(df, function(x){x$prior["snp"]})),
                     prior_var_g=unlist(lapply(df, function(x){x$prior_var["gene"]})),
                     prior_var_s=unlist(lapply(df, function(x){x$prior_var["snp"]})),
                     pve_g=unlist(lapply(df, function(x){x$pve["gene"]})),
                     pve_s=unlist(lapply(df, function(x){x$pve["snp"]})),
                     n_ctwas=unlist(lapply(df, function(x){length(x$ctwas)})),
                     n_twas=unlist(lapply(df, function(x){length(x$twas)})),
                     row.names=NULL,
                     stringsAsFactors=F)
Plot estimated prior parameters and PVE
#plot estimated group prior

output <- output[order(-output$prior_g),]

par(mar=c(10.1, 4.1, 4.1, 2.1))

plot(output$prior_g, type="l", ylim=c(0, max(output$prior_g, output$prior_s)*1.1),
     xlab="", ylab="Estimated Group Prior", xaxt = "n", col="blue")
lines(output$prior_s)

axis(1, at = 1:nrow(output),
     labels = output$weight,
     las=2,
     cex.axis=0.6)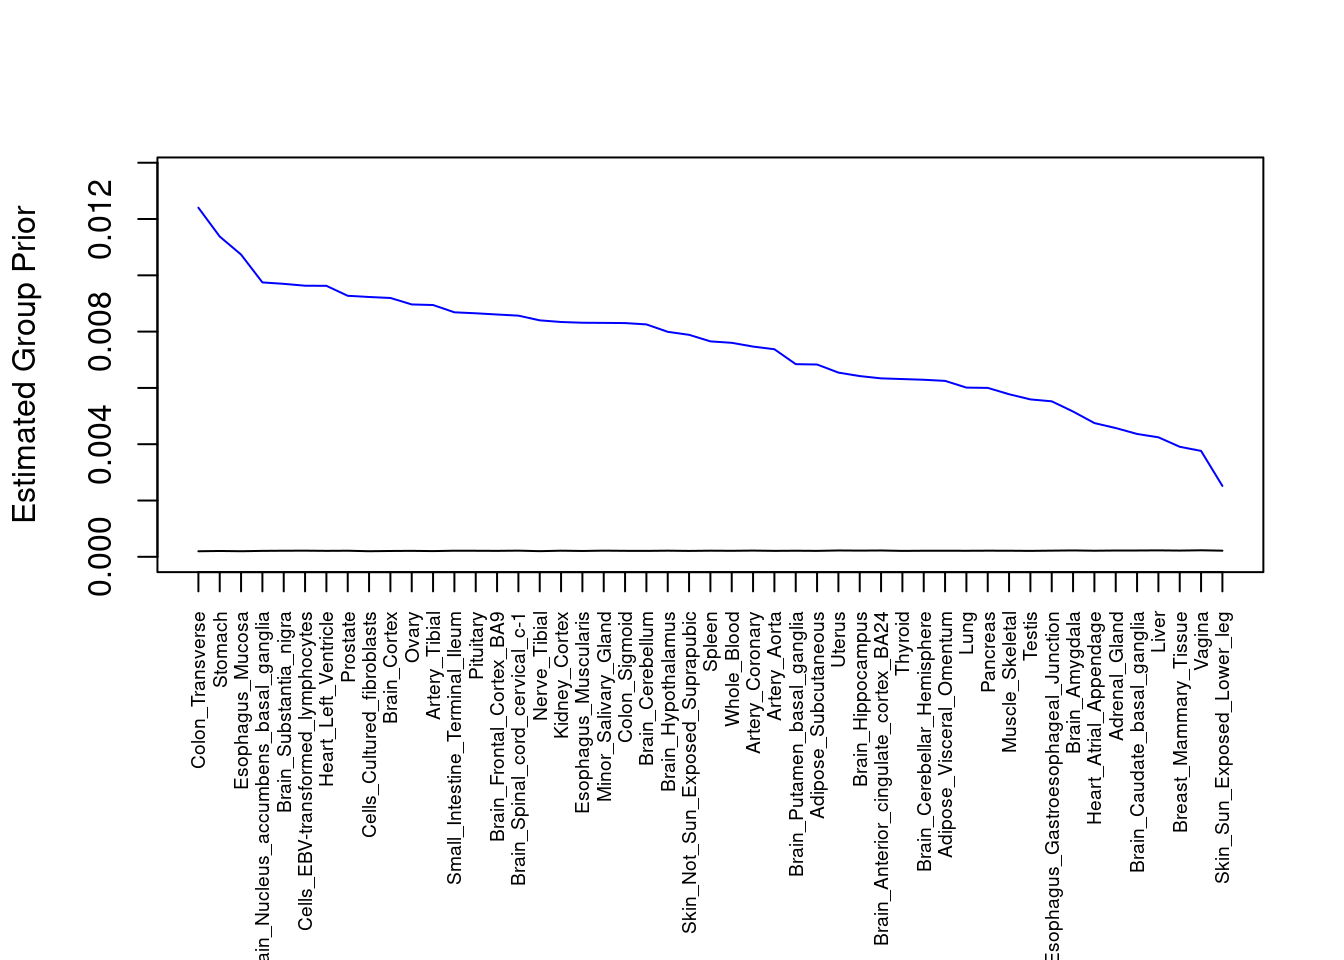
####################
#plot estimated group prior variance

par(mar=c(10.1, 4.1, 4.1, 2.1))

plot(output$prior_var_g, type="l", ylim=c(0, max(output$prior_var_g, output$prior_var_s)*1.1),
     xlab="", ylab="Estimated Group Prior Variance", xaxt = "n", col="blue")
lines(output$prior_var_s)

axis(1, at = 1:nrow(output),
     labels = output$weight,
     las=2,
     cex.axis=0.6)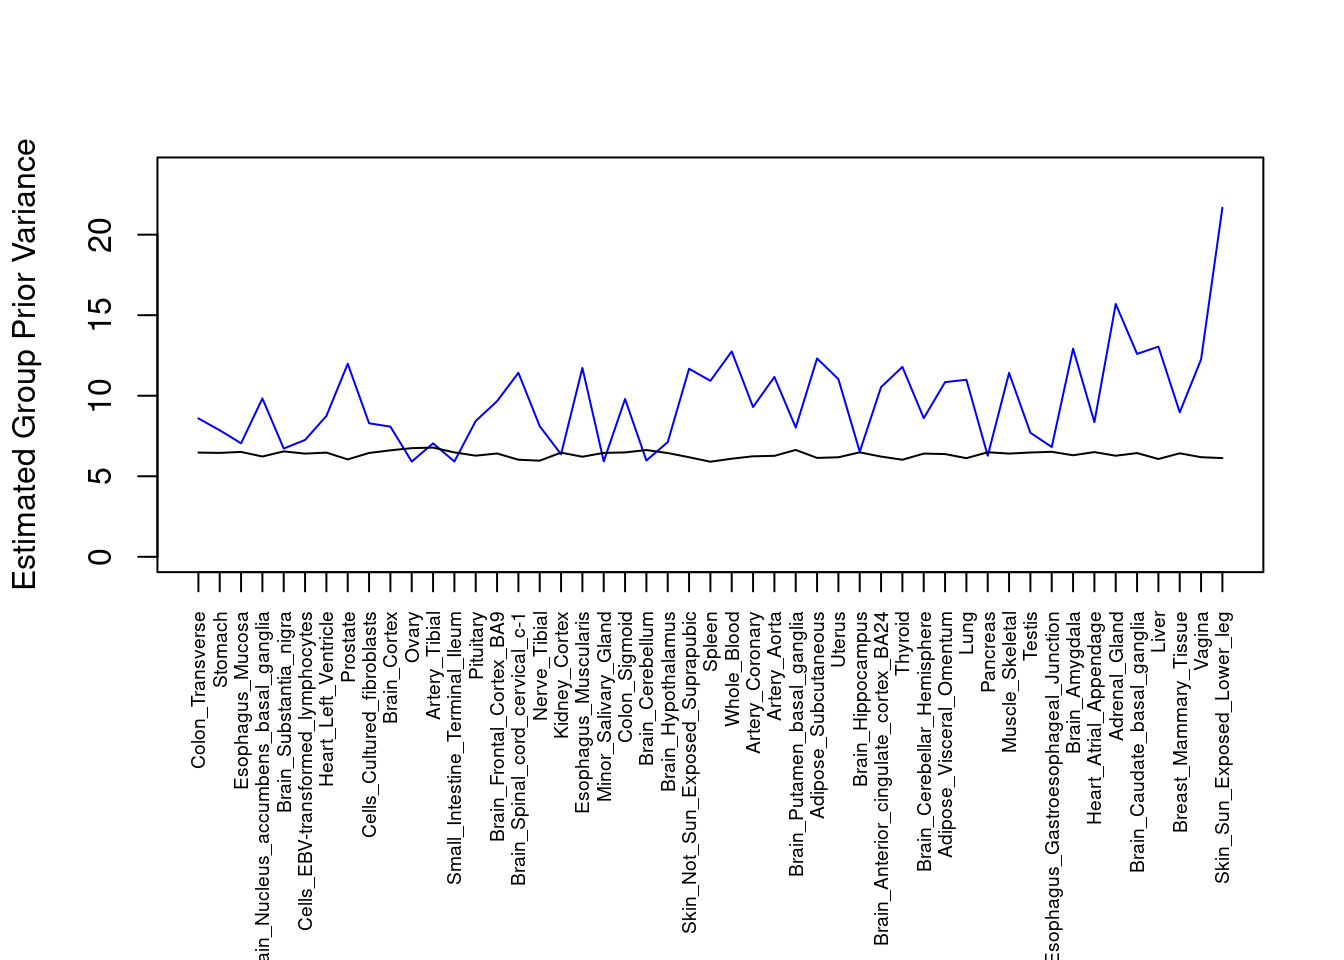
####################
#plot PVE

output <- output[order(-output$pve_g),]

par(mar=c(10.1, 4.1, 4.1, 2.1))

plot(output$pve_g, type="l", ylim=c(0, max(output$pve_g+output$pve_s)*1.1),
     xlab="", ylab="Estimated PVE", xaxt = "n", col="blue")
lines(output$pve_s)
lines(output$pve_g+output$pve_s, lty=2)

axis(1, at = 1:nrow(output),
     labels = output$weight,
     las=2,
     cex.axis=0.6)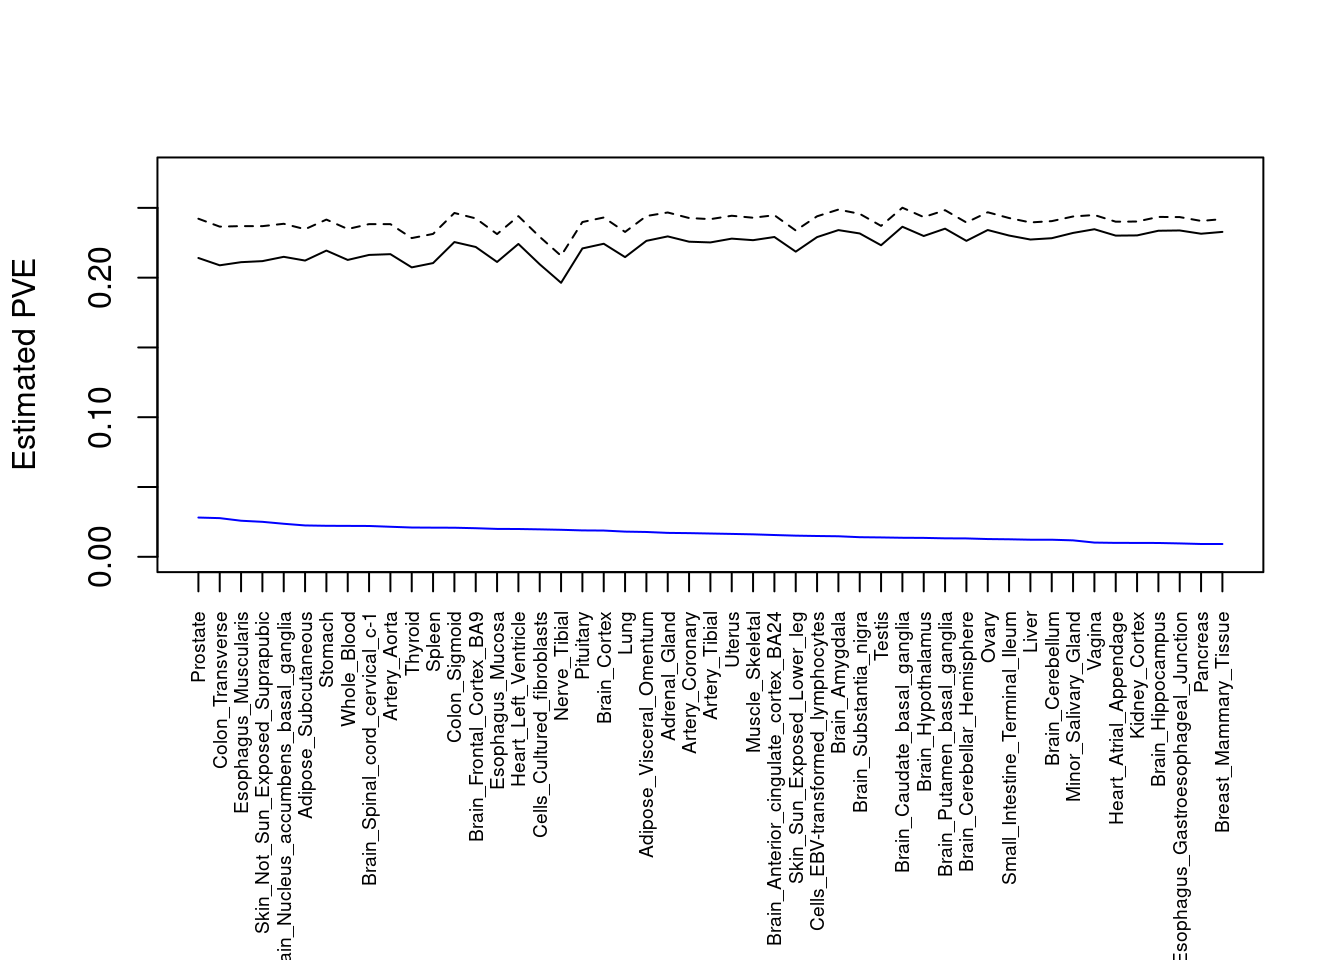
Number of cTWAS and TWAS genes
cTWAS genes are the set of genes with PIP>0.8 in any tissue. TWAS genes are the set of genes with significant z score (Bonferroni within tissue) in any tissue.
#plot number of significant cTWAS and TWAS genes in each tissue
plot(output$n_ctwas, output$n_twas, xlab="Number of cTWAS Genes", ylab="Number of TWAS Genes")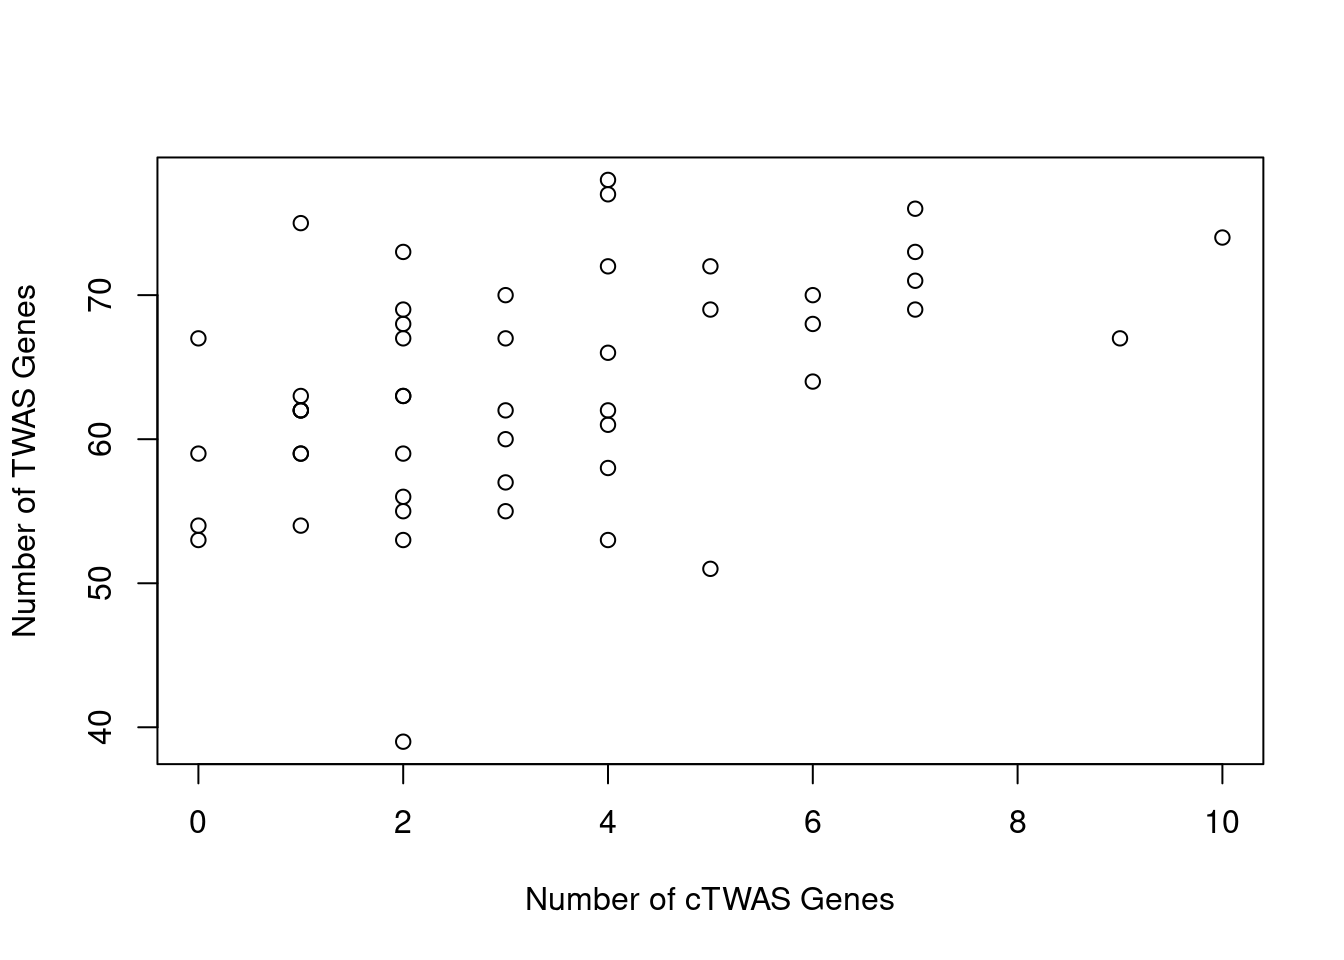
#number of ctwas_genes
ctwas_genes <- unique(unlist(lapply(df, function(x){x$ctwas})))
length(ctwas_genes)
[1] 55#number of twas_genes
twas_genes <- unique(unlist(lapply(df, function(x){x$twas})))
length(twas_genes)[1] 324Enrichment analysis for cTWAS genes
GO
#enrichment for cTWAS genes using enrichR
library(enrichR)
Welcome to enrichR
Checking connection ... Enrichr ... Connection is Live!
FlyEnrichr ... Connection is available!
WormEnrichr ... Connection is available!
YeastEnrichr ... Connection is available!
FishEnrichr ... Connection is available!dbs <- c("GO_Biological_Process_2021", "GO_Cellular_Component_2021", "GO_Molecular_Function_2021")
GO_enrichment <- enrichr(ctwas_genes, dbs)Uploading data to Enrichr... Done.
Querying GO_Biological_Process_2021... Done.
Querying GO_Cellular_Component_2021... Done.
Querying GO_Molecular_Function_2021... Done.
Parsing results... Done.for (db in dbs){
cat(paste0(db, "\n\n"))
enrich_results <- GO_enrichment[[db]]
enrich_results <- enrich_results[enrich_results$Adjusted.P.value<0.05,c("Term", "Overlap", "Adjusted.P.value", "Genes")]
print(enrich_results)
print(plotEnrich(GO_enrichment[[db]]))
}GO_Biological_Process_2021
Term Overlap Adjusted.P.value Genes
1 cytokine-mediated signaling pathway (GO:0019221) 11/621 0.0004508473 MUC1;TNFRSF6B;FCER1G;CCL20;TNFSF15;IRF8;IRF5;TNFRSF14;CCR5;CXCL5;IP6K2
2 positive regulation of antigen receptor-mediated signaling pathway (GO:0050857) 3/21 0.0069615838 PRKCB;RAB29;PRKD2
3 immunoglobulin mediated immune response (GO:0016064) 2/10 0.0316384051 FCER1G;CARD9
4 negative regulation of transmembrane transport (GO:0034763) 2/10 0.0316384051 PRKCB;OAZ3
5 positive regulation of vascular endothelial growth factor receptor signaling pathway (GO:0030949) 2/10 0.0316384051 PRKCB;PRKD2
6 neutrophil mediated immunity (GO:0002446) 7/488 0.0316384051 TSPAN14;FCER1G;FCGR2A;CARD9;HSPA6;ITGAL;APEH
7 B cell mediated immunity (GO:0019724) 2/11 0.0316384051 FCER1G;CARD9
8 positive regulation of lymphocyte migration (GO:2000403) 2/14 0.0381610075 CCL20;TNFRSF14
9 positive regulation of T cell receptor signaling pathway (GO:0050862) 2/14 0.0381610075 RAB29;PRKD2
10 cellular response to type I interferon (GO:0071357) 3/65 0.0381610075 IRF8;IRF5;IP6K2
11 type I interferon signaling pathway (GO:0060337) 3/65 0.0381610075 IRF8;IRF5;IP6K2
12 neutrophil chemotaxis (GO:0030593) 3/70 0.0434150304 FCER1G;CCL20;CXCL5
13 granulocyte chemotaxis (GO:0071621) 3/73 0.0452698037 FCER1G;CCL20;CXCL5
14 neutrophil migration (GO:1990266) 3/77 0.0490577366 FCER1G;CCL20;CXCL5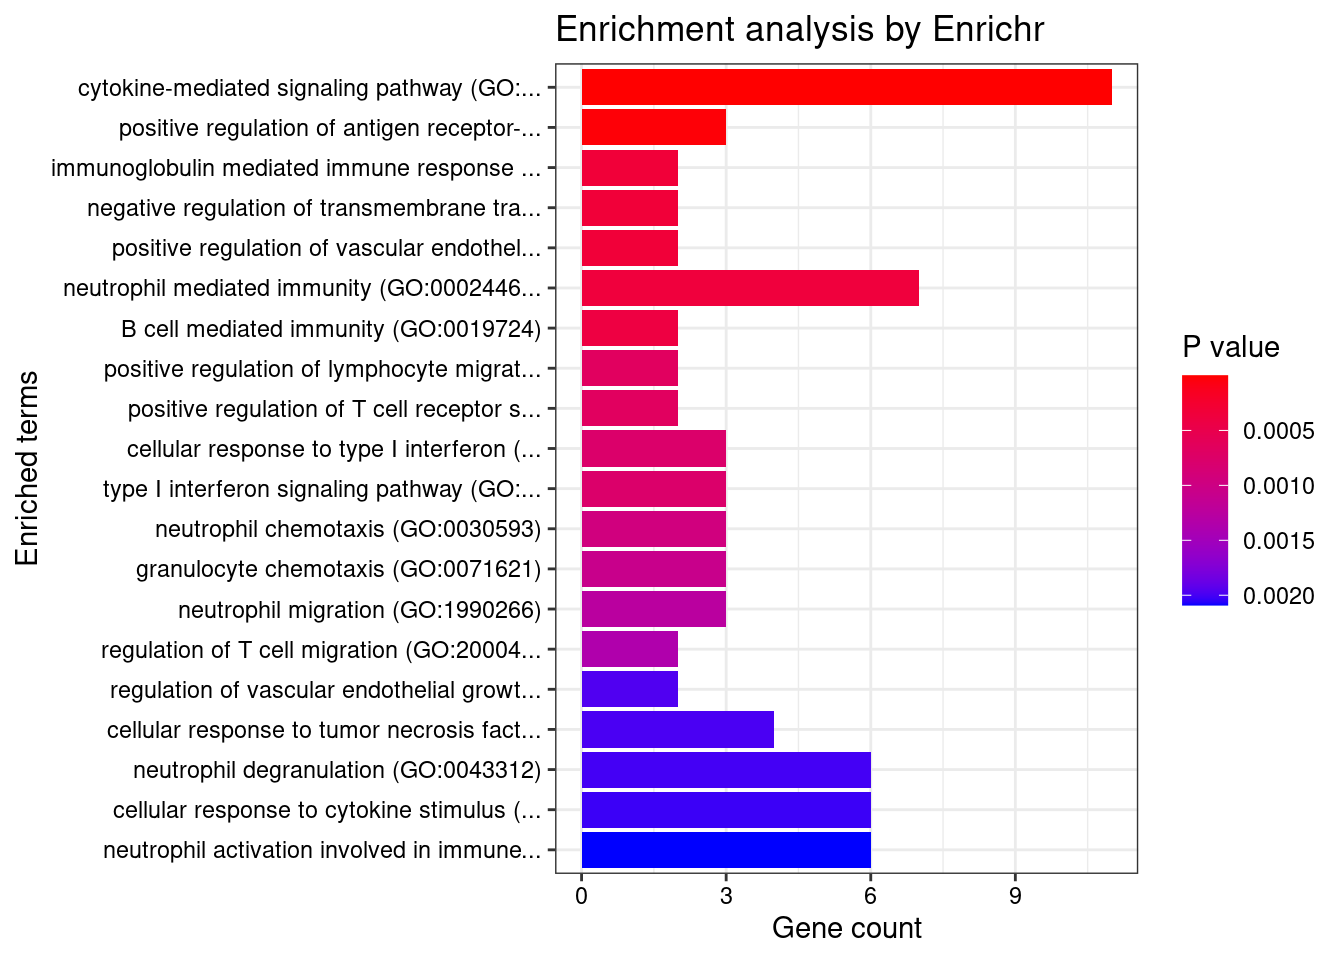
GO_Cellular_Component_2021

[1] Term             Overlap          Adjusted.P.value Genes
<0 rows> (or 0-length row.names)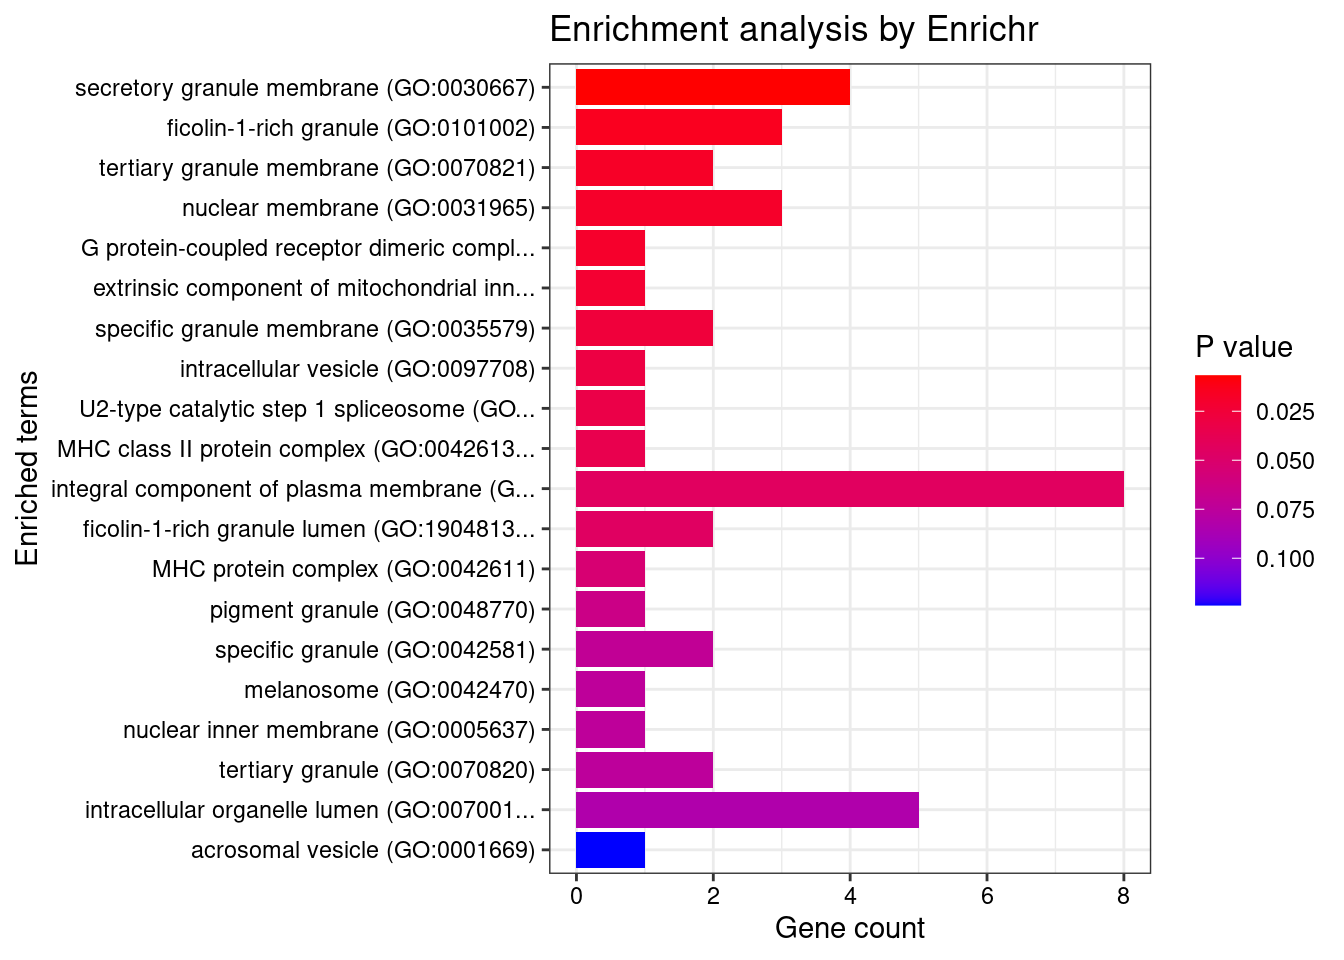
GO_Molecular_Function_2021

[1] Term             Overlap          Adjusted.P.value Genes
<0 rows> (or 0-length row.names)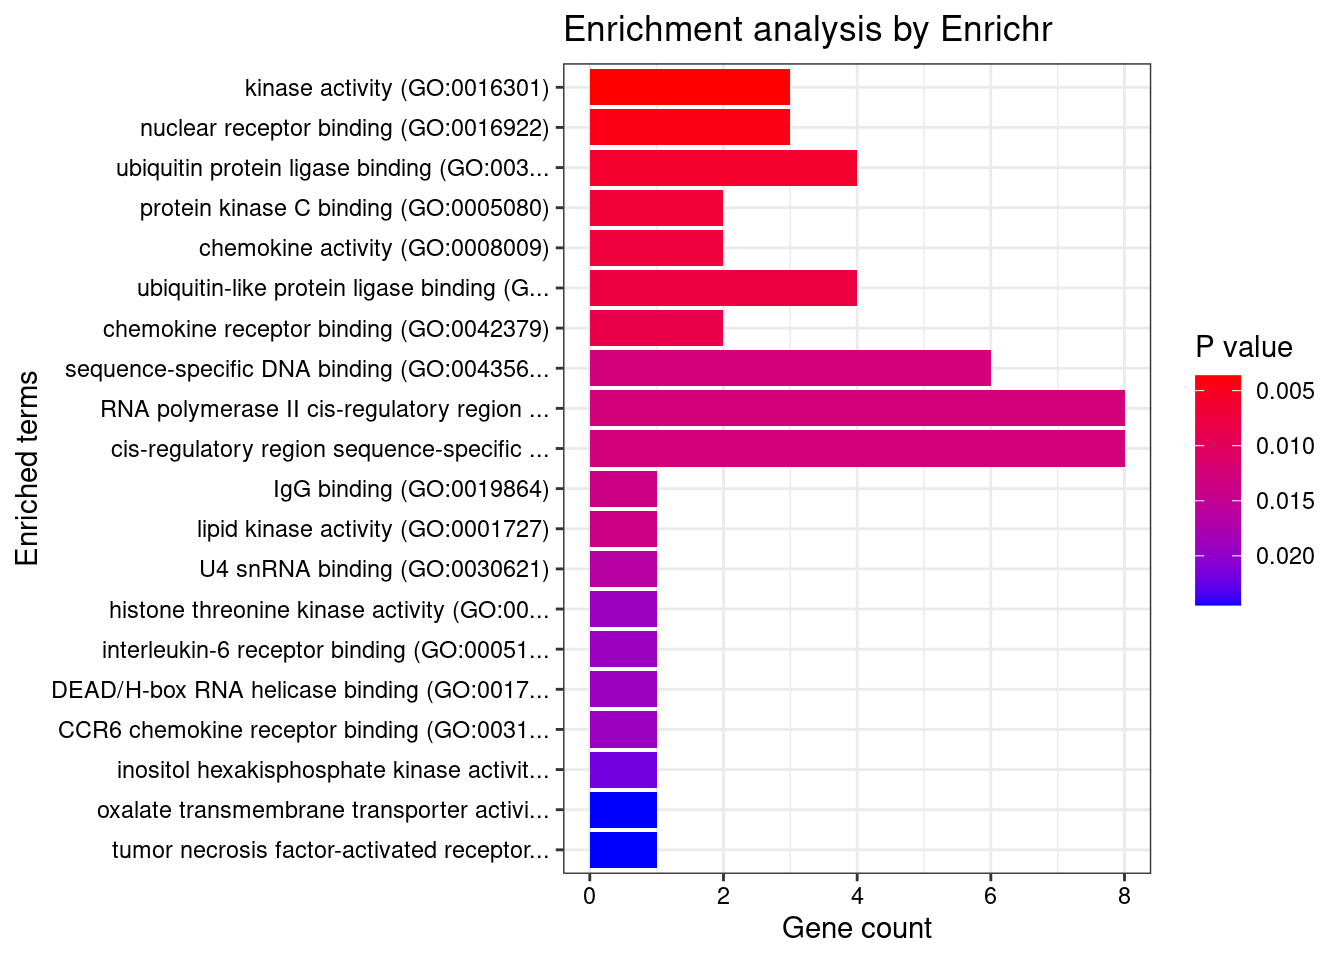
KEGG
#enrichment for cTWAS genes using KEGG

library(WebGestaltR)******************************************* ** Welcome to WebGestaltR ! ** *******************************************background <- unique(unlist(lapply(df, function(x){x$gene_pips$genename})))
#listGeneSet()
databases <- c("pathway_KEGG")
enrichResult <- WebGestaltR(enrichMethod="ORA", organism="hsapiens",
interestGene=ctwas_genes, referenceGene=background,
enrichDatabase=databases, interestGeneType="genesymbol",
referenceGeneType="genesymbol", isOutput=F)Loading the functional categories...
Loading the ID list...
Loading the reference list...
Performing the enrichment analysis...Warning in oraEnrichment(interestGeneList, referenceGeneList, geneSet, minNum = minNum, : No significant gene set is identified based on FDR 0.05!enrichResult[,c("description", "size", "overlap", "FDR", "userId")]NULLDisGeNET
#enrichment for cTWAS genes using DisGeNET
# devtools::install_bitbucket("ibi_group/disgenet2r")
library(disgenet2r)
disgenet_api_key <- get_disgenet_api_key(
email = "wesleycrouse@gmail.com",
password = "uchicago1" )
Sys.setenv(DISGENET_API_KEY= disgenet_api_key)
res_enrich <- disease_enrichment(entities=ctwas_genes, vocabulary = "HGNC", database = "CURATED")HLA-DOB gene(s) from the input list not found in DisGeNET CURATEDZNF736 gene(s) from the input list not found in DisGeNET CURATEDAPEH gene(s) from the input list not found in DisGeNET CURATEDRP11-973H7.1 gene(s) from the input list not found in DisGeNET CURATEDNXPE1 gene(s) from the input list not found in DisGeNET CURATEDLST1 gene(s) from the input list not found in DisGeNET CURATEDDDX39B gene(s) from the input list not found in DisGeNET CURATEDLINC02009 gene(s) from the input list not found in DisGeNET CURATEDTTPAL gene(s) from the input list not found in DisGeNET CURATEDLINC01126 gene(s) from the input list not found in DisGeNET CURATEDSDCCAG3 gene(s) from the input list not found in DisGeNET CURATEDBIK gene(s) from the input list not found in DisGeNET CURATEDRAB29 gene(s) from the input list not found in DisGeNET CURATEDZGLP1 gene(s) from the input list not found in DisGeNET CURATEDC1orf74 gene(s) from the input list not found in DisGeNET CURATEDZGPAT gene(s) from the input list not found in DisGeNET CURATEDTSPAN14 gene(s) from the input list not found in DisGeNET CURATEDCASC3 gene(s) from the input list not found in DisGeNET CURATEDAP006621.5 gene(s) from the input list not found in DisGeNET CURATEDRNF186 gene(s) from the input list not found in DisGeNET CURATEDRP11-107M16.2 gene(s) from the input list not found in DisGeNET CURATEDOAZ3 gene(s) from the input list not found in DisGeNET CURATEDC1orf106 gene(s) from the input list not found in DisGeNET CURATEDTNFRSF6B gene(s) from the input list not found in DisGeNET CURATEDFAM171B gene(s) from the input list not found in DisGeNET CURATEDIPO8 gene(s) from the input list not found in DisGeNET CURATEDif (any(res_enrich@qresult$FDR < 0.05)){
print(res_enrich@qresult[res_enrich@qresult$FDR < 0.05, c("Description", "FDR", "Ratio", "BgRatio")])
} Description FDR Ratio BgRatio
21 Ulcerative Colitis 1.664880e-09 8/29 63/9703
10 Behcet Syndrome 5.011976e-03 3/29 24/9703
49 Inflammatory Bowel Diseases 1.056851e-02 3/29 35/9703
85 Ankylosing spondylitis 2.508724e-02 2/29 11/9703
5 Anovulation 2.677712e-02 1/29 1/9703
7 Rheumatoid Arthritis 2.677712e-02 4/29 174/9703
33 Enteritis 2.677712e-02 1/29 1/9703
83 Systemic Scleroderma 2.677712e-02 2/29 19/9703
92 Ureteral obstruction 2.677712e-02 2/29 24/9703
95 West Nile Fever 2.677712e-02 1/29 1/9703
120 Congenital chloride diarrhea 2.677712e-02 1/29 1/9703
153 Encephalitis, West Nile Fever 2.677712e-02 1/29 1/9703
154 West Nile Fever Meningitis 2.677712e-02 1/29 1/9703
155 West Nile Fever Meningoencephalitis 2.677712e-02 1/29 1/9703
156 West Nile Fever Myelitis 2.677712e-02 1/29 1/9703
171 Deep seated dermatophytosis 2.677712e-02 1/29 1/9703
180 Retinitis Pigmentosa 26 2.677712e-02 1/29 1/9703
185 Medullary cystic kidney disease 1 2.677712e-02 1/29 1/9703
189 DIABETES MELLITUS, INSULIN-DEPENDENT, 22 (disorder) 2.677712e-02 1/29 1/9703
190 Inflammatory Bowel Disease 14 2.677712e-02 1/29 1/9703
191 SPINOCEREBELLAR ATAXIA, AUTOSOMAL RECESSIVE 9 2.677712e-02 1/29 1/9703
194 LOEYS-DIETZ SYNDROME 3 2.677712e-02 1/29 1/9703
202 IMMUNODEFICIENCY 32A 2.677712e-02 1/29 1/9703
205 IMMUNODEFICIENCY 32B 2.677712e-02 1/29 1/9703
73 Pancreatic Neoplasm 2.750256e-02 3/29 100/9703
134 Malignant neoplasm of pancreas 2.796799e-02 3/29 102/9703
182 Visceral myopathy familial external ophthalmoplegia 4.278157e-02 1/29 2/9703
184 Candidiasis, Familial, 2 4.278157e-02 1/29 2/9703
193 MITOCHONDRIAL DNA DEPLETION SYNDROME 5 (ENCEPHALOMYOPATHIC WITH OR WITHOUT METHYLMALONIC ACIDURIA) 4.278157e-02 1/29 2/9703
210 Mitochondrial DNA Depletion Syndrome 1 4.278157e-02 1/29 2/9703
106 Crohn's disease of large bowel 4.775785e-02 2/29 44/9703
119 Crohn's disease of the ileum 4.775785e-02 2/29 44/9703
146 Regional enteritis 4.775785e-02 2/29 44/9703
163 IIeocolitis 4.775785e-02 2/29 44/9703
19 Primary biliary cirrhosis 4.929214e-02 2/29 47/9703
63 Meniere Disease 4.929214e-02 1/29 3/9703
160 MITOCHONDRIAL NEUROGASTROINTESTINAL ENCEPHALOPATHY SYNDROME 4.929214e-02 1/29 3/9703
181 COENZYME Q10 DEFICIENCY 4.929214e-02 1/29 3/9703
198 COENZYME Q10 DEFICIENCY, PRIMARY, 1 4.929214e-02 1/29 3/9703Gene sets curated by Macarthur Lab
gene_set_dir <- "/project2/mstephens/wcrouse/gene_sets/"
gene_set_files <- c("gwascatalog.tsv",
"mgi_essential.tsv",
"core_essentials_hart.tsv",
"clinvar_path_likelypath.tsv",
"fda_approved_drug_targets.tsv")
gene_sets <- lapply(gene_set_files, function(x){as.character(read.table(paste0(gene_set_dir, x))[,1])})
names(gene_sets) <- sapply(gene_set_files, function(x){unlist(strsplit(x, "[.]"))[1]})
gene_lists <- list(ctwas_genes=ctwas_genes)
#background is union of genes analyzed in all tissue
background <- unique(unlist(lapply(df, function(x){x$gene_pips$genename})))
#genes in gene_sets filtered to ensure inclusion in background
gene_sets <- lapply(gene_sets, function(x){x[x %in% background]})
####################
hyp_score <- data.frame()
size <- c()
ngenes <- c()
for (i in 1:length(gene_sets)) {
for (j in 1:length(gene_lists)){
group1 <- length(gene_sets[[i]])
group2 <- length(as.vector(gene_lists[[j]]))
size <- c(size, group1)
Overlap <- length(intersect(gene_sets[[i]],as.vector(gene_lists[[j]])))
ngenes <- c(ngenes, Overlap)
Total <- length(background)
hyp_score[i,j] <- phyper(Overlap-1, group2, Total-group2, group1,lower.tail=F)
}
}
rownames(hyp_score) <- names(gene_sets)
colnames(hyp_score) <- names(gene_lists)
hyp_score_padj <- apply(hyp_score,2, p.adjust, method="BH", n=(nrow(hyp_score)*ncol(hyp_score)))
hyp_score_padj <- as.data.frame(hyp_score_padj)
hyp_score_padj$gene_set <- rownames(hyp_score_padj)
hyp_score_padj$nset <- size
hyp_score_padj$ngenes <- ngenes
hyp_score_padj$percent <- ngenes/size
hyp_score_padj <- hyp_score_padj[order(hyp_score_padj$ctwas_genes),]
colnames(hyp_score_padj)[1] <- "padj"
hyp_score_padj <- hyp_score_padj[,c(2:5,1)]
rownames(hyp_score_padj)<- NULL
hyp_score_padj gene_set nset ngenes percent padj
1 gwascatalog 5971 34 0.005694189 5.590823e-07
2 fda_approved_drug_targets 352 5 0.014204545 4.921942e-03
3 clinvar_path_likelypath 2771 9 0.003247925 4.436892e-01
4 mgi_essential 2304 5 0.002170139 8.866385e-01
5 core_essentials_hart 264 0 0.000000000 1.000000e+00Enrichment analysis for TWAS genes
#enrichment for TWAS genes
dbs <- c("GO_Biological_Process_2021", "GO_Cellular_Component_2021", "GO_Molecular_Function_2021")
GO_enrichment <- enrichr(twas_genes, dbs)Uploading data to Enrichr... Done.
Querying GO_Biological_Process_2021... Done.
Querying GO_Cellular_Component_2021... Done.
Querying GO_Molecular_Function_2021... Done.
Parsing results... Done.for (db in dbs){
cat(paste0(db, "\n\n"))
enrich_results <- GO_enrichment[[db]]
enrich_results <- enrich_results[enrich_results$Adjusted.P.value<0.05,c("Term", "Overlap", "Adjusted.P.value", "Genes")]
print(enrich_results)
print(plotEnrich(GO_enrichment[[db]]))
}GO_Biological_Process_2021
Term Overlap Adjusted.P.value Genes
1 interferon-gamma-mediated signaling pathway (GO:0060333) 17/68 1.087351e-12 HLA-DRB5;CAMK2A;HLA-B;HLA-C;HLA-F;HLA-DPB1;IRF8;HLA-DRA;IRF5;JAK2;TRIM31;HLA-DQA2;HLA-DQB2;HLA-DQA1;HLA-DRB1;HLA-DPA1;HLA-DQB1
2 cytokine-mediated signaling pathway (GO:0019221) 42/621 4.454467e-12 CSF3;TNFRSF6B;TRAF3IP2;IL23R;CAMK2A;IL27;TNF;CXCL5;MUC1;PSMD3;CXCR2;TNFRSF14;JAK2;HLA-DQA2;HLA-DQA1;HLA-DPA1;IL12RB2;IP6K2;STAT5A;HLA-DRB5;FCER1G;IL1R1;TNFSF15;GPR35;CCL20;STAT3;HLA-B;HLA-C;PPBP;HLA-F;BOLA2;HLA-DPB1;LTA;HLA-DRA;IRF8;TNFSF8;IRF5;TRIM31;STX1A;HLA-DRB1;HLA-DQB2;HLA-DQB1
3 cellular response to interferon-gamma (GO:0071346) 20/121 4.926819e-12 HLA-DRB5;CCL20;CAMK2A;HLA-B;HLA-C;HLA-F;AIF1;HLA-DPB1;HLA-DRA;IRF8;IRF5;JAK2;TRIM31;HLA-DQA2;HLA-DQA1;HLA-DRB1;SLC26A6;HLA-DQB2;HLA-DPA1;HLA-DQB1
4 antigen processing and presentation of exogenous peptide antigen (GO:0002478) 17/103 4.167731e-10 HLA-DRB5;FCER1G;HLA-F;HLA-DMA;HLA-DMB;HLA-DPB1;HLA-DRA;HLA-DOA;FCGR2B;HLA-DOB;HLA-DQA2;AP1M2;HLA-DQA1;HLA-DRB1;HLA-DQB2;HLA-DPA1;HLA-DQB1
5 antigen processing and presentation of exogenous peptide antigen via MHC class II (GO:0019886) 16/98 1.892887e-09 HLA-DRB5;FCER1G;HLA-DMA;HLA-DMB;HLA-DPB1;HLA-DRA;HLA-DOA;FCGR2B;HLA-DOB;HLA-DQA2;AP1M2;HLA-DQA1;HLA-DRB1;HLA-DQB2;HLA-DPA1;HLA-DQB1
6 antigen processing and presentation of peptide antigen via MHC class II (GO:0002495) 16/100 2.175408e-09 HLA-DRB5;FCER1G;HLA-DMA;HLA-DMB;HLA-DPB1;HLA-DRA;HLA-DOA;FCGR2B;HLA-DOB;HLA-DQA2;AP1M2;HLA-DQA1;HLA-DRB1;HLA-DQB2;HLA-DPA1;HLA-DQB1
7 antigen receptor-mediated signaling pathway (GO:0050851) 15/185 1.113644e-04 HLA-DRB5;PRKCB;BTNL2;LIME1;PSMD3;HLA-DPB1;HLA-DRA;PRKD2;HLA-DQA2;ICOSLG;HLA-DQA1;HLA-DRB1;HLA-DQB2;HLA-DPA1;HLA-DQB1
8 peptide antigen assembly with MHC protein complex (GO:0002501) 4/6 2.631908e-04 HLA-DMA;HLA-DMB;HLA-DRA;HLA-DRB1
9 T cell receptor signaling pathway (GO:0050852) 13/158 4.091583e-04 HLA-DRB5;BTNL2;PSMD3;HLA-DPB1;HLA-DRA;PRKD2;HLA-DQA2;ICOSLG;HLA-DQA1;HLA-DRB1;HLA-DQB2;HLA-DPA1;HLA-DQB1
10 antigen processing and presentation of endogenous peptide antigen (GO:0002483) 5/14 4.091583e-04 TAP2;TAP1;HLA-DRA;HLA-F;HLA-DRB1
11 positive regulation of cytokine production (GO:0001819) 19/335 4.972561e-04 CD274;FCER1G;IL1R1;IL23R;CARD9;STAT3;IL27;PARK7;AGPAT1;AIF1;TNF;AGER;HLA-DPB1;PRKD2;TNFRSF14;IRF5;HSPA1B;HLA-DPA1;IL12RB2
12 regulation of T cell proliferation (GO:0042129) 9/76 6.706539e-04 CD274;HLA-DMB;IL23R;HLA-DPB1;IL27;TNFSF8;AIF1;HLA-DRB1;HLA-DPA1
13 regulation of T cell mediated cytotoxicity (GO:0001914) 6/29 9.808016e-04 IL23R;HLA-B;HLA-DRA;HLA-F;AGER;HLA-DRB1
14 positive regulation of T cell proliferation (GO:0042102) 8/66 1.680122e-03 CD274;HLA-DMB;IL23R;HLA-DPB1;AGER;AIF1;ICOSLG;HLA-DPA1
15 antigen processing and presentation of peptide antigen via MHC class I (GO:0002474) 6/33 1.876720e-03 FCER1G;HLA-B;TAP2;HLA-C;TAP1;HLA-F
16 regulation of immune effector process (GO:0002697) 7/53 2.971441e-03 C4B;C4A;HLA-DRA;FCGR2B;CFB;HLA-DRB1;C2
17 inflammatory response (GO:0006954) 14/230 3.119641e-03 PTGIR;TRAF3IP2;CCL20;PTGER3;STAT3;PPBP;ITGAL;AIF1;TNF;CXCL5;NCR3;CXCR2;REL;FCGR2B
18 regulation of immune response (GO:0050776) 12/179 4.378004e-03 FCGR3A;NCR3;FCGR2A;HLA-B;HLA-C;HLA-DRA;ICAM5;HLA-F;ITGAL;FCGR2B;HLA-DRB1;MICB
19 positive regulation of T cell mediated cytotoxicity (GO:0001916) 5/26 6.030978e-03 IL23R;HLA-B;HLA-DRA;HLA-F;HLA-DRB1
20 positive regulation of lymphocyte migration (GO:2000403) 4/14 6.339425e-03 CCL20;TNFRSF14;AIF1;RHOA
21 positive regulation of leukocyte mediated cytotoxicity (GO:0001912) 6/43 6.439581e-03 NCR3;IL23R;HLA-B;HLA-DRA;HLA-F;HLA-DRB1
22 regulation of interferon-gamma production (GO:0032649) 8/86 7.210901e-03 CD274;IL1R1;IL23R;HLA-DPB1;IL27;HLA-DRB1;HLA-DPA1;IL12RB2
23 regulation of T-helper cell differentiation (GO:0045622) 3/6 7.210901e-03 HLA-DRA;IL27;HLA-DRB1
24 intracellular pH elevation (GO:0051454) 3/6 7.210901e-03 CLN3;SLC26A3;SLC26A6
25 regulation of interleukin-10 production (GO:0032653) 6/48 1.017320e-02 CD274;IL23R;STAT3;FCGR2B;AGER;HLA-DRB1
26 negative regulation of interleukin-10 production (GO:0032693) 4/17 1.068648e-02 CD274;IL23R;FCGR2B;AGER
27 antigen processing and presentation of endogenous peptide antigen via MHC class I via ER pathway (GO:0002484) 3/7 1.068648e-02 HLA-B;HLA-C;HLA-F
28 antigen processing and presentation of endogenous peptide antigen via MHC class I via ER pathway, TAP-independent (GO:0002486) 3/7 1.068648e-02 HLA-B;HLA-C;HLA-F
29 regulation of cytokine production (GO:0001817) 10/150 1.259266e-02 PPP1R11;CARD9;HLA-B;IRF8;BTNL2;AGPAT1;FCGR2B;TNF;ICOSLG;HLA-DRB1
30 positive regulation of DNA-binding transcription factor activity (GO:0051091) 13/246 1.313917e-02 CSF3;CRTC3;SMAD3;PRKCB;CARD9;STAT3;CAMK2A;PARK7;TNF;AGER;PRKD2;TRIM31;HSPA1B
31 positive regulation of phagocytosis (GO:0050766) 6/53 1.313917e-02 C4B;C4A;FCER1G;FCGR2B;TNF;C2
32 regulation of lymphocyte proliferation (GO:0050670) 4/19 1.313917e-02 LST1;IL27;TNFSF8;IKZF3
33 antigen processing and presentation of exogenous peptide antigen via MHC class I, TAP-independent (GO:0002480) 3/8 1.313917e-02 HLA-B;HLA-C;HLA-F
34 regulation of apoptotic cell clearance (GO:2000425) 3/8 1.313917e-02 C4B;C4A;C2
35 regulation of CD4-positive, alpha-beta T cell activation (GO:2000514) 3/8 1.313917e-02 HLA-DRA;AGER;HLA-DRB1
36 positive regulation of apoptotic cell clearance (GO:2000427) 3/8 1.313917e-02 C4B;C4A;C2
37 regulation of T cell migration (GO:2000404) 4/20 1.442407e-02 CCL20;TNFRSF14;AIF1;RHOA
38 macrophage activation (GO:0042116) 5/36 1.442407e-02 CRTC3;JAK2;AGER;AIF1;TNF
39 positive regulation of T cell mediated immunity (GO:0002711) 5/36 1.442407e-02 IL23R;HLA-B;HLA-DRA;HLA-F;HLA-DRB1
40 antigen processing and presentation of exogenous peptide antigen via MHC class I (GO:0042590) 7/78 1.442407e-02 FCER1G;PSMD3;HLA-B;TAP2;HLA-C;TAP1;HLA-F
41 positive regulation of interferon-gamma production (GO:0032729) 6/57 1.623629e-02 IL1R1;IL23R;HLA-DPB1;IL27;HLA-DPA1;IL12RB2
42 interleukin-23-mediated signaling pathway (GO:0038155) 3/9 1.630252e-02 IL23R;STAT3;JAK2
43 positive regulation of memory T cell differentiation (GO:0043382) 3/9 1.630252e-02 IL23R;HLA-DRA;HLA-DRB1
44 cellular response to cytokine stimulus (GO:0071345) 19/482 1.717622e-02 STAT5A;CSF3;SMAD3;IL1R1;CCL20;IL23R;GBA;STAT3;AIF1;TNF;RHOA;MUC1;IRF8;IRF5;JAK2;STX1A;SLC26A6;HLA-DPA1;IL12RB2
45 microglial cell activation (GO:0001774) 4/22 1.858644e-02 JAK2;AGER;AIF1;TNF
46 response to endoplasmic reticulum stress (GO:0034976) 8/110 1.972097e-02 BAG6;ATF6B;SEC16A;ATP2A1;QRICH1;RNF186;RNF5;USP19
47 regulation of memory T cell differentiation (GO:0043380) 3/10 2.061339e-02 IL23R;HLA-DRA;HLA-DRB1
48 immunoglobulin mediated immune response (GO:0016064) 3/10 2.061339e-02 FCER1G;CARD9;FCGR2B
49 immune response-activating cell surface receptor signaling pathway (GO:0002429) 4/24 2.417042e-02 BAG6;NCR3;FCER1G;MICB
50 tumor necrosis factor-mediated signaling pathway (GO:0033209) 8/116 2.518226e-02 TNFRSF6B;TNFSF15;PSMD3;LTA;TNFRSF14;TNFSF8;JAK2;TNF
51 B cell mediated immunity (GO:0019724) 3/11 2.518226e-02 FCER1G;CARD9;FCGR2B
52 interleukin-35-mediated signaling pathway (GO:0070757) 3/11 2.518226e-02 STAT3;JAK2;IL12RB2
53 cellular response to type I interferon (GO:0071357) 6/65 2.518226e-02 HLA-B;HLA-C;IRF8;IRF5;HLA-F;IP6K2
54 type I interferon signaling pathway (GO:0060337) 6/65 2.518226e-02 HLA-B;HLA-C;IRF8;IRF5;HLA-F;IP6K2
55 positive regulation of T cell migration (GO:2000406) 4/25 2.531050e-02 CCL20;TNFRSF14;AIF1;RHOA
56 response to cytokine (GO:0034097) 9/150 2.946632e-02 CD274;CSF3;SMAD3;IL1R1;IL23R;STAT3;REL;JAK2;RHOA
57 regulation of dendritic cell differentiation (GO:2001198) 3/12 3.106707e-02 HLA-B;FCGR2B;AGER
58 intrinsic apoptotic signaling pathway in response to endoplasmic reticulum stress (GO:0070059) 4/29 4.264044e-02 BAG6;ATP2A1;QRICH1;RNF186
59 antigen processing and presentation of exogenous peptide antigen via MHC class I, TAP-dependent (GO:0002479) 6/73 4.264044e-02 PSMD3;HLA-B;TAP2;HLA-C;TAP1;HLA-F
60 cellular response to tumor necrosis factor (GO:0071356) 10/194 4.456499e-02 TNFRSF6B;TNFSF15;CCL20;PSMD3;GBA;LTA;TNFSF8;TNFRSF14;JAK2;TNF
61 regulation of response to endoplasmic reticulum stress (GO:1905897) 3/14 4.456499e-02 NUPR1;FCGR2B;USP19
62 growth hormone receptor signaling pathway via JAK-STAT (GO:0060397) 3/14 4.456499e-02 STAT5A;STAT3;JAK2
63 immune response-regulating cell surface receptor signaling pathway (GO:0002768) 3/14 4.456499e-02 BAG6;NCR3;MICB
64 positive regulation of lymphocyte proliferation (GO:0050671) 6/75 4.456499e-02 CD274;HLA-DMB;IL23R;HLA-DPB1;AIF1;HLA-DPA1
65 positive regulation of T cell activation (GO:0050870) 6/75 4.456499e-02 CD274;HLA-DMB;IL23R;HLA-DPB1;AIF1;HLA-DPA1
66 steroid hormone biosynthetic process (GO:0120178) 4/31 4.788097e-02 STARD3;CYP21A2;FDX2;HSD17B8
67 positive regulation of leukocyte cell-cell adhesion (GO:1903039) 4/31 4.788097e-02 HLA-DPB1;TNF;RHOA;HLA-DPA1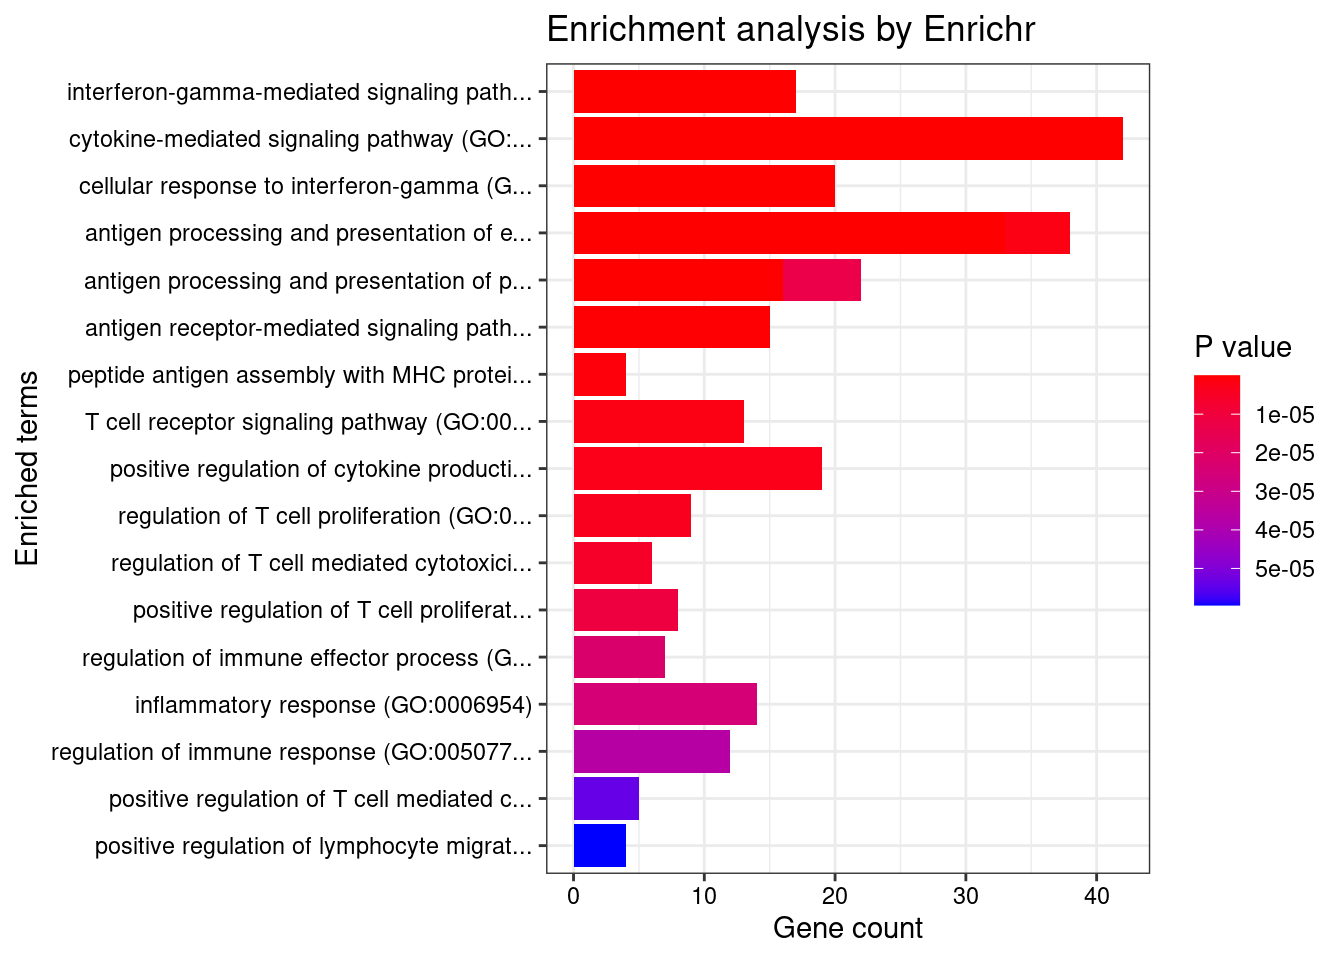
GO_Cellular_Component_2021
Term Overlap Adjusted.P.value Genes
1 MHC protein complex (GO:0042611) 15/20 2.690246e-21 HLA-DRB5;HLA-B;HLA-C;HLA-F;HLA-DMA;HLA-DMB;HLA-DPB1;HLA-DRA;HLA-DOA;HLA-DOB;HLA-DQA1;HLA-DQB2;HLA-DRB1;HLA-DPA1;HLA-DQB1
2 MHC class II protein complex (GO:0042613) 12/13 3.175000e-19 HLA-DRB5;HLA-DMA;HLA-DMB;HLA-DPB1;HLA-DRA;HLA-DOA;HLA-DOB;HLA-DQA1;HLA-DQB2;HLA-DRB1;HLA-DPA1;HLA-DQB1
3 lumenal side of endoplasmic reticulum membrane (GO:0098553) 12/28 2.990040e-13 HLA-DRB5;HLA-B;HLA-DPB1;HLA-C;HLA-DRA;HLA-F;HLA-DQA2;HLA-DQA1;HLA-DQB2;HLA-DRB1;HLA-DPA1;HLA-DQB1
4 integral component of lumenal side of endoplasmic reticulum membrane (GO:0071556) 12/28 2.990040e-13 HLA-DRB5;HLA-B;HLA-DPB1;HLA-C;HLA-DRA;HLA-F;HLA-DQA2;HLA-DQA1;HLA-DQB2;HLA-DRB1;HLA-DPA1;HLA-DQB1
5 ER to Golgi transport vesicle membrane (GO:0012507) 13/54 9.450953e-11 HLA-DRB5;SEC16A;HLA-B;HLA-C;HLA-F;HLA-DPB1;HLA-DRA;HLA-DQA2;HLA-DQB2;HLA-DQA1;HLA-DRB1;HLA-DPA1;HLA-DQB1
6 coated vesicle membrane (GO:0030662) 13/55 1.016478e-10 HLA-DRB5;SEC16A;HLA-B;HLA-C;HLA-F;HLA-DPB1;HLA-DRA;HLA-DQA2;HLA-DQB2;HLA-DQA1;HLA-DRB1;HLA-DPA1;HLA-DQB1
7 transport vesicle membrane (GO:0030658) 13/60 2.884758e-10 HLA-DRB5;SEC16A;HLA-B;HLA-C;HLA-F;HLA-DPB1;HLA-DRA;HLA-DQA2;HLA-DQB2;HLA-DQA1;HLA-DRB1;HLA-DPA1;HLA-DQB1
8 COPII-coated ER to Golgi transport vesicle (GO:0030134) 13/79 9.784438e-09 HLA-DRB5;SEC16A;HLA-B;HLA-C;HLA-F;HLA-DPB1;HLA-DRA;HLA-DQA2;HLA-DQB2;HLA-DQA1;HLA-DRB1;HLA-DPA1;HLA-DQB1
9 integral component of endoplasmic reticulum membrane (GO:0030176) 16/142 2.768217e-08 HLA-DRB5;ATF6B;HLA-B;TAP2;HLA-C;TAP1;HLA-F;CLN3;HLA-DPB1;HLA-DRA;HLA-DQA2;HLA-DQA1;HLA-DRB1;HLA-DQB2;HLA-DPA1;HLA-DQB1
10 endocytic vesicle membrane (GO:0030666) 16/158 1.193736e-07 HLA-DRB5;CAMK2A;HLA-B;TAP2;HLA-C;TAP1;HLA-F;HLA-DPB1;HLA-DRA;HLA-DQA2;HLA-DQA1;HLA-DRB1;HLA-DQB2;ATP6V0A1;HLA-DPA1;HLA-DQB1
11 lytic vacuole membrane (GO:0098852) 19/267 1.374784e-06 STARD3;HLA-DRB5;GBA;HLA-F;CLN3;HLA-DMA;HLA-DMB;HLA-DPB1;HLA-DRA;HLA-DOA;HLA-DQA2;HLA-DOB;HLA-DQA1;HLA-DRB1;HLA-DQB2;AP1M2;ATP6V0A1;HLA-DPA1;HLA-DQB1
12 lysosomal membrane (GO:0005765) 21/330 1.755623e-06 STARD3;HLA-DRB5;GBA;HLA-F;CLN3;SYNGR1;HLA-DMA;HLA-DMB;HLA-DPB1;TOM1;HLA-DRA;HLA-DOA;HLA-DQA2;HLA-DOB;HLA-DQA1;HLA-DRB1;HLA-DQB2;AP1M2;ATP6V0A1;HLA-DPA1;HLA-DQB1
13 trans-Golgi network membrane (GO:0032588) 11/99 8.636903e-06 ARFRP1;HLA-DRB5;HLA-DPB1;HLA-DRA;HLA-DQA2;AP1M2;HLA-DQA1;HLA-DRB1;HLA-DQB2;HLA-DPA1;HLA-DQB1
14 clathrin-coated endocytic vesicle membrane (GO:0030669) 9/69 2.205217e-05 HLA-DRB5;HLA-DPB1;HLA-DRA;HLA-DQA2;HLA-DQB2;HLA-DQA1;HLA-DRB1;HLA-DPA1;HLA-DQB1
15 clathrin-coated endocytic vesicle (GO:0045334) 9/85 1.191929e-04 HLA-DRB5;HLA-DPB1;HLA-DRA;HLA-DQA2;HLA-DQB2;HLA-DQA1;HLA-DRB1;HLA-DPA1;HLA-DQB1
16 lysosome (GO:0005764) 22/477 1.377303e-04 STARD3;HLA-DRB5;USP4;GBA;HLA-F;CLN3;HLA-DMA;HLA-DMB;CXCR2;HLA-DPB1;HLA-DRA;PPT2;HLA-DOA;HLA-DQA2;HLA-DOB;HLA-DQA1;HLA-DRB1;HLA-DQB2;AP1M2;ATP6V0A1;HLA-DPA1;HLA-DQB1
17 clathrin-coated vesicle membrane (GO:0030665) 9/90 1.605659e-04 HLA-DRB5;HLA-DPB1;HLA-DRA;HLA-DQA2;HLA-DQB2;HLA-DQA1;HLA-DRB1;HLA-DPA1;HLA-DQB1
18 cytoplasmic vesicle membrane (GO:0030659) 19/380 1.605659e-04 HLA-DRB5;CAMK2A;HLA-B;HLA-C;RHOA;FCGR2A;ORMDL3;CXCR2;HLA-DPB1;EXOC3;HLA-DRA;HLA-DQA2;HLA-DQA1;HLA-DRB1;HLA-DQB2;AP1M2;ATP6V0A1;HLA-DPA1;HLA-DQB1
19 trans-Golgi network (GO:0005802) 14/239 3.719457e-04 HLA-DRB5;GBA;ARFRP1;CLN3;HLA-DPB1;RAB29;HLA-DRA;HLA-DQA2;HLA-DQA1;HLA-DRB1;HLA-DQB2;AP1M2;HLA-DPA1;HLA-DQB1
20 phagocytic vesicle membrane (GO:0030670) 6/45 7.677014e-04 HLA-B;TAP2;HLA-C;TAP1;HLA-F;ATP6V0A1
21 bounding membrane of organelle (GO:0098588) 26/767 2.978077e-03 GPSM1;NOTCH4;CAMK2A;ATP2A1;CLN3;ORMDL3;CXCR2;HLA-DQA2;HLA-DQA1;AP1M2;ATP6V0A1;HLA-DPA1;HLA-DRB5;HLA-B;TAP2;HLA-C;TAP1;HLA-F;RHOA;FCGR2A;HLA-DPB1;EXOC3;HLA-DRA;HLA-DRB1;HLA-DQB2;HLA-DQB1
22 secretory granule membrane (GO:0030667) 13/274 4.753774e-03 FCER1G;HLA-B;HLA-C;ITGAL;RHOA;SYNGR1;FCGR2A;CXCR2;ORMDL3;TOM1;EXOC3;LY6G6F;ATP6V0A1
23 integral component of plasma membrane (GO:0005887) 40/1454 5.761421e-03 GPR25;CNTNAP1;IL23R;NOTCH4;PTGER3;OPRL1;ICAM5;MST1R;SEMA3F;SLC7A10;TNF;AGER;FCRLA;FCGR3A;MUC1;CXCR2;SLC38A3;HLA-DQA2;HLA-DQA1;HLA-DPA1;IL12RB2;GABBR1;PTGIR;FCER1G;IL1R1;TNFSF15;GPR35;HLA-B;HLA-C;CLDN4;SLC6A7;NCR3;FCGR2A;HLA-DRA;CDHR4;TNFSF8;FCGR2B;SLC26A3;HLA-DRB1;SLC26A6
24 late endosome membrane (GO:0031902) 6/68 6.296119e-03 STARD3;HLA-DMA;HLA-DRB5;HLA-DMB;HLA-DRA;HLA-DRB1
25 endocytic vesicle (GO:0030139) 10/189 7.900267e-03 HLA-DRB5;CAMK2A;HLA-DPB1;HLA-DRA;HLA-DQA2;HLA-DQA1;HLA-DRB1;HLA-DQB2;HLA-DPA1;HLA-DQB1
26 Golgi membrane (GO:0000139) 17/472 1.358267e-02 GPSM1;HLA-DRB5;NOTCH4;HLA-B;HLA-C;HLA-F;ARFRP1;CLN3;HLA-DPB1;HLA-DRA;HLA-DQA2;HLA-DQA1;HLA-DRB1;HLA-DQB2;AP1M2;HLA-DPA1;HLA-DQB1
27 recycling endosome (GO:0055037) 8/145 1.754583e-02 CD274;CLN3;HLA-B;RAB29;HLA-C;HLA-F;TUBG1;TNF
28 MHC class I protein complex (GO:0042612) 2/6 2.497110e-02 HLA-B;HLA-C
29 phagocytic vesicle (GO:0045335) 6/100 3.692536e-02 HLA-B;TAP2;HLA-C;TAP1;HLA-F;ATP6V0A1
30 endosome membrane (GO:0010008) 12/325 4.345395e-02 STARD3;CD274;CLN3;HLA-DRB5;HLA-DMA;HLA-DMB;HLA-B;HLA-C;HLA-DRA;HLA-F;HLA-DRB1;ATP6V0A1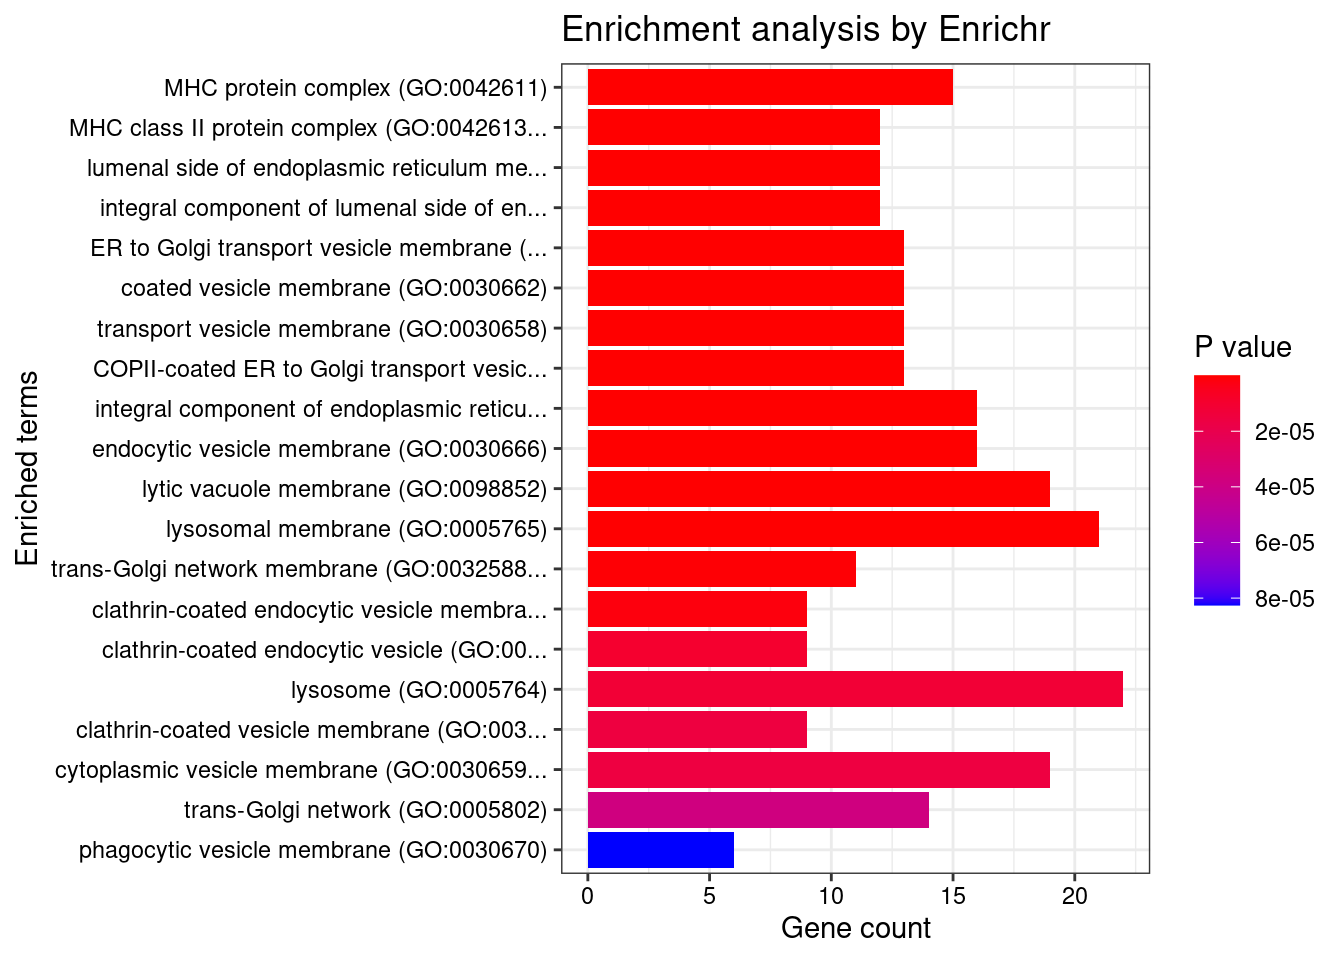
GO_Molecular_Function_2021
Term Overlap Adjusted.P.value Genes
1 MHC class II receptor activity (GO:0032395) 9/10 2.102037e-13 HLA-DRA;HLA-DOA;HLA-DOB;HLA-DQA2;HLA-DQA1;HLA-DQB2;HLA-DRB1;HLA-DPA1;HLA-DQB1
2 MHC class II protein complex binding (GO:0023026) 6/17 2.848152e-05 HLA-DMA;HLA-DMB;HLA-DRA;HLA-DOA;HLA-DOB;HLA-DRB1
3 TAP1 binding (GO:0046978) 3/5 4.248945e-03 TAP2;TAP1;HLA-F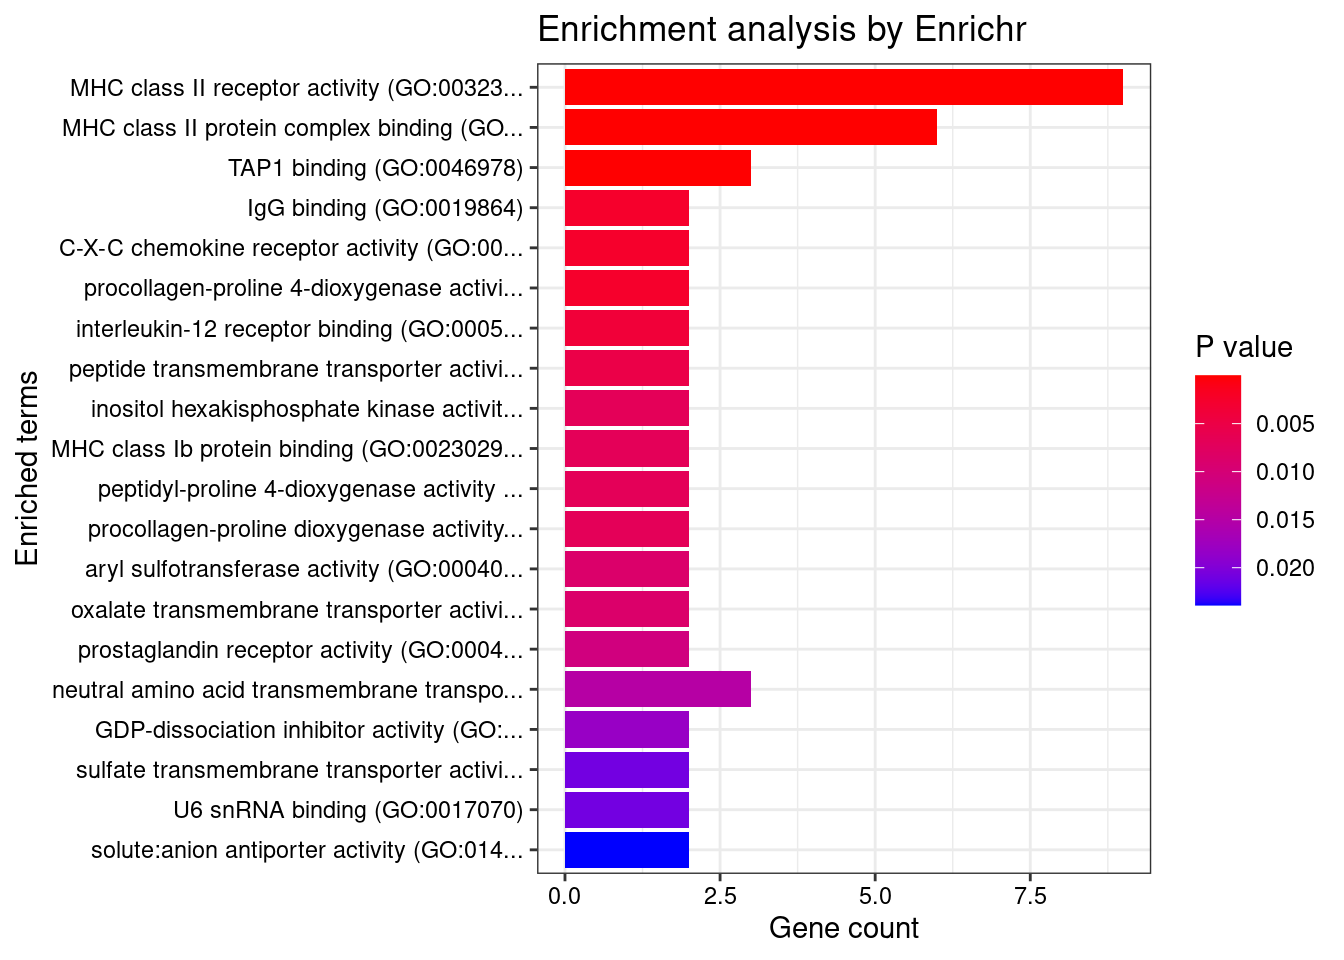
Enrichment analysis for cTWAS genes in top tissues separately
GO
output <- output[order(-output$pve_g),]
top_tissues <- output$weight[1:5]
for (tissue in top_tissues){
cat(paste0(tissue, "\n\n"))
ctwas_genes_tissue <- df[[tissue]]$ctwas
cat(paste0("Number of cTWAS Genes in Tissue: ", length(ctwas_genes_tissue), "\n\n"))
dbs <- c("GO_Biological_Process_2021")
GO_enrichment <- enrichr(ctwas_genes_tissue, dbs)
for (db in dbs){
cat(paste0("\n", db, "\n\n"))
enrich_results <- GO_enrichment[[db]]
enrich_results <- enrich_results[enrich_results$Adjusted.P.value<0.05,c("Term", "Overlap", "Adjusted.P.value", "Genes")]
print(enrich_results)
print(plotEnrich(GO_enrichment[[db]]))
}
}Prostate
Number of cTWAS Genes in Tissue: 9
Uploading data to Enrichr... Done.
Querying GO_Biological_Process_2021... Done.
Parsing results... Done.
GO_Biological_Process_2021
[1] Term Overlap Adjusted.P.value Genes
<0 rows> (or 0-length row.names)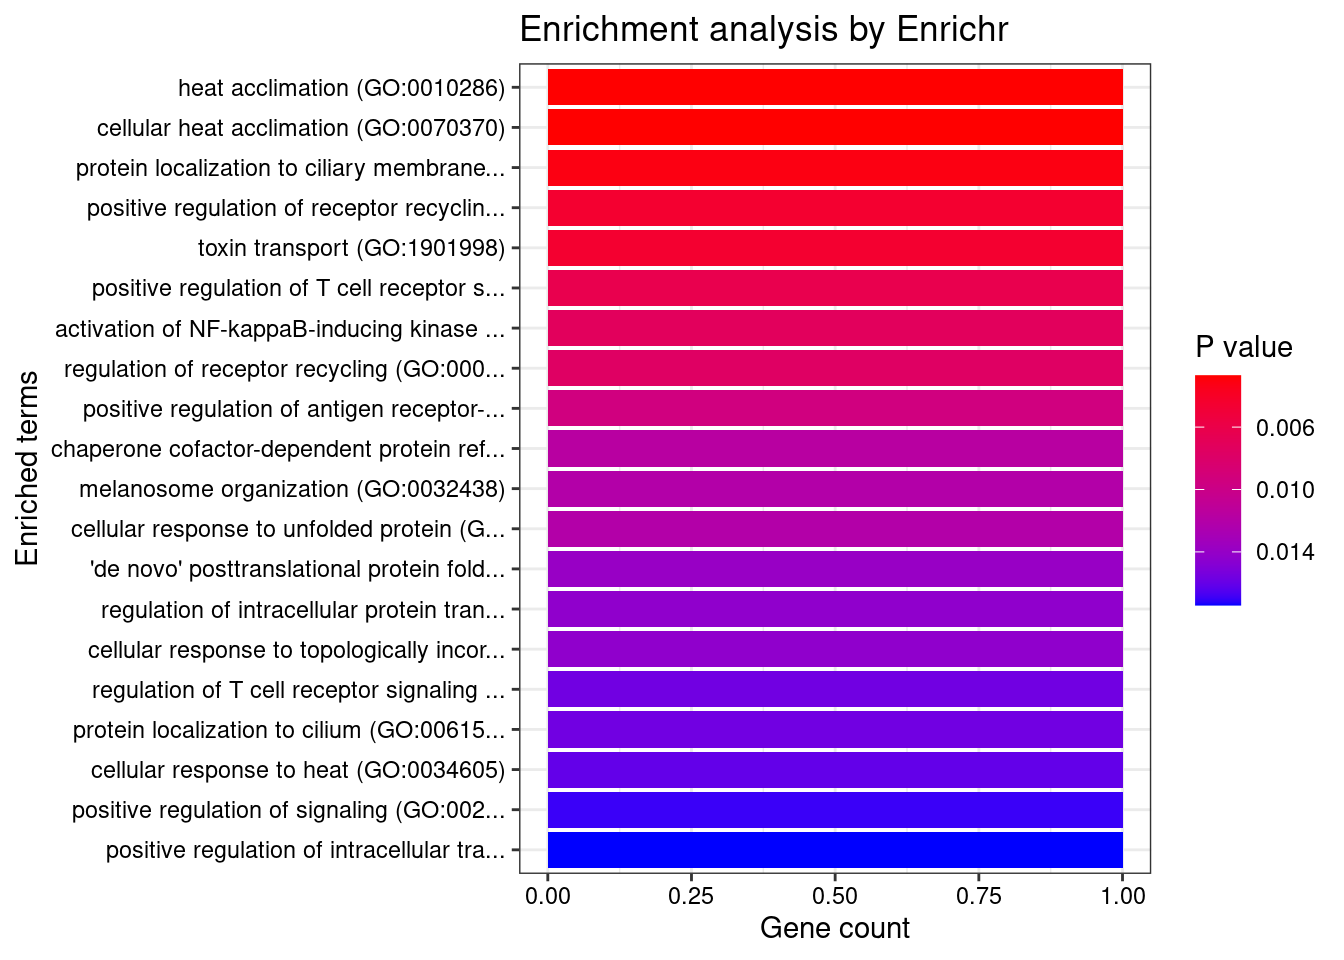
Colon_Transverse
Number of cTWAS Genes in Tissue: 10
Uploading data to Enrichr... Done.
Querying GO_Biological_Process_2021... Done.
Parsing results... Done.
GO_Biological_Process_2021
Term Overlap Adjusted.P.value Genes
1 positive regulation of antigen receptor-mediated signaling pathway (GO:0050857) 3/21 2.370864e-05 PRKCB;RAB29;PRKD2
2 positive regulation of vascular endothelial growth factor receptor signaling pathway (GO:0030949) 2/10 1.005277e-03 PRKCB;PRKD2
3 positive regulation of T cell receptor signaling pathway (GO:0050862) 2/14 1.353827e-03 RAB29;PRKD2
4 regulation of vascular endothelial growth factor receptor signaling pathway (GO:0030947) 2/24 3.071413e-03 PRKCB;PRKD2
5 regulation of T cell receptor signaling pathway (GO:0050856) 2/35 5.281590e-03 RAB29;PRKD2
6 cellular response to type I interferon (GO:0071357) 2/65 1.252745e-02 IRF8;IRF5
7 type I interferon signaling pathway (GO:0060337) 2/65 1.252745e-02 IRF8;IRF5
8 interferon-gamma-mediated signaling pathway (GO:0060333) 2/68 1.252745e-02 IRF8;IRF5
9 phosphorylation (GO:0016310) 3/400 1.713207e-02 CERKL;PRKCB;PRKD2
10 regulation of type I interferon production (GO:0032479) 2/89 1.713207e-02 IRF8;IRF5
11 positive regulation of vasculature development (GO:1904018) 2/102 2.041551e-02 PRKCB;PRKD2
12 positive regulation of angiogenesis (GO:0045766) 2/116 2.228548e-02 PRKCB;PRKD2
13 sphingolipid metabolic process (GO:0006665) 2/116 2.228548e-02 CERKL;PRKD2
14 cellular response to interferon-gamma (GO:0071346) 2/121 2.249412e-02 IRF8;IRF5
15 positive regulation of endothelial cell chemotaxis by VEGF-activated vascular endothelial growth factor receptor signaling pathway (GO:0038033) 1/5 2.338252e-02 PRKD2
16 positive regulation of fibroblast growth factor receptor signaling pathway (GO:0045743) 1/5 2.338252e-02 PRKD2
17 histone-threonine phosphorylation (GO:0035405) 1/5 2.338252e-02 PRKCB
18 positive regulation of NF-kappaB transcription factor activity (GO:0051092) 2/155 2.338252e-02 PRKCB;PRKD2
19 peptidyl-serine phosphorylation (GO:0018105) 2/156 2.338252e-02 PRKCB;PRKD2
20 positive regulation of deacetylase activity (GO:0090045) 1/6 2.338252e-02 PRKD2
21 response to peptidoglycan (GO:0032494) 1/6 2.338252e-02 IRF5
22 morphogenesis of an endothelium (GO:0003159) 1/6 2.338252e-02 PRKD2
23 protein K29-linked ubiquitination (GO:0035519) 1/6 2.338252e-02 RNF186
24 intracellular pH elevation (GO:0051454) 1/6 2.338252e-02 SLC26A3
25 cytokine-mediated signaling pathway (GO:0019221) 3/621 2.338252e-02 IRF8;IRF5;CXCL5
26 peptidyl-serine modification (GO:0018209) 2/169 2.338252e-02 PRKCB;PRKD2
27 positive regulation of B cell receptor signaling pathway (GO:0050861) 1/7 2.398447e-02 PRKCB
28 regulation of histone deacetylase activity (GO:1901725) 1/7 2.398447e-02 PRKD2
29 protein localization to ciliary membrane (GO:1903441) 1/7 2.398447e-02 RAB29
30 antigen receptor-mediated signaling pathway (GO:0050851) 2/185 2.419261e-02 PRKCB;PRKD2
31 positive regulation of cell migration by vascular endothelial growth factor signaling pathway (GO:0038089) 1/8 2.563663e-02 PRKD2
32 regulation of angiogenesis (GO:0045765) 2/203 2.683713e-02 PRKCB;PRKD2
33 negative regulation of transmembrane transport (GO:0034763) 1/10 2.683713e-02 PRKCB
34 lipoprotein transport (GO:0042953) 1/10 2.683713e-02 PRKCB
35 positive regulation of receptor recycling (GO:0001921) 1/10 2.683713e-02 RAB29
36 toxin transport (GO:1901998) 1/10 2.683713e-02 RAB29
37 endothelial tube morphogenesis (GO:0061154) 1/10 2.683713e-02 PRKD2
38 lipoprotein localization (GO:0044872) 1/11 2.866659e-02 PRKCB
39 regulation of hemopoiesis (GO:1903706) 1/12 2.866659e-02 PRKCB
40 negative regulation of glucose transmembrane transport (GO:0010829) 1/12 2.866659e-02 PRKCB
41 mitotic nuclear membrane disassembly (GO:0007077) 1/12 2.866659e-02 PRKCB
42 positive regulation of DNA-binding transcription factor activity (GO:0051091) 2/246 2.866659e-02 PRKCB;PRKD2
43 positive regulation of histone deacetylation (GO:0031065) 1/13 2.866659e-02 PRKD2
44 response to muramyl dipeptide (GO:0032495) 1/13 2.866659e-02 IRF5
45 protein localization to mitochondrion (GO:0070585) 1/13 2.866659e-02 RNF186
46 positive regulation of signal transduction (GO:0009967) 2/252 2.879817e-02 PRKCB;PRKD2
47 nuclear membrane disassembly (GO:0051081) 1/14 2.955139e-02 PRKCB
48 positive regulation of endothelial cell chemotaxis (GO:2001028) 1/15 3.036305e-02 PRKD2
49 regulation of endothelial cell chemotaxis (GO:2001026) 1/15 3.036305e-02 PRKD2
50 regulation of receptor recycling (GO:0001919) 1/17 3.370808e-02 RAB29
51 positive regulation of transcription by RNA polymerase II (GO:0045944) 3/908 3.431047e-02 IRF8;IRF5;PRKD2
52 positive regulation of CREB transcription factor activity (GO:0032793) 1/18 3.431047e-02 PRKD2
53 regulation of glucose transmembrane transport (GO:0010827) 1/19 3.552529e-02 PRKCB
54 regulation of fibroblast growth factor receptor signaling pathway (GO:0040036) 1/20 3.602713e-02 PRKD2
55 positive regulation of interferon-alpha production (GO:0032727) 1/20 3.602713e-02 IRF5
56 cellular response to oxygen-containing compound (GO:1901701) 2/323 3.816691e-02 SLC26A3;CXCL5
57 membrane lipid metabolic process (GO:0006643) 1/22 3.822215e-02 CERKL
58 regulation of B cell receptor signaling pathway (GO:0050855) 1/23 3.884763e-02 PRKCB
59 positive regulation of cytokine production (GO:0001819) 2/335 3.884763e-02 IRF5;PRKD2
60 dendritic cell differentiation (GO:0097028) 1/24 3.959425e-02 IRF8
61 regulation of interferon-alpha production (GO:0032647) 1/25 4.055877e-02 IRF5
62 positive regulation of interleukin-2 production (GO:0032743) 1/26 4.083286e-02 PRKD2
63 mononuclear cell differentiation (GO:1903131) 1/26 4.083286e-02 IRF8
64 melanosome organization (GO:0032438) 1/27 4.108940e-02 RAB29
65 negative regulation of insulin receptor signaling pathway (GO:0046627) 1/27 4.108940e-02 PRKCB
66 protein transport (GO:0015031) 2/369 4.132997e-02 PRKCB;RAB29
67 negative regulation of cellular response to insulin stimulus (GO:1900077) 1/28 4.132997e-02 PRKCB
68 intrinsic apoptotic signaling pathway in response to endoplasmic reticulum stress (GO:0070059) 1/29 4.155595e-02 RNF186
69 regulation of DNA biosynthetic process (GO:2000278) 1/29 4.155595e-02 PRKD2
70 cellular response to cAMP (GO:0071320) 1/31 4.376761e-02 SLC26A3
71 regulation of intracellular protein transport (GO:0033157) 1/32 4.418368e-02 RAB29
72 epithelial tube morphogenesis (GO:0060562) 1/34 4.418368e-02 PRKD2
73 cellular response to vascular endothelial growth factor stimulus (GO:0035924) 1/34 4.418368e-02 PRKD2
74 regulation of transmembrane transport (GO:0034762) 1/34 4.418368e-02 PRKCB
75 B cell receptor signaling pathway (GO:0050853) 1/34 4.418368e-02 PRKCB
76 positive regulation of interleukin-12 production (GO:0032735) 1/34 4.418368e-02 IRF5
77 protein localization to cilium (GO:0061512) 1/35 4.488242e-02 RAB29
78 positive regulation of interferon-beta production (GO:0032728) 1/36 4.502621e-02 IRF5
79 regulation of transcription by RNA polymerase II (GO:0006357) 4/2206 4.502621e-02 PRKCB;IRF8;IRF5;PRKD2
80 positive regulation of transcription, DNA-templated (GO:0045893) 3/1183 4.502621e-02 IRF8;IRF5;PRKD2
81 regulation of intracellular pH (GO:0051453) 1/37 4.508381e-02 SLC26A3
82 positive regulation of signaling (GO:0023056) 1/38 4.517642e-02 RAB29
83 response to cAMP (GO:0051591) 1/38 4.517642e-02 SLC26A3
84 response to peptide (GO:1901652) 1/39 4.526416e-02 IRF5
85 positive regulation of intracellular transport (GO:0032388) 1/39 4.526416e-02 RAB29
86 response to organonitrogen compound (GO:0010243) 1/40 4.587465e-02 IRF5
87 anion transport (GO:0006820) 1/43 4.871558e-02 SLC26A3
88 protein K63-linked ubiquitination (GO:0070534) 1/44 4.925991e-02 RNF186
89 regulation of insulin receptor signaling pathway (GO:0046626) 1/45 4.925991e-02 PRKCB
90 positive regulation of chemotaxis (GO:0050921) 1/45 4.925991e-02 PRKD2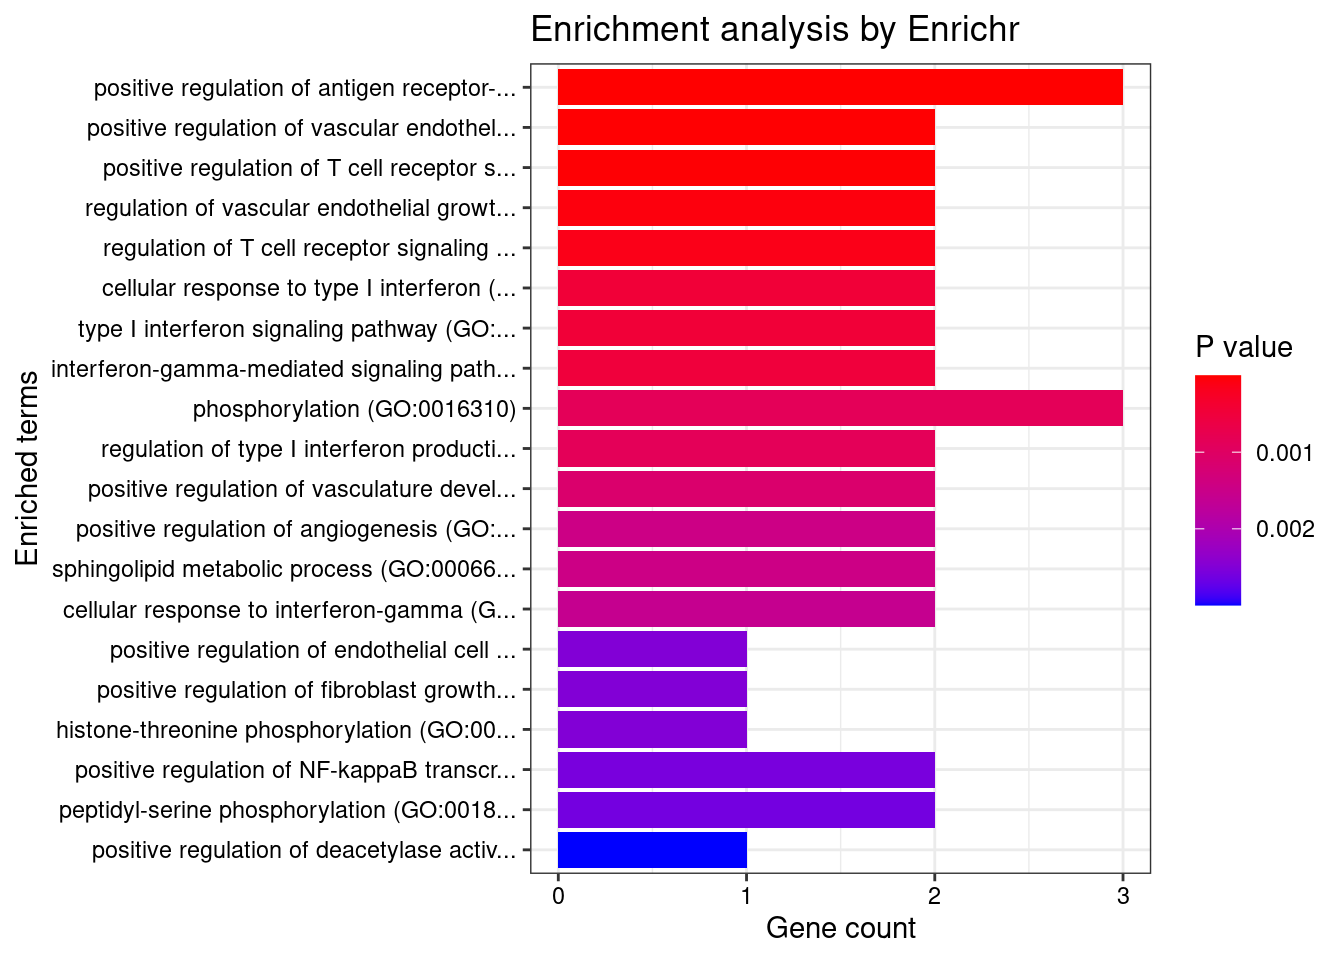
Esophagus_Muscularis
Number of cTWAS Genes in Tissue: 7
Uploading data to Enrichr... Done.
Querying GO_Biological_Process_2021... Done.
Parsing results... Done.
GO_Biological_Process_2021
Term Overlap Adjusted.P.value Genes
1 neutrophil mediated immunity (GO:0002446) 3/488 0.02409541 HSPA6;CARD9;ITGAL
2 positive regulation of NF-kappaB transcription factor activity (GO:0051092) 2/155 0.02409541 CARD9;PRKD2
3 positive regulation of ERK1 and ERK2 cascade (GO:0070374) 2/172 0.02409541 CARD9;PRKD2
4 positive regulation of fibroblast growth factor receptor signaling pathway (GO:0045743) 1/5 0.02409541 PRKD2
5 T cell extravasation (GO:0072683) 1/5 0.02409541 ITGAL
6 positive regulation of endothelial cell chemotaxis by VEGF-activated vascular endothelial growth factor receptor signaling pathway (GO:0038033) 1/5 0.02409541 PRKD2
7 heat acclimation (GO:0010286) 1/6 0.02409541 HSPA6
8 morphogenesis of an endothelium (GO:0003159) 1/6 0.02409541 PRKD2
9 positive regulation of deacetylase activity (GO:0090045) 1/6 0.02409541 PRKD2
10 cellular heat acclimation (GO:0070370) 1/6 0.02409541 HSPA6
11 regulation of histone deacetylase activity (GO:1901725) 1/7 0.02409541 PRKD2
12 positive regulation of cell migration by vascular endothelial growth factor signaling pathway (GO:0038089) 1/8 0.02409541 PRKD2
13 myeloid leukocyte mediated immunity (GO:0002444) 1/8 0.02409541 CARD9
14 regulation of ERK1 and ERK2 cascade (GO:0070372) 2/238 0.02409541 CARD9;PRKD2
15 positive regulation of DNA-binding transcription factor activity (GO:0051091) 2/246 0.02409541 CARD9;PRKD2
16 positive regulation of vascular endothelial growth factor receptor signaling pathway (GO:0030949) 1/10 0.02409541 PRKD2
17 regulation of T-helper 17 type immune response (GO:2000316) 1/10 0.02409541 CARD9
18 immunoglobulin mediated immune response (GO:0016064) 1/10 0.02409541 CARD9
19 endothelial tube morphogenesis (GO:0061154) 1/10 0.02409541 PRKD2
20 positive regulation of MAPK cascade (GO:0043410) 2/274 0.02409541 CARD9;PRKD2
21 B cell mediated immunity (GO:0019724) 1/11 0.02409541 CARD9
22 positive regulation of T-helper 17 type immune response (GO:2000318) 1/12 0.02409541 CARD9
23 positive regulation of adaptive immune response based on somatic recombination of immune receptors built from immunoglobulin superfamily domains (GO:0002824) 1/13 0.02409541 CARD9
24 positive regulation of histone deacetylation (GO:0031065) 1/13 0.02409541 PRKD2
25 homeostasis of number of cells (GO:0048872) 1/13 0.02409541 CARD9
26 antifungal innate immune response (GO:0061760) 1/13 0.02409541 CARD9
27 positive regulation of T cell receptor signaling pathway (GO:0050862) 1/14 0.02409541 PRKD2
28 positive regulation of granulocyte macrophage colony-stimulating factor production (GO:0032725) 1/14 0.02409541 CARD9
29 regulation of endothelial cell chemotaxis (GO:2001026) 1/15 0.02409541 PRKD2
30 positive regulation of endothelial cell chemotaxis (GO:2001028) 1/15 0.02409541 PRKD2
31 positive regulation of cytokine production (GO:0001819) 2/335 0.02409541 CARD9;PRKD2
32 regulation of granulocyte macrophage colony-stimulating factor production (GO:0032645) 1/16 0.02409541 CARD9
33 positive regulation of cytokine production involved in inflammatory response (GO:1900017) 1/17 0.02477643 CARD9
34 positive regulation of CREB transcription factor activity (GO:0032793) 1/18 0.02477643 PRKD2
35 positive regulation of stress-activated protein kinase signaling cascade (GO:0070304) 1/18 0.02477643 CARD9
36 regulation of fibroblast growth factor receptor signaling pathway (GO:0040036) 1/20 0.02675665 PRKD2
37 positive regulation of antigen receptor-mediated signaling pathway (GO:0050857) 1/21 0.02733108 PRKD2
38 positive regulation of interleukin-17 production (GO:0032740) 1/23 0.02887988 CARD9
39 defense response to fungus (GO:0050832) 1/24 0.02887988 CARD9
40 regulation of vascular endothelial growth factor receptor signaling pathway (GO:0030947) 1/24 0.02887988 PRKD2
41 positive regulation of interleukin-2 production (GO:0032743) 1/26 0.02928088 PRKD2
42 chaperone cofactor-dependent protein refolding (GO:0051085) 1/26 0.02928088 HSPA6
43 cellular response to unfolded protein (GO:0034620) 1/27 0.02928088 HSPA6
44 leukocyte cell-cell adhesion (GO:0007159) 1/28 0.02928088 ITGAL
45 receptor clustering (GO:0043113) 1/28 0.02928088 ITGAL
46 T cell activation involved in immune response (GO:0002286) 1/28 0.02928088 ITGAL
47 regulation of DNA biosynthetic process (GO:2000278) 1/29 0.02967693 PRKD2
48 'de novo' posttranslational protein folding (GO:0051084) 1/31 0.02971049 HSPA6
49 cellular response to topologically incorrect protein (GO:0035967) 1/32 0.02971049 HSPA6
50 modulation by host of symbiont process (GO:0051851) 1/32 0.02971049 CARD9
51 neutrophil degranulation (GO:0043312) 2/481 0.02971049 HSPA6;ITGAL
52 neutrophil activation involved in immune response (GO:0002283) 2/485 0.02971049 HSPA6;ITGAL
53 regulation of interleukin-17 production (GO:0032660) 1/33 0.02971049 CARD9
54 epithelial tube morphogenesis (GO:0060562) 1/34 0.02971049 PRKD2
55 cellular response to vascular endothelial growth factor stimulus (GO:0035924) 1/34 0.02971049 PRKD2
56 regulation of T cell receptor signaling pathway (GO:0050856) 1/35 0.03003367 PRKD2
57 cellular response to heat (GO:0034605) 1/36 0.03034527 HSPA6
58 positive regulation of intracellular signal transduction (GO:1902533) 2/546 0.03393584 CARD9;PRKD2
59 heterophilic cell-cell adhesion via plasma membrane cell adhesion molecules (GO:0007157) 1/42 0.03417199 ITGAL
60 regulation of cytokine production involved in inflammatory response (GO:1900015) 1/43 0.03439736 CARD9
61 positive regulation of chemotaxis (GO:0050921) 1/45 0.03539651 PRKD2
62 positive regulation of blood vessel endothelial cell migration (GO:0043536) 1/48 0.03560161 PRKD2
63 regulation of interleukin-2 production (GO:0032663) 1/48 0.03560161 PRKD2
64 regulation of stress-activated MAPK cascade (GO:0032872) 1/49 0.03560161 CARD9
65 response to unfolded protein (GO:0006986) 1/49 0.03560161 HSPA6
66 cellular defense response (GO:0006968) 1/49 0.03560161 LSP1
67 regulation of blood vessel endothelial cell migration (GO:0043535) 1/55 0.03932919 PRKD2
68 membrane lipid biosynthetic process (GO:0046467) 1/58 0.04084614 PRKD2
69 peptidyl-threonine phosphorylation (GO:0018107) 1/60 0.04112522 PRKD2
70 positive regulation of interleukin-8 production (GO:0032757) 1/61 0.04112522 PRKD2
71 positive regulation of DNA biosynthetic process (GO:2000573) 1/61 0.04112522 PRKD2
72 positive regulation of cysteine-type endopeptidase activity (GO:2001056) 1/62 0.04121268 CARD9
73 positive regulation of DNA metabolic process (GO:0051054) 1/63 0.04129755 PRKD2
74 vascular endothelial growth factor receptor signaling pathway (GO:0048010) 1/67 0.04272282 PRKD2
75 peptidyl-threonine modification (GO:0018210) 1/67 0.04272282 PRKD2
76 positive regulation of JNK cascade (GO:0046330) 1/73 0.04589499 CARD9
77 sphingolipid biosynthetic process (GO:0030148) 1/74 0.04591261 PRKD2
78 positive regulation of interleukin-6 production (GO:0032755) 1/76 0.04653501 CARD9
79 positive regulation of endothelial cell proliferation (GO:0001938) 1/77 0.04654354 PRKD2
80 positive regulation of cell adhesion (GO:0045785) 1/80 0.04772387 PRKD2
81 regulation of interleukin-8 production (GO:0032677) 1/81 0.04772387 PRKD2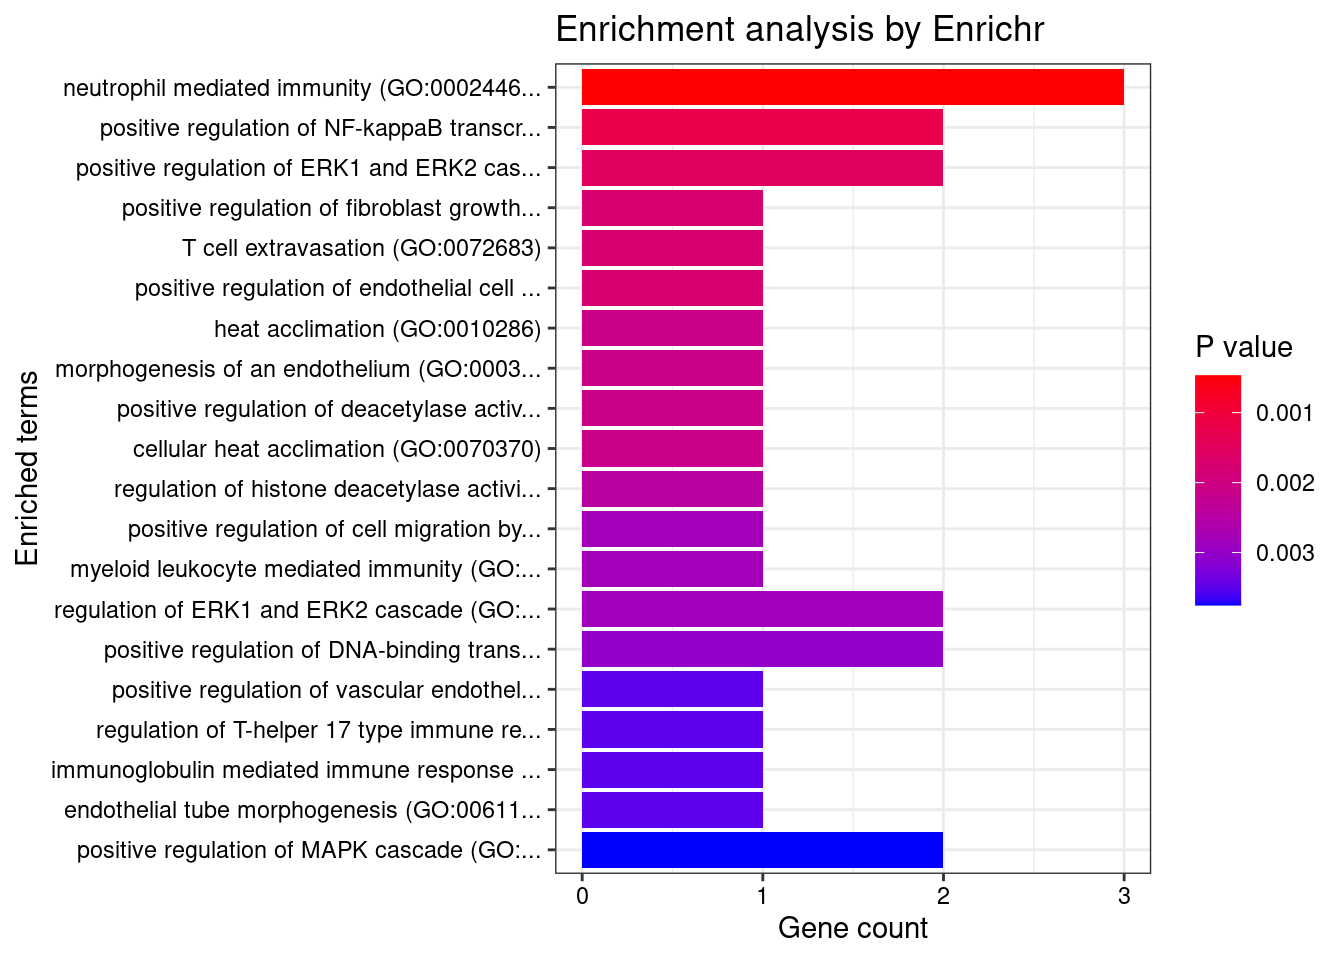
Skin_Not_Sun_Exposed_Suprapubic
Number of cTWAS Genes in Tissue: 4
Uploading data to Enrichr... Done.
Querying GO_Biological_Process_2021... Done.
Parsing results... Done.
GO_Biological_Process_2021
Term Overlap Adjusted.P.value Genes
1 response to peptidoglycan (GO:0032494) 1/6 0.02219120 IRF5
2 intracellular pH elevation (GO:0051454) 1/6 0.02219120 SLC26A3
3 response to muramyl dipeptide (GO:0032495) 1/13 0.02439966 IRF5
4 positive regulation of interferon-alpha production (GO:0032727) 1/20 0.02439966 IRF5
5 regulation of interferon-alpha production (GO:0032647) 1/25 0.02439966 IRF5
6 cellular response to cAMP (GO:0071320) 1/31 0.02439966 SLC26A3
7 positive regulation of interleukin-12 production (GO:0032735) 1/34 0.02439966 IRF5
8 positive regulation of interferon-beta production (GO:0032728) 1/36 0.02439966 IRF5
9 regulation of intracellular pH (GO:0051453) 1/37 0.02439966 SLC26A3
10 response to cAMP (GO:0051591) 1/38 0.02439966 SLC26A3
11 response to peptide (GO:1901652) 1/39 0.02439966 IRF5
12 response to organonitrogen compound (GO:0010243) 1/40 0.02439966 IRF5
13 anion transport (GO:0006820) 1/43 0.02439966 SLC26A3
14 regulation of interferon-beta production (GO:0032648) 1/49 0.02506554 IRF5
15 regulation of interleukin-12 production (GO:0032655) 1/51 0.02506554 IRF5
16 cellular response to type I interferon (GO:0071357) 1/65 0.02781513 IRF5
17 type I interferon signaling pathway (GO:0060337) 1/65 0.02781513 IRF5
18 interferon-gamma-mediated signaling pathway (GO:0060333) 1/68 0.02781513 IRF5
19 response to molecule of bacterial origin (GO:0002237) 1/73 0.02827816 IRF5
20 positive regulation of type I interferon production (GO:0032481) 1/77 0.02832776 IRF5
21 regulation of type I interferon production (GO:0032479) 1/89 0.03115526 IRF5
22 cellular response to organonitrogen compound (GO:0071417) 1/103 0.03438104 SLC26A3
23 ion transport (GO:0006811) 1/116 0.03697362 SLC26A3
24 cellular response to interferon-gamma (GO:0071346) 1/121 0.03697362 IRF5
25 cellular response to organic cyclic compound (GO:0071407) 1/150 0.04390598 SLC26A3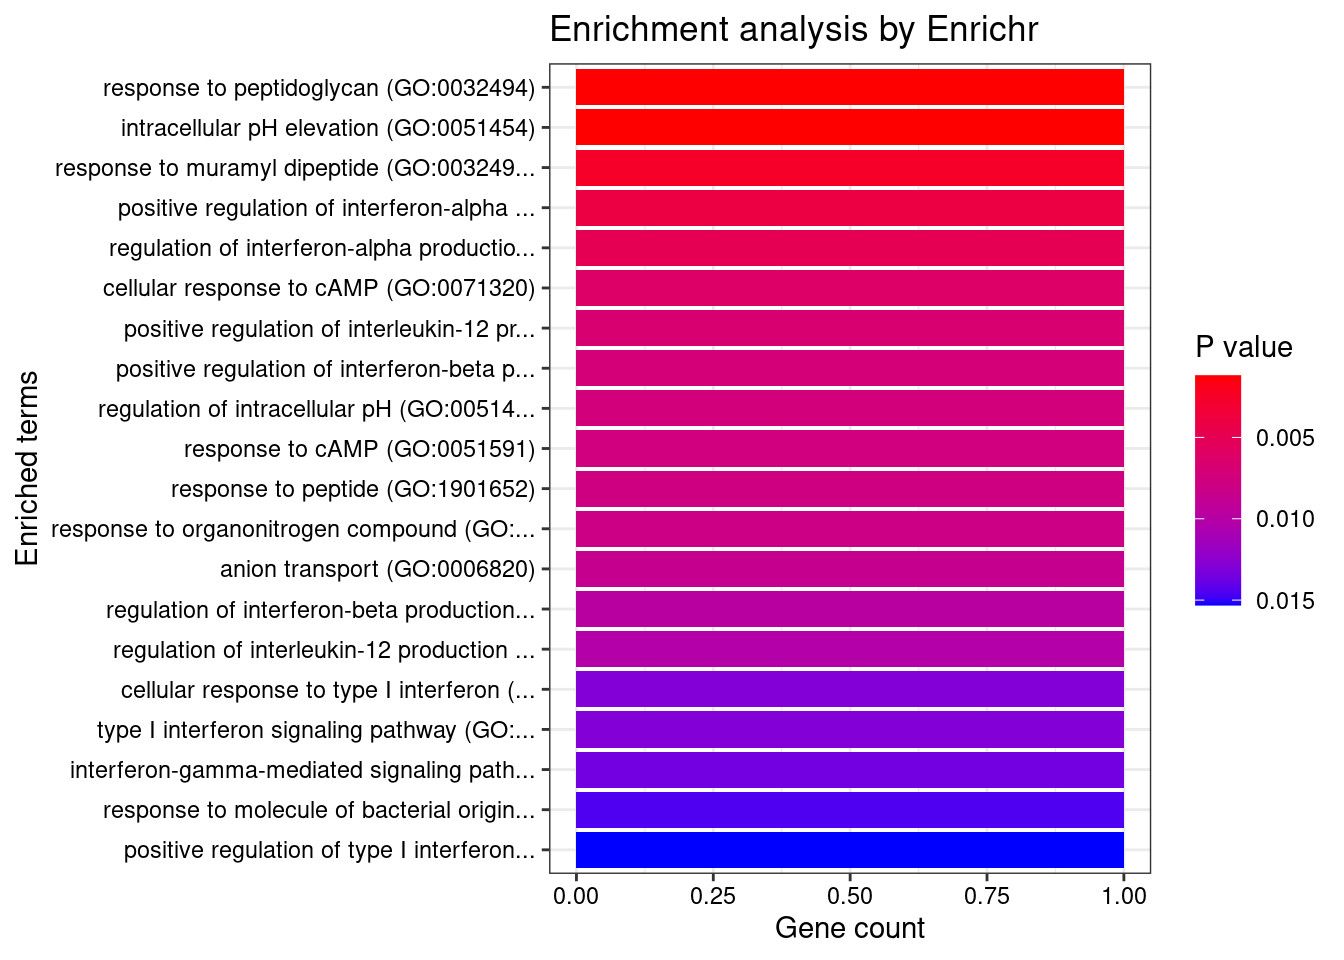
Brain_Nucleus_accumbens_basal_ganglia
Number of cTWAS Genes in Tissue: 7
Uploading data to Enrichr... Done.
Querying GO_Biological_Process_2021... Done.
Parsing results... Done.
GO_Biological_Process_2021
Term Overlap Adjusted.P.value Genes
1 positive regulation of antigen receptor-mediated signaling pathway (GO:0050857) 2/21 0.002813459 PRKCB;RAB29
2 chemokine-mediated signaling pathway (GO:0070098) 2/56 0.006472876 CCL20;CXCL5
3 cellular response to chemokine (GO:1990869) 2/60 0.006472876 CCL20;CXCL5
4 neutrophil chemotaxis (GO:0030593) 2/70 0.006472876 CCL20;CXCL5
5 granulocyte chemotaxis (GO:0071621) 2/73 0.006472876 CCL20;CXCL5
6 neutrophil migration (GO:1990266) 2/77 0.006472876 CCL20;CXCL5
7 histone-threonine phosphorylation (GO:0035405) 1/5 0.028247681 PRKCB
8 positive regulation of B cell receptor signaling pathway (GO:0050861) 1/7 0.028247681 PRKCB
9 protein localization to ciliary membrane (GO:1903441) 1/7 0.028247681 RAB29
10 inflammatory response (GO:0006954) 2/230 0.028247681 CCL20;CXCL5
11 positive regulation of vascular endothelial growth factor receptor signaling pathway (GO:0030949) 1/10 0.028247681 PRKCB
12 negative regulation of transmembrane transport (GO:0034763) 1/10 0.028247681 PRKCB
13 lipoprotein transport (GO:0042953) 1/10 0.028247681 PRKCB
14 positive regulation of receptor recycling (GO:0001921) 1/10 0.028247681 RAB29
15 toxin transport (GO:1901998) 1/10 0.028247681 RAB29
16 lipoprotein localization (GO:0044872) 1/11 0.028247681 PRKCB
17 regulation of hemopoiesis (GO:1903706) 1/12 0.028247681 PRKCB
18 mitotic nuclear membrane disassembly (GO:0007077) 1/12 0.028247681 PRKCB
19 negative regulation of glucose transmembrane transport (GO:0010829) 1/12 0.028247681 PRKCB
20 positive regulation of T cell receptor signaling pathway (GO:0050862) 1/14 0.028453164 RAB29
21 positive regulation of lymphocyte migration (GO:2000403) 1/14 0.028453164 CCL20
22 nuclear membrane disassembly (GO:0051081) 1/14 0.028453164 PRKCB
23 regulation of receptor recycling (GO:0001919) 1/17 0.033009344 RAB29
24 T cell migration (GO:0072678) 1/18 0.033009344 CCL20
25 regulation of glucose transmembrane transport (GO:0010827) 1/19 0.033009344 PRKCB
26 protein transport (GO:0015031) 2/369 0.033009344 PRKCB;RAB29
27 regulation of T cell migration (GO:2000404) 1/20 0.033090351 CCL20
28 calcium-mediated signaling using intracellular calcium source (GO:0035584) 1/21 0.033498964 CCL20
29 regulation of B cell receptor signaling pathway (GO:0050855) 1/23 0.035413583 PRKCB
30 regulation of vascular endothelial growth factor receptor signaling pathway (GO:0030947) 1/24 0.035716177 PRKCB
31 positive regulation of T cell migration (GO:2000406) 1/25 0.035998818 CCL20
32 negative regulation of insulin receptor signaling pathway (GO:0046627) 1/27 0.036511498 PRKCB
33 melanosome organization (GO:0032438) 1/27 0.036511498 RAB29
34 negative regulation of cellular response to insulin stimulus (GO:1900077) 1/28 0.036744630 PRKCB
35 regulation of intracellular protein transport (GO:0033157) 1/32 0.040000256 RAB29
36 regulation of transmembrane transport (GO:0034762) 1/34 0.040000256 PRKCB
37 B cell receptor signaling pathway (GO:0050853) 1/34 0.040000256 PRKCB
38 regulation of T cell receptor signaling pathway (GO:0050856) 1/35 0.040000256 RAB29
39 protein localization to cilium (GO:0061512) 1/35 0.040000256 RAB29
40 positive regulation of signaling (GO:0023056) 1/38 0.042324101 RAB29
41 positive regulation of intracellular transport (GO:0032388) 1/39 0.042372084 RAB29
42 lymphocyte migration (GO:0072676) 1/40 0.042417464 CCL20
43 monocyte chemotaxis (GO:0002548) 1/42 0.043489529 CCL20
44 lymphocyte chemotaxis (GO:0048247) 1/44 0.044504985 CCL20
45 regulation of insulin receptor signaling pathway (GO:0046626) 1/45 0.044504985 PRKCB
46 negative regulation of cell projection organization (GO:0031345) 1/49 0.046371016 RAB29
47 cellular defense response (GO:0006968) 1/49 0.046371016 LSP1
48 cytokine-mediated signaling pathway (GO:0019221) 2/621 0.048594811 CCL20;CXCL5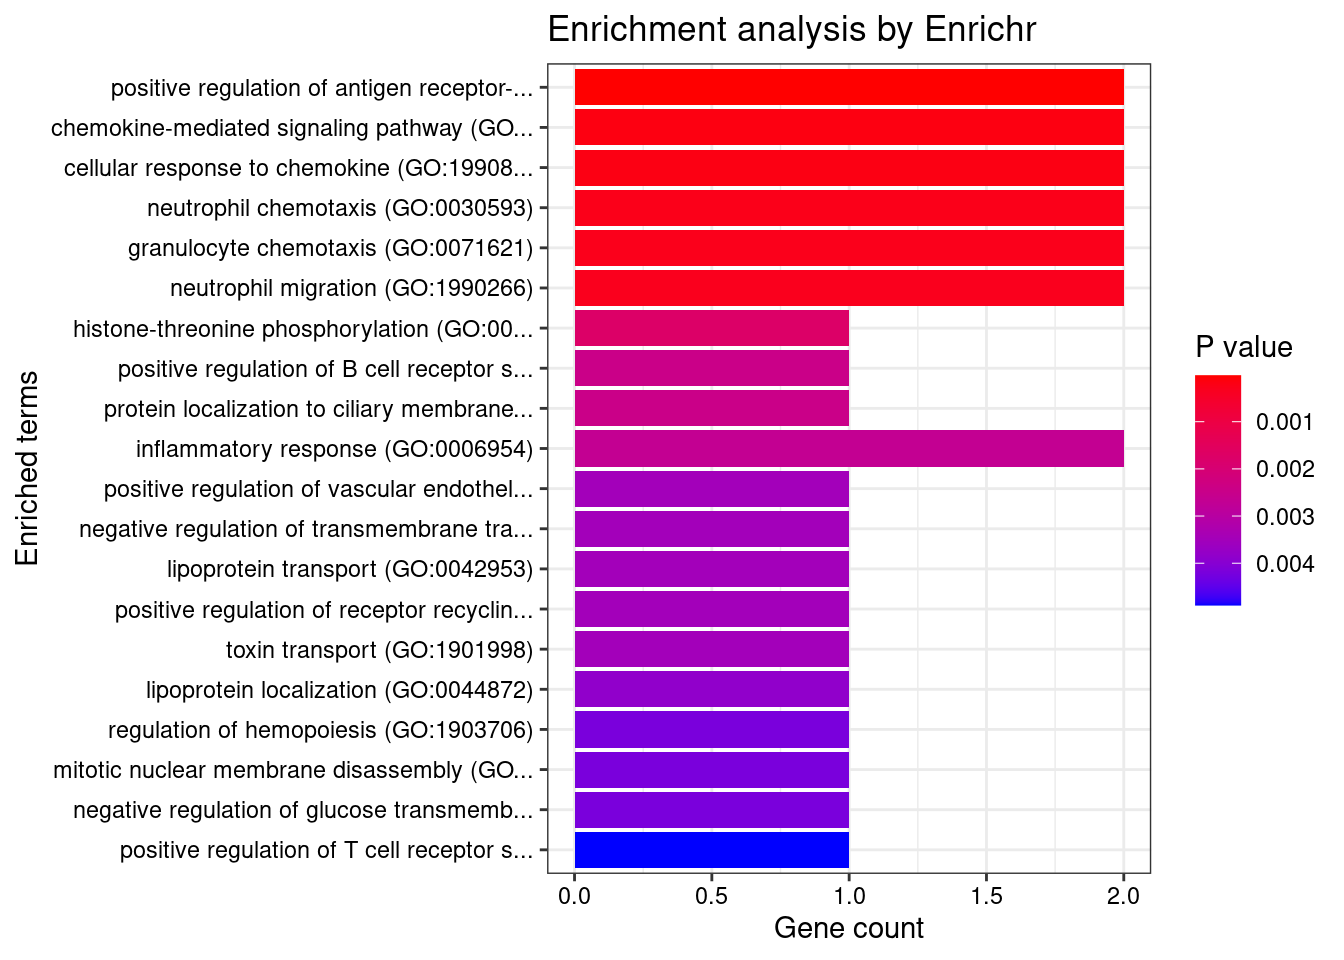
KEGG
output <- output[order(-output$pve_g),]
top_tissues <- output$weight[1:5]
for (tissue in top_tissues){
cat(paste0(tissue, "\n\n"))
ctwas_genes_tissue <- df[[tissue]]$ctwas
background_tissue <- df[[tissue]]$gene_pips$genename
cat(paste0("Number of cTWAS Genes in Tissue: ", length(ctwas_genes_tissue), "\n\n"))
databases <- c("pathway_KEGG")
enrichResult <- NULL
try(enrichResult <- WebGestaltR(enrichMethod="ORA", organism="hsapiens",
interestGene=ctwas_genes_tissue, referenceGene=background_tissue,
enrichDatabase=databases, interestGeneType="genesymbol",
referenceGeneType="genesymbol", isOutput=F))
if (!is.null(enrichResult)){
print(enrichResult[,c("description", "size", "overlap", "FDR", "userId")])
}
cat("\n")
} Prostate
Number of cTWAS Genes in Tissue: 9
Loading the functional categories...
Loading the ID list...
Loading the reference list...
Performing the enrichment analysis...
Warning in oraEnrichment(interestGeneList, referenceGeneList, geneSet, minNum = minNum, : No significant gene set is identified based on FDR 0.05!
Colon_Transverse
Number of cTWAS Genes in Tissue: 10
Loading the functional categories...
Loading the ID list...
Loading the reference list...
Performing the enrichment analysis...Warning in oraEnrichment(interestGeneList, referenceGeneList, geneSet, minNum = minNum, : No significant gene set is identified based on FDR 0.05!
Esophagus_Muscularis
Number of cTWAS Genes in Tissue: 7
Loading the functional categories...
Loading the ID list...
Loading the reference list...
Performing the enrichment analysis...Warning in oraEnrichment(interestGeneList, referenceGeneList, geneSet, minNum = minNum, : No significant gene set is identified based on FDR 0.05!
Skin_Not_Sun_Exposed_Suprapubic
Number of cTWAS Genes in Tissue: 4
Loading the functional categories...
Loading the ID list...
Loading the reference list...
Performing the enrichment analysis...Warning in oraEnrichment(interestGeneList, referenceGeneList, geneSet, minNum = minNum, : No significant gene set is identified based on FDR 0.05!
Brain_Nucleus_accumbens_basal_ganglia
Number of cTWAS Genes in Tissue: 7
Loading the functional categories...
Loading the ID list...
Loading the reference list...
Performing the enrichment analysis...
description size overlap FDR userId
1 Chemokine signaling pathway 92 3 0.04516239 CCL20;CXCL5;PRKCBDisGeNET
output <- output[order(-output$pve_g),]
top_tissues <- output$weight[1:5]
for (tissue in top_tissues){
cat(paste0(tissue, "\n\n"))
ctwas_genes_tissue <- df[[tissue]]$ctwas
cat(paste0("Number of cTWAS Genes in Tissue: ", length(ctwas_genes_tissue), "\n\n"))
res_enrich <- disease_enrichment(entities=ctwas_genes_tissue, vocabulary = "HGNC", database = "CURATED")
if (any(res_enrich@qresult$FDR < 0.05)){
  print(res_enrich@qresult[res_enrich@qresult$FDR < 0.05, c("Description", "FDR", "Ratio",  "BgRatio")])
}
cat("\n")
} Prostate
Number of cTWAS Genes in Tissue: 9RP11-973H7.1 gene(s) from the input list not found in DisGeNET CURATEDNXPE1 gene(s) from the input list not found in DisGeNET CURATEDRAB29 gene(s) from the input list not found in DisGeNET CURATEDRP11-107M16.2 gene(s) from the input list not found in DisGeNET CURATED Description FDR Ratio BgRatio
6 Ulcerative Colitis 0.006957328 2/5 63/9703
7 Enteritis 0.006957328 1/5 1/9703
Colon_Transverse
Number of cTWAS Genes in Tissue: 10RAB29 gene(s) from the input list not found in DisGeNET CURATEDRNF186 gene(s) from the input list not found in DisGeNET CURATEDNXPE1 gene(s) from the input list not found in DisGeNET CURATED Description FDR Ratio BgRatio
5 Ulcerative Colitis 0.006970959 2/7 63/9703
31 Congenital chloride diarrhea 0.006970959 1/7 1/9703
44 Retinitis Pigmentosa 26 0.006970959 1/7 1/9703
46 Inflammatory Bowel Disease 14 0.006970959 1/7 1/9703
48 IMMUNODEFICIENCY 32A 0.006970959 1/7 1/9703
49 IMMUNODEFICIENCY 32B 0.006970959 1/7 1/9703
18 Meniere Disease 0.015142146 1/7 3/9703
29 CREST Syndrome 0.021179345 1/7 6/9703
33 Scleroderma, Limited 0.021179345 1/7 6/9703
37 Diffuse Scleroderma 0.021179345 1/7 5/9703
1 Rheumatoid Arthritis 0.028201907 2/7 174/9703
Esophagus_Muscularis
Number of cTWAS Genes in Tissue: 7RP11-973H7.1 gene(s) from the input list not found in DisGeNET CURATEDFAM171B gene(s) from the input list not found in DisGeNET CURATED Description FDR Ratio BgRatio
7 Inflammatory Bowel Diseases 0.003642493 2/5 35/9703
4 Ulcerative Colitis 0.004981791 2/5 63/9703
21 Deep seated dermatophytosis 0.004981791 1/5 1/9703
23 Candidiasis, Familial, 2 0.007471145 1/5 2/9703
24 clinical depression 0.017915967 1/5 6/9703
12 Ankylosing spondylitis 0.027343413 1/5 11/9703
1 Behcet Syndrome 0.048322730 1/5 24/9703
6 Heart valve disease 0.048322730 1/5 26/9703
3 Calcinosis 0.048652707 1/5 42/9703
5 IGA Glomerulonephritis 0.048652707 1/5 34/9703
9 Acute Promyelocytic Leukemia 0.048652707 1/5 46/9703
15 Tumoral calcinosis 0.048652707 1/5 42/9703
16 Gastric Adenocarcinoma 0.048652707 1/5 45/9703
17 Microcalcification 0.048652707 1/5 42/9703
Skin_Not_Sun_Exposed_Suprapubic
Number of cTWAS Genes in Tissue: 4C1orf106 gene(s) from the input list not found in DisGeNET CURATEDC1orf74 gene(s) from the input list not found in DisGeNET CURATED Description FDR Ratio BgRatio
3 Ulcerative Colitis 0.0004566008 2/2 63/9703
8 Congenital chloride diarrhea 0.0007558579 1/2 1/9703
11 Inflammatory Bowel Disease 14 0.0007558579 1/2 1/9703
6 CREST Syndrome 0.0022669893 1/2 6/9703
9 Scleroderma, Limited 0.0022669893 1/2 6/9703
10 Diffuse Scleroderma 0.0022669893 1/2 5/9703
5 Systemic Scleroderma 0.0061491328 1/2 19/9703
2 Primary biliary cirrhosis 0.0132904105 1/2 47/9703
7 Libman-Sacks Disease 0.0145703213 1/2 58/9703
4 Lupus Erythematosus, Systemic 0.0160416873 1/2 71/9703
1 Rheumatoid Arthritis 0.0355490642 1/2 174/9703
Brain_Nucleus_accumbens_basal_ganglia
Number of cTWAS Genes in Tissue: 7RAB29 gene(s) from the input list not found in DisGeNET CURATEDC1orf74 gene(s) from the input list not found in DisGeNET CURATED Description FDR Ratio BgRatio
7 Ulcerative Colitis 0.0001836961 3/5 63/9703
31 Pneumonia 0.0042727383 2/5 54/9703
32 Lobar Pneumonia 0.0042727383 2/5 54/9703
56 Experimental Lung Inflammation 0.0042727383 2/5 54/9703
68 Pneumonitis 0.0042727383 2/5 54/9703
20 Hypersensitivity 0.0042907272 2/5 64/9703
62 Allergic Reaction 0.0042907272 2/5 63/9703
27 Meniere Disease 0.0137157405 1/5 3/9703
28 Mucocutaneous Lymph Node Syndrome 0.0162523411 1/5 4/9703
51 Pulmonary Cystic Fibrosis 0.0298882540 1/5 9/9703
64 Fibrocystic Disease of Pancreas 0.0298882540 1/5 9/9703
11 Cystic Fibrosis 0.0334721084 1/5 11/9703
41 Sicca Syndrome 0.0338928318 1/5 13/9703
63 Sjogren's Syndrome 0.0338928318 1/5 13/9703
25 Malaria 0.0485964406 1/5 20/9703Gene sets curated by Macarthur Lab
output <- output[order(-output$pve_g),]
top_tissues <- output$weight[1:5]

gene_set_dir <- "/project2/mstephens/wcrouse/gene_sets/"
gene_set_files <- c("gwascatalog.tsv",
                    "mgi_essential.tsv",
                    "core_essentials_hart.tsv",
                    "clinvar_path_likelypath.tsv",
                    "fda_approved_drug_targets.tsv")

for (tissue in top_tissues){
  cat(paste0(tissue, "\n\n"))

  ctwas_genes_tissue <- df[[tissue]]$ctwas
  background_tissue <- df[[tissue]]$gene_pips$genename

  cat(paste0("Number of cTWAS Genes in Tissue: ", length(ctwas_genes_tissue), "\n\n"))

  gene_sets <- lapply(gene_set_files, function(x){as.character(read.table(paste0(gene_set_dir, x))[,1])})
  names(gene_sets) <- sapply(gene_set_files, function(x){unlist(strsplit(x, "[.]"))[1]})

  gene_lists <- list(ctwas_genes_tissue=ctwas_genes_tissue)

  #genes in gene_sets filtered to ensure inclusion in background
  gene_sets <- lapply(gene_sets, function(x){x[x %in% background_tissue]})

  ##########
  hyp_score <- data.frame()
  size <- c()
  ngenes <- c()

  for (i in 1:length(gene_sets)) {
    for (j in 1:length(gene_lists)){
      group1 <- length(gene_sets[[i]])
      group2 <- length(as.vector(gene_lists[[j]]))
      size <- c(size, group1)
      Overlap <- length(intersect(gene_sets[[i]],as.vector(gene_lists[[j]])))
      ngenes <- c(ngenes, Overlap)
      Total <- length(background_tissue)
      hyp_score[i,j] <- phyper(Overlap-1, group2, Total-group2, group1,lower.tail=F)
    }
  }
  rownames(hyp_score) <- names(gene_sets)
  colnames(hyp_score) <- names(gene_lists)

  hyp_score_padj <- apply(hyp_score,2, p.adjust, method="BH", n=(nrow(hyp_score)*ncol(hyp_score)))
  hyp_score_padj <- as.data.frame(hyp_score_padj)
  hyp_score_padj$gene_set <- rownames(hyp_score_padj)
  hyp_score_padj$nset <- size
  hyp_score_padj$ngenes <- ngenes
  hyp_score_padj$percent <- ngenes/size

  hyp_score_padj <- hyp_score_padj[order(hyp_score_padj$ctwas_genes),]
  colnames(hyp_score_padj)[1] <- "padj"
  hyp_score_padj <- hyp_score_padj[,c(2:5,1)]
  rownames(hyp_score_padj)<- NULL

  print(hyp_score_padj)

  cat("\n")
}
Prostate
Number of cTWAS Genes in Tissue: 9
gene_set nset ngenes percent padj
1 gwascatalog 3588 5 0.001393534 0.5467644
2 mgi_essential 1250 0 0.000000000 1.0000000
3 core_essentials_hart 168 0 0.000000000 1.0000000
4 clinvar_path_likelypath 1667 0 0.000000000 1.0000000
5 fda_approved_drug_targets 192 0 0.000000000 1.0000000
Colon_Transverse
Number of cTWAS Genes in Tissue: 10
gene_set nset ngenes percent padj
1 gwascatalog 3743 7 0.001870158 0.06812182
2 clinvar_path_likelypath 1762 4 0.002270148 0.11796984
3 mgi_essential 1374 2 0.001455604 0.53687279
4 core_essentials_hart 178 0 0.000000000 1.00000000
5 fda_approved_drug_targets 197 0 0.000000000 1.00000000
Esophagus_Muscularis
Number of cTWAS Genes in Tissue: 7
gene_set nset ngenes percent padj
1 gwascatalog 3891 5 0.0012850167 0.1882627
2 fda_approved_drug_targets 194 1 0.0051546392 0.2657232
3 clinvar_path_likelypath 1783 2 0.0011217050 0.4552531
4 mgi_essential 1412 1 0.0007082153 0.7222968
5 core_essentials_hart 175 0 0.0000000000 1.0000000
Skin_Not_Sun_Exposed_Suprapubic
Number of cTWAS Genes in Tissue: 4
gene_set nset ngenes percent padj
1 gwascatalog 3937 1 0.0002540005 1
2 mgi_essential 1461 1 0.0006844627 1
3 core_essentials_hart 172 0 0.0000000000 1
4 clinvar_path_likelypath 1832 1 0.0005458515 1
5 fda_approved_drug_targets 207 0 0.0000000000 1
Brain_Nucleus_accumbens_basal_ganglia
Number of cTWAS Genes in Tissue: 7
gene_set nset ngenes percent padj
1 gwascatalog 3474 6 0.001727116 0.02114243
2 mgi_essential 1236 0 0.000000000 1.00000000
3 core_essentials_hart 151 0 0.000000000 1.00000000
4 clinvar_path_likelypath 1639 0 0.000000000 1.00000000
5 fda_approved_drug_targets 179 0 0.000000000 1.00000000Summary of results across tissues
weight_groups <- as.data.frame(matrix(c("Adipose_Subcutaneous", "Adipose",
                                        "Adipose_Visceral_Omentum", "Adipose",
                                        "Adrenal_Gland", "Endocrine",
                                        "Artery_Aorta", "Cardiovascular",
                                        "Artery_Coronary", "Cardiovascular",
                                        "Artery_Tibial", "Cardiovascular",
                                        "Brain_Amygdala", "CNS",
                                        "Brain_Anterior_cingulate_cortex_BA24", "CNS",
                                        "Brain_Caudate_basal_ganglia", "CNS",
                                        "Brain_Cerebellar_Hemisphere", "CNS",
                                        "Brain_Cerebellum", "CNS",
                                        "Brain_Cortex", "CNS",
                                        "Brain_Frontal_Cortex_BA9", "CNS",
                                        "Brain_Hippocampus", "CNS",
                                        "Brain_Hypothalamus", "CNS",
                                        "Brain_Nucleus_accumbens_basal_ganglia", "CNS",
                                        "Brain_Putamen_basal_ganglia", "CNS",
                                        "Brain_Spinal_cord_cervical_c-1", "CNS",
                                        "Brain_Substantia_nigra", "CNS",
                                        "Breast_Mammary_Tissue", "None",
                                        "Cells_Cultured_fibroblasts", "Skin",
                                        "Cells_EBV-transformed_lymphocytes", "Blood or Immune",
                                        "Colon_Sigmoid", "Digestive",
                                        "Colon_Transverse", "Digestive",
                                        "Esophagus_Gastroesophageal_Junction", "Digestive",
                                        "Esophagus_Mucosa", "Digestive",
                                        "Esophagus_Muscularis", "Digestive",
                                        "Heart_Atrial_Appendage", "Cardiovascular",
                                        "Heart_Left_Ventricle", "Cardiovascular",
                                        "Kidney_Cortex", "None",
                                        "Liver", "None",
                                        "Lung", "None",
                                        "Minor_Salivary_Gland", "None",
                                        "Muscle_Skeletal", "None",
                                        "Nerve_Tibial", "None",
                                        "Ovary", "None",
                                        "Pancreas", "None",
                                        "Pituitary", "Endocrine",
                                        "Prostate", "None",
                                        "Skin_Not_Sun_Exposed_Suprapubic", "Skin",
                                        "Skin_Sun_Exposed_Lower_leg", "Skin",
                                        "Small_Intestine_Terminal_Ileum", "Digestive",
                                        "Spleen", "Blood or Immune",
                                        "Stomach", "Digestive",
                                        "Testis", "Endocrine",
                                        "Thyroid", "Endocrine",
                                        "Uterus", "None",
                                        "Vagina", "None",
                                        "Whole_Blood", "Blood or Immune"),
                                      nrow=49, ncol=2, byrow=T), stringsAsFactors=F)
colnames(weight_groups) <- c("weight", "group")

#display tissue groups
print(weight_groups)
weight group
1 Adipose_Subcutaneous Adipose
2 Adipose_Visceral_Omentum Adipose
3 Adrenal_Gland Endocrine
4 Artery_Aorta Cardiovascular
5 Artery_Coronary Cardiovascular
6 Artery_Tibial Cardiovascular
7 Brain_Amygdala CNS
8 Brain_Anterior_cingulate_cortex_BA24 CNS
9 Brain_Caudate_basal_ganglia CNS
10 Brain_Cerebellar_Hemisphere CNS
11 Brain_Cerebellum CNS
12 Brain_Cortex CNS
13 Brain_Frontal_Cortex_BA9 CNS
14 Brain_Hippocampus CNS
15 Brain_Hypothalamus CNS
16 Brain_Nucleus_accumbens_basal_ganglia CNS
17 Brain_Putamen_basal_ganglia CNS
18 Brain_Spinal_cord_cervical_c-1 CNS
19 Brain_Substantia_nigra CNS
20 Breast_Mammary_Tissue None
21 Cells_Cultured_fibroblasts Skin
22 Cells_EBV-transformed_lymphocytes Blood or Immune
23 Colon_Sigmoid Digestive
24 Colon_Transverse Digestive
25 Esophagus_Gastroesophageal_Junction Digestive
26 Esophagus_Mucosa Digestive
27 Esophagus_Muscularis Digestive
28 Heart_Atrial_Appendage Cardiovascular
29 Heart_Left_Ventricle Cardiovascular
30 Kidney_Cortex None
31 Liver None
32 Lung None
33 Minor_Salivary_Gland None
34 Muscle_Skeletal None
35 Nerve_Tibial None
36 Ovary None
37 Pancreas None
38 Pituitary Endocrine
39 Prostate None
40 Skin_Not_Sun_Exposed_Suprapubic Skin
41 Skin_Sun_Exposed_Lower_leg Skin
42 Small_Intestine_Terminal_Ileum Digestive
43 Spleen Blood or Immune
44 Stomach Digestive
45 Testis Endocrine
46 Thyroid Endocrine
47 Uterus None
48 Vagina None
49 Whole_Blood Blood or Immunegroups <- unique(weight_groups$group)
df_group <- list()
for (i in 1:length(groups)){
group <- groups[i]
weights <- weight_groups$weight[weight_groups$group==group]
df_group[[group]] <- list(ctwas=unique(unlist(lapply(df[weights], function(x){x$ctwas}))),
background=unique(unlist(lapply(df[weights], function(x){x$gene_pips$genename}))))
}
output <- output[sapply(weight_groups$weight, match, output$weight),,drop=F]
output$group <- weight_groups$group
output$n_ctwas_group <- sapply(output$group, function(x){length(df_group[[x]][["ctwas"]])})
output$n_ctwas_group[output$group=="None"] <- 0
#barplot of number of cTWAS genes in each tissue
output <- output[order(-output$n_ctwas),,drop=F]
par(mar=c(10.1, 4.1, 4.1, 2.1))
barplot(output$n_ctwas, names.arg=output$weight, las=2, ylab="Number of cTWAS Genes", cex.names=0.6, main="Number of cTWAS Genes by Tissue")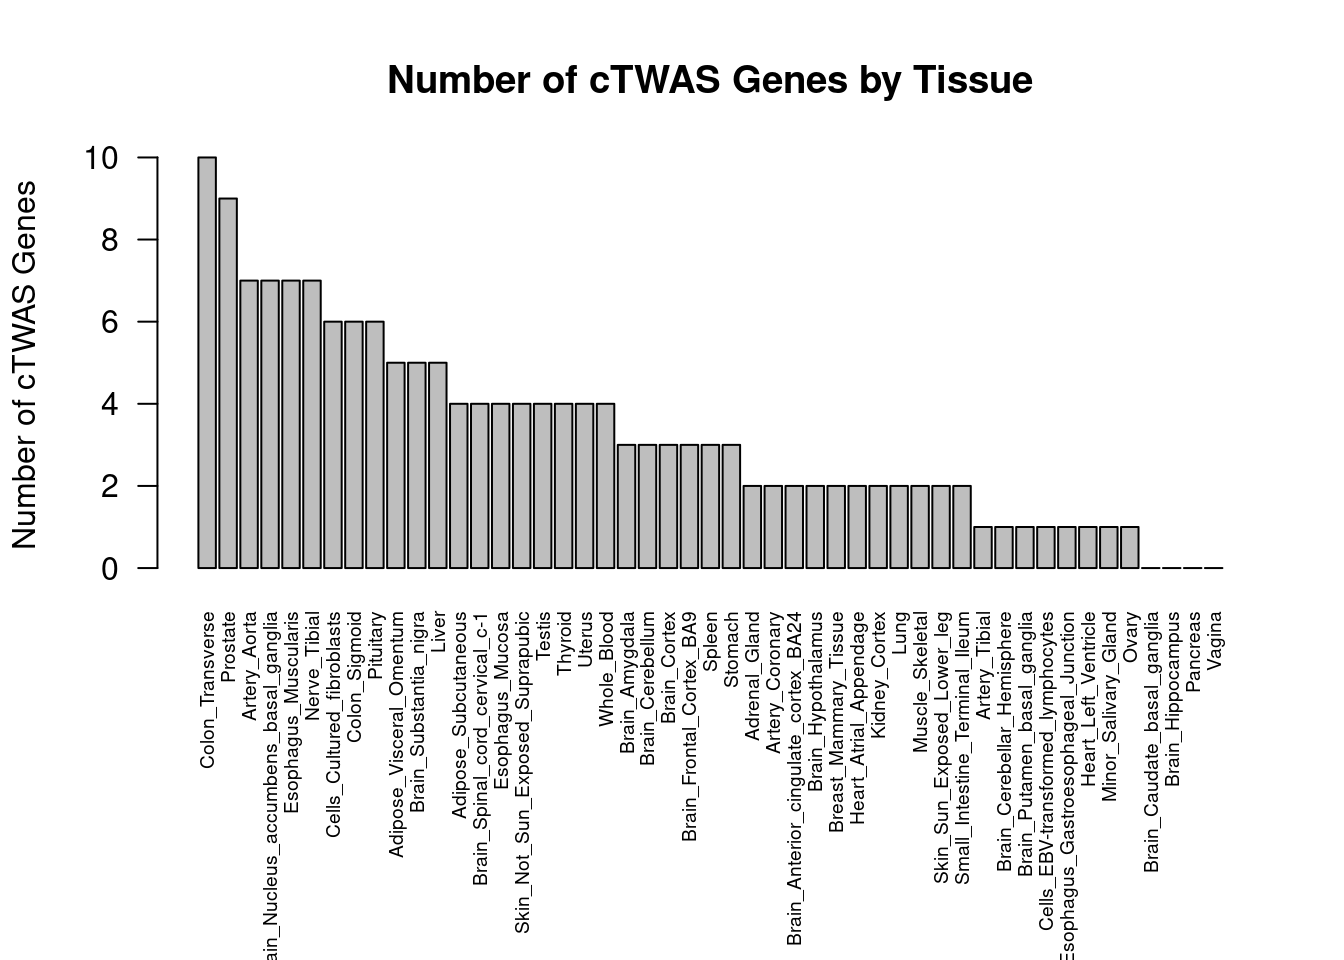
#barplot of number of cTWAS genes in each tissue
df_plot <- -sort(-sapply(groups[groups!="None"], function(x){length(df_group[[x]][["ctwas"]])}))

par(mar=c(10.1, 4.1, 4.1, 2.1))
barplot(df_plot, las=2, ylab="Number of cTWAS Genes", main="Number of cTWAS Genes by Tissue Group")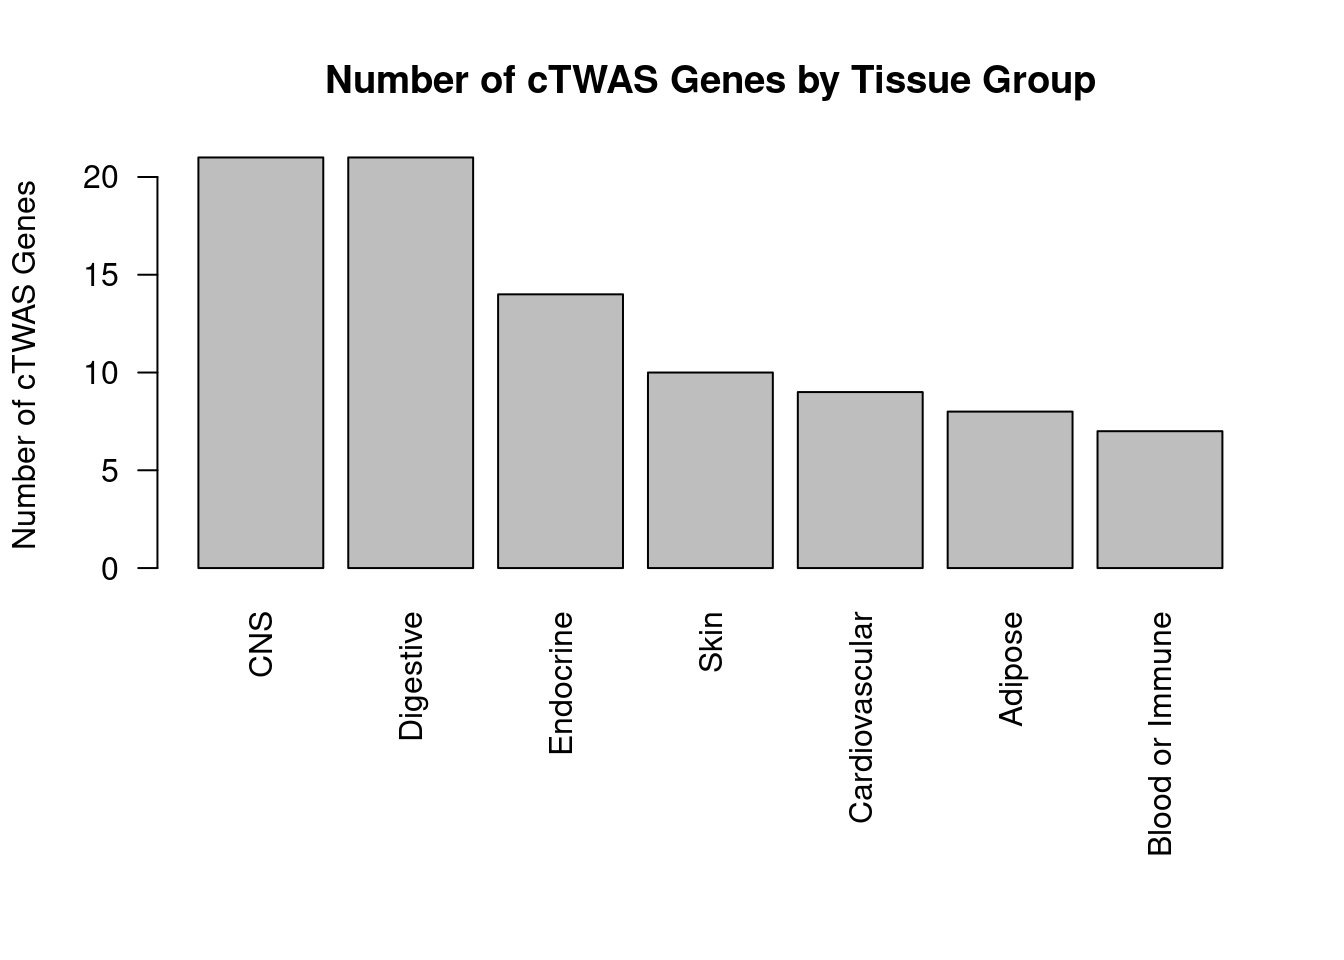
Enrichment analysis for cTWAS genes in each tissue group
GO
suppressWarnings(rm(group_enrichment_results))

for (group in names(df_group)){
  cat(paste0(group, "\n\n"))

  ctwas_genes_group <- df_group[[group]]$ctwas

  cat(paste0("Number of cTWAS Genes in Tissue Group: ", length(ctwas_genes_group), "\n\n"))

  dbs <- c("GO_Biological_Process_2021")
  GO_enrichment <- enrichr(ctwas_genes_group, dbs)

  for (db in dbs){
    cat(paste0("\n", db, "\n\n"))
    enrich_results <- GO_enrichment[[db]]
    enrich_results <- enrich_results[enrich_results$Adjusted.P.value<0.05,c("Term", "Overlap", "Adjusted.P.value", "Genes")]
    print(enrich_results)
    print(plotEnrich(GO_enrichment[[db]]))

    if (nrow(enrich_results)>0){
      if (!exists("group_enrichment_results")){
        group_enrichment_results <- cbind(group, db, enrich_results)
      } else {
        group_enrichment_results <- rbind(group_enrichment_results, cbind(group, db, enrich_results))
      }
    }
  }

}
Adipose
Number of cTWAS Genes in Tissue Group: 8
Uploading data to Enrichr... Done.
Querying GO_Biological_Process_2021... Done.
Parsing results... Done.
GO_Biological_Process_2021
Term Overlap Adjusted.P.value Genes
1 positive regulation of cytokine production (GO:0001819) 3/335 0.02830849 CARD9;PRKD2;TNFRSF14
2 positive regulation of NF-kappaB transcription factor activity (GO:0051092) 2/155 0.02830849 CARD9;PRKD2
3 positive regulation of ERK1 and ERK2 cascade (GO:0070374) 2/172 0.02830849 CARD9;PRKD2
4 positive regulation of fibroblast growth factor receptor signaling pathway (GO:0045743) 1/5 0.02830849 PRKD2
5 positive regulation of endothelial cell chemotaxis by VEGF-activated vascular endothelial growth factor receptor signaling pathway (GO:0038033) 1/5 0.02830849 PRKD2
6 negative regulation of adaptive immune response (GO:0002820) 1/5 0.02830849 TNFRSF14
7 morphogenesis of an endothelium (GO:0003159) 1/6 0.02830849 PRKD2
8 positive regulation of deacetylase activity (GO:0090045) 1/6 0.02830849 PRKD2
9 regulation of histone deacetylase activity (GO:1901725) 1/7 0.02830849 PRKD2
10 positive regulation of cell migration by vascular endothelial growth factor signaling pathway (GO:0038089) 1/8 0.02830849 PRKD2
11 regulation of alpha-beta T cell proliferation (GO:0046640) 1/8 0.02830849 TNFRSF14
12 myeloid leukocyte mediated immunity (GO:0002444) 1/8 0.02830849 CARD9
13 negative regulation of alpha-beta T cell activation (GO:0046636) 1/9 0.02830849 TNFRSF14
14 regulation of ERK1 and ERK2 cascade (GO:0070372) 2/238 0.02830849 CARD9;PRKD2
15 positive regulation of vascular endothelial growth factor receptor signaling pathway (GO:0030949) 1/10 0.02830849 PRKD2
16 regulation of T-helper 17 type immune response (GO:2000316) 1/10 0.02830849 CARD9
17 immunoglobulin mediated immune response (GO:0016064) 1/10 0.02830849 CARD9
18 endothelial tube morphogenesis (GO:0061154) 1/10 0.02830849 PRKD2
19 negative regulation of alpha-beta T cell proliferation (GO:0046642) 1/10 0.02830849 TNFRSF14
20 positive regulation of DNA-binding transcription factor activity (GO:0051091) 2/246 0.02830849 CARD9;PRKD2
21 B cell mediated immunity (GO:0019724) 1/11 0.02830849 CARD9
22 positive regulation of T-helper 17 type immune response (GO:2000318) 1/12 0.02830849 CARD9
23 positive regulation of MAPK cascade (GO:0043410) 2/274 0.02830849 CARD9;PRKD2
24 positive regulation of adaptive immune response based on somatic recombination of immune receptors built from immunoglobulin superfamily domains (GO:0002824) 1/13 0.02830849 CARD9
25 positive regulation of histone deacetylation (GO:0031065) 1/13 0.02830849 PRKD2
26 homeostasis of number of cells (GO:0048872) 1/13 0.02830849 CARD9
27 antifungal innate immune response (GO:0061760) 1/13 0.02830849 CARD9
28 positive regulation of T cell receptor signaling pathway (GO:0050862) 1/14 0.02830849 PRKD2
29 positive regulation of granulocyte macrophage colony-stimulating factor production (GO:0032725) 1/14 0.02830849 CARD9
30 positive regulation of lymphocyte migration (GO:2000403) 1/14 0.02830849 TNFRSF14
31 regulation of endothelial cell chemotaxis (GO:2001026) 1/15 0.02842990 PRKD2
32 positive regulation of endothelial cell chemotaxis (GO:2001028) 1/15 0.02842990 PRKD2
33 regulation of granulocyte macrophage colony-stimulating factor production (GO:0032645) 1/16 0.02940115 CARD9
34 embryo development ending in birth or egg hatching (GO:0009792) 1/17 0.02944851 NR5A2
35 positive regulation of cytokine production involved in inflammatory response (GO:1900017) 1/17 0.02944851 CARD9
36 positive regulation of CREB transcription factor activity (GO:0032793) 1/18 0.02949017 PRKD2
37 positive regulation of stress-activated protein kinase signaling cascade (GO:0070304) 1/18 0.02949017 CARD9
38 regulation of fibroblast growth factor receptor signaling pathway (GO:0040036) 1/20 0.03107565 PRKD2
39 regulation of T cell migration (GO:2000404) 1/20 0.03107565 TNFRSF14
40 positive regulation of antigen receptor-mediated signaling pathway (GO:0050857) 1/21 0.03180813 PRKD2
41 positive regulation of protein phosphorylation (GO:0001934) 2/371 0.03229609 PRKD2;TNFRSF14
42 positive regulation of interleukin-17 production (GO:0032740) 1/23 0.03229609 CARD9
43 defense response to fungus (GO:0050832) 1/24 0.03229609 CARD9
44 regulation of cytokine production involved in immune response (GO:0002718) 1/24 0.03229609 TNFRSF14
45 regulation of vascular endothelial growth factor receptor signaling pathway (GO:0030947) 1/24 0.03229609 PRKD2
46 positive regulation of T cell migration (GO:2000406) 1/25 0.03290467 TNFRSF14
47 positive regulation of interleukin-2 production (GO:0032743) 1/26 0.03348690 PRKD2
48 positive regulation of viral genome replication (GO:0045070) 1/29 0.03580747 NR5A2
49 regulation of DNA biosynthetic process (GO:2000278) 1/29 0.03580747 PRKD2
50 modulation by host of symbiont process (GO:0051851) 1/32 0.03777430 CARD9
51 regulation of interleukin-17 production (GO:0032660) 1/33 0.03777430 CARD9
52 positive regulation of cytokine production involved in immune response (GO:0002720) 1/33 0.03777430 TNFRSF14
53 epithelial tube morphogenesis (GO:0060562) 1/34 0.03777430 PRKD2
54 cellular response to vascular endothelial growth factor stimulus (GO:0035924) 1/34 0.03777430 PRKD2
55 negative regulation of T cell proliferation (GO:0042130) 1/35 0.03777430 TNFRSF14
56 regulation of T cell receptor signaling pathway (GO:0050856) 1/35 0.03777430 PRKD2
57 positive regulation of potassium ion transport (GO:0043268) 1/38 0.03957713 GABBR1
58 positive regulation of production of molecular mediator of immune response (GO:0002702) 1/38 0.03957713 TNFRSF14
59 positive regulation of cation transmembrane transport (GO:1904064) 1/41 0.04195588 GABBR1
60 regulation of cytokine production involved in inflammatory response (GO:1900015) 1/43 0.04325401 CARD9
61 positive regulation of potassium ion transmembrane transport (GO:1901381) 1/44 0.04352674 GABBR1
62 positive regulation of chemotaxis (GO:0050921) 1/45 0.04379033 PRKD2
63 positive regulation of intracellular signal transduction (GO:1902533) 2/546 0.04409355 CARD9;PRKD2
64 positive regulation of blood vessel endothelial cell migration (GO:0043536) 1/48 0.04409355 PRKD2
65 regulation of interleukin-2 production (GO:0032663) 1/48 0.04409355 PRKD2
66 regulation of stress-activated MAPK cascade (GO:0032872) 1/49 0.04409355 CARD9
67 cellular defense response (GO:0006968) 1/49 0.04409355 LSP1
68 regulation of potassium ion transmembrane transport (GO:1901379) 1/54 0.04783648 GABBR1
69 regulation of blood vessel endothelial cell migration (GO:0043535) 1/55 0.04800783 PRKD2
70 membrane lipid biosynthetic process (GO:0046467) 1/58 0.04920863 PRKD2
71 adenylate cyclase-inhibiting G protein-coupled receptor signaling pathway (GO:0007193) 1/60 0.04920863 GABBR1
72 peptidyl-threonine phosphorylation (GO:0018107) 1/60 0.04920863 PRKD2
73 positive regulation of interleukin-8 production (GO:0032757) 1/61 0.04920863 PRKD2
74 positive regulation of DNA biosynthetic process (GO:2000573) 1/61 0.04920863 PRKD2
75 positive regulation of cysteine-type endopeptidase activity (GO:2001056) 1/62 0.04920863 CARD9
76 positive regulation of viral process (GO:0048524) 1/63 0.04920863 NR5A2
77 positive regulation of DNA metabolic process (GO:0051054) 1/63 0.04920863 PRKD2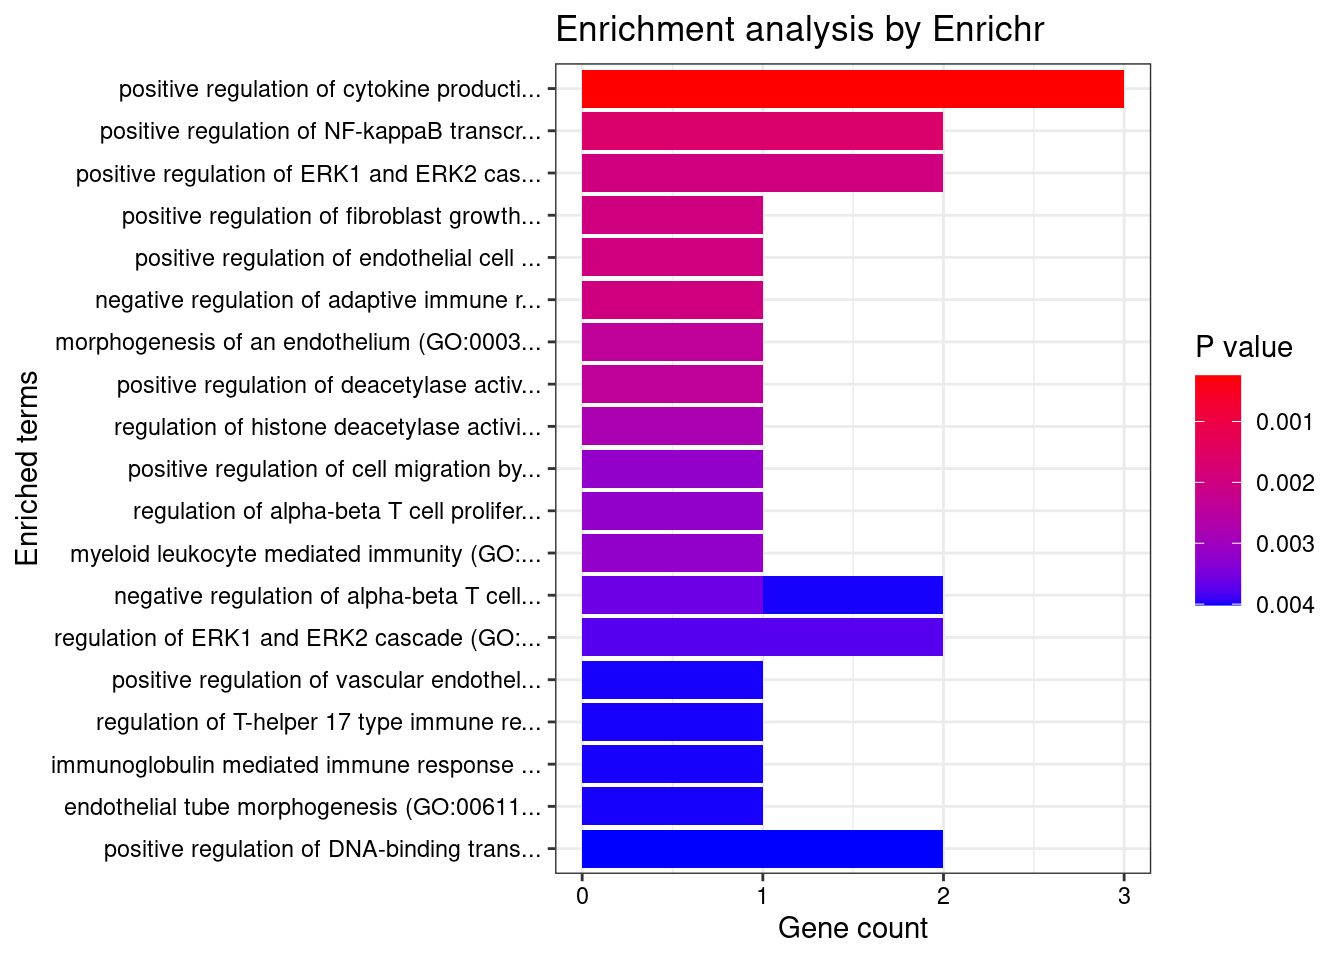
Endocrine
Number of cTWAS Genes in Tissue Group: 14
Uploading data to Enrichr... Done.
Querying GO_Biological_Process_2021... Done.
Parsing results... Done.
GO_Biological_Process_2021
Term Overlap Adjusted.P.value Genes
1 positive regulation of lymphocyte migration (GO:2000403) 2/14 0.005278567 CCL20;TNFRSF14
2 cytokine-mediated signaling pathway (GO:0019221) 5/621 0.005278567 MUC1;TNFSF15;CCL20;TNFRSF14;CXCL5
3 positive regulation of cysteine-type endopeptidase activity involved in apoptotic process (GO:0043280) 3/119 0.005278567 SMAD3;TNFSF15;CARD9
4 regulation of T cell migration (GO:2000404) 2/20 0.005278567 CCL20;TNFRSF14
5 positive regulation of T cell migration (GO:2000406) 2/25 0.006654367 CCL20;TNFRSF14
6 cellular response to tumor necrosis factor (GO:0071356) 3/194 0.012394750 TNFSF15;CCL20;TNFRSF14
7 positive regulation of DNA-binding transcription factor activity (GO:0051091) 3/246 0.021086637 SMAD3;PRKCB;CARD9
8 chemokine-mediated signaling pathway (GO:0070098) 2/56 0.021086637 CCL20;CXCL5
9 cellular response to chemokine (GO:1990869) 2/60 0.021508650 CCL20;CXCL5
10 neutrophil chemotaxis (GO:0030593) 2/70 0.025993156 CCL20;CXCL5
11 granulocyte chemotaxis (GO:0071621) 2/73 0.025993156 CCL20;CXCL5
12 neutrophil migration (GO:1990266) 2/77 0.026486543 CCL20;CXCL5
13 activation of cysteine-type endopeptidase activity involved in apoptotic process (GO:0006919) 2/81 0.027029607 SMAD3;TNFSF15
14 cellular response to lectin (GO:1990858) 2/115 0.037325011 MUC1;CARD9
15 stimulatory C-type lectin receptor signaling pathway (GO:0002223) 2/115 0.037325011 MUC1;CARD9
16 tumor necrosis factor-mediated signaling pathway (GO:0033209) 2/116 0.037325011 TNFSF15;TNFRSF14
17 innate immune response activating cell surface receptor signaling pathway (GO:0002220) 2/119 0.037325011 MUC1;CARD9
18 histone-threonine phosphorylation (GO:0035405) 1/5 0.037325011 PRKCB
19 negative regulation of adaptive immune response (GO:0002820) 1/5 0.037325011 TNFRSF14
20 cellular response to cytokine stimulus (GO:0071345) 3/482 0.037325011 MUC1;SMAD3;CCL20
21 negative regulation of cytosolic calcium ion concentration (GO:0051481) 1/6 0.037325011 SMAD3
22 regulation of extracellular matrix assembly (GO:1901201) 1/7 0.037325011 SMAD3
23 SMAD protein complex assembly (GO:0007183) 1/7 0.037325011 SMAD3
24 positive regulation of B cell receptor signaling pathway (GO:0050861) 1/7 0.037325011 PRKCB
25 regulation of transforming growth factor beta2 production (GO:0032909) 1/7 0.037325011 SMAD3
26 nodal signaling pathway (GO:0038092) 1/7 0.037325011 SMAD3
27 positive regulation of histone H4 acetylation (GO:0090240) 1/7 0.037325011 MUC1
28 positive regulation of NF-kappaB transcription factor activity (GO:0051092) 2/155 0.037325011 PRKCB;CARD9
29 regulation of alpha-beta T cell proliferation (GO:0046640) 1/8 0.037325011 TNFRSF14
30 myeloid leukocyte mediated immunity (GO:0002444) 1/8 0.037325011 CARD9
31 positive regulation of I-kappaB kinase/NF-kappaB signaling (GO:0043123) 2/171 0.037325011 PRKCB;CARD9
32 positive regulation of ERK1 and ERK2 cascade (GO:0070374) 2/172 0.037325011 CCL20;CARD9
33 regulation of histone H4 acetylation (GO:0090239) 1/9 0.037325011 MUC1
34 positive regulation of extracellular matrix assembly (GO:1901203) 1/9 0.037325011 SMAD3
35 regulation of DNA-templated transcription in response to stress (GO:0043620) 1/9 0.037325011 MUC1
36 negative regulation of alpha-beta T cell activation (GO:0046636) 1/9 0.037325011 TNFRSF14
37 negative regulation of cell adhesion mediated by integrin (GO:0033629) 1/10 0.037325011 MUC1
38 negative regulation of transcription by competitive promoter binding (GO:0010944) 1/10 0.037325011 MUC1
39 negative regulation of transmembrane transport (GO:0034763) 1/10 0.037325011 PRKCB
40 lipoprotein transport (GO:0042953) 1/10 0.037325011 PRKCB
41 regulation of T-helper 17 type immune response (GO:2000316) 1/10 0.037325011 CARD9
42 positive regulation of vascular endothelial growth factor receptor signaling pathway (GO:0030949) 1/10 0.037325011 PRKCB
43 DNA damage response, signal transduction by p53 class mediator resulting in transcription of p21 class mediator (GO:0006978) 1/10 0.037325011 MUC1
44 primary miRNA processing (GO:0031053) 1/10 0.037325011 SMAD3
45 immunoglobulin mediated immune response (GO:0016064) 1/10 0.037325011 CARD9
46 negative regulation of alpha-beta T cell proliferation (GO:0046642) 1/10 0.037325011 TNFRSF14
47 lipoprotein localization (GO:0044872) 1/11 0.038531285 PRKCB
48 B cell mediated immunity (GO:0019724) 1/11 0.038531285 CARD9
49 DNA damage response, signal transduction resulting in transcription (GO:0042772) 1/11 0.038531285 MUC1
50 regulation of hemopoiesis (GO:1903706) 1/12 0.038849136 PRKCB
51 negative regulation of glucose transmembrane transport (GO:0010829) 1/12 0.038849136 PRKCB
52 positive regulation of T-helper 17 type immune response (GO:2000318) 1/12 0.038849136 CARD9
53 mitotic nuclear membrane disassembly (GO:0007077) 1/12 0.038849136 PRKCB
54 positive regulation of adaptive immune response based on somatic recombination of immune receptors built from immunoglobulin superfamily domains (GO:0002824) 1/13 0.039120426 CARD9
55 antifungal innate immune response (GO:0061760) 1/13 0.039120426 CARD9
56 negative regulation of intrinsic apoptotic signaling pathway in response to DNA damage by p53 class mediator (GO:1902166) 1/13 0.039120426 MUC1
57 homeostasis of number of cells (GO:0048872) 1/13 0.039120426 CARD9
58 quinone biosynthetic process (GO:1901663) 1/14 0.039354316 COQ8A
59 regulation of intrinsic apoptotic signaling pathway in response to DNA damage by p53 class mediator (GO:1902165) 1/14 0.039354316 MUC1
60 nuclear membrane disassembly (GO:0051081) 1/14 0.039354316 PRKCB
61 positive regulation of granulocyte macrophage colony-stimulating factor production (GO:0032725) 1/14 0.039354316 CARD9
62 regulation of I-kappaB kinase/NF-kappaB signaling (GO:0043122) 2/224 0.040175801 PRKCB;CARD9
63 ubiquinone biosynthetic process (GO:0006744) 1/15 0.040175801 COQ8A
64 ubiquinone metabolic process (GO:0006743) 1/15 0.040175801 COQ8A
65 inflammatory response (GO:0006954) 2/230 0.040922064 CCL20;CXCL5
66 activation of NF-kappaB-inducing kinase activity (GO:0007250) 1/16 0.040922064 TNFSF15
67 regulation of granulocyte macrophage colony-stimulating factor production (GO:0032645) 1/16 0.040922064 CARD9
68 regulation of ERK1 and ERK2 cascade (GO:0070372) 2/238 0.041602777 CCL20;CARD9
69 positive regulation of cytokine production involved in inflammatory response (GO:1900017) 1/17 0.041602777 CARD9
70 negative regulation of intrinsic apoptotic signaling pathway by p53 class mediator (GO:1902254) 1/17 0.041602777 MUC1
71 T cell migration (GO:0072678) 1/18 0.041655401 CCL20
72 regulation of transforming growth factor beta production (GO:0071634) 1/18 0.041655401 SMAD3
73 positive regulation of stress-activated protein kinase signaling cascade (GO:0070304) 1/18 0.041655401 CARD9
74 positive regulation of extracellular matrix organization (GO:1903055) 1/18 0.041655401 SMAD3
75 activin receptor signaling pathway (GO:0032924) 1/19 0.042798608 SMAD3
76 regulation of glucose transmembrane transport (GO:0010827) 1/19 0.042798608 PRKCB
77 regulation of transcription by RNA polymerase II (GO:0006357) 5/2206 0.044224127 MUC1;SMAD3;PRKCB;MED16;NKX2-3
78 positive regulation of antigen receptor-mediated signaling pathway (GO:0050857) 1/21 0.045477863 PRKCB
79 calcium-mediated signaling using intracellular calcium source (GO:0035584) 1/21 0.045477863 CCL20
80 positive regulation of MAPK cascade (GO:0043410) 2/274 0.045577861 CCL20;CARD9
81 positive regulation of DNA-templated transcription, initiation (GO:2000144) 1/22 0.045577861 MED16
82 regulation of B cell receptor signaling pathway (GO:0050855) 1/23 0.045577861 PRKCB
83 positive regulation of transcription initiation from RNA polymerase II promoter (GO:0060261) 1/23 0.045577861 MED16
84 positive regulation of histone acetylation (GO:0035066) 1/23 0.045577861 MUC1
85 positive regulation of interleukin-17 production (GO:0032740) 1/23 0.045577861 CARD9
86 regulation of vascular endothelial growth factor receptor signaling pathway (GO:0030947) 1/24 0.045577861 PRKCB
87 defense response to fungus (GO:0050832) 1/24 0.045577861 CARD9
88 positive regulation of transcription from RNA polymerase II promoter in response to stress (GO:0036003) 1/24 0.045577861 MUC1
89 regulation of cellular response to transforming growth factor beta stimulus (GO:1903844) 1/24 0.045577861 SMAD3
90 regulation of cytokine production involved in immune response (GO:0002718) 1/24 0.045577861 TNFRSF14
91 negative regulation of intrinsic apoptotic signaling pathway in response to DNA damage (GO:1902230) 1/26 0.048801755 MUC1
92 positive regulation of nitric oxide biosynthetic process (GO:0045429) 1/27 0.049572800 SMAD3
93 negative regulation of insulin receptor signaling pathway (GO:0046627) 1/27 0.049572800 PRKCB
94 positive regulation of nitric oxide metabolic process (GO:1904407) 1/28 0.049786155 SMAD3
95 negative regulation of cellular response to insulin stimulus (GO:1900077) 1/28 0.049786155 PRKCB
96 positive regulation of protein import into nucleus (GO:0042307) 1/28 0.049786155 SMAD3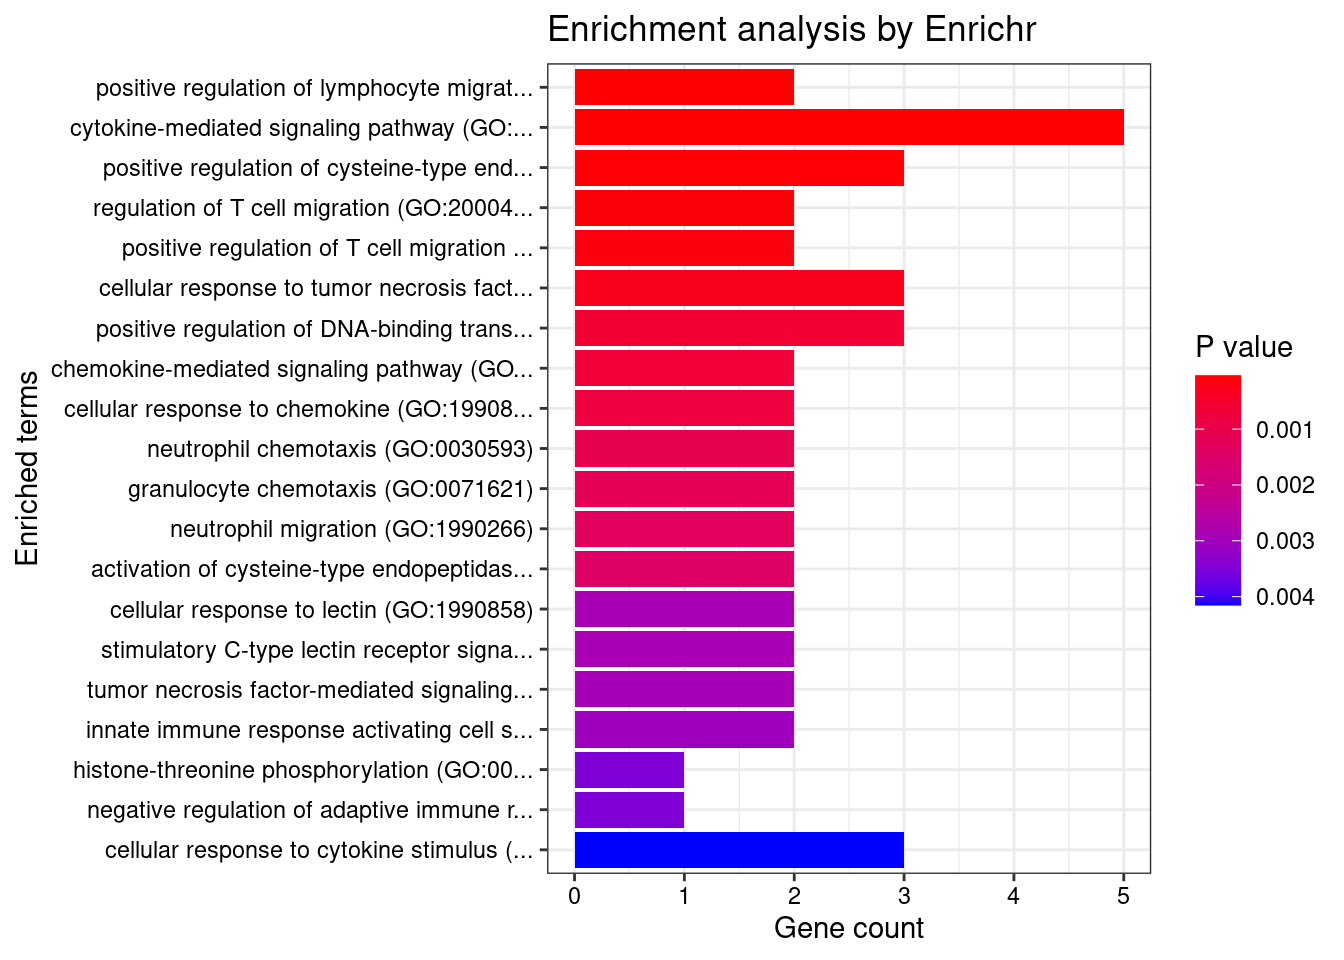
Cardiovascular

Number of cTWAS Genes in Tissue Group: 9

Uploading data to Enrichr... Done.
  Querying GO_Biological_Process_2021... Done.
Parsing results... Done.

GO_Biological_Process_2021

                                                                                                                                              Term Overlap Adjusted.P.value       Genes
1                                                                            positive regulation of T cell receptor signaling pathway (GO:0050862)    2/14      0.002727787 RAB29;PRKD2
2                                                                  positive regulation of antigen receptor-mediated signaling pathway (GO:0050857)    2/21      0.003142335 RAB29;PRKD2
3                                                                                     regulation of T cell receptor signaling pathway (GO:0050856)    2/35      0.005916212 RAB29;PRKD2
4                                                          positive regulation of fibroblast growth factor receptor signaling pathway (GO:0045743)     1/5      0.039480946       PRKD2
5                                                                                                                T cell extravasation (GO:0072683)     1/5      0.039480946       ITGAL
6  positive regulation of endothelial cell chemotaxis by VEGF-activated vascular endothelial growth factor receptor signaling pathway (GO:0038033)     1/5      0.039480946       PRKD2
7                                                                                                           response to peptidoglycan (GO:0032494)     1/6      0.039480946        IRF5
8                                                                                                     morphogenesis of an endothelium (GO:0003159)     1/6      0.039480946       PRKD2
9                                                                                         positive regulation of deacetylase activity (GO:0090045)     1/6      0.039480946       PRKD2
10                                                                                                      regulation of immune response (GO:0050776)   2/179      0.039480946 ERAP1;ITGAL
11                                                                                         regulation of histone deacetylase activity (GO:1901725)     1/7      0.039480946       PRKD2
12                                                                                           protein localization to ciliary membrane (GO:1903441)     1/7      0.039480946       RAB29
13                                                                                                   protein localization to membrane (GO:0072657)   2/195      0.039480946 RAB29;ITGAL
14                                      positive regulation of cell migration by vascular endothelial growth factor signaling pathway (GO:0038089)     1/8      0.039480946       PRKD2
15                                                  antigen processing and presentation of endogenous peptide antigen via MHC class I (GO:0019885)     1/8      0.039480946       ERAP1
16                                               positive regulation of vascular endothelial growth factor receptor signaling pathway (GO:0030949)    1/10      0.039480946       PRKD2
17                                                                                          positive regulation of receptor recycling (GO:0001921)    1/10      0.039480946       RAB29
18                                                                                                                    toxin transport (GO:1901998)    1/10      0.039480946       RAB29
19                                                                                                     endothelial tube morphogenesis (GO:0061154)    1/10      0.039480946       PRKD2
20                                                                                       positive regulation of histone deacetylation (GO:0031065)    1/13      0.046409323       PRKD2
21                                                                                                      response to muramyl dipeptide (GO:0032495)    1/13      0.046409323        IRF5
22                                                                  antigen processing and presentation of endogenous peptide antigen (GO:0002483)    1/14      0.046836865       ERAP1
23                                                                                          regulation of endothelial cell chemotaxis (GO:2001026)    1/15      0.046836865       PRKD2
24                                                                                 positive regulation of endothelial cell chemotaxis (GO:2001028)    1/15      0.046836865       PRKD2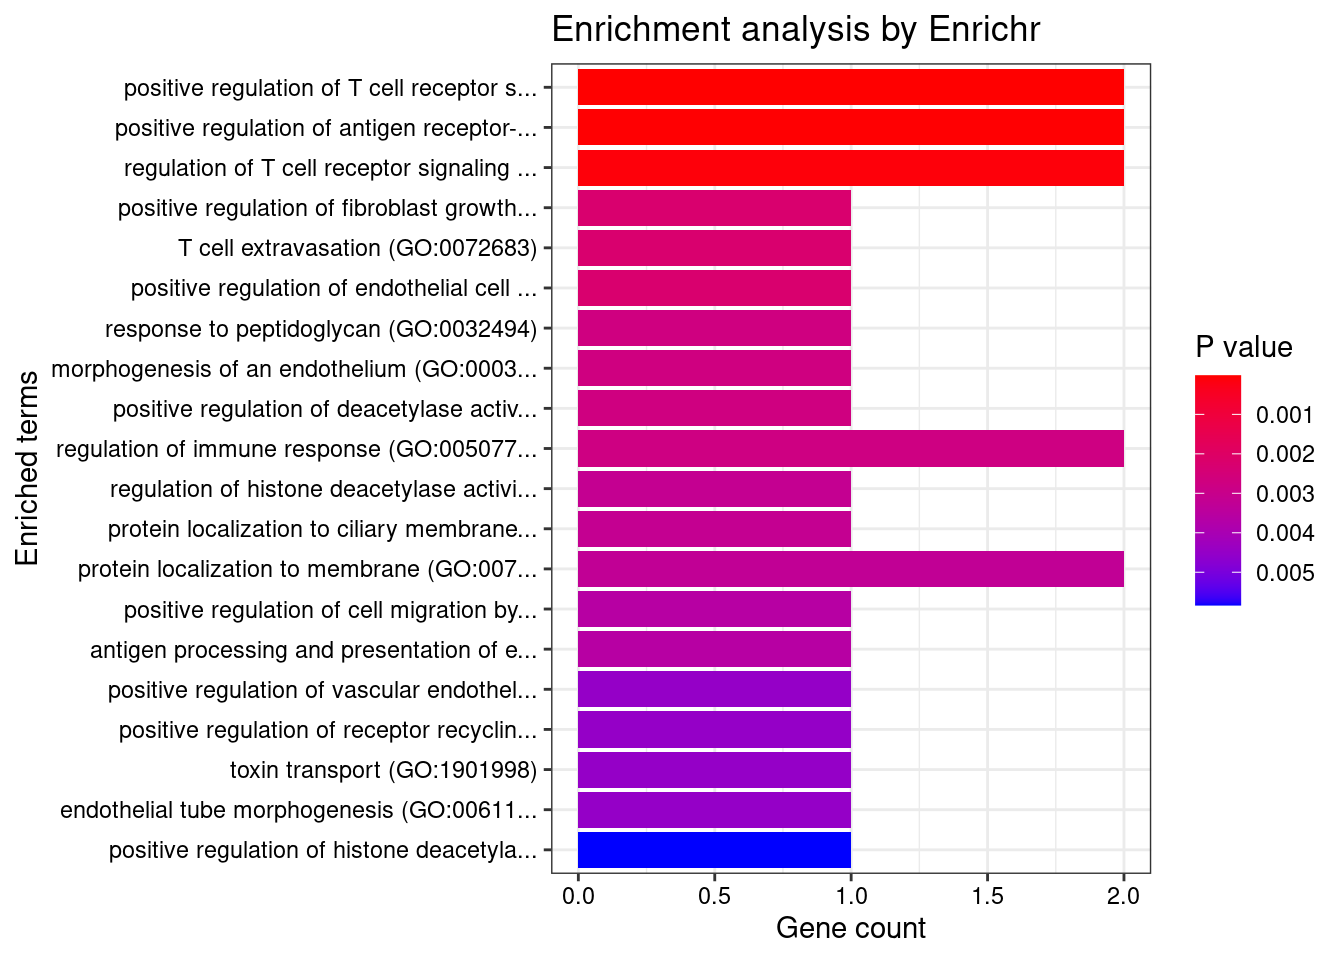
CNS

Number of cTWAS Genes in Tissue Group: 21

Uploading data to Enrichr... Done.
  Querying GO_Biological_Process_2021... Done.
Parsing results... Done.

GO_Biological_Process_2021

                                                                                                Term Overlap Adjusted.P.value                                  Genes
1                    positive regulation of antigen receptor-mediated signaling pathway (GO:0050857)    3/21     0.0003814218                      PRKCB;RAB29;PRKD2
2                                                   cytokine-mediated signaling pathway (GO:0019221)   6/621     0.0033667849 MUC1;TNFRSF6B;FCER1G;CCL20;CXCL5;IP6K2
3  positive regulation of vascular endothelial growth factor receptor signaling pathway (GO:0030949)    2/10     0.0033667849                            PRKCB;PRKD2
4                                                                 neutrophil chemotaxis (GO:0030593)    3/70     0.0033667849                     FCER1G;CCL20;CXCL5
5                                                                granulocyte chemotaxis (GO:0071621)    3/73     0.0033667849                     FCER1G;CCL20;CXCL5
6                                                                  neutrophil migration (GO:1990266)    3/77     0.0033667849                     FCER1G;CCL20;CXCL5
7                              positive regulation of T cell receptor signaling pathway (GO:0050862)    2/14     0.0039421052                            RAB29;PRKD2
8           regulation of vascular endothelial growth factor receptor signaling pathway (GO:0030947)    2/24     0.0103958044                            PRKCB;PRKD2
9                antigen processing and presentation of peptide antigen via MHC class I (GO:0002474)    2/33     0.0175775629                           FCER1G;ERAP1
10                                      regulation of T cell receptor signaling pathway (GO:0050856)    2/35     0.0178047125                            RAB29;PRKD2
11                                                 chemokine-mediated signaling pathway (GO:0070098)    2/56     0.0413409657                            CCL20;CXCL5
12                                                       cellular response to chemokine (GO:1990869)    2/60     0.0434457068                            CCL20;CXCL5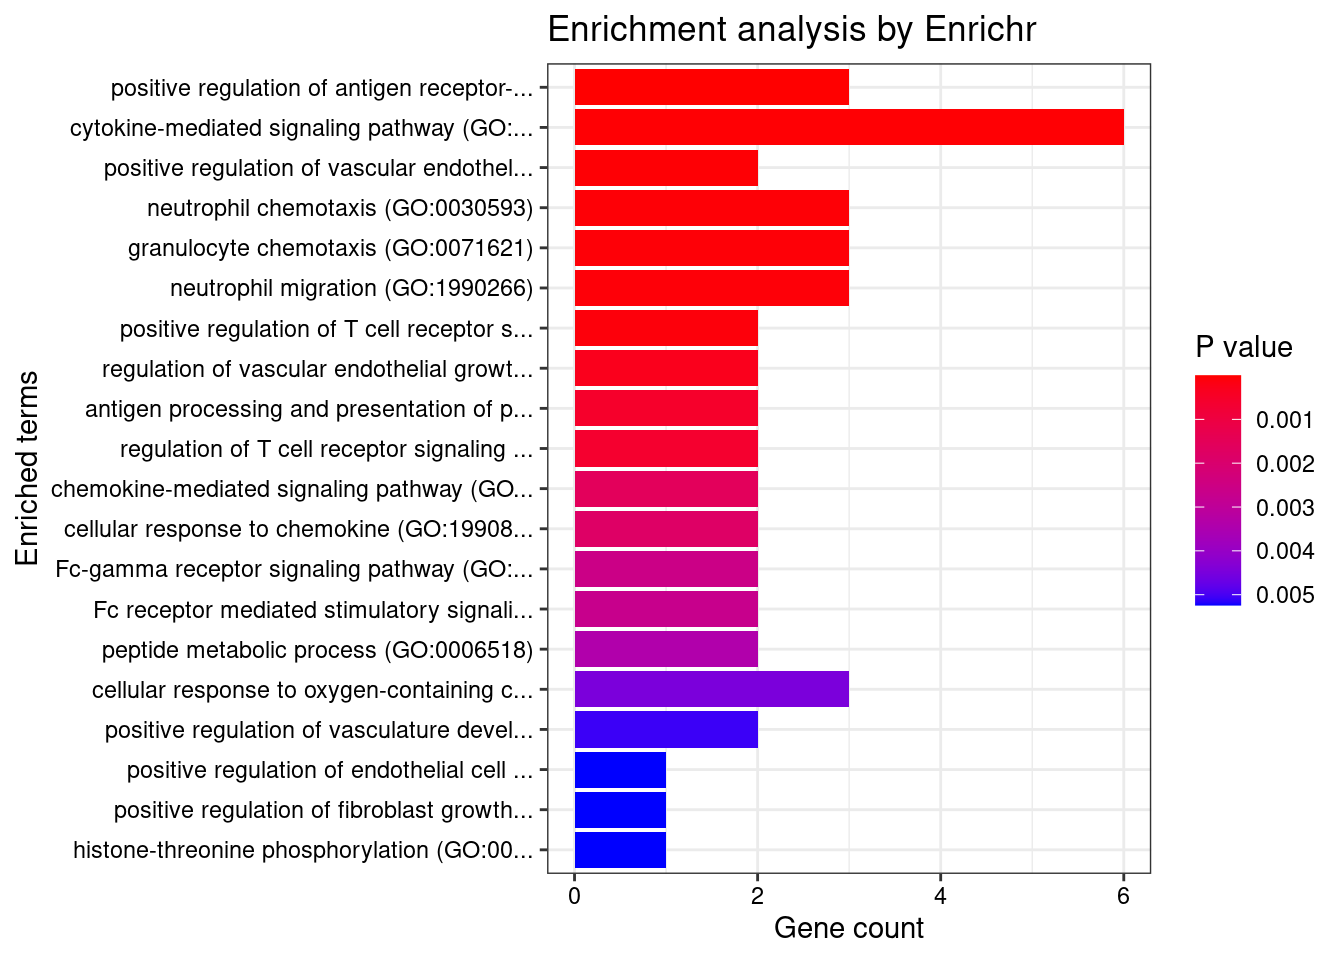
None

Number of cTWAS Genes in Tissue Group: 25

Uploading data to Enrichr... Done.
  Querying GO_Biological_Process_2021... Done.
Parsing results... Done.

GO_Biological_Process_2021

                                                                             Term Overlap Adjusted.P.value                              Genes
1                                cytokine-mediated signaling pathway (GO:0019221)   6/621       0.02103159 MUC1;CCL20;TNFSF15;IRF8;IRF5;CXCL5
2           positive regulation of T cell receptor signaling pathway (GO:0050862)    2/14       0.02103159                        RAB29;PRKD2
3 positive regulation of antigen receptor-mediated signaling pathway (GO:0050857)    2/21       0.03218339                        RAB29;PRKD2
4                              cellular response to interferon-gamma (GO:0071346)   3/121       0.03504619                    CCL20;IRF8;IRF5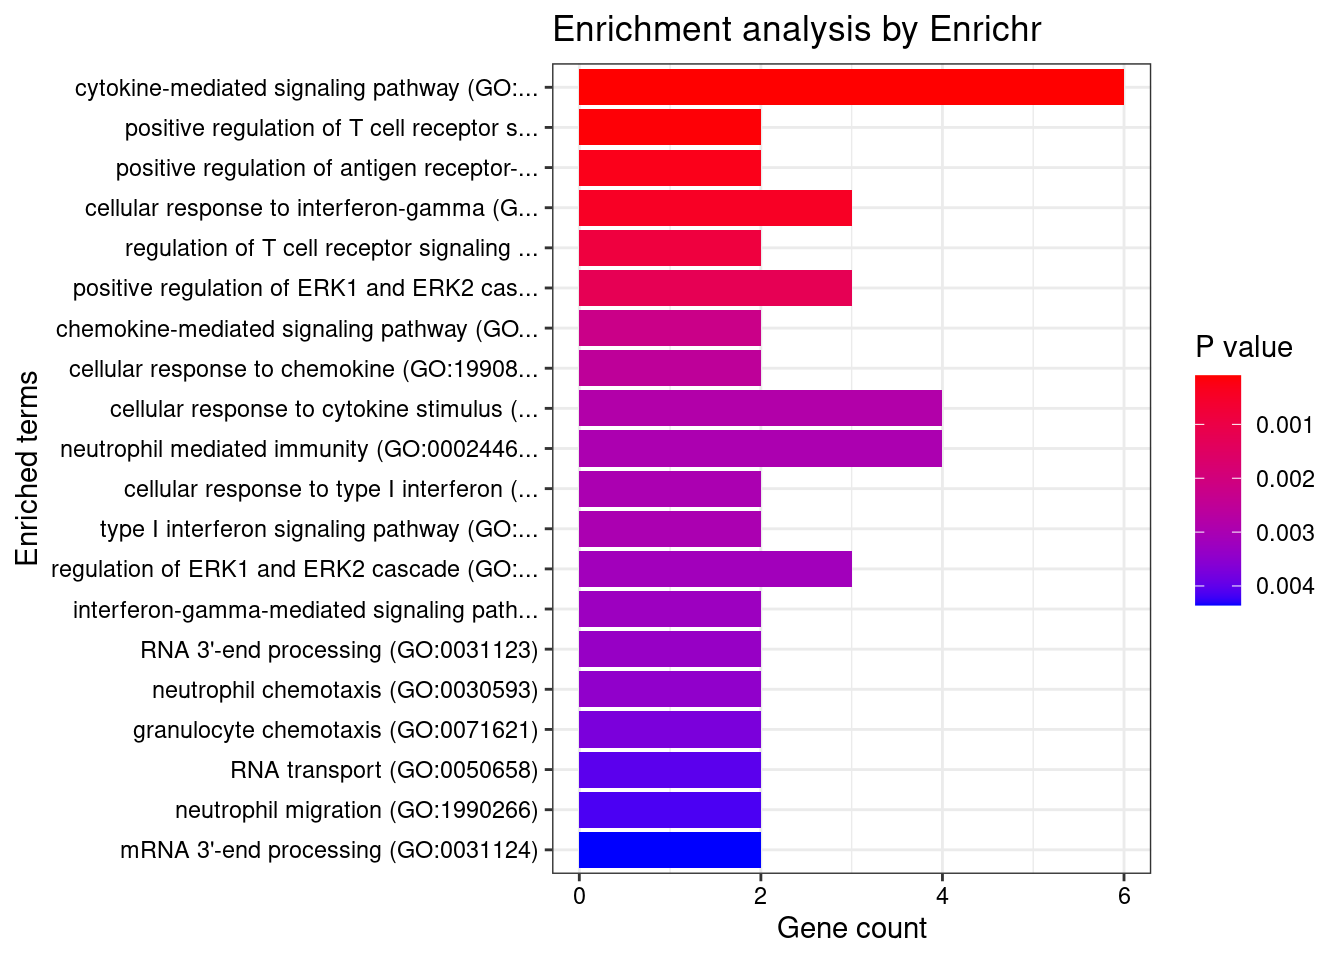
Skin

Number of cTWAS Genes in Tissue Group: 10

Uploading data to Enrichr... Done.
  Querying GO_Biological_Process_2021... Done.
Parsing results... Done.

GO_Biological_Process_2021

[1] Term             Overlap          Adjusted.P.value Genes
<0 rows> (or 0-length row.names)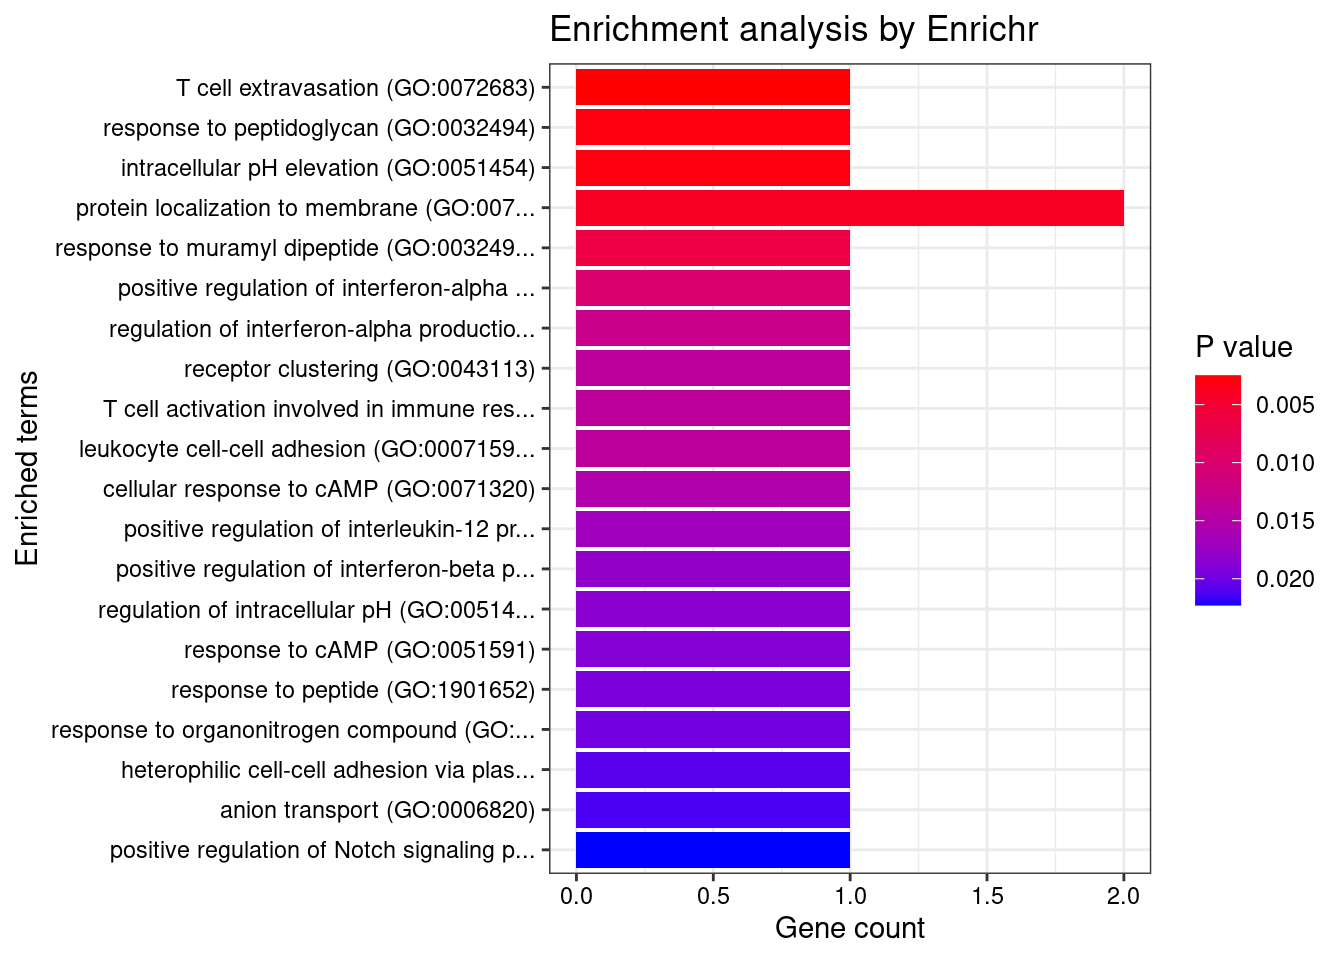
Blood or Immune
Number of cTWAS Genes in Tissue Group: 7
Uploading data to Enrichr... Done.
Querying GO_Biological_Process_2021... Done.
Parsing results... Done.
GO_Biological_Process_2021
Term Overlap Adjusted.P.value Genes
1 cellular defense response (GO:0006968) 2/49 0.008908795 LSP1;CCR5
2 cellular response to oxygen-containing compound (GO:1901701) 3/323 0.008908795 CCR5;SLC26A3;CXCL5
3 cellular response to lectin (GO:1990858) 2/115 0.013441854 MUC1;CARD9
4 cellular response to molecule of bacterial origin (GO:0071219) 2/115 0.013441854 CCR5;CXCL5
5 stimulatory C-type lectin receptor signaling pathway (GO:0002223) 2/115 0.013441854 MUC1;CARD9
6 innate immune response activating cell surface receptor signaling pathway (GO:0002220) 2/119 0.013441854 MUC1;CARD9
7 cellular response to lipopolysaccharide (GO:0071222) 2/120 0.013441854 CCR5;CXCL5
8 cytokine-mediated signaling pathway (GO:0019221) 3/621 0.015194387 MUC1;CCR5;CXCL5
9 response to lipopolysaccharide (GO:0032496) 2/159 0.016609842 CCR5;CXCL5
10 release of sequestered calcium ion into cytosol by sarcoplasmic reticulum (GO:0014808) 1/6 0.016609842 CCR5
11 intracellular pH elevation (GO:0051454) 1/6 0.016609842 SLC26A3
12 cellular response to lipid (GO:0071396) 2/219 0.016609842 CCR5;CXCL5
13 release of sequestered calcium ion into cytosol by endoplasmic reticulum (GO:1903514) 1/7 0.016609842 CCR5
14 positive regulation of histone H4 acetylation (GO:0090240) 1/7 0.016609842 MUC1
15 inflammatory response (GO:0006954) 2/230 0.016609842 CCR5;CXCL5
16 fusion of virus membrane with host plasma membrane (GO:0019064) 1/8 0.016609842 CCR5
17 myeloid leukocyte mediated immunity (GO:0002444) 1/8 0.016609842 CARD9
18 membrane fusion involved in viral entry into host cell (GO:0039663) 1/8 0.016609842 CCR5
19 regulation of histone H4 acetylation (GO:0090239) 1/9 0.016609842 MUC1
20 regulation of DNA-templated transcription in response to stress (GO:0043620) 1/9 0.016609842 MUC1
21 negative regulation of cell adhesion mediated by integrin (GO:0033629) 1/10 0.016609842 MUC1
22 negative regulation of transcription by competitive promoter binding (GO:0010944) 1/10 0.016609842 MUC1
23 DNA damage response, signal transduction by p53 class mediator resulting in transcription of p21 class mediator (GO:0006978) 1/10 0.016609842 MUC1
24 regulation of T-helper 17 type immune response (GO:2000316) 1/10 0.016609842 CARD9
25 immunoglobulin mediated immune response (GO:0016064) 1/10 0.016609842 CARD9
26 sarcoplasmic reticulum calcium ion transport (GO:0070296) 1/10 0.016609842 CCR5
27 DNA damage response, signal transduction resulting in transcription (GO:0042772) 1/11 0.016609842 MUC1
28 response to sterol (GO:0036314) 1/11 0.016609842 CCR5
29 B cell mediated immunity (GO:0019724) 1/11 0.016609842 CARD9
30 positive regulation of T-helper 17 type immune response (GO:2000318) 1/12 0.016609842 CARD9
31 positive regulation of adaptive immune response based on somatic recombination of immune receptors built from immunoglobulin superfamily domains (GO:0002824) 1/13 0.016609842 CARD9
32 negative regulation of intrinsic apoptotic signaling pathway in response to DNA damage by p53 class mediator (GO:1902166) 1/13 0.016609842 MUC1
33 homeostasis of number of cells (GO:0048872) 1/13 0.016609842 CARD9
34 antifungal innate immune response (GO:0061760) 1/13 0.016609842 CARD9
35 entry into host (GO:0044409) 1/13 0.016609842 CCR5
36 positive regulation of granulocyte macrophage colony-stimulating factor production (GO:0032725) 1/14 0.016918097 CARD9
37 regulation of intrinsic apoptotic signaling pathway in response to DNA damage by p53 class mediator (GO:1902165) 1/14 0.016918097 MUC1
38 dendritic cell chemotaxis (GO:0002407) 1/16 0.018337942 CCR5
39 regulation of granulocyte macrophage colony-stimulating factor production (GO:0032645) 1/16 0.018337942 CARD9
40 negative regulation of intrinsic apoptotic signaling pathway by p53 class mediator (GO:1902254) 1/17 0.018530847 MUC1
41 positive regulation of cytokine production involved in inflammatory response (GO:1900017) 1/17 0.018530847 CARD9
42 dendritic cell migration (GO:0036336) 1/18 0.018705497 CCR5
43 positive regulation of stress-activated protein kinase signaling cascade (GO:0070304) 1/18 0.018705497 CARD9
44 response to cholesterol (GO:0070723) 1/19 0.019293059 CCR5
45 positive regulation of histone acetylation (GO:0035066) 1/23 0.022322611 MUC1
46 positive regulation of interleukin-17 production (GO:0032740) 1/23 0.022322611 CARD9
47 defense response to fungus (GO:0050832) 1/24 0.022322611 CARD9
48 positive regulation of transcription from RNA polymerase II promoter in response to stress (GO:0036003) 1/24 0.022322611 MUC1
49 positive regulation of release of cytochrome c from mitochondria (GO:0090200) 1/25 0.022774763 BIK
50 negative regulation of intrinsic apoptotic signaling pathway in response to DNA damage (GO:1902230) 1/26 0.023208561 MUC1
51 response to alcohol (GO:0097305) 1/30 0.026238302 CCR5
52 cellular response to cAMP (GO:0071320) 1/31 0.026273346 SLC26A3
53 modulation by host of symbiont process (GO:0051851) 1/32 0.026273346 CARD9
54 cellular response to cytokine stimulus (GO:0071345) 2/482 0.026273346 MUC1;CCR5
55 regulation of interleukin-17 production (GO:0032660) 1/33 0.026273346 CARD9
56 apoptotic mitochondrial changes (GO:0008637) 1/33 0.026273346 BIK
57 regulation of cell adhesion mediated by integrin (GO:0033628) 1/34 0.026590620 MUC1
58 regulation of intracellular pH (GO:0051453) 1/37 0.028425161 SLC26A3
59 response to cAMP (GO:0051591) 1/38 0.028694306 SLC26A3
60 regulation of release of cytochrome c from mitochondria (GO:0090199) 1/41 0.029910748 BIK
61 development of primary male sexual characteristics (GO:0046546) 1/43 0.029910748 BIK
62 anion transport (GO:0006820) 1/43 0.029910748 SLC26A3
63 regulation of cytokine production involved in inflammatory response (GO:1900015) 1/43 0.029910748 CARD9
64 male gonad development (GO:0008584) 1/43 0.029910748 BIK
65 regulation of stress-activated MAPK cascade (GO:0032872) 1/49 0.033529812 CARD9
66 gonad development (GO:0008406) 1/51 0.034359315 BIK
67 DNA damage response, signal transduction by p53 class mediator resulting in cell cycle arrest (GO:0006977) 1/56 0.036590811 MUC1
68 chemokine-mediated signaling pathway (GO:0070098) 1/56 0.036590811 CXCL5
69 positive regulation of mitochondrion organization (GO:0010822) 1/58 0.037337196 BIK
70 cellular response to chemokine (GO:1990869) 1/60 0.038061498 CXCL5
71 O-glycan processing (GO:0016266) 1/61 0.038145129 MUC1
72 positive regulation of cysteine-type endopeptidase activity (GO:2001056) 1/62 0.038226254 CARD9
73 antimicrobial humoral immune response mediated by antimicrobial peptide (GO:0061844) 1/64 0.038907160 CXCL5
74 mitotic G1 DNA damage checkpoint signaling (GO:0031571) 1/65 0.038975258 MUC1
75 cell chemotaxis (GO:0060326) 1/69 0.040797632 CCR5
76 neutrophil chemotaxis (GO:0030593) 1/70 0.040838193 CXCL5
77 granulocyte chemotaxis (GO:0071621) 1/73 0.040952713 CXCL5
78 negative regulation of cell adhesion (GO:0007162) 1/73 0.040952713 MUC1
79 positive regulation of JNK cascade (GO:0046330) 1/73 0.040952713 CARD9
80 DNA damage response, signal transduction by p53 class mediator (GO:0030330) 1/74 0.040988647 MUC1
81 positive regulation of interleukin-6 production (GO:0032755) 1/76 0.041564285 CARD9
82 neutrophil migration (GO:1990266) 1/77 0.041591403 CXCL5
83 regulation of transcription from RNA polymerase II promoter in response to stress (GO:0043618) 1/87 0.045730332 MUC1
84 metal ion transport (GO:0030001) 1/88 0.045730332 CCR5
85 regulation of cysteine-type endopeptidase activity involved in apoptotic process (GO:0043281) 1/89 0.045730332 CARD9
86 second-messenger-mediated signaling (GO:0019932) 1/89 0.045730332 CCR5
87 protein complex oligomerization (GO:0051259) 1/90 0.045730332 CARD9
88 positive regulation of cellular component biogenesis (GO:0044089) 1/92 0.046201511 BIK
89 positive regulation of stress-activated MAPK cascade (GO:0032874) 1/99 0.049106724 CARD9
90 protein O-linked glycosylation (GO:0006493) 1/102 0.049395235 MUC1
91 calcium-mediated signaling (GO:0019722) 1/102 0.049395235 CCR5
92 cellular response to organonitrogen compound (GO:0071417) 1/103 0.049395235 SLC26A3
93 regulation of JNK cascade (GO:0046328) 1/105 0.049798006 CARD9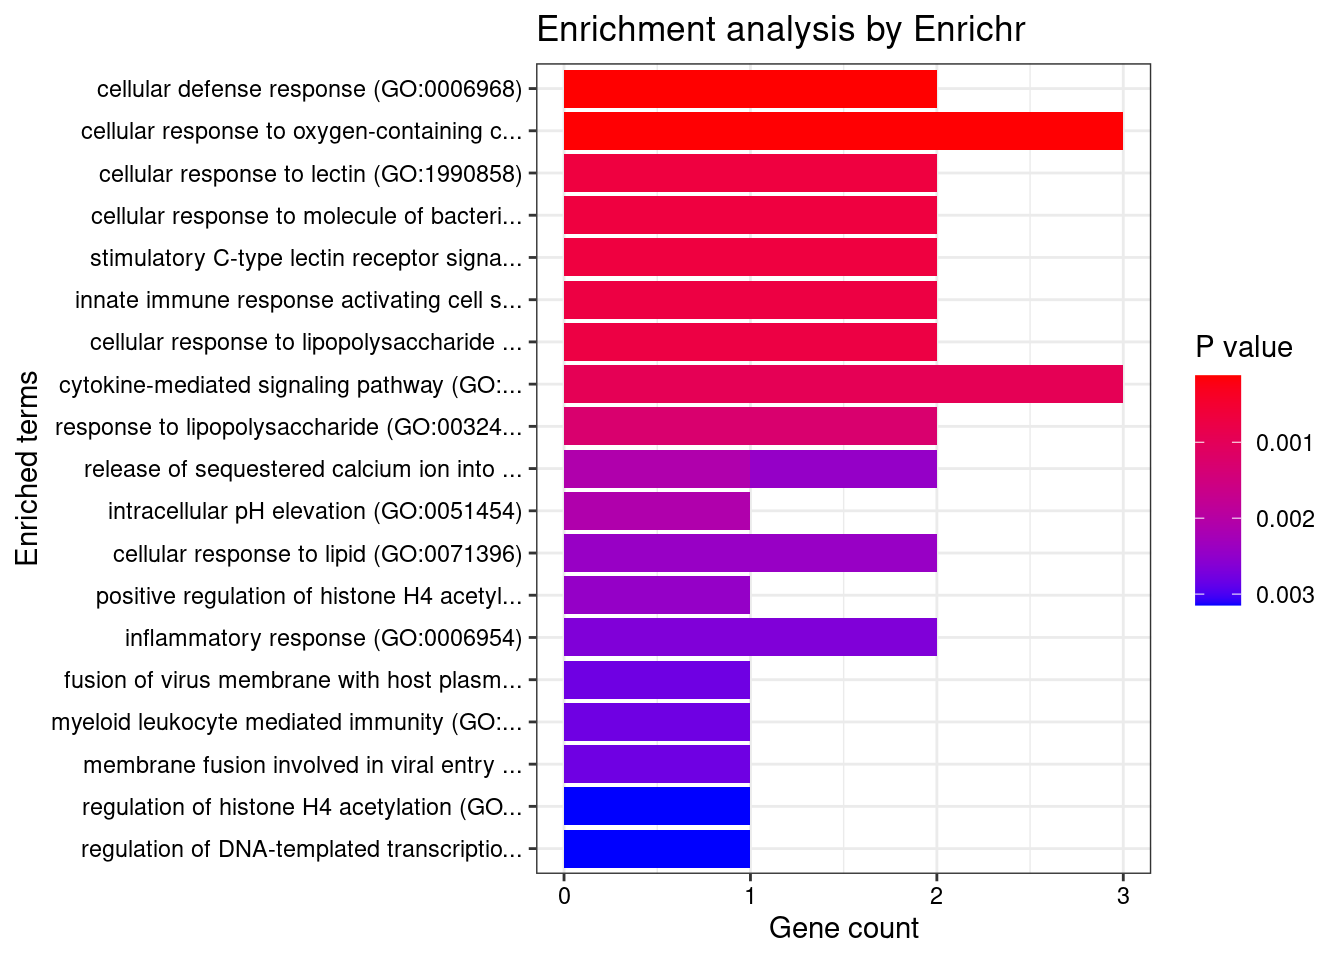
Digestive
Number of cTWAS Genes in Tissue Group: 21
Uploading data to Enrichr... Done.
Querying GO_Biological_Process_2021... Done.
Parsing results... Done.
GO_Biological_Process_2021
Term Overlap Adjusted.P.value Genes
1 positive regulation of antigen receptor-mediated signaling pathway (GO:0050857) 3/21 0.0003905969 PRKCB;RAB29;PRKD2
2 positive regulation of vascular endothelial growth factor receptor signaling pathway (GO:0030949) 2/10 0.0070046771 PRKCB;PRKD2
3 positive regulation of T cell receptor signaling pathway (GO:0050862) 2/14 0.0094195091 RAB29;PRKD2
4 cellular response to interferon-gamma (GO:0071346) 3/121 0.0170334005 CCL20;IRF8;IRF5
5 regulation of vascular endothelial growth factor receptor signaling pathway (GO:0030947) 2/24 0.0170334005 PRKCB;PRKD2
6 positive regulation of NF-kappaB transcription factor activity (GO:0051092) 3/155 0.0260471493 PRKCB;CARD9;PRKD2
7 regulation of T cell receptor signaling pathway (GO:0050856) 2/35 0.0260471493 RAB29;PRKD2
8 positive regulation of ERK1 and ERK2 cascade (GO:0070374) 3/172 0.0276294859 CCL20;CARD9;PRKD2
9 neutrophil mediated immunity (GO:0002446) 4/488 0.0390885472 FCGR2A;HSPA6;CARD9;ITGAL
10 chemokine-mediated signaling pathway (GO:0070098) 2/56 0.0390885472 CCL20;CXCL5
11 inflammatory response (GO:0006954) 3/230 0.0390885472 CCL20;ITGAL;CXCL5
12 cellular response to chemokine (GO:1990869) 2/60 0.0390885472 CCL20;CXCL5
13 regulation of ERK1 and ERK2 cascade (GO:0070372) 3/238 0.0390885472 CCL20;CARD9;PRKD2
14 positive regulation of DNA-binding transcription factor activity (GO:0051091) 3/246 0.0390885472 PRKCB;CARD9;PRKD2
15 cellular response to type I interferon (GO:0071357) 2/65 0.0390885472 IRF8;IRF5
16 type I interferon signaling pathway (GO:0060337) 2/65 0.0390885472 IRF8;IRF5
17 interferon-gamma-mediated signaling pathway (GO:0060333) 2/68 0.0402141708 IRF8;IRF5
18 neutrophil chemotaxis (GO:0030593) 2/70 0.0402141708 CCL20;CXCL5
19 granulocyte chemotaxis (GO:0071621) 2/73 0.0413793211 CCL20;CXCL5
20 positive regulation of MAPK cascade (GO:0043410) 3/274 0.0415785745 CCL20;CARD9;PRKD2
21 neutrophil migration (GO:1990266) 2/77 0.0415785745 CCL20;CXCL5
22 response to interferon-gamma (GO:0034341) 2/80 0.0427815297 CCL20;IRF8
23 cytokine-mediated signaling pathway (GO:0019221) 4/621 0.0462385726 CCL20;IRF8;IRF5;CXCL5
24 regulation of type I interferon production (GO:0032479) 2/89 0.0462385726 IRF8;IRF5
25 positive regulation of cytokine production (GO:0001819) 3/335 0.0462385726 CARD9;PRKD2;IRF5
26 positive regulation of vasculature development (GO:1904018) 2/102 0.0462385726 PRKCB;PRKD2
27 T cell extravasation (GO:0072683) 1/5 0.0462385726 ITGAL
28 positive regulation of endothelial cell chemotaxis by VEGF-activated vascular endothelial growth factor receptor signaling pathway (GO:0038033) 1/5 0.0462385726 PRKD2
29 positive regulation of fibroblast growth factor receptor signaling pathway (GO:0045743) 1/5 0.0462385726 PRKD2
30 oocyte development (GO:0048599) 1/5 0.0462385726 ZGLP1
31 histone-threonine phosphorylation (GO:0035405) 1/5 0.0462385726 PRKCB
32 positive regulation of deacetylase activity (GO:0090045) 1/6 0.0462385726 PRKD2
33 regulation of transmission of nerve impulse (GO:0051969) 1/6 0.0462385726 TYMP
34 heat acclimation (GO:0010286) 1/6 0.0462385726 HSPA6
35 response to peptidoglycan (GO:0032494) 1/6 0.0462385726 IRF5
36 morphogenesis of an endothelium (GO:0003159) 1/6 0.0462385726 PRKD2
37 regulation of digestive system process (GO:0044058) 1/6 0.0462385726 TYMP
38 cellular heat acclimation (GO:0070370) 1/6 0.0462385726 HSPA6
39 protein K29-linked ubiquitination (GO:0035519) 1/6 0.0462385726 RNF186
40 intracellular pH elevation (GO:0051454) 1/6 0.0462385726 SLC26A3
41 positive regulation of angiogenesis (GO:0045766) 2/116 0.0462385726 PRKCB;PRKD2
42 sphingolipid metabolic process (GO:0006665) 2/116 0.0462385726 CERKL;PRKD2
43 positive regulation of B cell receptor signaling pathway (GO:0050861) 1/7 0.0485269708 PRKCB
44 regulation of histone deacetylase activity (GO:1901725) 1/7 0.0485269708 PRKD2
45 protein localization to ciliary membrane (GO:1903441) 1/7 0.0485269708 RAB29
46 phosphorylation (GO:0016310) 3/400 0.0492520453 CERKL;PRKCB;PRKD2
47 positive regulation of cell migration by vascular endothelial growth factor signaling pathway (GO:0038089) 1/8 0.0492520453 PRKD2
48 myeloid leukocyte mediated immunity (GO:0002444) 1/8 0.0492520453 CARD9
49 negative regulation of transmembrane transport (GO:0034763) 1/10 0.0492520453 PRKCB
50 lipoprotein transport (GO:0042953) 1/10 0.0492520453 PRKCB
51 regulation of T-helper 17 type immune response (GO:2000316) 1/10 0.0492520453 CARD9
52 positive regulation of receptor recycling (GO:0001921) 1/10 0.0492520453 RAB29
53 toxin transport (GO:1901998) 1/10 0.0492520453 RAB29
54 nucleoside metabolic process (GO:0009116) 1/10 0.0492520453 TYMP
55 immunoglobulin mediated immune response (GO:0016064) 1/10 0.0492520453 CARD9
56 endothelial tube morphogenesis (GO:0061154) 1/10 0.0492520453 PRKD2
57 regulation of cytokine production (GO:0001817) 2/150 0.0492520453 CARD9;IRF8
58 lipoprotein localization (GO:0044872) 1/11 0.0492520453 PRKCB
59 pyrimidine nucleoside catabolic process (GO:0046135) 1/11 0.0492520453 TYMP
60 pyrimidine nucleoside salvage (GO:0043097) 1/11 0.0492520453 TYMP
61 pyrimidine-containing compound salvage (GO:0008655) 1/11 0.0492520453 TYMP
62 B cell mediated immunity (GO:0019724) 1/11 0.0492520453 CARD9
63 peptidyl-serine phosphorylation (GO:0018105) 2/156 0.0492520453 PRKCB;PRKD2
64 regulation of hemopoiesis (GO:1903706) 1/12 0.0492520453 PRKCB
65 pyrimidine-containing compound metabolic process (GO:0072527) 1/12 0.0492520453 TYMP
66 negative regulation of glucose transmembrane transport (GO:0010829) 1/12 0.0492520453 PRKCB
67 nucleoside catabolic process (GO:0009164) 1/12 0.0492520453 TYMP
68 nucleoside salvage (GO:0043174) 1/12 0.0492520453 TYMP
69 positive regulation of T-helper 17 type immune response (GO:2000318) 1/12 0.0492520453 CARD9
70 mitochondrial genome maintenance (GO:0000002) 1/12 0.0492520453 TYMP
71 mitotic nuclear membrane disassembly (GO:0007077) 1/12 0.0492520453 PRKCB
72 neutrophil degranulation (GO:0043312) 3/481 0.0492520453 FCGR2A;HSPA6;ITGAL
73 cellular response to cytokine stimulus (GO:0071345) 3/482 0.0492520453 CCL20;IRF8;IRF5
74 peptidyl-serine modification (GO:0018209) 2/169 0.0492520453 PRKCB;PRKD2
75 positive regulation of adaptive immune response based on somatic recombination of immune receptors built from immunoglobulin superfamily domains (GO:0002824) 1/13 0.0492520453 CARD9
76 antifungal innate immune response (GO:0061760) 1/13 0.0492520453 CARD9
77 positive regulation of histone deacetylation (GO:0031065) 1/13 0.0492520453 PRKD2
78 response to muramyl dipeptide (GO:0032495) 1/13 0.0492520453 IRF5
79 homeostasis of number of cells (GO:0048872) 1/13 0.0492520453 CARD9
80 protein localization to mitochondrion (GO:0070585) 1/13 0.0492520453 RNF186
81 positive regulation of transcription by RNA polymerase II (GO:0045944) 4/908 0.0492520453 ZGLP1;IRF8;PRKD2;IRF5
82 neutrophil activation involved in immune response (GO:0002283) 3/485 0.0492520453 FCGR2A;HSPA6;ITGAL
83 positive regulation of I-kappaB kinase/NF-kappaB signaling (GO:0043123) 2/171 0.0492520453 PRKCB;CARD9
84 mitochondrion organization (GO:0007005) 2/175 0.0494567559 RAB29;TYMP
85 pyrimidine nucleoside biosynthetic process (GO:0046134) 1/14 0.0494567559 TYMP
86 nuclear membrane disassembly (GO:0051081) 1/14 0.0494567559 PRKCB
87 positive regulation of granulocyte macrophage colony-stimulating factor production (GO:0032725) 1/14 0.0494567559 CARD9
88 positive regulation of lymphocyte migration (GO:2000403) 1/14 0.0494567559 CCL20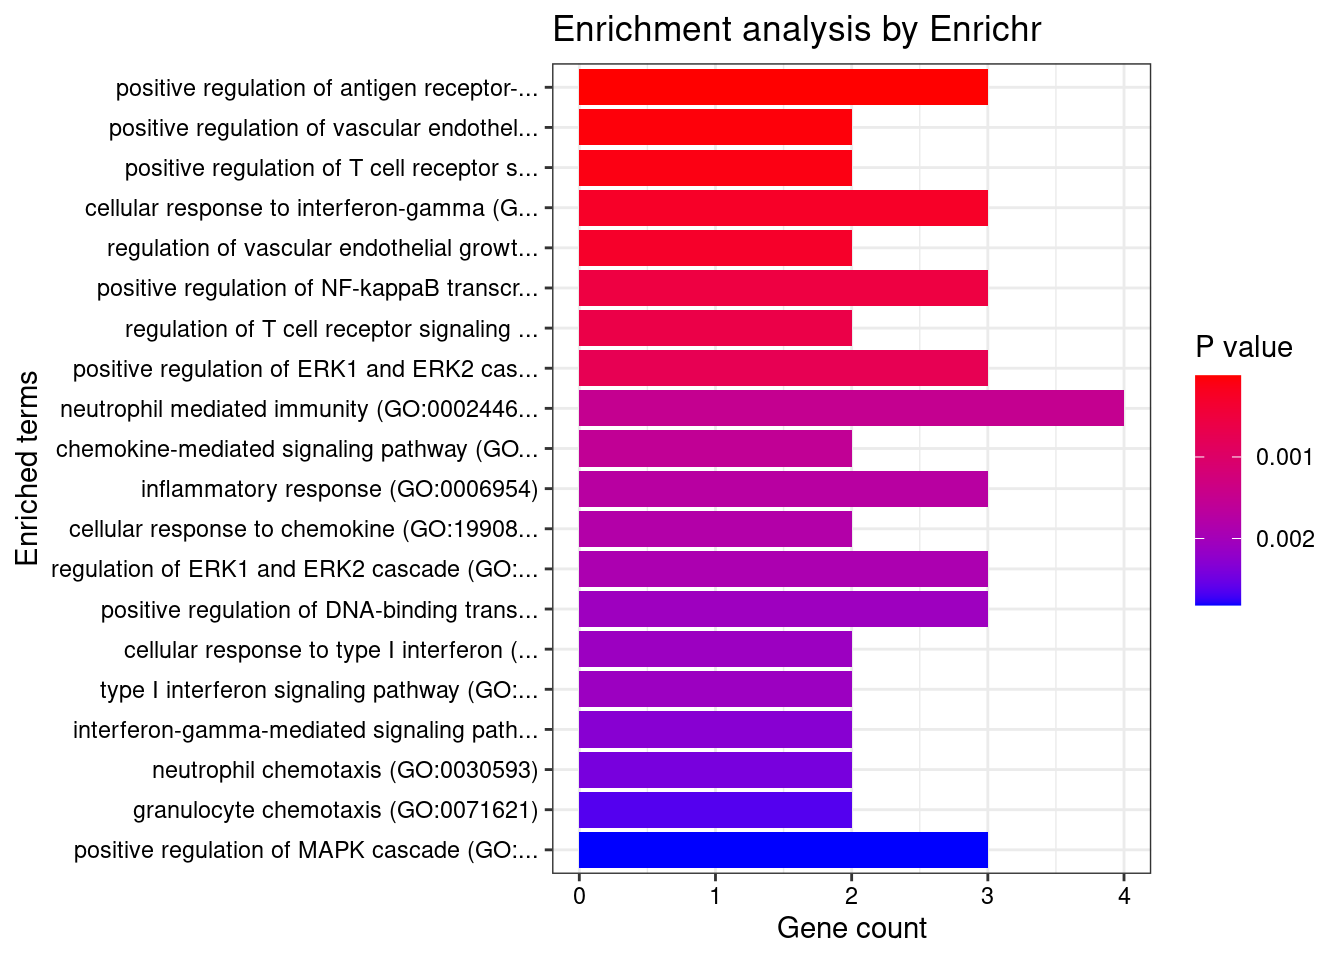
if (exists("group_enrichment_results")){
  save(group_enrichment_results, file="group_enrichment_results.RData")
}
KEGG
for (group in names(df_group)){
  cat(paste0(group, "\n\n"))

  ctwas_genes_group <- df_group[[group]]$ctwas
  background_group <- df_group[[group]]$background

  cat(paste0("Number of cTWAS Genes in Tissue Group: ", length(ctwas_genes_group), "\n\n"))

  databases <- c("pathway_KEGG")

  enrichResult <- WebGestaltR(enrichMethod="ORA", organism="hsapiens",
                              interestGene=ctwas_genes_group, referenceGene=background_group,
                              enrichDatabase=databases, interestGeneType="genesymbol",
                              referenceGeneType="genesymbol", isOutput=F)

  if (!is.null(enrichResult)){
    print(enrichResult[,c("description", "size", "overlap", "FDR", "userId")])
  }

  cat("\n")
}
Adipose
Number of cTWAS Genes in Tissue Group: 8
Loading the functional categories...
Loading the ID list...
Loading the reference list...
Performing the enrichment analysis...Warning in oraEnrichment(interestGeneList, referenceGeneList, geneSet, minNum = minNum, : No significant gene set is identified based on FDR 0.05!
Endocrine

Number of cTWAS Genes in Tissue Group: 14

Loading the functional categories...
Loading the ID list...
Loading the reference list...
Performing the enrichment analysis...
Warning in oraEnrichment(interestGeneList, referenceGeneList, geneSet, minNum = minNum, : No significant gene set is identified based on FDR 0.05!
Cardiovascular

Number of cTWAS Genes in Tissue Group: 9

Loading the functional categories...
Loading the ID list...
Loading the reference list...
Performing the enrichment analysis...
Warning in oraEnrichment(interestGeneList, referenceGeneList, geneSet, minNum = minNum, : No significant gene set is identified based on FDR 0.05!
CNS

Number of cTWAS Genes in Tissue Group: 21

Loading the functional categories...
Loading the ID list...
Loading the reference list...
Performing the enrichment analysis...
Warning in oraEnrichment(interestGeneList, referenceGeneList, geneSet, minNum = minNum, : No significant gene set is identified based on FDR 0.05!
None

Number of cTWAS Genes in Tissue Group: 25

Loading the functional categories...
Loading the ID list...
Loading the reference list...
Performing the enrichment analysis...
Warning in oraEnrichment(interestGeneList, referenceGeneList, geneSet, minNum = minNum, : No significant gene set is identified based on FDR 0.05!
Skin

Number of cTWAS Genes in Tissue Group: 10

Loading the functional categories...
Loading the ID list...
Loading the reference list...
Performing the enrichment analysis...
Warning in oraEnrichment(interestGeneList, referenceGeneList, geneSet, minNum = minNum, : No significant gene set is identified based on FDR 0.05!
Blood or Immune

Number of cTWAS Genes in Tissue Group: 7

Loading the functional categories...
Loading the ID list...
Loading the reference list...
Performing the enrichment analysis...
Warning in oraEnrichment(interestGeneList, referenceGeneList, geneSet, minNum = minNum, : No significant gene set is identified based on FDR 0.05!
Digestive

Number of cTWAS Genes in Tissue Group: 21

Loading the functional categories...
Loading the ID list...
Loading the reference list...
Performing the enrichment analysis...
Warning in oraEnrichment(interestGeneList, referenceGeneList, geneSet, minNum = minNum, : No significant gene set is identified based on FDR 0.05!DisGeNET
for (group in names(df_group)){
  cat(paste0(group, "\n\n"))

  ctwas_genes_group <- df_group[[group]]$ctwas

  cat(paste0("Number of cTWAS Genes in Tissue Group: ", length(ctwas_genes_group), "\n\n"))

  res_enrich <- disease_enrichment(entities=ctwas_genes_group, vocabulary = "HGNC", database = "CURATED")

  if (any(res_enrich@qresult$FDR < 0.05)){
    print(res_enrich@qresult[res_enrich@qresult$FDR < 0.05, c("Description", "FDR", "Ratio",  "BgRatio")])
  }

  cat("\n")
}
Adipose
Number of cTWAS Genes in Tissue Group: 8SDCCAG3 gene(s) from the input list not found in DisGeNET CURATEDRP11-973H7.1 gene(s) from the input list not found in DisGeNET CURATED Description FDR Ratio BgRatio
3 Anovulation 0.01071944 1/6 1/9703
10 Ulcerative Colitis 0.01071944 2/6 63/9703
44 Deep seated dermatophytosis 0.01071944 1/6 1/9703
46 Candidiasis, Familial, 2 0.01607502 1/6 2/9703
Endocrine
Number of cTWAS Genes in Tissue Group: 14RP11-973H7.1 gene(s) from the input list not found in DisGeNET CURATED Description FDR Ratio BgRatio
13 Ulcerative Colitis 1.288450e-08 6/13 63/9703
23 Enteritis 1.671201e-02 1/13 1/9703
32 Inflammatory Bowel Diseases 1.671201e-02 2/13 35/9703
63 Ureteral obstruction 1.671201e-02 2/13 24/9703
72 Crohn's disease of large bowel 1.671201e-02 2/13 44/9703
78 Crohn's disease of the ileum 1.671201e-02 2/13 44/9703
96 Regional enteritis 1.671201e-02 2/13 44/9703
101 IIeocolitis 1.671201e-02 2/13 44/9703
106 Deep seated dermatophytosis 1.671201e-02 1/13 1/9703
117 Medullary cystic kidney disease 1 1.671201e-02 1/13 1/9703
118 SPINOCEREBELLAR ATAXIA, AUTOSOMAL RECESSIVE 9 1.671201e-02 1/13 1/9703
120 LOEYS-DIETZ SYNDROME 3 1.671201e-02 1/13 1/9703
17 Crohn Disease 1.771036e-02 2/13 50/9703
52 Pneumonia 1.771036e-02 2/13 54/9703
53 Lobar Pneumonia 1.771036e-02 2/13 54/9703
100 Experimental Lung Inflammation 1.771036e-02 2/13 54/9703
123 Pneumonitis 1.771036e-02 2/13 54/9703
116 Candidiasis, Familial, 2 1.964015e-02 1/13 2/9703
30 Hypersensitivity 2.104823e-02 2/13 64/9703
108 Allergic Reaction 2.104823e-02 2/13 63/9703
43 Meniere Disease 2.304157e-02 1/13 3/9703
114 COENZYME Q10 DEFICIENCY 2.304157e-02 1/13 3/9703
122 COENZYME Q10 DEFICIENCY, PRIMARY, 1 2.304157e-02 1/13 3/9703
2 Aneurysm, Dissecting 2.845704e-02 1/13 5/9703
45 Mucocutaneous Lymph Node Syndrome 2.845704e-02 1/13 4/9703
48 Degenerative polyarthritis 2.845704e-02 2/13 93/9703
67 Osteoarthrosis Deformans 2.845704e-02 2/13 93/9703
84 Dissection of aorta 2.845704e-02 1/13 5/9703
113 Loeys-Dietz Aortic Aneurysm Syndrome 2.845704e-02 1/13 5/9703
126 Dissection, Blood Vessel 2.845704e-02 1/13 5/9703
127 Loeys-Dietz Syndrome, Type 1a 2.845704e-02 1/13 5/9703
33 Fibroid Tumor 3.306086e-02 1/13 6/9703
3 Aortic Aneurysm 3.524313e-02 1/13 7/9703
64 Uterine Fibroids 3.524313e-02 1/13 7/9703
119 Loeys-Dietz Syndrome 3.524313e-02 1/13 7/9703
65 Uterine Neoplasms 4.168372e-02 1/13 9/9703
90 Pulmonary Cystic Fibrosis 4.168372e-02 1/13 9/9703
110 Fibrocystic Disease of Pancreas 4.168372e-02 1/13 9/9703
51 Peritoneal Neoplasms 4.289980e-02 1/13 10/9703
71 Uterine Cancer 4.289980e-02 1/13 10/9703
88 Carcinomatosis of peritoneal cavity 4.289980e-02 1/13 10/9703
18 Cystic Fibrosis 4.496711e-02 1/13 11/9703
57 Ankylosing spondylitis 4.496711e-02 1/13 11/9703
Cardiovascular
Number of cTWAS Genes in Tissue Group: 9LST1 gene(s) from the input list not found in DisGeNET CURATEDLINC02009 gene(s) from the input list not found in DisGeNET CURATEDRAB29 gene(s) from the input list not found in DisGeNET CURATEDRP11-973H7.1 gene(s) from the input list not found in DisGeNET CURATED Description FDR Ratio BgRatio
2 Behcet Syndrome 0.001927051 2/5 24/9703
6 Ulcerative Colitis 0.005668934 2/5 63/9703
32 Inflammatory Bowel Disease 14 0.005668934 1/5 1/9703
20 CREST Syndrome 0.014562239 1/5 6/9703
26 Scleroderma, Limited 0.014562239 1/5 6/9703
29 Diffuse Scleroderma 0.014562239 1/5 5/9703
31 clinical depression 0.014562239 1/5 6/9703
18 Ankylosing spondylitis 0.023336188 1/5 11/9703
17 Systemic Scleroderma 0.035770248 1/5 19/9703
7 Heart valve disease 0.043990348 1/5 26/9703
4 Calcinosis 0.046422372 1/5 42/9703
5 Primary biliary cirrhosis 0.046422372 1/5 47/9703
9 Inflammatory Bowel Diseases 0.046422372 1/5 35/9703
10 Chronic Lymphocytic Leukemia 0.046422372 1/5 55/9703
11 Acute Promyelocytic Leukemia 0.046422372 1/5 46/9703
14 Pustulosis of Palms and Soles 0.046422372 1/5 57/9703
16 Psoriasis 0.046422372 1/5 57/9703
21 Libman-Sacks Disease 0.046422372 1/5 58/9703
22 Tumoral calcinosis 0.046422372 1/5 42/9703
23 Gastric Adenocarcinoma 0.046422372 1/5 45/9703
24 Microcalcification 0.046422372 1/5 42/9703
CNS
Number of cTWAS Genes in Tissue Group: 21CASC3 gene(s) from the input list not found in DisGeNET CURATEDRP11-973H7.1 gene(s) from the input list not found in DisGeNET CURATEDAPEH gene(s) from the input list not found in DisGeNET CURATEDAP006621.5 gene(s) from the input list not found in DisGeNET CURATEDRAB29 gene(s) from the input list not found in DisGeNET CURATEDC1orf74 gene(s) from the input list not found in DisGeNET CURATEDLINC01126 gene(s) from the input list not found in DisGeNET CURATEDTTPAL gene(s) from the input list not found in DisGeNET CURATEDTNFRSF6B gene(s) from the input list not found in DisGeNET CURATEDLINC02009 gene(s) from the input list not found in DisGeNET CURATED Description FDR Ratio BgRatio
9 Ulcerative Colitis 0.0000494912 4/11 63/9703
41 Pneumonia 0.0222148111 2/11 54/9703
42 Lobar Pneumonia 0.0222148111 2/11 54/9703
61 Congenital chloride diarrhea 0.0222148111 1/11 1/9703
79 Experimental Lung Inflammation 0.0222148111 2/11 54/9703
92 Medullary cystic kidney disease 1 0.0222148111 1/11 1/9703
93 Pneumonitis 0.0222148111 2/11 54/9703
24 Hypersensitivity 0.0241914390 2/11 64/9703
86 Allergic Reaction 0.0241914390 2/11 63/9703
33 Meniere Disease 0.0326194122 1/11 3/9703
35 Mucocutaneous Lymph Node Syndrome 0.0395183069 1/11 4/9703
None
Number of cTWAS Genes in Tissue Group: 25ZNF736 gene(s) from the input list not found in DisGeNET CURATEDRAB29 gene(s) from the input list not found in DisGeNET CURATEDAPEH gene(s) from the input list not found in DisGeNET CURATEDRP11-973H7.1 gene(s) from the input list not found in DisGeNET CURATEDZGPAT gene(s) from the input list not found in DisGeNET CURATEDNXPE1 gene(s) from the input list not found in DisGeNET CURATEDC1orf74 gene(s) from the input list not found in DisGeNET CURATEDDDX39B gene(s) from the input list not found in DisGeNET CURATEDRP11-107M16.2 gene(s) from the input list not found in DisGeNET CURATEDCASC3 gene(s) from the input list not found in DisGeNET CURATEDOAZ3 gene(s) from the input list not found in DisGeNET CURATED Description FDR Ratio BgRatio
10 Ulcerative Colitis 1.171910e-10 7/14 63/9703
15 Enteritis 1.471861e-02 1/14 1/9703
22 Inflammatory Bowel Diseases 1.471861e-02 2/14 35/9703
41 Systemic Scleroderma 1.471861e-02 2/14 19/9703
61 Congenital chloride diarrhea 1.471861e-02 1/14 1/9703
82 Deep seated dermatophytosis 1.471861e-02 1/14 1/9703
89 Medullary cystic kidney disease 1 1.471861e-02 1/14 1/9703
91 Inflammatory Bowel Disease 14 1.471861e-02 1/14 1/9703
96 IMMUNODEFICIENCY 32A 1.471861e-02 1/14 1/9703
98 IMMUNODEFICIENCY 32B 1.471861e-02 1/14 1/9703
2 Rheumatoid Arthritis 1.655428e-02 3/14 174/9703
9 Primary biliary cirrhosis 1.690365e-02 2/14 47/9703
37 Pneumonia 1.690365e-02 2/14 54/9703
38 Lobar Pneumonia 1.690365e-02 2/14 54/9703
78 Experimental Lung Inflammation 1.690365e-02 2/14 54/9703
94 Pneumonitis 1.690365e-02 2/14 54/9703
59 Libman-Sacks Disease 1.729935e-02 2/14 58/9703
88 Candidiasis, Familial, 2 1.729935e-02 1/14 2/9703
20 Hypersensitivity 1.889484e-02 2/14 64/9703
84 Allergic Reaction 1.889484e-02 2/14 63/9703
26 Lupus Erythematosus, Systemic 2.205392e-02 2/14 71/9703
30 Mucocutaneous Lymph Node Syndrome 2.670737e-02 1/14 4/9703
81 Diffuse Scleroderma 3.191134e-02 1/14 5/9703
57 CREST Syndrome 3.520653e-02 1/14 6/9703
74 Scleroderma, Limited 3.520653e-02 1/14 6/9703
71 Pulmonary Cystic Fibrosis 4.879982e-02 1/14 9/9703
86 Fibrocystic Disease of Pancreas 4.879982e-02 1/14 9/9703
Skin
Number of cTWAS Genes in Tissue Group: 10HLA-DOB gene(s) from the input list not found in DisGeNET CURATEDTSPAN14 gene(s) from the input list not found in DisGeNET CURATEDC1orf106 gene(s) from the input list not found in DisGeNET CURATEDTNFRSF6B gene(s) from the input list not found in DisGeNET CURATEDC1orf74 gene(s) from the input list not found in DisGeNET CURATEDIPO8 gene(s) from the input list not found in DisGeNET CURATEDLINC01126 gene(s) from the input list not found in DisGeNET CURATED Description FDR Ratio BgRatio
4 Ulcerative Colitis 0.001649145 2/3 63/9703
12 Congenital chloride diarrhea 0.001649145 1/3 1/9703
16 Inflammatory Bowel Disease 14 0.001649145 1/3 1/9703
10 CREST Syndrome 0.004238472 1/3 6/9703
13 Scleroderma, Limited 0.004238472 1/3 6/9703
14 Diffuse Scleroderma 0.004238472 1/3 5/9703
15 clinical depression 0.004238472 1/3 6/9703
9 Systemic Scleroderma 0.011728365 1/3 19/9703
2 Behcet Syndrome 0.013161900 1/3 24/9703
5 Inflammatory Bowel Diseases 0.017255397 1/3 35/9703
3 Primary biliary cirrhosis 0.019285706 1/3 47/9703
6 Acute Promyelocytic Leukemia 0.019285706 1/3 46/9703
11 Libman-Sacks Disease 0.021943720 1/3 58/9703
8 Lupus Erythematosus, Systemic 0.024909938 1/3 71/9703
Blood or Immune
Number of cTWAS Genes in Tissue Group: 7BIK gene(s) from the input list not found in DisGeNET CURATED Description FDR Ratio BgRatio
4 Ulcerative Colitis 0.0002472257 3/6 63/9703
23 West Nile Fever 0.0029684601 1/6 1/9703
26 Congenital chloride diarrhea 0.0029684601 1/6 1/9703
32 Encephalitis, West Nile Fever 0.0029684601 1/6 1/9703
33 West Nile Fever Meningitis 0.0029684601 1/6 1/9703
34 West Nile Fever Meningoencephalitis 0.0029684601 1/6 1/9703
35 West Nile Fever Myelitis 0.0029684601 1/6 1/9703
38 Deep seated dermatophytosis 0.0029684601 1/6 1/9703
44 Medullary cystic kidney disease 1 0.0029684601 1/6 1/9703
46 DIABETES MELLITUS, INSULIN-DEPENDENT, 22 (disorder) 0.0029684601 1/6 1/9703
43 Candidiasis, Familial, 2 0.0053958093 1/6 2/9703
15 Nephritis 0.0211541627 1/6 9/9703
16 Peritoneal Neoplasms 0.0211541627 1/6 10/9703
29 Carcinomatosis of peritoneal cavity 0.0211541627 1/6 10/9703
21 Ankylosing spondylitis 0.0217126777 1/6 11/9703
8 Hepatitis C 0.0277290881 1/6 15/9703
7 Heart valve disease 0.0451084459 1/6 26/9703
2 Calcinosis 0.0474481678 1/6 42/9703
5 Dermatitis, Atopic 0.0474481678 1/6 36/9703
6 IGA Glomerulonephritis 0.0474481678 1/6 34/9703
10 Inflammatory Bowel Diseases 0.0474481678 1/6 35/9703
13 Mesothelioma 0.0474481678 1/6 41/9703
14 Multiple Myeloma 0.0474481678 1/6 42/9703
24 Eczema, Infantile 0.0474481678 1/6 36/9703
25 Tumoral calcinosis 0.0474481678 1/6 42/9703
30 Microcalcification 0.0474481678 1/6 42/9703
Digestive
Number of cTWAS Genes in Tissue Group: 21RP11-973H7.1 gene(s) from the input list not found in DisGeNET CURATEDNXPE1 gene(s) from the input list not found in DisGeNET CURATEDRNF186 gene(s) from the input list not found in DisGeNET CURATEDRAB29 gene(s) from the input list not found in DisGeNET CURATEDZGLP1 gene(s) from the input list not found in DisGeNET CURATEDLINC01126 gene(s) from the input list not found in DisGeNET CURATEDFAM171B gene(s) from the input list not found in DisGeNET CURATED Description FDR Ratio BgRatio
12 Ulcerative Colitis 1.988487e-08 6/14 63/9703
2 Rheumatoid Arthritis 1.984338e-02 3/14 174/9703
28 Inflammatory Bowel Diseases 1.984338e-02 2/14 35/9703
42 Pneumonia 1.984338e-02 2/14 54/9703
43 Lobar Pneumonia 1.984338e-02 2/14 54/9703
67 Libman-Sacks Disease 1.984338e-02 2/14 58/9703
69 Congenital chloride diarrhea 1.984338e-02 1/14 1/9703
86 Experimental Lung Inflammation 1.984338e-02 2/14 54/9703
93 Deep seated dermatophytosis 1.984338e-02 1/14 1/9703
100 Retinitis Pigmentosa 26 1.984338e-02 1/14 1/9703
101 Visceral myopathy familial external ophthalmoplegia 1.984338e-02 1/14 2/9703
103 Candidiasis, Familial, 2 1.984338e-02 1/14 2/9703
105 Inflammatory Bowel Disease 14 1.984338e-02 1/14 1/9703
106 MITOCHONDRIAL DNA DEPLETION SYNDROME 5 (ENCEPHALOMYOPATHIC WITH OR WITHOUT METHYLMALONIC ACIDURIA) 1.984338e-02 1/14 2/9703
108 Pneumonitis 1.984338e-02 2/14 54/9703
110 IMMUNODEFICIENCY 32A 1.984338e-02 1/14 1/9703
112 IMMUNODEFICIENCY 32B 1.984338e-02 1/14 1/9703
113 Mitochondrial DNA Depletion Syndrome 1 1.984338e-02 1/14 2/9703
27 Hypersensitivity 2.167350e-02 2/14 64/9703
95 Allergic Reaction 2.167350e-02 2/14 63/9703
37 Meniere Disease 2.299159e-02 1/14 3/9703
85 MITOCHONDRIAL NEUROGASTROINTESTINAL ENCEPHALOPATHY SYNDROME 2.299159e-02 1/14 3/9703
34 Lupus Erythematosus, Systemic 2.309739e-02 2/14 71/9703
38 Mucocutaneous Lymph Node Syndrome 2.808201e-02 1/14 4/9703
89 Diffuse Scleroderma 3.367585e-02 1/14 5/9703
41 Pancreatic Neoplasm 3.562893e-02 2/14 100/9703
66 CREST Syndrome 3.562893e-02 1/14 6/9703
81 Scleroderma, Limited 3.562893e-02 1/14 6/9703
104 clinical depression 3.562893e-02 1/14 6/9703
77 Malignant neoplasm of pancreas 3.578089e-02 2/14 102/9703
78 Pulmonary Cystic Fibrosis 4.722997e-02 1/14 9/9703
97 Fibrocystic Disease of Pancreas 4.722997e-02 1/14 9/9703Gene sets curated by Macarthur Lab
gene_set_dir <- "/project2/mstephens/wcrouse/gene_sets/"
gene_set_files <- c("gwascatalog.tsv",
                    "mgi_essential.tsv",
                    "core_essentials_hart.tsv",
                    "clinvar_path_likelypath.tsv",
                    "fda_approved_drug_targets.tsv")

for (group in names(df_group)){
  cat(paste0(group, "\n\n"))

  ctwas_genes_group <- df_group[[group]]$ctwas
  background_group <- df_group[[group]]$background

  cat(paste0("Number of cTWAS Genes in Tissue Group: ", length(ctwas_genes_group), "\n\n"))

  gene_sets <- lapply(gene_set_files, function(x){as.character(read.table(paste0(gene_set_dir, x))[,1])})
  names(gene_sets) <- sapply(gene_set_files, function(x){unlist(strsplit(x, "[.]"))[1]})

  gene_lists <- list(ctwas_genes_group=ctwas_genes_group)

  #genes in gene_sets filtered to ensure inclusion in background
  gene_sets <- lapply(gene_sets, function(x){x[x %in% background_group]})

  #hypergeometric test
  hyp_score <- data.frame()
  size <- c()
  ngenes <- c()

  for (i in 1:length(gene_sets)) {
    for (j in 1:length(gene_lists)){
      group1 <- length(gene_sets[[i]])
      group2 <- length(as.vector(gene_lists[[j]]))
      size <- c(size, group1)
      Overlap <- length(intersect(gene_sets[[i]],as.vector(gene_lists[[j]])))
      ngenes <- c(ngenes, Overlap)
      Total <- length(background_group)
      hyp_score[i,j] <- phyper(Overlap-1, group2, Total-group2, group1,lower.tail=F)
    }
  }
  rownames(hyp_score) <- names(gene_sets)
  colnames(hyp_score) <- names(gene_lists)

  #multiple testing correction
  hyp_score_padj <- apply(hyp_score,2, p.adjust, method="BH", n=(nrow(hyp_score)*ncol(hyp_score)))
  hyp_score_padj <- as.data.frame(hyp_score_padj)
  hyp_score_padj$gene_set <- rownames(hyp_score_padj)
  hyp_score_padj$nset <- size
  hyp_score_padj$ngenes <- ngenes
  hyp_score_padj$percent <- ngenes/size

  hyp_score_padj <- hyp_score_padj[order(hyp_score_padj$ctwas_genes),]
  colnames(hyp_score_padj)[1] <- "padj"
  hyp_score_padj <- hyp_score_padj[,c(2:5,1)]
  rownames(hyp_score_padj)<- NULL

  print(hyp_score_padj)

  cat("\n")
}
Adipose
Number of cTWAS Genes in Tissue Group: 8
gene_set nset ngenes percent padj
1 gwascatalog 4576 6 0.0013111888 0.07234241
2 mgi_essential 1716 3 0.0017482517 0.14531551
3 fda_approved_drug_targets 257 1 0.0038910506 0.22148909
4 clinvar_path_likelypath 2135 2 0.0009367681 0.41554980
5 core_essentials_hart 207 0 0.0000000000 1.00000000
Endocrine
Number of cTWAS Genes in Tissue Group: 14
gene_set nset ngenes percent padj
1 gwascatalog 5396 11 0.0020385471 0.0007544314
2 clinvar_path_likelypath 2488 3 0.0012057878 0.6940215281
3 mgi_essential 2023 1 0.0004943154 1.0000000000
4 core_essentials_hart 236 0 0.0000000000 1.0000000000
5 fda_approved_drug_targets 305 0 0.0000000000 1.0000000000
Cardiovascular
Number of cTWAS Genes in Tissue Group: 9
gene_set nset ngenes percent padj
1 gwascatalog 5194 7 0.0013477089 0.03063579
2 fda_approved_drug_targets 287 1 0.0034843206 0.36839215
3 mgi_essential 1969 1 0.0005078720 0.95134246
4 clinvar_path_likelypath 2404 1 0.0004159734 0.95134246
5 core_essentials_hart 241 0 0.0000000000 1.00000000
CNS
Number of cTWAS Genes in Tissue Group: 21
gene_set nset ngenes percent padj
1 gwascatalog 5427 12 0.0022111664 0.0494374
2 fda_approved_drug_targets 316 1 0.0031645570 0.7832167
3 mgi_essential 2090 2 0.0009569378 0.9050314
4 clinvar_path_likelypath 2529 3 0.0011862396 0.9050314
5 core_essentials_hart 244 0 0.0000000000 1.0000000
None
Number of cTWAS Genes in Tissue Group: 25
gene_set nset ngenes percent padj
1 gwascatalog 5635 15 0.0026619343 0.009889299
2 clinvar_path_likelypath 2608 5 0.0019171779 0.669929156
3 mgi_essential 2146 2 0.0009319664 1.000000000
4 core_essentials_hart 255 0 0.0000000000 1.000000000
5 fda_approved_drug_targets 323 0 0.0000000000 1.000000000
Skin
Number of cTWAS Genes in Tissue Group: 10
gene_set nset ngenes percent padj
1 gwascatalog 5105 5 0.0009794319 0.4414401
2 fda_approved_drug_targets 276 1 0.0036231884 0.4414401
3 mgi_essential 1922 1 0.0005202914 0.9870791
4 clinvar_path_likelypath 2341 1 0.0004271679 0.9870791
5 core_essentials_hart 228 0 0.0000000000 1.0000000
Blood or Immune
Number of cTWAS Genes in Tissue Group: 7
gene_set nset ngenes percent padj
1 clinvar_path_likelypath 2189 4 0.0018273184 0.05463618
2 gwascatalog 4764 5 0.0010495382 0.09182896
3 fda_approved_drug_targets 254 1 0.0039370079 0.18776257
4 mgi_essential 1774 1 0.0005636979 0.73197305
5 core_essentials_hart 217 0 0.0000000000 1.00000000
Digestive
Number of cTWAS Genes in Tissue Group: 21
gene_set nset ngenes percent padj
1 gwascatalog 5400 15 0.0027777778 0.0008339743
2 clinvar_path_likelypath 2491 6 0.0024086712 0.1148445143
3 fda_approved_drug_targets 308 2 0.0064935065 0.1148445143
4 mgi_essential 2053 2 0.0009741841 0.9099197772
5 core_essentials_hart 244 0 0.0000000000 1.0000000000Analysis of TWAS False Positives by Region
library(ggplot2)

pip_threshold <- 0.5

df_plot <- data.frame(Outcome=c("SNPs", "Genes", "Both", "Neither"), Frequency=rep(0,4))

for (i in 1:length(df)){
  gene_pips <- df[[i]]$gene_pips[df[[i]]$gene_pips$genename %in% df[[i]]$twas,,drop=F]
  gene_pips <- gene_pips[gene_pips$susie_pip < pip_threshold,,drop=F]

  region_pips <- df[[i]]$region_pips
  rownames(region_pips) <- region_pips$region

  gene_pips <- cbind(gene_pips, t(sapply(gene_pips$region_tag, function(x){unlist(region_pips[x,c("gene_pip", "snp_pip")])})))
  gene_pips$gene_pip <- gene_pips$gene_pip - gene_pips$susie_pip #subtract gene pip from region total to get combined pip for other genes in region

  df_plot$Frequency[df_plot$Outcome=="Neither"] <- df_plot$Frequency[df_plot$Outcome=="Neither"] + sum(gene_pips$gene_pip < 0.5 & gene_pips$snp_pip < 0.5)
  df_plot$Frequency[df_plot$Outcome=="Both"] <- df_plot$Frequency[df_plot$Outcome=="Both"] + sum(gene_pips$gene_pip > 0.5 & gene_pips$snp_pip > 0.5)
  df_plot$Frequency[df_plot$Outcome=="SNPs"] <- df_plot$Frequency[df_plot$Outcome=="SNPs"] + sum(gene_pips$gene_pip < 0.5 & gene_pips$snp_pip > 0.5)
  df_plot$Frequency[df_plot$Outcome=="Genes"] <- df_plot$Frequency[df_plot$Outcome=="Genes"] + sum(gene_pips$gene_pip > 0.5 & gene_pips$snp_pip < 0.5)
}

pie <- ggplot(df_plot, aes(x="", y=Frequency, fill=Outcome)) + geom_bar(width = 1, stat = "identity")
pie <- pie + coord_polar("y", start=0) + theme_minimal() + theme(axis.title.y=element_blank())
pie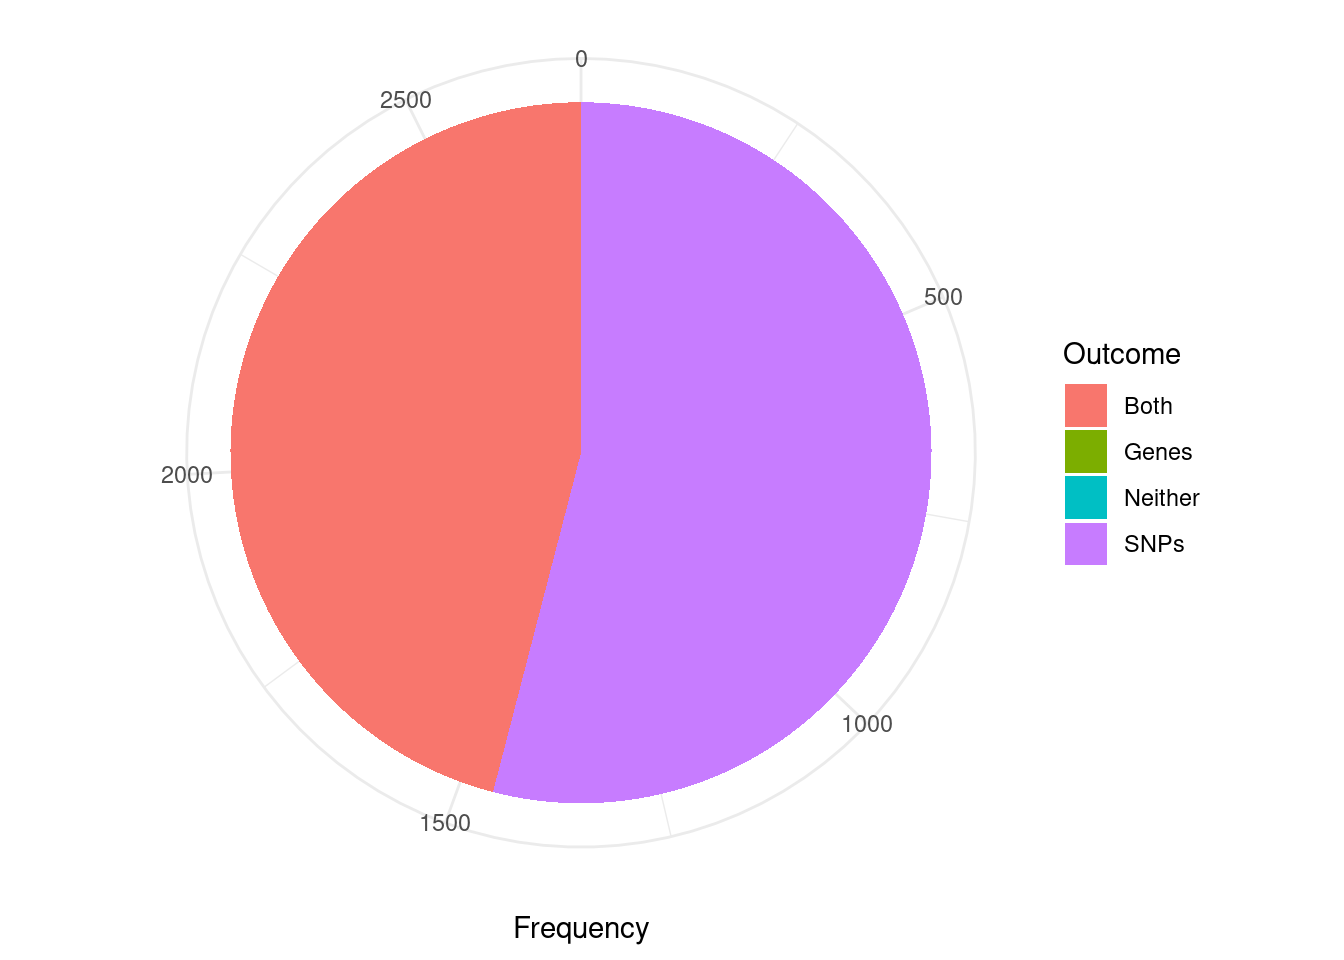
Analysis of TWAS False Positives by Credible Set
cTWAS is using susie settings that mask credible sets consisting of variables with minimum pairwise correlations below a specified threshold. The default threshold is 0.5. I think this is intended to mask credible sets with “diffuse” support. As a consequence, many of the genes considered here (TWAS false positives; significant z score but low PIP) are not assigned to a credible set (have cs_index=0). For this reason, the first figure is not really appropriate for answering the question “are TWAS false positives due to SNPs or genes”.
The second figure includes only TWAS genes that are assigned to a reported causal set (i.e. they are in a “pure” causal set with high pairwise correlations). I think that this figure is closer to the intended analysis. However, it may be biased in some way because we have excluded many TWAS false positive genes that are in “impure” credible sets.
Some alternatives to these figures include the region-based analysis in the previous section; or re-analysis with lower/no minimum pairwise correlation threshold (“min_abs_corr” option in susie_get_cs) for reporting credible sets.
library(ggplot2)

pip_threshold <- 0.5

df_plot <- data.frame(Outcome=c("SNPs", "Genes", "Both", "Neither"), Frequency=rep(0,4))

for (i in 1:length(df)){
  gene_pips <- df[[i]]$gene_pips[df[[i]]$gene_pips$genename %in% df[[i]]$twas,,drop=F]
  gene_pips <- gene_pips[gene_pips$susie_pip < pip_threshold,,drop=F]

  region_cs_pips <- df[[i]]$region_cs_pips
  rownames(region_cs_pips) <- region_cs_pips$region_cs

  gene_pips <- cbind(gene_pips, t(sapply(gene_pips$region_cs_tag, function(x){unlist(region_cs_pips[x,c("gene_pip", "snp_pip")])})))
  gene_pips$gene_pip <- gene_pips$gene_pip - gene_pips$susie_pip #subtract gene pip from causal set total to get combined pip for other genes in causal set

  plot_cutoff <- 0.5

  df_plot$Frequency[df_plot$Outcome=="Neither"] <- df_plot$Frequency[df_plot$Outcome=="Neither"] + sum(gene_pips$gene_pip < plot_cutoff & gene_pips$snp_pip < plot_cutoff)
  df_plot$Frequency[df_plot$Outcome=="Both"] <- df_plot$Frequency[df_plot$Outcome=="Both"] + sum(gene_pips$gene_pip > plot_cutoff & gene_pips$snp_pip > plot_cutoff)
  df_plot$Frequency[df_plot$Outcome=="SNPs"] <- df_plot$Frequency[df_plot$Outcome=="SNPs"] + sum(gene_pips$gene_pip < plot_cutoff & gene_pips$snp_pip > plot_cutoff)
  df_plot$Frequency[df_plot$Outcome=="Genes"] <- df_plot$Frequency[df_plot$Outcome=="Genes"] + sum(gene_pips$gene_pip > plot_cutoff & gene_pips$snp_pip < plot_cutoff)
}

pie <- ggplot(df_plot, aes(x="", y=Frequency, fill=Outcome)) + geom_bar(width = 1, stat = "identity")
pie <- pie + coord_polar("y", start=0) + theme_minimal() + theme(axis.title.y=element_blank())
pie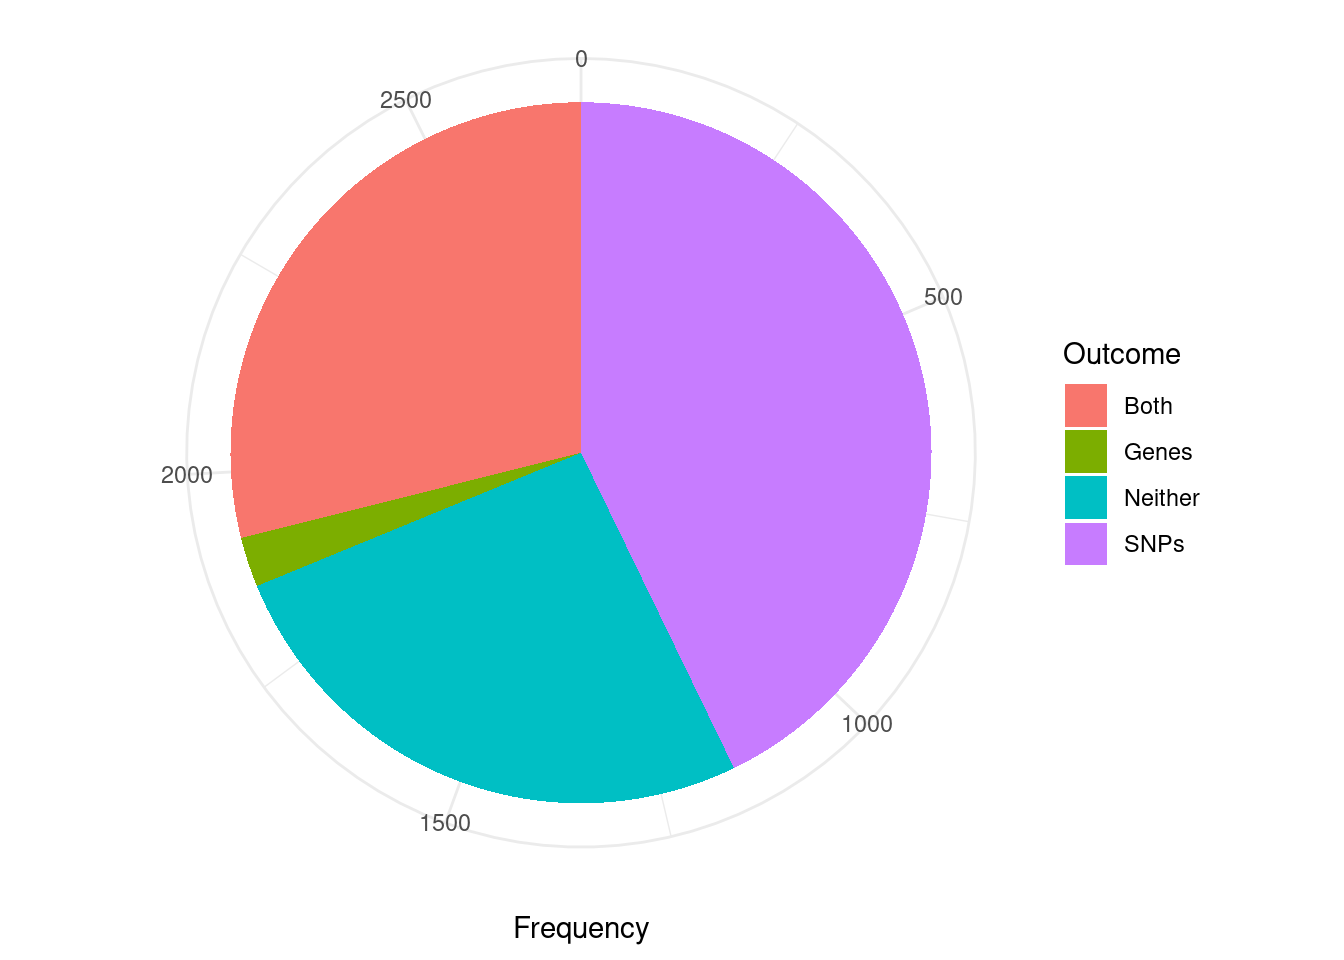
####################
#using only genes assigned to a credible set

pip_threshold <- 0.5

df_plot <- data.frame(Outcome=c("SNPs", "Genes", "Both", "Neither"), Frequency=rep(0,4))

for (i in 1:length(df)){
  gene_pips <- df[[i]]$gene_pips[df[[i]]$gene_pips$genename %in% df[[i]]$twas,,drop=F]
  gene_pips <- gene_pips[gene_pips$susie_pip < pip_threshold,,drop=F]

  #exclude genes that are not assigned to a credible set, cs_index==0
  gene_pips <- gene_pips[as.numeric(sapply(gene_pips$region_cs_tag, function(x){rev(unlist(strsplit(x, "_")))[1]}))!=0,]

  region_cs_pips <- df[[i]]$region_cs_pips
  rownames(region_cs_pips) <- region_cs_pips$region_cs

  gene_pips <- cbind(gene_pips, t(sapply(gene_pips$region_cs_tag, function(x){unlist(region_cs_pips[x,c("gene_pip", "snp_pip")])})))
  gene_pips$gene_pip <- gene_pips$gene_pip - gene_pips$susie_pip #subtract gene pip from causal set total to get combined pip for other genes in causal set

  plot_cutoff <- 0.5

  df_plot$Frequency[df_plot$Outcome=="Neither"] <- df_plot$Frequency[df_plot$Outcome=="Neither"] + sum(gene_pips$gene_pip < plot_cutoff & gene_pips$snp_pip < plot_cutoff)
  df_plot$Frequency[df_plot$Outcome=="Both"] <- df_plot$Frequency[df_plot$Outcome=="Both"] + sum(gene_pips$gene_pip > plot_cutoff & gene_pips$snp_pip > plot_cutoff)
  df_plot$Frequency[df_plot$Outcome=="SNPs"] <- df_plot$Frequency[df_plot$Outcome=="SNPs"] + sum(gene_pips$gene_pip < plot_cutoff & gene_pips$snp_pip > plot_cutoff)
  df_plot$Frequency[df_plot$Outcome=="Genes"] <- df_plot$Frequency[df_plot$Outcome=="Genes"] + sum(gene_pips$gene_pip > plot_cutoff & gene_pips$snp_pip < plot_cutoff)
}

pie <- ggplot(df_plot, aes(x="", y=Frequency, fill=Outcome)) + geom_bar(width = 1, stat = "identity")
pie <- pie + coord_polar("y", start=0) + theme_minimal() + theme(axis.title.y=element_blank())
pie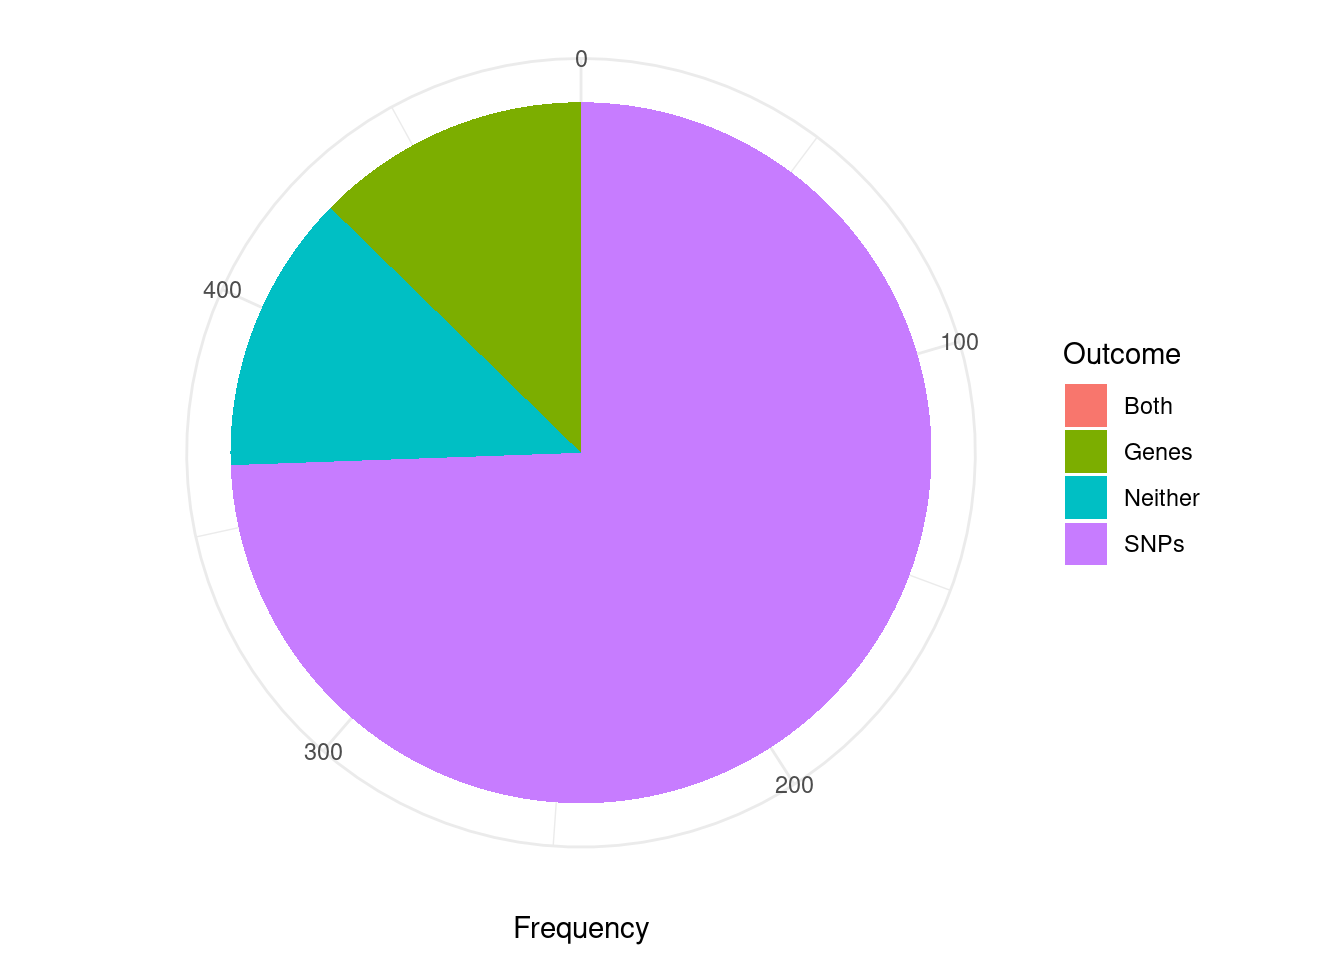
cTWAS genes without genome-wide significant SNP nearby
novel_genes <- data.frame(genename=as.character(), weight=as.character(), susie_pip=as.numeric(), snp_maxz=as.numeric())

for (i in 1:length(df)){
  gene_pips <- df[[i]]$gene_pips[df[[i]]$gene_pips$genename %in% df[[i]]$ctwas,,drop=F]

  region_pips <- df[[i]]$region_pips
  rownames(region_pips) <- region_pips$region

  gene_pips <- cbind(gene_pips, sapply(gene_pips$region_tag, function(x){region_pips[x,"snp_maxz"]}))
  names(gene_pips)[ncol(gene_pips)] <- "snp_maxz"

  if (nrow(gene_pips)>0){
    gene_pips$weight <- names(df)[i]
    gene_pips <- gene_pips[gene_pips$snp_maxz < qnorm(1-(5E-8/2), lower=T),c("genename", "weight", "susie_pip", "snp_maxz")]

    novel_genes <- rbind(novel_genes, gene_pips)
  }
}

novel_genes_summary <- data.frame(genename=unique(novel_genes$genename))
novel_genes_summary$nweights <- sapply(novel_genes_summary$genename, function(x){length(novel_genes$weight[novel_genes$genename==x])})
novel_genes_summary$weights <- sapply(novel_genes_summary$genename, function(x){paste(novel_genes$weight[novel_genes$genename==x],collapse=", ")})

novel_genes_summary <- novel_genes_summary[order(-novel_genes_summary$nweights),]
novel_genes_summary[,c("genename","nweights")]
genename nweights
1 LSP1 12
3 RP11-973H7.1 12
4 RAB29 11
2 PRKD2 7
10 CXCL5 7
7 MUC1 6
9 LINC01126 4
11 C1orf74 4
6 ITGAL 3
5 LINC02009 2
12 ERAP1 2
8 AP006621.5 1
13 ZNF736 1
14 TSPAN14 1
15 IPO8 1
16 CERKL 1
17 FAM171B 1
18 COQ8A 1
19 MED16 1
20 CCR5 1
21 BIK 1Tissue-specificity for cTWAS genes
gene_pips_by_weight <- data.frame(genename=as.character(ctwas_genes))

for (i in 1:length(df)){
  gene_pips <- df[[i]]$gene_pips
  gene_pips <- gene_pips[match(ctwas_genes, gene_pips$genename),,drop=F]

  gene_pips_by_weight <- cbind(gene_pips_by_weight, gene_pips$susie_pip)
  names(gene_pips_by_weight)[ncol(gene_pips_by_weight)] <- names(df)[i]
}

gene_pips_by_weight <- as.matrix(gene_pips_by_weight[,-1])
rownames(gene_pips_by_weight) <- ctwas_genes

#handing missing values
gene_pips_by_weight_bkup <- gene_pips_by_weight
gene_pips_by_weight[is.na(gene_pips_by_weight)] <- 0

#number of tissues with PIP>0.5 for cTWAS genes
ctwas_frequency <- rowSums(gene_pips_by_weight>0.5)
hist(ctwas_frequency, col="grey", breaks=0:max(ctwas_frequency), xlim=c(0,ncol(gene_pips_by_weight)),
     xlab="Number of Tissues with PIP>0.5",
     ylab="Number of cTWAS Genes",
     main="Tissue Specificity for cTWAS Genes")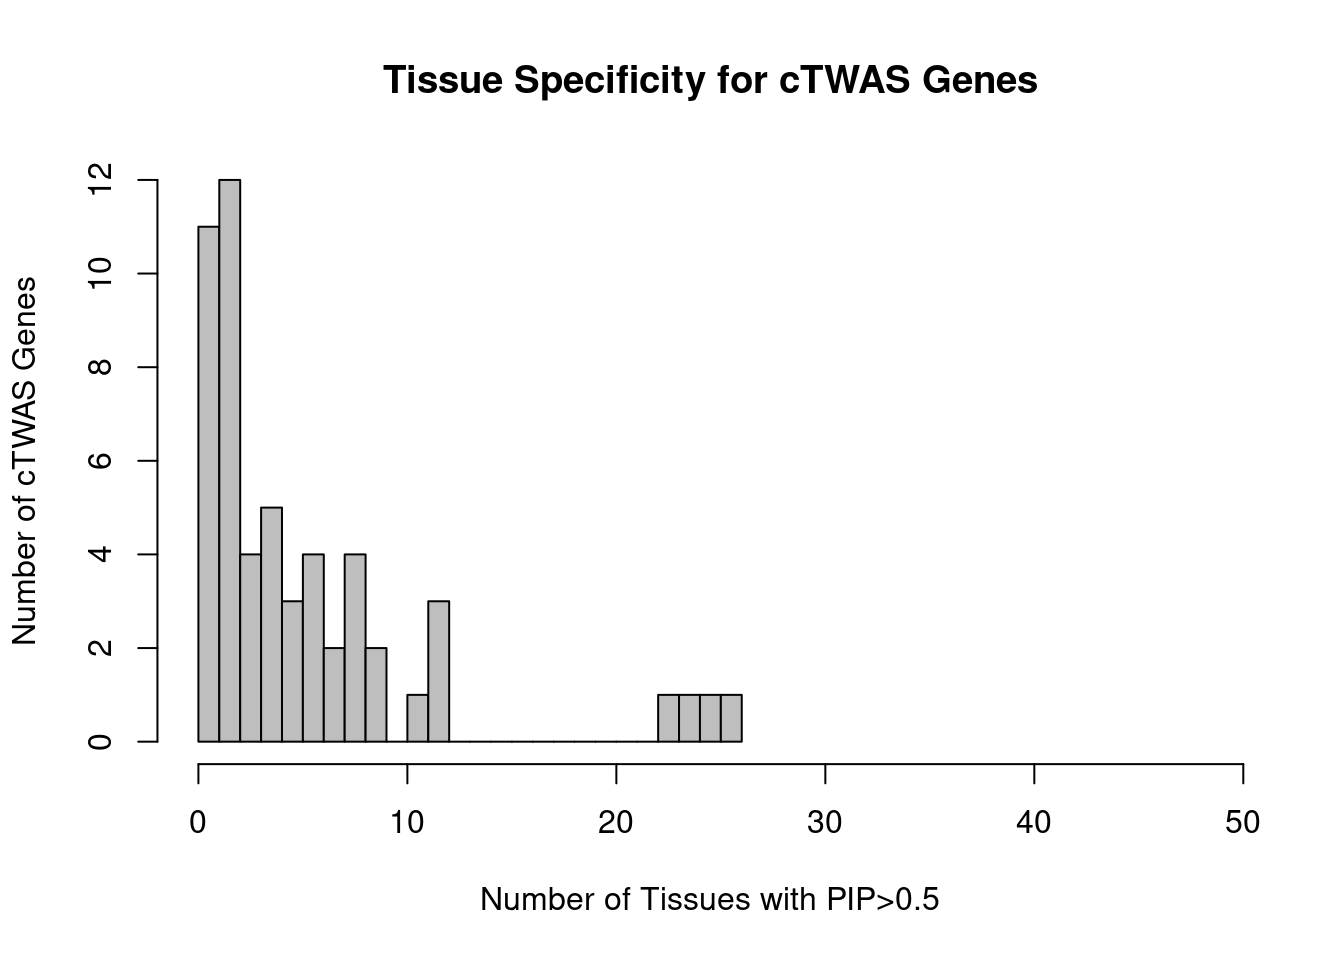
#heatmap of gene PIPs
cluster_ctwas_genes <- hclust(dist(gene_pips_by_weight))
cluster_ctwas_weights <- hclust(dist(t(gene_pips_by_weight)))

plot(cluster_ctwas_weights, cex=0.6)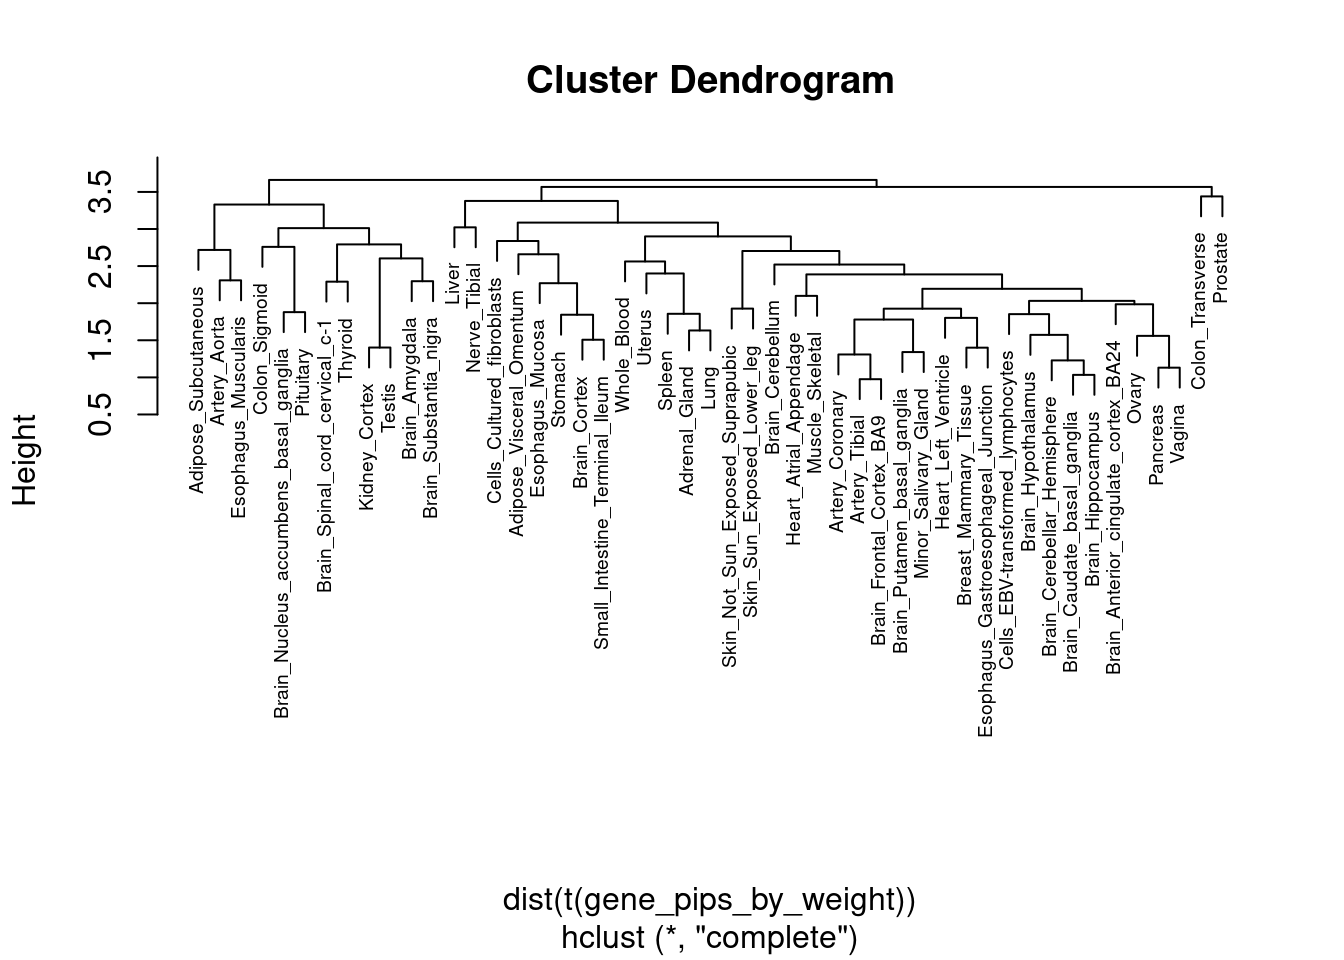
plot(cluster_ctwas_genes, cex=0.6, labels=F)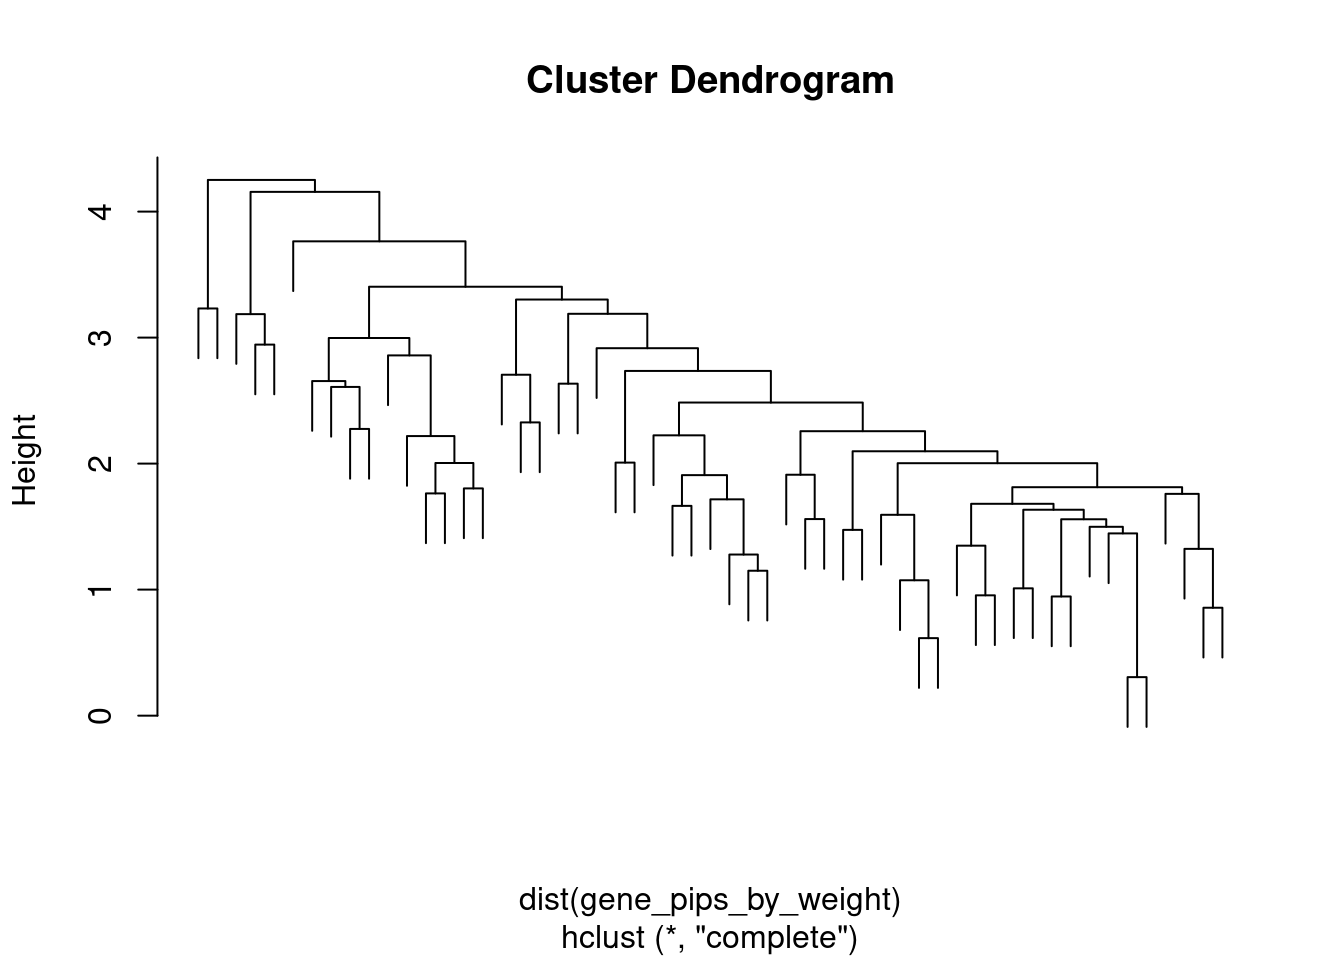
par(mar=c(14.1, 4.1, 4.1, 2.1))

image(t(gene_pips_by_weight[rev(cluster_ctwas_genes$order),rev(cluster_ctwas_weights$order)]),
      axes=F)
mtext(text=colnames(gene_pips_by_weight)[cluster_ctwas_weights$order], side=1, line=0.3, at=seq(0,1,1/(ncol(gene_pips_by_weight)-1)), las=2, cex=0.8)
mtext(text=rownames(gene_pips_by_weight)[cluster_ctwas_genes$order], side=2, line=0.3, at=seq(0,1,1/(nrow(gene_pips_by_weight)-1)), las=1, cex=0.4)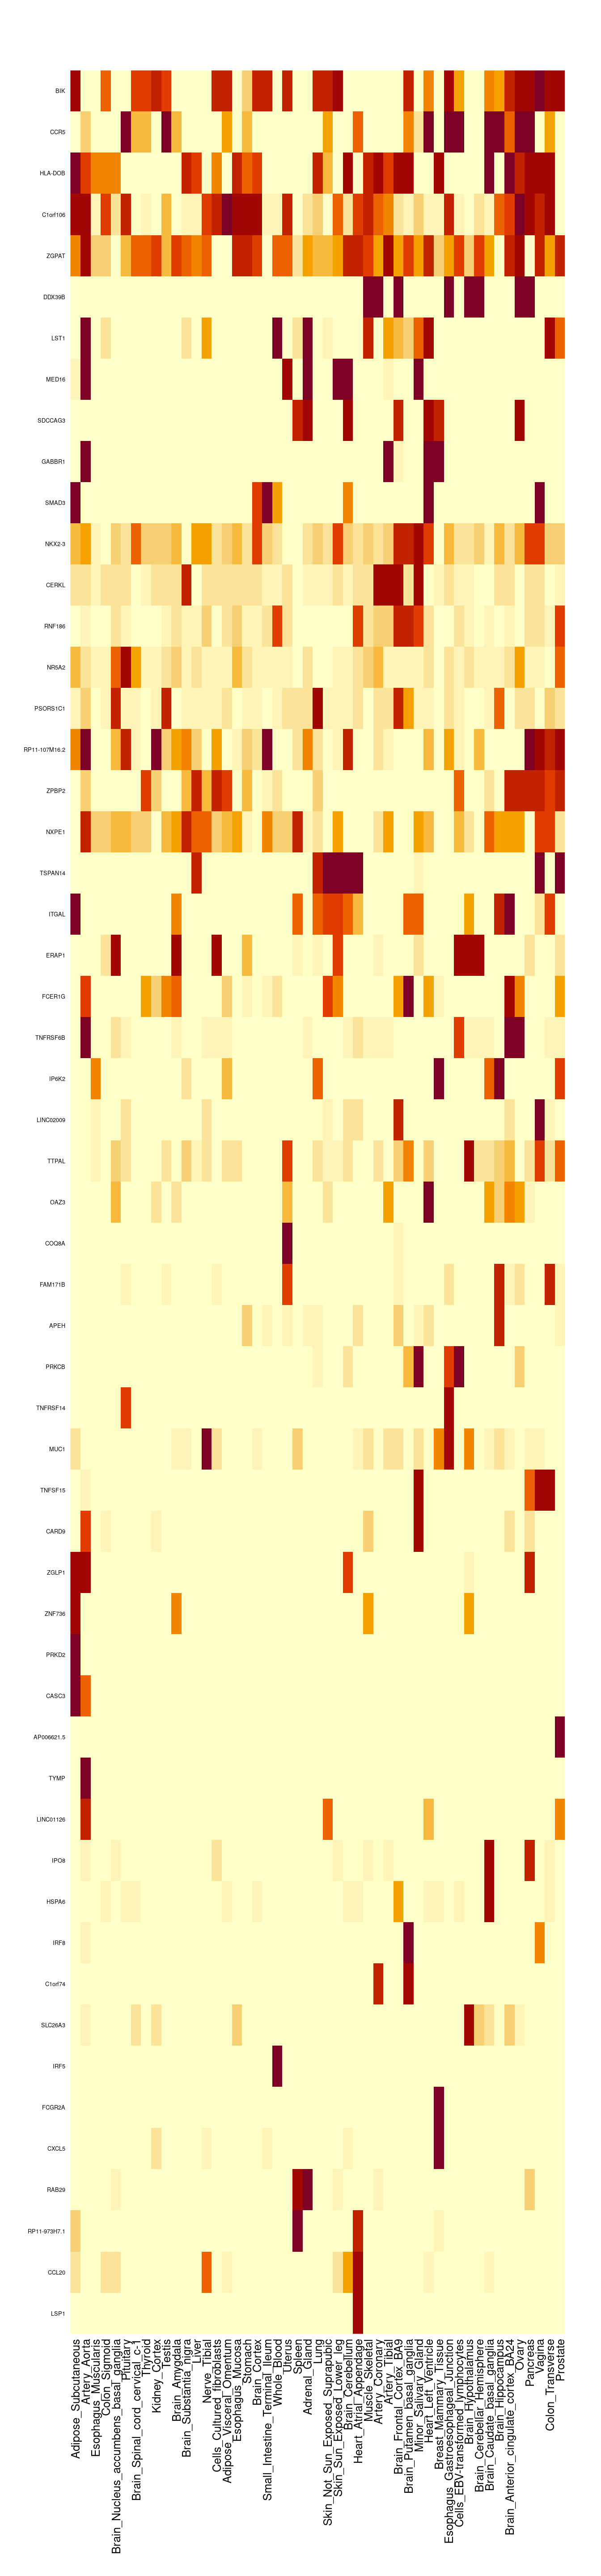
cTWAS genes with highest proportion of total PIP on a single tissue
#genes with highest proportion of PIP on a single tissue
gene_pips_proportion <- gene_pips_by_weight/rowSums(gene_pips_by_weight)

proportion_table <- data.frame(genename=as.character(rownames(gene_pips_proportion)))
proportion_table$max_pip_prop <- apply(gene_pips_proportion,1,max)
proportion_table$max_weight <- colnames(gene_pips_proportion)[apply(gene_pips_proportion,1,which.max)]

proportion_table[order(-proportion_table$max_pip_prop),]
genename max_pip_prop max_weight
41 DDX39B 0.99932966 Liver
32 RNF186 0.99133158 Colon_Transverse
45 RP11-107M16.2 0.97650232 Prostate
40 LST1 0.89366357 Heart_Atrial_Appendage
18 TTPAL 0.74475418 Brain_Cerebellum
1 NR5A2 0.70124637 Adipose_Subcutaneous
55 BIK 0.62746597 Whole_Blood
46 PSORS1C1 0.57503893 Prostate
42 ZGPAT 0.50694974 Liver
6 GABBR1 0.46209376 Adipose_Visceral_Omentum
27 FCER1G 0.44614794 Brain_Substantia_nigra
49 HLA-DOB 0.43984894 Skin_Sun_Exposed_Lower_leg
7 SDCCAG3 0.43018565 Adipose_Visceral_Omentum
47 ZPBP2 0.37397693 Prostate
48 C1orf106 0.34666124 Skin_Not_Sun_Exposed_Suprapubic
52 NKX2-3 0.33417246 Thyroid
33 CERKL 0.27714712 Colon_Transverse
30 TSPAN14 0.25970091 Cells_Cultured_fibroblasts
34 NXPE1 0.25780930 Prostate
51 MED16 0.25770677 Testis
53 SMAD3 0.23959863 Thyroid
12 ITGAL 0.23911260 Esophagus_Muscularis
15 TNFRSF6B 0.23348321 Brain_Amygdala
39 FAM171B 0.23049490 Esophagus_Muscularis
25 IP6K2 0.22347073 Brain_Spinal_cord_cervical_c-1
54 CCR5 0.21710283 Whole_Blood
10 LINC02009 0.21150240 Artery_Aorta
35 IRF8 0.19807707 Colon_Transverse
43 OAZ3 0.17858366 Nerve_Tibial
26 APEH 0.17736817 Brain_Spinal_cord_cervical_c-1
38 HSPA6 0.16887177 Prostate
24 PRKCB 0.16011910 Brain_Nucleus_accumbens_basal_ganglia
17 SLC26A3 0.15787141 Skin_Not_Sun_Exposed_Suprapubic
23 C1orf74 0.15175492 Brain_Nucleus_accumbens_basal_ganglia
28 ERAP1 0.14353311 Heart_Left_Ventricle
19 FCGR2A 0.12426127 Brain_Nucleus_accumbens_basal_ganglia
2 CARD9 0.12304553 Spleen
13 MUC1 0.11597283 Cells_EBV-transformed_lymphocytes
5 TNFRSF14 0.10782019 Adipose_Visceral_Omentum
11 IRF5 0.10435568 Skin_Not_Sun_Exposed_Suprapubic
44 TNFSF15 0.09889892 Prostate
50 COQ8A 0.09811425 Testis
22 CASC3 0.09121668 Lung
37 TYMP 0.08701682 Esophagus_Mucosa
16 AP006621.5 0.08646147 Brain_Anterior_cingulate_cortex_BA24
20 LINC01126 0.08407010 Stomach
29 ZNF736 0.07070500 Breast_Mammary_Tissue
14 CCL20 0.06999679 Brain_Spinal_cord_cervical_c-1
4 PRKD2 0.06621897 Colon_Transverse
36 ZGLP1 0.05356497 Esophagus_Gastroesophageal_Junction
31 IPO8 0.05214418 Cells_Cultured_fibroblasts
8 RP11-973H7.1 0.04729648 Prostate
3 LSP1 0.04646039 Esophagus_Muscularis
9 RAB29 0.04226871 Brain_Putamen_basal_ganglia
21 CXCL5 0.03395615 Colon_TransverseGenes nearby and nearest to GWAS peaks
#####load positions for all genes on autosomes in ENSEMBL, subset to only protein coding and lncRNA with non-missing HGNC symbol
# library(biomaRt)
#
# ensembl <- useEnsembl(biomart="ENSEMBL_MART_ENSEMBL", dataset="hsapiens_gene_ensembl")
# G_list <- getBM(filters= "chromosome_name", attributes= c("hgnc_symbol","chromosome_name","start_position","end_position","gene_biotype", "ensembl_gene_id"), values=1:22, mart=ensembl)
#
# save(G_list, file=paste0("G_list_", trait_id, ".RData"))
load(paste0("G_list_", trait_id, ".RData"))

G_list <- G_list[G_list$gene_biotype %in% c("protein_coding","lncRNA"),]

#####load z scores from the analysis and add positions from the LD reference
# results_dir <- results_dirs[1]
# weight <- rev(unlist(strsplit(results_dir, "/")))[1]
# analysis_id <- paste(trait_id, weight, sep="_")
#
# load(paste0(results_dir, "/", analysis_id, "_expr_z_snp.Rd"))
#
# LDR_dir <- "/project2/mstephens/wcrouse/UKB_LDR_0.1/"
# LDR_files <- list.files(LDR_dir)
# LDR_files <- LDR_files[grep(".Rvar" ,LDR_files)]
#
# z_snp$chrom <- as.integer(NA)
# z_snp$pos <- as.integer(NA)
#
# for (i in 1:length(LDR_files)){
#   print(i)
#
#   LDR_info <- read.table(paste0(LDR_dir, LDR_files[i]), header=T)
#   z_snp_index <- which(z_snp$id %in% LDR_info$id)
#   z_snp[z_snp_index,c("chrom", "pos")] <- t(sapply(z_snp_index, function(x){unlist(LDR_info[match(z_snp$id[x], LDR_info$id),c("chrom", "pos")])}))
# }
#
# z_snp <- z_snp[,c("id", "z", "chrom","pos")]
# save(z_snp, file=paste0("z_snp_pos_", trait_id, ".RData"))
load(paste0("z_snp_pos_", trait_id, ".RData"))

####################
#identify genes within 500kb of genome-wide significant variant ("nearby")
G_list$nearby <- NA

window_size <- 500000

for (chr in 1:22){
  #index genes on chromosome
  G_list_index <- which(G_list$chromosome_name==chr)

  #subset z_snp to chromosome, then subset to significant genome-wide significant variants
  z_snp_chr <- z_snp[z_snp$chrom==chr,,drop=F]
  z_snp_chr <- z_snp_chr[abs(z_snp_chr$z)>qnorm(1-(5E-8/2), lower=T),,drop=F]

  #iterate over genes on chromsome and check if a genome-wide significant SNP is within the window
  for (i in G_list_index){
    window_start <- G_list$start_position[i] - window_size
    window_end <- G_list$end_position[i] + window_size
    G_list$nearby[i] <- any(z_snp_chr$pos>=window_start & z_snp_chr$pos<=window_end)
  }
}

####################
#identify genes that are nearest to lead genome-wide significant variant ("nearest")
G_list$nearest <- F

window_size <- 500000

for (chr in 1:22){
  #index genes on chromosome
  G_list_index <- which(G_list$chromosome_name==chr)

  #subset z_snp to chromosome, then subset to significant genome-wide significant variants
  z_snp_chr <- z_snp[z_snp$chrom==chr,,drop=F]
  z_snp_chr <- z_snp_chr[abs(z_snp_chr$z)>qnorm(1-(5E-8/2), lower=T),,drop=F]

  count <- 0

  while (nrow(z_snp_chr)>0){
    lead_index <- which.max(abs(z_snp_chr$z))
    lead_position <- z_snp_chr$pos[lead_index]

    distances <- sapply(G_list_index, function(i){
      if (lead_position >= G_list$start_position[i] & lead_position <= G_list$end_position[i]){
        distance <- 0
      } else {
        distance <- min(abs(G_list$start_position[i] - lead_position), abs(G_list$end_position[i] - lead_position))
      }
      distance
    })

    min_distance <- min(distances)

    G_list$nearest[G_list_index[distances==min_distance]] <- T

    window_start <- lead_position - window_size
    window_end <- lead_position + window_size
    z_snp_chr <- z_snp_chr[!(z_snp_chr$pos>=window_start & z_snp_chr$pos<=window_end),,drop=F]
  }
}
Enrichment analysis using known IBD genes from ABC paper
known_genes <- data.table::fread("nasser_2021_ABC_IBD_genes.txt")
known_genes <- unique(known_genes$KnownGene)

dbs <- c("GO_Biological_Process_2021")
GO_enrichment <- enrichr(known_genes, dbs)
Uploading data to Enrichr... Done.
Querying GO_Biological_Process_2021... Done.
Parsing results... Done.for (db in dbs){
cat(paste0(db, "\n\n"))
enrich_results <- GO_enrichment[[db]]
enrich_results <- enrich_results[enrich_results$Adjusted.P.value<0.05,c("Term", "Overlap", "Adjusted.P.value", "Genes")]
print(enrich_results)
print(plotEnrich(GO_enrichment[[db]]))
}GO_Biological_Process_2021
Term Overlap Adjusted.P.value Genes
1 cytokine-mediated signaling pathway (GO:0019221) 12/621 3.159212e-09 IL10;CD40;NOS2;IFNG;TNFSF15;IL23R;IL2RA;RORC;STAT4;IL12B;JAK2;IL6ST
2 cellular response to cytokine stimulus (GO:0071345) 11/482 3.159212e-09 IL10;CD40;SMAD3;NOS2;IL23R;IL2RA;RORC;STAT4;IL12B;JAK2;IL6ST
3 positive regulation of tyrosine phosphorylation of STAT protein (GO:0042531) 6/59 2.963998e-08 CD40;IFNG;IL23R;IL12B;JAK2;IL6ST
4 regulation of tyrosine phosphorylation of STAT protein (GO:0042509) 6/68 4.484450e-08 CD40;IFNG;IL23R;IL12B;JAK2;IL6ST
5 interleukin-23-mediated signaling pathway (GO:0038155) 4/9 4.484450e-08 IL23R;STAT4;IL12B;JAK2
6 interleukin-12-mediated signaling pathway (GO:0035722) 5/46 4.334439e-07 IL10;IFNG;STAT4;IL12B;JAK2
7 cellular response to interleukin-12 (GO:0071349) 5/48 4.632848e-07 IL10;IFNG;STAT4;IL12B;JAK2
8 regulation of interleukin-12 production (GO:0032655) 5/51 5.546642e-07 IL10;CD40;IFNG;IL23R;IL12B
9 positive regulation of cytokine production (GO:0001819) 8/335 6.063177e-07 PTGER4;IL10;CD40;NOS2;IFNG;IL23R;IL12B;IL6ST
10 positive regulation of peptidyl-tyrosine phosphorylation (GO:0050731) 6/134 1.328228e-06 CD40;IFNG;IL23R;IL12B;JAK2;IL6ST
11 response to molecule of bacterial origin (GO:0002237) 5/73 2.530185e-06 IL10;NOS2;IL23R;TNFAIP3;JAK2
12 positive regulation of immune response (GO:0050778) 5/75 2.660413e-06 IL10;IFNG;IL23R;IL12B;IL6ST
13 positive regulation of immune effector process (GO:0002699) 4/32 4.824287e-06 IL10;IFNG;IL23R;IL12B
14 negative regulation of smooth muscle cell proliferation (GO:0048662) 4/33 5.093107e-06 IL10;IFNG;TNFAIP3;IL12B
15 positive regulation of interleukin-12 production (GO:0032735) 4/34 5.154051e-06 CD40;IFNG;IL23R;IL12B
16 negative regulation of cytokine production (GO:0001818) 6/182 5.154051e-06 PTGER4;IL10;IFNG;IL23R;TNFAIP3;IL12B
17 regulation of inflammatory response (GO:0050727) 6/206 1.008944e-05 PTGER4;IL10;IFNG;TNFAIP3;IL12B;JAK2
18 interleukin-35-mediated signaling pathway (GO:0070757) 3/11 1.414897e-05 STAT4;IL6ST;JAK2
19 regulation of MHC class II biosynthetic process (GO:0045346) 3/12 1.785704e-05 IL10;IFNG;JAK2
20 regulation of tumor necrosis factor production (GO:0032680) 5/124 1.994800e-05 IL10;IFNG;TNFAIP3;IL12B;JAK2
21 T-helper cell differentiation (GO:0042093) 3/14 2.668554e-05 PTGER4;RORC;IL12B
22 positive regulation of osteoclast differentiation (GO:0045672) 3/15 3.181334e-05 IFNG;IL23R;IL12B
23 regulation of cytokine production (GO:0001817) 5/150 4.269432e-05 PTGER4;IL10;NOS2;IFNG;IL12B
24 response to cytokine (GO:0034097) 5/150 4.269432e-05 CD40;SMAD3;IL23R;JAK2;IL6ST
25 response to lipopolysaccharide (GO:0032496) 5/159 5.462762e-05 IL10;NOS2;IL23R;TNFAIP3;JAK2
26 positive regulation of lymphocyte proliferation (GO:0050671) 4/75 7.850430e-05 CD40;IL23R;IL12B;IL6ST
27 regulation of T cell proliferation (GO:0042129) 4/76 7.972634e-05 IL10;IL23R;IL12B;IL6ST
28 positive regulation of multicellular organismal process (GO:0051240) 6/345 1.209518e-04 PTGER4;IL10;SMAD3;IFNG;IL12B;JAK2
29 receptor signaling pathway via STAT (GO:0097696) 3/25 1.209518e-04 IFNG;STAT4;JAK2
30 positive regulation of inflammatory response (GO:0050729) 4/89 1.350005e-04 PTGER4;IFNG;IL12B;IL6ST
31 regulation of transcription by RNA polymerase II (GO:0006357) 12/2206 1.768790e-04 CD40;SMAD3;IFNG;HNF4A;NRIP1;RORC;STAT4;IKZF1;PRDM1;BACH2;NKX2-3;JAZF1
32 negative regulation of cell population proliferation (GO:0008285) 6/379 1.851566e-04 IL10;IFNG;HNF4A;TNFAIP3;IL12B;JAK2
33 receptor signaling pathway via JAK-STAT (GO:0007259) 3/31 2.066586e-04 IFNG;STAT4;JAK2
34 regulation of interleukin-17 production (GO:0032660) 3/33 2.368256e-04 IFNG;IL23R;IL12B
35 inflammatory response (GO:0006954) 5/230 2.368256e-04 PTGER4;CD40;NOS2;IFNG;IL2RA
36 regulation of interleukin-6 production (GO:0032675) 4/110 2.611320e-04 IL10;NOS2;IFNG;TNFAIP3
37 regulation of defense response to virus by host (GO:0050691) 3/36 2.765671e-04 IL23R;TNFAIP3;IL12B
38 regulation of osteoclast differentiation (GO:0045670) 3/36 2.765671e-04 IFNG;IL23R;IL12B
39 positive regulation of myeloid leukocyte differentiation (GO:0002763) 3/36 2.765671e-04 IFNG;IL23R;IL12B
40 positive regulation of signaling receptor activity (GO:2000273) 3/37 2.931931e-04 IL10;IFNG;JAK2
41 positive regulation of signal transduction (GO:0009967) 5/252 3.004671e-04 LRRK2;TNFAIP3;RSPO3;JAK2;IL6ST
42 positive regulation of cell fate commitment (GO:0010455) 2/5 3.004671e-04 IL23R;IL12B
43 positive regulation of natural killer cell proliferation (GO:0032819) 2/5 3.004671e-04 IL23R;IL12B
44 regulation of T cell differentiation (GO:0045580) 3/39 3.129611e-04 IFNG;IL2RA;PRDM1
45 negative regulation of transcription, DNA-templated (GO:0045892) 8/948 3.189470e-04 SMAD3;IFNG;HNF4A;NRIP1;RORC;IKZF1;PRDM1;JAZF1
46 regulation of nitric oxide biosynthetic process (GO:0045428) 3/40 3.233473e-04 SMAD3;IFNG;JAK2
47 regulation of protein secretion (GO:0050708) 4/125 3.313583e-04 NOS2;IFNG;HNF4A;IL12B
48 positive regulation of leukocyte mediated cytotoxicity (GO:0001912) 3/43 3.797001e-04 NOS2;IL23R;IL12B
49 regulation of NK T cell activation (GO:0051133) 2/6 3.797001e-04 IL23R;IL12B
50 regulation of T-helper 17 cell lineage commitment (GO:2000328) 2/6 3.797001e-04 IL23R;IL12B
51 positive regulation of killing of cells of other organism (GO:0051712) 2/6 3.797001e-04 IFNG;NOS2
52 regulation of endothelial cell apoptotic process (GO:2000351) 3/44 3.821106e-04 IL10;CD40;TNFAIP3
53 regulation of natural killer cell proliferation (GO:0032817) 2/7 4.828489e-04 IL23R;IL12B
54 positive regulation of activation of Janus kinase activity (GO:0010536) 2/7 4.828489e-04 IL23R;IL12B
55 positive regulation of NK T cell activation (GO:0051135) 2/7 4.828489e-04 IL23R;IL12B
56 positive regulation of T-helper 17 cell differentiation (GO:2000321) 2/7 4.828489e-04 IL23R;IL12B
57 regulation of smooth muscle cell proliferation (GO:0048660) 3/49 4.828489e-04 IFNG;TNFAIP3;IL12B
58 regulation of activation of Janus kinase activity (GO:0010533) 2/8 6.116927e-04 IL23R;IL12B
59 positive regulation of MHC class II biosynthetic process (GO:0045348) 2/8 6.116927e-04 IFNG;JAK2
60 regulation of smooth muscle cell apoptotic process (GO:0034391) 2/9 7.359406e-04 IFNG;IL12B
61 regulation of T-helper 1 type immune response (GO:0002825) 2/9 7.359406e-04 IL23R;IL12B
62 positive regulation of memory T cell differentiation (GO:0043382) 2/9 7.359406e-04 IL23R;IL12B
63 positive regulation of smooth muscle cell apoptotic process (GO:0034393) 2/9 7.359406e-04 IFNG;IL12B
64 regulation of memory T cell differentiation (GO:0043380) 2/10 8.909091e-04 IL23R;IL12B
65 regulation of T-helper 17 type immune response (GO:2000316) 2/10 8.909091e-04 IL23R;IL12B
66 positive regulation of T cell proliferation (GO:0042102) 3/66 1.020663e-03 IL23R;IL12B;IL6ST
67 negative regulation of interleukin-17 production (GO:0032700) 2/11 1.040019e-03 IFNG;IL12B
68 positive regulation of nitric-oxide synthase biosynthetic process (GO:0051770) 2/11 1.040019e-03 IFNG;JAK2
69 regulation of natural killer cell activation (GO:0032814) 2/12 1.194336e-03 IL12B;PRDM1
70 positive regulation of T-helper 1 type immune response (GO:0002827) 2/12 1.194336e-03 IL23R;IL12B
71 positive regulation of T-helper 17 type immune response (GO:2000318) 2/12 1.194336e-03 IL23R;IL12B
72 extrinsic apoptotic signaling pathway (GO:0097191) 3/72 1.213111e-03 SMAD3;IFNG;JAK2
73 defense response to Gram-negative bacterium (GO:0050829) 3/73 1.246696e-03 NOS2;IL23R;IL12B
74 regulation of cytokine-mediated signaling pathway (GO:0001959) 3/74 1.263635e-03 IFNG;TNFAIP3;JAK2
75 regulation of peptide hormone secretion (GO:0090276) 3/74 1.263635e-03 NOS2;IFNG;HNF4A
76 positive regulation of T cell activation (GO:0050870) 3/75 1.267540e-03 IL23R;IL12B;IL6ST
77 negative regulation of hydrogen peroxide-induced cell death (GO:1903206) 2/13 1.267540e-03 IL10;LRRK2
78 positive regulation of adaptive immune response based on somatic recombination of immune receptors built from immunoglobulin superfamily domains (GO:0002824) 2/13 1.267540e-03 IL23R;IL12B
79 protein localization to mitochondrion (GO:0070585) 2/13 1.267540e-03 LRRK2;RNF186
80 positive regulation of tumor necrosis factor production (GO:0032760) 3/77 1.333364e-03 IFNG;IL12B;JAK2
81 regulation of nitric-oxide synthase biosynthetic process (GO:0051769) 2/14 1.406405e-03 IFNG;JAK2
82 regulation of response to interferon-gamma (GO:0060330) 2/14 1.406405e-03 IFNG;JAK2
83 positive regulation of granulocyte macrophage colony-stimulating factor production (GO:0032725) 2/14 1.406405e-03 IL23R;IL12B
84 activation of cysteine-type endopeptidase activity involved in apoptotic process (GO:0006919) 3/81 1.458679e-03 SMAD3;TNFSF15;JAK2
85 positive regulation of tumor necrosis factor superfamily cytokine production (GO:1903557) 3/81 1.458679e-03 IFNG;IL12B;JAK2
86 regulation of interleukin-1 beta production (GO:0032651) 3/83 1.512167e-03 IFNG;TNFAIP3;JAK2
87 positive regulation of cell killing (GO:0031343) 2/15 1.512167e-03 NOS2;IFNG
88 interleukin-27-mediated signaling pathway (GO:0070106) 2/15 1.512167e-03 IL6ST;JAK2
89 positive regulation of natural killer cell activation (GO:0032816) 2/15 1.512167e-03 IL23R;IL12B
90 cellular response to lipid (GO:0071396) 4/219 1.532524e-03 IL10;NRIP1;RORC;TNFAIP3
91 negative regulation of defense response (GO:0031348) 3/85 1.571864e-03 PTGER4;IL10;TNFAIP3
92 regulation of granulocyte macrophage colony-stimulating factor production (GO:0032645) 2/16 1.670502e-03 IL23R;IL12B
93 negative regulation of transcription by RNA polymerase II (GO:0000122) 6/684 1.719239e-03 SMAD3;IFNG;NRIP1;RORC;PRDM1;JAZF1
94 negative regulation of interleukin-10 production (GO:0032693) 2/17 1.831985e-03 IL23R;IL12B
95 regulation of cellular respiration (GO:0043457) 2/17 1.831985e-03 NOS2;IFNG
96 regulation of peptidyl-tyrosine phosphorylation (GO:0050730) 3/92 1.883050e-03 IL23R;IL12B;JAK2
97 interleukin-6-mediated signaling pathway (GO:0070102) 2/18 2.016877e-03 IL6ST;JAK2
98 positive regulation of defense response (GO:0031349) 3/98 2.222594e-03 PTGER4;IFNG;IL12B
99 regulation of transcription, DNA-templated (GO:0006355) 10/2244 2.354954e-03 IL10;SMAD3;IFNG;HNF4A;RORC;STAT4;IKZF1;PRDM1;BACH2;NKX2-3
100 adaptive immune response based on somatic recombination of immune receptors built from immunoglobulin superfamily domains (GO:0002460) 2/20 2.354954e-03 IL12B;BACH2
101 positive regulation of activated T cell proliferation (GO:0042104) 2/20 2.354954e-03 IL23R;IL12B
102 positive regulation of alpha-beta T cell activation (GO:0046635) 2/20 2.354954e-03 IL23R;IL12B
103 mesoderm development (GO:0007498) 2/20 2.354954e-03 IKZF1;JAK2
104 regulation of insulin secretion (GO:0050796) 3/104 2.494654e-03 NOS2;IFNG;HNF4A
105 positive regulation of protein serine/threonine kinase activity (GO:0071902) 3/106 2.613149e-03 CD40;IFNG;LRRK2
106 regulation of cell population proliferation (GO:0042127) 6/764 2.676650e-03 IL10;IFNG;HNF4A;STAT4;JAK2;IL6ST
107 negative regulation of signal transduction (GO:0009968) 4/267 2.676650e-03 IL10;LRRK2;TNFAIP3;IL12B
108 negative regulation of B cell activation (GO:0050869) 2/22 2.676650e-03 IL10;TNFAIP3
109 regulation of membrane protein ectodomain proteolysis (GO:0051043) 2/22 2.676650e-03 IL10;IFNG
110 microglial cell activation (GO:0001774) 2/22 2.676650e-03 IFNG;JAK2
111 regulation of Wnt signaling pathway (GO:0030111) 3/111 2.829920e-03 LRRK2;TNFAIP3;RSPO3
112 regulation of interferon-gamma-mediated signaling pathway (GO:0060334) 2/23 2.851461e-03 IFNG;JAK2
113 positive regulation of interleukin-17 production (GO:0032740) 2/23 2.851461e-03 IL23R;IL12B
114 response to lipid (GO:0033993) 3/114 2.979406e-03 NOS2;IL23R;JAK2
115 positive regulation of protein metabolic process (GO:0051247) 3/115 3.029999e-03 IL23R;TNFAIP3;IL12B
116 tumor necrosis factor-mediated signaling pathway (GO:0033209) 3/116 3.080974e-03 CD40;TNFSF15;JAK2
117 negative regulation of response to external stimulus (GO:0032102) 3/118 3.211275e-03 PTGER4;IL10;TNFAIP3
118 positive regulation of cysteine-type endopeptidase activity involved in apoptotic process (GO:0043280) 3/119 3.263596e-03 SMAD3;TNFSF15;JAK2
119 regulation of regulatory T cell differentiation (GO:0045589) 2/26 3.441017e-03 IFNG;IL2RA
120 positive regulation of T cell mediated cytotoxicity (GO:0001916) 2/26 3.441017e-03 IL23R;IL12B
121 negative regulation of endothelial cell apoptotic process (GO:2000352) 2/27 3.652458e-03 IL10;TNFAIP3
122 positive regulation of nitric oxide biosynthetic process (GO:0045429) 2/27 3.652458e-03 SMAD3;IFNG
123 MAPK cascade (GO:0000165) 4/303 3.746044e-03 PTGER4;LRRK2;IL2RA;JAK2
124 regulation of B cell activation (GO:0050864) 2/28 3.746044e-03 IL10;TNFAIP3
125 cellular response to interleukin-6 (GO:0071354) 2/28 3.746044e-03 JAK2;IL6ST
126 positive regulation of defense response to virus by host (GO:0002230) 2/28 3.746044e-03 IL23R;IL12B
127 positive regulation of nitric oxide metabolic process (GO:1904407) 2/28 3.746044e-03 SMAD3;IFNG
128 positive regulation of protein import into nucleus (GO:0042307) 2/28 3.746044e-03 SMAD3;IFNG
129 regulation of T cell mediated cytotoxicity (GO:0001914) 2/29 3.989152e-03 IL23R;IL12B
130 negative regulation of interleukin-1 production (GO:0032692) 2/30 4.205478e-03 IL10;TNFAIP3
131 positive regulation of protein import (GO:1904591) 2/30 4.205478e-03 SMAD3;IFNG
132 negative regulation of interleukin-6 production (GO:0032715) 2/31 4.457893e-03 IL10;TNFAIP3
133 negative regulation of gene expression (GO:0010629) 4/322 4.465449e-03 PTGER4;IL10;NOS2;IFNG
134 cellular response to oxygen-containing compound (GO:1901701) 4/323 4.483746e-03 IL10;NRIP1;RORC;TNFAIP3
135 positive regulation of response to external stimulus (GO:0032103) 3/139 4.485050e-03 PTGER4;IFNG;IL12B
136 B cell proliferation (GO:0042100) 2/32 4.577885e-03 IL10;CD40
137 superoxide metabolic process (GO:0006801) 2/32 4.577885e-03 NOS2;NCF4
138 positive regulation of receptor signaling pathway via JAK-STAT (GO:0046427) 2/33 4.834058e-03 IL10;JAK2
139 regulation of activated T cell proliferation (GO:0046006) 2/34 5.058772e-03 IL23R;IL12B
140 positive regulation of pri-miRNA transcription by RNA polymerase II (GO:1902895) 2/34 5.058772e-03 IL10;SMAD3
141 cellular response to organic cyclic compound (GO:0071407) 3/150 5.354212e-03 LRRK2;NRIP1;RORC
142 regulation of protein import into nucleus (GO:0042306) 2/36 5.513132e-03 SMAD3;IFNG
143 macrophage activation (GO:0042116) 2/36 5.513132e-03 IFNG;JAK2
144 positive regulation of T cell mediated immunity (GO:0002711) 2/36 5.513132e-03 IL23R;IL12B
145 positive regulation of Wnt signaling pathway (GO:0030177) 3/153 5.513132e-03 LRRK2;TNFAIP3;RSPO3
146 positive regulation of protein kinase activity (GO:0045860) 3/154 5.579350e-03 IFNG;IL23R;IL12B
147 negative regulation of epithelial cell apoptotic process (GO:1904036) 2/37 5.705937e-03 IL10;TNFAIP3
148 lymphocyte proliferation (GO:0046651) 2/38 5.977465e-03 IL10;CD40
149 positive regulation of protein phosphorylation (GO:0001934) 4/371 6.744077e-03 CD40;IFNG;LRRK2;JAK2
150 negative regulation of proteolysis (GO:0045861) 2/43 7.446194e-03 IL10;LRRK2
151 negative regulation of type I interferon production (GO:0032480) 2/43 7.446194e-03 IL10;TNFAIP3
152 positive regulation of T cell differentiation (GO:0045582) 2/43 7.446194e-03 IL23R;IL12B
153 defense response to bacterium (GO:0042742) 3/176 7.817542e-03 NOS2;IL23R;IL12B
154 negative regulation of immune response (GO:0050777) 3/178 7.941593e-03 PTGER4;IL10;TNFAIP3
155 regulation of pri-miRNA transcription by RNA polymerase II (GO:1902893) 2/45 7.941593e-03 IL10;SMAD3
156 regulation of receptor signaling pathway via JAK-STAT (GO:0046425) 2/45 7.941593e-03 IL10;JAK2
157 regulation of B cell proliferation (GO:0030888) 2/46 8.088553e-03 IL10;CD40
158 negative regulation of tumor necrosis factor production (GO:0032720) 2/46 8.088553e-03 IL10;TNFAIP3
159 erythrocyte differentiation (GO:0030218) 2/46 8.088553e-03 IKZF1;JAK2
160 positive regulation of nucleocytoplasmic transport (GO:0046824) 2/46 8.088553e-03 SMAD3;IFNG
161 negative regulation of mitotic cell cycle (GO:0045930) 2/48 8.639307e-03 IL10;SMAD3
162 negative regulation of tumor necrosis factor superfamily cytokine production (GO:1903556) 2/48 8.639307e-03 IL10;TNFAIP3
163 regulation of interleukin-10 production (GO:0032653) 2/48 8.639307e-03 IL23R;IL12B
164 cellular response to mechanical stimulus (GO:0071260) 2/49 8.944878e-03 PTGER4;CD40
165 cellular response to tumor necrosis factor (GO:0071356) 3/194 9.574500e-03 CD40;TNFSF15;JAK2
166 myeloid cell differentiation (GO:0030099) 2/52 9.940472e-03 IKZF1;JAK2
167 regulation of gene expression (GO:0010468) 6/1079 1.052304e-02 IL10;SMAD3;NOS2;IFNG;IL12B;PRDM1
168 positive regulation of interleukin-1 beta production (GO:0032731) 2/56 1.137097e-02 IFNG;JAK2
169 positive regulation of interferon-gamma production (GO:0032729) 2/57 1.170539e-02 IL23R;IL12B
170 negative regulation of inflammatory response (GO:0050728) 3/212 1.195664e-02 PTGER4;IL10;TNFAIP3
171 negative regulation of multicellular organismal process (GO:0051241) 3/214 1.213597e-02 PTGER4;IL10;IFNG
172 positive regulation of protein modification process (GO:0031401) 3/214 1.213597e-02 CD40;IFNG;LRRK2
173 negative regulation of autophagy (GO:0010507) 2/59 1.223914e-02 IL10;LRRK2
174 positive regulation of interleukin-1 production (GO:0032732) 2/62 1.341685e-02 IFNG;JAK2
175 apoptotic process (GO:0006915) 3/231 1.471611e-02 IFNG;IL2RA;JAK2
176 regulation of autophagy (GO:0010506) 3/231 1.471611e-02 IL10;IFNG;LRRK2
177 positive regulation of gene expression (GO:0010628) 4/482 1.472191e-02 PTGER4;IL10;SMAD3;IFNG
178 positive regulation of cell death (GO:0010942) 2/66 1.482965e-02 IFNG;LRRK2
179 positive regulation of transcription, DNA-templated (GO:0045893) 6/1183 1.546345e-02 IL10;CD40;SMAD3;HNF4A;NRIP1;RORC
180 interferon-gamma-mediated signaling pathway (GO:0060333) 2/68 1.546345e-02 IFNG;JAK2
181 positive regulation of protein localization to nucleus (GO:1900182) 2/68 1.546345e-02 SMAD3;IFNG
182 positive regulation of MAP kinase activity (GO:0043406) 2/69 1.582493e-02 CD40;LRRK2
183 positive regulation of DNA-binding transcription factor activity (GO:0051091) 3/246 1.688787e-02 IL10;CD40;SMAD3
184 positive regulation of nucleic acid-templated transcription (GO:1903508) 4/511 1.745108e-02 IL10;SMAD3;HNF4A;RORC
185 positive regulation of phosphorylation (GO:0042327) 3/253 1.806956e-02 CD40;IFNG;LRRK2
186 positive regulation of interleukin-6 production (GO:0032755) 2/76 1.870662e-02 NOS2;IFNG
187 negative regulation of NF-kappaB transcription factor activity (GO:0032088) 2/79 2.002929e-02 IL10;TNFAIP3
188 regulation of protein phosphorylation (GO:0001932) 3/266 2.002929e-02 CD40;IFNG;LRRK2
189 negative regulation of cell cycle (GO:0045786) 2/80 2.002929e-02 IL10;SMAD3
190 regulation of fat cell differentiation (GO:0045598) 2/80 2.002929e-02 SMAD3;RORC
191 positive regulation of cell adhesion (GO:0045785) 2/80 2.002929e-02 IL12B;JAK2
192 response to interferon-gamma (GO:0034341) 2/80 2.002929e-02 CD40;IL23R
193 regulation of interleukin-8 production (GO:0032677) 2/81 2.041370e-02 IL10;NOS2
194 lymphocyte differentiation (GO:0030098) 2/84 2.179828e-02 IL10;IKZF1
195 B cell activation (GO:0042113) 2/85 2.207817e-02 IL10;CD40
196 positive regulation of protein catabolic process (GO:0045732) 2/85 2.207817e-02 IFNG;TNFAIP3
197 regulation of interferon-gamma production (GO:0032649) 2/86 2.235771e-02 IL23R;IL12B
198 regulation of neuron death (GO:1901214) 2/86 2.235771e-02 IFNG;LRRK2
199 positive regulation of transcription by RNA polymerase II (GO:0045944) 5/908 2.247143e-02 IL10;CD40;SMAD3;HNF4A;NRIP1
200 negative regulation of cellular process (GO:0048523) 4/566 2.247143e-02 IL10;SMAD3;HNF4A;JAK2
201 negative regulation of binding (GO:0051100) 2/88 2.247143e-02 LRRK2;JAK2
202 positive regulation of programmed cell death (GO:0043068) 3/286 2.247143e-02 NOS2;IFNG;LRRK2
203 second-messenger-mediated signaling (GO:0019932) 2/89 2.247143e-02 NOS2;LRRK2
204 positive regulation of autophagy (GO:0010508) 2/90 2.247143e-02 IFNG;LRRK2
205 regulation of lipid metabolic process (GO:0019216) 2/92 2.247143e-02 HNF4A;RORC
206 positive regulation of cellular component biogenesis (GO:0044089) 2/92 2.247143e-02 SMAD3;IFNG
207 negative regulation of hydrogen peroxide-induced neuron death (GO:1903208) 1/5 2.247143e-02 IL10
208 negative regulation of interferon-alpha production (GO:0032687) 1/5 2.247143e-02 IL10
209 regulation of cell maturation (GO:1903429) 1/5 2.247143e-02 LRRK2
210 regulation of core promoter binding (GO:1904796) 1/5 2.247143e-02 IFNG
211 regulation of germinal center formation (GO:0002634) 1/5 2.247143e-02 TNFAIP3
212 regulation of growth hormone receptor signaling pathway (GO:0060398) 1/5 2.247143e-02 JAK2
213 regulation of guanylate cyclase activity (GO:0031282) 1/5 2.247143e-02 NOS2
214 neuroinflammatory response (GO:0150076) 1/5 2.247143e-02 IFNG
215 ciliary neurotrophic factor-mediated signaling pathway (GO:0070120) 1/5 2.247143e-02 IL6ST
216 regulation of mononuclear cell proliferation (GO:0032944) 1/5 2.247143e-02 IL12B
217 regulation of morphogenesis of a branching structure (GO:0060688) 1/5 2.247143e-02 LRRK2
218 regulation of natural killer cell differentiation (GO:0032823) 1/5 2.247143e-02 PRDM1
219 peptidyl-cysteine S-nitrosylation (GO:0018119) 1/5 2.247143e-02 NOS2
220 regulation of NK T cell proliferation (GO:0051140) 1/5 2.247143e-02 IL12B
221 endothelial cell apoptotic process (GO:0072577) 1/5 2.247143e-02 IL10
222 positive regulation of CD4-positive, CD25-positive, alpha-beta regulatory T cell differentiation (GO:0032831) 1/5 2.247143e-02 IFNG
223 positive regulation of dopamine receptor signaling pathway (GO:0060161) 1/5 2.247143e-02 LRRK2
224 positive regulation of leukocyte mediated immunity (GO:0002705) 1/5 2.247143e-02 NOS2
225 positive regulation of mononuclear cell proliferation (GO:0032946) 1/5 2.247143e-02 IL12B
226 intracellular distribution of mitochondria (GO:0048312) 1/5 2.247143e-02 LRRK2
227 kidney morphogenesis (GO:0060993) 1/5 2.247143e-02 LRRK2
228 prostaglandin transport (GO:0015732) 1/5 2.247143e-02 NOS2
229 protein K29-linked deubiquitination (GO:0035523) 1/5 2.247143e-02 TNFAIP3
230 regulation of cell cycle (GO:0051726) 3/296 2.247143e-02 SMAD3;IFNG;IL12B
231 innate immune response (GO:0045087) 3/302 2.364532e-02 CD40;NOS2;IL23R
232 regulation of MAP kinase activity (GO:0043405) 2/97 2.409510e-02 CD40;LRRK2
233 cellular response to chemical stress (GO:0062197) 2/101 2.468977e-02 LRRK2;NCF4
234 negative regulation of blood vessel endothelial cell proliferation involved in sprouting angiogenesis (GO:1903588) 1/6 2.468977e-02 IL12B
235 activation of Janus kinase activity (GO:0042976) 1/6 2.468977e-02 JAK2
236 negative regulation of cellular extravasation (GO:0002692) 1/6 2.468977e-02 PTGER4
237 negative regulation of cytosolic calcium ion concentration (GO:0051481) 1/6 2.468977e-02 SMAD3
238 negative regulation of establishment of protein localization to mitochondrion (GO:1903748) 1/6 2.468977e-02 LRRK2
239 negative regulation of excitatory postsynaptic potential (GO:0090394) 1/6 2.468977e-02 LRRK2
240 negative regulation of toll-like receptor 2 signaling pathway (GO:0034136) 1/6 2.468977e-02 TNFAIP3
241 regulation of immunoglobulin mediated immune response (GO:0002889) 1/6 2.468977e-02 IL10
242 regulation of protein autoubiquitination (GO:1902498) 1/6 2.468977e-02 LRRK2
243 regulation of retrograde transport, endosome to Golgi (GO:1905279) 1/6 2.468977e-02 LRRK2
244 regulation of vitamin D biosynthetic process (GO:0060556) 1/6 2.468977e-02 IFNG
245 response to manganese ion (GO:0010042) 1/6 2.468977e-02 LRRK2
246 positive regulation of natural killer cell mediated cytotoxicity directed against tumor cell target (GO:0002860) 1/6 2.468977e-02 IL12B
247 positive regulation of natural killer cell mediated immune response to tumor cell (GO:0002857) 1/6 2.468977e-02 IL12B
248 telencephalon cell migration (GO:0022029) 1/6 2.468977e-02 LRRK2
249 positive regulation of Wnt signaling pathway, planar cell polarity pathway (GO:2000096) 1/6 2.468977e-02 RSPO3
250 protein deubiquitination involved in ubiquitin-dependent protein catabolic process (GO:0071947) 1/6 2.468977e-02 TNFAIP3
251 protein K29-linked ubiquitination (GO:0035519) 1/6 2.468977e-02 RNF186
252 regulation of protein ubiquitination (GO:0031396) 2/109 2.706172e-02 LRRK2;TNFAIP3
253 response to tumor necrosis factor (GO:0034612) 2/110 2.706172e-02 CD40;JAK2
254 arginine catabolic process (GO:0006527) 1/7 2.706172e-02 NOS2
255 regulation of calcidiol 1-monooxygenase activity (GO:0060558) 1/7 2.706172e-02 IFNG
256 negative regulation of membrane protein ectodomain proteolysis (GO:0051045) 1/7 2.706172e-02 IL10
257 regulation of extracellular matrix assembly (GO:1901201) 1/7 2.706172e-02 SMAD3
258 cellular response to prostaglandin E stimulus (GO:0071380) 1/7 2.706172e-02 PTGER4
259 nodal signaling pathway (GO:0038092) 1/7 2.706172e-02 SMAD3
260 regulation of natural killer cell mediated cytotoxicity directed against tumor cell target (GO:0002858) 1/7 2.706172e-02 IL12B
261 regulation of T cell tolerance induction (GO:0002664) 1/7 2.706172e-02 IL2RA
262 regulation of transforming growth factor beta2 production (GO:0032909) 1/7 2.706172e-02 SMAD3
263 positive regulation of interleukin-23 production (GO:0032747) 1/7 2.706172e-02 IFNG
264 positive regulation of lymphocyte apoptotic process (GO:0070230) 1/7 2.706172e-02 IL10
265 SMAD protein complex assembly (GO:0007183) 1/7 2.706172e-02 SMAD3
266 T-helper 17 cell differentiation (GO:0072539) 1/7 2.706172e-02 RORC
267 protein localization to endoplasmic reticulum exit site (GO:0070973) 1/7 2.706172e-02 LRRK2
268 positive regulation of metabolic process (GO:0009893) 2/113 2.799051e-02 IFNG;JAK2
269 activation of protein kinase activity (GO:0032147) 2/114 2.836188e-02 TNFSF15;JAK2
270 cellular response to molecule of bacterial origin (GO:0071219) 2/115 2.855549e-02 IL10;TNFAIP3
271 regulation of alpha-beta T cell differentiation (GO:0046637) 1/8 2.855549e-02 PRDM1
272 regulation of chemokine (C-C motif) ligand 5 production (GO:0071649) 1/8 2.855549e-02 IL10
273 regulation of dopamine receptor signaling pathway (GO:0060159) 1/8 2.855549e-02 LRRK2
274 negative regulation of response to reactive oxygen species (GO:1901032) 1/8 2.855549e-02 LRRK2
275 cellular response to interleukin-21 (GO:0098757) 1/8 2.855549e-02 STAT4
276 regulation of interleukin-18 production (GO:0032661) 1/8 2.855549e-02 IL10
277 cytoplasmic sequestering of NF-kappaB (GO:0007253) 1/8 2.855549e-02 IL10
278 regulation of nitric oxide metabolic process (GO:0080164) 1/8 2.855549e-02 JAK2
279 regulation of nitrogen compound metabolic process (GO:0051171) 1/8 2.855549e-02 IFNG
280 regulation of protein ADP-ribosylation (GO:0010835) 1/8 2.855549e-02 IFNG
281 positive regulation of adaptive immune response (GO:0002821) 1/8 2.855549e-02 IL6ST
282 regulation of response to wounding (GO:1903034) 1/8 2.855549e-02 IL10
283 regulation of toll-like receptor 3 signaling pathway (GO:0034139) 1/8 2.855549e-02 TNFAIP3
284 positive regulation of cysteine-type endopeptidase activity involved in apoptotic signaling pathway (GO:2001269) 1/8 2.855549e-02 JAK2
285 regulation of vascular wound healing (GO:0061043) 1/8 2.855549e-02 TNFAIP3
286 interleukin-21-mediated signaling pathway (GO:0038114) 1/8 2.855549e-02 STAT4
287 positive regulation of steroid biosynthetic process (GO:0010893) 1/8 2.855549e-02 IFNG
288 tyrosine phosphorylation of STAT protein (GO:0007260) 1/8 2.855549e-02 JAK2
289 negative regulation of amyloid-beta clearance (GO:1900222) 1/8 2.855549e-02 IFNG
290 cellular response to lipopolysaccharide (GO:0071222) 2/120 2.902446e-02 IL10;TNFAIP3
291 cellular response to interferon-gamma (GO:0071346) 2/121 2.938750e-02 IFNG;JAK2
292 regulation of anatomical structure morphogenesis (GO:0022603) 2/123 2.954877e-02 LRRK2;TNFAIP3
293 cellular response to organic substance (GO:0071310) 2/123 2.954877e-02 SMAD3;LRRK2
294 cellular response to oxidative stress (GO:0034599) 2/125 2.954877e-02 LRRK2;NCF4
295 negative regulation of cell growth (GO:0030308) 2/126 2.954877e-02 SMAD3;HNF4A
296 negative regulation of growth (GO:0045926) 2/126 2.954877e-02 SMAD3;HNF4A
297 negative regulation of bone resorption (GO:0045779) 1/9 2.954877e-02 TNFAIP3
298 negative regulation of leukocyte proliferation (GO:0070664) 1/9 2.954877e-02 TNFAIP3
299 regulation of complement-dependent cytotoxicity (GO:1903659) 1/9 2.954877e-02 IL10
300 CD40 signaling pathway (GO:0023035) 1/9 2.954877e-02 CD40
301 negative regulation of production of molecular mediator of immune response (GO:0002701) 1/9 2.954877e-02 IL10
302 regulation of ER to Golgi vesicle-mediated transport (GO:0060628) 1/9 2.954877e-02 LRRK2
303 regulation of interleukin-23 production (GO:0032667) 1/9 2.954877e-02 IFNG
304 regulation of leukocyte mediated cytotoxicity (GO:0001910) 1/9 2.954877e-02 NOS2
305 ornithine metabolic process (GO:0006591) 1/9 2.954877e-02 HNF4A
306 peptidyl-cysteine modification (GO:0018198) 1/9 2.954877e-02 NOS2
307 regulation of protein deacetylation (GO:0090311) 1/9 2.954877e-02 IFNG
308 epithelial cell apoptotic process (GO:1904019) 1/9 2.954877e-02 IL10
309 positive regulation of B cell differentiation (GO:0045579) 1/9 2.954877e-02 IL10
310 regulation of Wnt signaling pathway, planar cell polarity pathway (GO:2000095) 1/9 2.954877e-02 RSPO3
311 positive regulation of extracellular matrix assembly (GO:1901203) 1/9 2.954877e-02 SMAD3
312 intestinal epithelial cell differentiation (GO:0060575) 1/9 2.954877e-02 IL6ST
313 positive regulation of protein kinase C signaling (GO:0090037) 1/9 2.954877e-02 CD40
314 T-helper 1 type immune response (GO:0042088) 1/9 2.954877e-02 IL12B
315 positive regulation of macromolecule biosynthetic process (GO:0010557) 2/129 3.067746e-02 IFNG;JAK2
316 arginine metabolic process (GO:0006525) 1/10 3.112631e-02 NOS2
317 negative regulation of heterotypic cell-cell adhesion (GO:0034115) 1/10 3.112631e-02 IL10
318 B cell homeostasis (GO:0001782) 1/10 3.112631e-02 TNFAIP3
319 regulation of cell-cell adhesion involved in gastrulation (GO:0070587) 1/10 3.112631e-02 IL10
320 negative regulation of receptor binding (GO:1900121) 1/10 3.112631e-02 IL10
321 cellular response to dopamine (GO:1903351) 1/10 3.112631e-02 LRRK2
322 negative regulation of toll-like receptor 4 signaling pathway (GO:0034144) 1/10 3.112631e-02 TNFAIP3
323 cellular response to prostaglandin stimulus (GO:0071379) 1/10 3.112631e-02 PTGER4
324 regulation of hydrogen peroxide-induced cell death (GO:1903205) 1/10 3.112631e-02 LRRK2
325 negative regulation of vascular endothelial growth factor signaling pathway (GO:1900747) 1/10 3.112631e-02 IL12B
326 regulation of tau-protein kinase activity (GO:1902947) 1/10 3.112631e-02 IFNG
327 positive regulation of circadian rhythm (GO:0042753) 1/10 3.112631e-02 RORC
328 response to dopamine (GO:1903350) 1/10 3.112631e-02 LRRK2
329 positive regulation of tissue remodeling (GO:0034105) 1/10 3.112631e-02 IL12B
330 primary miRNA processing (GO:0031053) 1/10 3.112631e-02 SMAD3
331 protein K11-linked deubiquitination (GO:0035871) 1/10 3.112631e-02 TNFAIP3
332 negative regulation of inflammatory response to antigenic stimulus (GO:0002862) 2/136 3.218490e-02 PTGER4;IL10
333 regulation of inflammatory response to antigenic stimulus (GO:0002861) 2/137 3.253781e-02 PTGER4;IL10
334 enzyme linked receptor protein signaling pathway (GO:0007167) 2/140 3.254603e-02 JAK2;IL6ST
335 transcription initiation from RNA polymerase II promoter (GO:0006367) 2/140 3.254603e-02 HNF4A;RORC
336 negative regulation of bone remodeling (GO:0046851) 1/11 3.254603e-02 TNFAIP3
337 regulation of cytoplasmic transport (GO:1903649) 1/11 3.254603e-02 LRRK2
338 negative regulation of oxidative stress-induced neuron death (GO:1903204) 1/11 3.254603e-02 IL10
339 negative regulation of protein maturation (GO:1903318) 1/11 3.254603e-02 LRRK2
340 cellular response to interleukin-2 (GO:0071352) 1/11 3.254603e-02 IL2RA
341 regulation of mitochondrial depolarization (GO:0051900) 1/11 3.254603e-02 LRRK2
342 positive regulation of cellular respiration (GO:1901857) 1/11 3.254603e-02 IFNG
343 regulation of toll-like receptor 2 signaling pathway (GO:0034135) 1/11 3.254603e-02 TNFAIP3
344 response to corticosteroid (GO:0031960) 1/11 3.254603e-02 IL10
345 response to prostaglandin E (GO:0034695) 1/11 3.254603e-02 PTGER4
346 response to sterol (GO:0036314) 1/11 3.254603e-02 RORC
347 interleukin-2-mediated signaling pathway (GO:0038110) 1/11 3.254603e-02 IL2RA
348 positive regulation of non-canonical Wnt signaling pathway (GO:2000052) 1/11 3.254603e-02 RSPO3
349 positive regulation of cellular catabolic process (GO:0031331) 2/141 3.278813e-02 IFNG;LRRK2
350 protein localization to organelle (GO:0033365) 2/142 3.313523e-02 LRRK2;RNF186
351 negative regulation of B cell proliferation (GO:0030889) 1/12 3.449149e-02 IL10
352 adipose tissue development (GO:0060612) 1/12 3.449149e-02 RORC
353 negative regulation of cellular response to vascular endothelial growth factor stimulus (GO:1902548) 1/12 3.449149e-02 IL12B
354 regulation of B cell apoptotic process (GO:0002902) 1/12 3.449149e-02 IL10
355 cellular response to growth hormone stimulus (GO:0071378) 1/12 3.449149e-02 JAK2
356 phospholipid homeostasis (GO:0055091) 1/12 3.449149e-02 HNF4A
357 positive regulation of leukocyte proliferation (GO:0070665) 1/12 3.449149e-02 IL12B
358 mitochondrion distribution (GO:0048311) 1/12 3.449149e-02 LRRK2
359 regulation of cytosolic calcium ion concentration (GO:0051480) 2/148 3.483861e-02 PTGER4;SMAD3
360 positive regulation of intracellular protein transport (GO:0090316) 2/148 3.483861e-02 SMAD3;IFNG
361 negative regulation of autophagosome assembly (GO:1902902) 1/13 3.603399e-02 LRRK2
362 purine ribonucleoside triphosphate metabolic process (GO:0009205) 1/13 3.603399e-02 LRRK2
363 regulation of actomyosin structure organization (GO:0110020) 1/13 3.603399e-02 PTGER4
364 negative regulation of macromolecule biosynthetic process (GO:0010558) 1/13 3.603399e-02 IL10
365 regulation of lysosomal lumen pH (GO:0035751) 1/13 3.603399e-02 LRRK2
366 regulation of receptor signaling pathway via STAT (GO:1904892) 1/13 3.603399e-02 JAK2
367 regulation of response to stress (GO:0080134) 1/13 3.603399e-02 IL10
368 response to UV-B (GO:0010224) 1/13 3.603399e-02 IL12B
369 icosanoid secretion (GO:0032309) 1/13 3.603399e-02 NOS2
370 macrophage activation involved in immune response (GO:0002281) 1/13 3.603399e-02 IFNG
371 positive regulation of purine nucleotide biosynthetic process (GO:1900373) 1/13 3.603399e-02 NOS2
372 protein autophosphorylation (GO:0046777) 2/159 3.776375e-02 LRRK2;JAK2
373 negative regulation of interleukin-12 production (GO:0032695) 1/14 3.776375e-02 IL10
374 cytoplasmic sequestering of transcription factor (GO:0042994) 1/14 3.776375e-02 IL10
375 defense response to protozoan (GO:0042832) 1/14 3.776375e-02 CD40
376 regulation of protein kinase C signaling (GO:0090036) 1/14 3.776375e-02 CD40
377 positive regulation of cyclase activity (GO:0031281) 1/14 3.776375e-02 NOS2
378 growth hormone receptor signaling pathway via JAK-STAT (GO:0060397) 1/14 3.776375e-02 JAK2
379 immune response-regulating cell surface receptor signaling pathway (GO:0002768) 1/14 3.776375e-02 CD40
380 positive regulation of protein deacetylation (GO:0090312) 1/14 3.776375e-02 IFNG
381 positive regulation of SMAD protein signal transduction (GO:0060391) 1/14 3.776375e-02 JAK2
382 negative regulation of blood pressure (GO:0045776) 1/15 3.890427e-02 NOS2
383 negative regulation of endoplasmic reticulum stress-induced intrinsic apoptotic signaling pathway (GO:1902236) 1/15 3.890427e-02 LRRK2
384 negative regulation of protein processing (GO:0010955) 1/15 3.890427e-02 LRRK2
385 regulation of integrin activation (GO:0033623) 1/15 3.890427e-02 PTGER4
386 nitric oxide biosynthetic process (GO:0006809) 1/15 3.890427e-02 NOS2
387 regulation of non-canonical Wnt signaling pathway (GO:2000050) 1/15 3.890427e-02 RSPO3
388 positive regulation of acute inflammatory response (GO:0002675) 1/15 3.890427e-02 IL6ST
389 positive regulation of exosomal secretion (GO:1903543) 1/15 3.890427e-02 IFNG
390 GTP metabolic process (GO:0046039) 1/15 3.890427e-02 LRRK2
391 positive regulation of heterotypic cell-cell adhesion (GO:0034116) 1/15 3.890427e-02 IL10
392 positive regulation of lyase activity (GO:0051349) 1/15 3.890427e-02 NOS2
393 positive regulation of membrane protein ectodomain proteolysis (GO:0051044) 1/15 3.890427e-02 IFNG
394 superoxide anion generation (GO:0042554) 1/15 3.890427e-02 NCF4
395 macrophage differentiation (GO:0030225) 1/15 3.890427e-02 IFNG
396 mammary gland epithelium development (GO:0061180) 1/15 3.890427e-02 JAK2
397 DNA-templated transcription, initiation (GO:0006352) 2/168 3.986146e-02 HNF4A;RORC
398 activation of NF-kappaB-inducing kinase activity (GO:0007250) 1/16 3.986146e-02 TNFSF15
399 negative regulation of epithelial cell differentiation (GO:0030857) 1/16 3.986146e-02 IFNG
400 regulation of amyloid-beta clearance (GO:1900221) 1/16 3.986146e-02 IFNG
401 regulation of blood vessel endothelial cell proliferation involved in sprouting angiogenesis (GO:1903587) 1/16 3.986146e-02 IL12B
402 regulation of cellular carbohydrate metabolic process (GO:0010675) 1/16 3.986146e-02 RORC
403 regulation of defense response to virus (GO:0050688) 1/16 3.986146e-02 TNFAIP3
404 cellular response to sterol (GO:0036315) 1/16 3.986146e-02 RORC
405 regulation of interleukin-1 production (GO:0032652) 1/16 3.986146e-02 IL10
406 regulation of isotype switching (GO:0045191) 1/16 3.986146e-02 IL10
407 nitric oxide metabolic process (GO:0046209) 1/16 3.986146e-02 NOS2
408 positive regulation of alpha-beta T cell proliferation (GO:0046641) 1/16 3.986146e-02 IL12B
409 positive regulation of endothelial cell apoptotic process (GO:2000353) 1/16 3.986146e-02 CD40
410 glutamine family amino acid catabolic process (GO:0009065) 1/16 3.986146e-02 NOS2
411 positive regulation of isotype switching (GO:0045830) 1/16 3.986146e-02 CD40
412 protein localization to endoplasmic reticulum (GO:0070972) 1/16 3.986146e-02 LRRK2
413 negative regulation of nucleic acid-templated transcription (GO:1903507) 3/464 4.161928e-02 IFNG;HNF4A;IKZF1
414 negative regulation of chemokine production (GO:0032682) 1/17 4.161928e-02 IL10
415 negative regulation of cytokine production involved in immune response (GO:0002719) 1/17 4.161928e-02 IL10
416 regulation of cell killing (GO:0031341) 1/17 4.161928e-02 IL10
417 negative regulation of vascular associated smooth muscle cell proliferation (GO:1904706) 1/17 4.161928e-02 IL10
418 regulation of neuroblast proliferation (GO:1902692) 1/17 4.161928e-02 LRRK2
419 positive regulation of muscle hypertrophy (GO:0014742) 1/17 4.161928e-02 IL6ST
420 regulation of mitotic cell cycle (GO:0007346) 2/178 4.222887e-02 IL10;SMAD3
421 positive regulation of cellular biosynthetic process (GO:0031328) 2/180 4.291341e-02 SMAD3;IFNG
422 regulation of adaptive immune response (GO:0002819) 1/18 4.291341e-02 IL6ST
423 negative regulation of interleukin-8 production (GO:0032717) 1/18 4.291341e-02 IL10
424 nitric oxide mediated signal transduction (GO:0007263) 1/18 4.291341e-02 NOS2
425 regulation of membrane depolarization (GO:0003254) 1/18 4.291341e-02 LRRK2
426 positive regulation of amyloid-beta formation (GO:1902004) 1/18 4.291341e-02 IFNG
427 positive regulation of cardiac muscle hypertrophy (GO:0010613) 1/18 4.291341e-02 IL6ST
428 regulation of transforming growth factor beta production (GO:0071634) 1/18 4.291341e-02 SMAD3
429 positive regulation of extracellular matrix organization (GO:1903055) 1/18 4.291341e-02 SMAD3
430 positive regulation of peptidyl-serine phosphorylation of STAT protein (GO:0033141) 1/18 4.291341e-02 IFNG
431 activin receptor signaling pathway (GO:0032924) 1/19 4.424043e-02 SMAD3
432 regulation of epithelial cell differentiation (GO:0030856) 1/19 4.424043e-02 IFNG
433 regulation of exosomal secretion (GO:1903541) 1/19 4.424043e-02 IFNG
434 regulation of lymphocyte proliferation (GO:0050670) 1/19 4.424043e-02 IL12B
435 regulation of peptidyl-serine phosphorylation of STAT protein (GO:0033139) 1/19 4.424043e-02 IFNG
436 excitatory postsynaptic potential (GO:0060079) 1/19 4.424043e-02 LRRK2
437 regulation of synaptic vesicle exocytosis (GO:2000300) 1/19 4.424043e-02 LRRK2
438 regulation of vascular endothelial growth factor signaling pathway (GO:1900746) 1/19 4.424043e-02 IL12B
439 mitochondrion localization (GO:0051646) 1/19 4.424043e-02 LRRK2
440 myeloid cell activation involved in immune response (GO:0002275) 1/19 4.424043e-02 IFNG
441 regulation of GTPase activity (GO:0043087) 2/189 4.496435e-02 CD40;LRRK2
442 negative regulation of cell differentiation (GO:0045596) 2/191 4.560699e-02 SMAD3;IFNG
443 regulation of acute inflammatory response (GO:0002673) 1/20 4.560699e-02 IL6ST
444 regulation of lymphocyte differentiation (GO:0045619) 1/20 4.560699e-02 PRDM1
445 regulation of protein kinase A signaling (GO:0010738) 1/20 4.560699e-02 LRRK2
446 regulation of tissue remodeling (GO:0034103) 1/20 4.560699e-02 IL12B
447 growth hormone receptor signaling pathway (GO:0060396) 1/20 4.560699e-02 JAK2
448 positive regulation of natural killer cell mediated cytotoxicity (GO:0045954) 1/20 4.560699e-02 IL12B
449 positive regulation of nitrogen compound metabolic process (GO:0051173) 1/20 4.560699e-02 IFNG
450 negative regulation of macromolecule metabolic process (GO:0010605) 2/194 4.614804e-02 NOS2;IFNG
451 regulation of programmed cell death (GO:0043067) 2/194 4.614804e-02 LRRK2;JAK2
452 cellular response to estradiol stimulus (GO:0071392) 1/21 4.691709e-02 NRIP1
453 positive regulation of glycolytic process (GO:0045821) 1/21 4.691709e-02 IFNG
454 innate immune response in mucosa (GO:0002227) 1/21 4.691709e-02 NOS2
455 positive regulation of phosphatase activity (GO:0010922) 1/21 4.691709e-02 IFNG
456 positive regulation of purine nucleotide metabolic process (GO:1900544) 1/21 4.691709e-02 IFNG
457 positive regulation of transcription regulatory region DNA binding (GO:2000679) 1/21 4.691709e-02 IFNG
458 positive regulation of vascular associated smooth muscle cell proliferation (GO:1904707) 1/21 4.691709e-02 IL10
459 regulation of signal transduction (GO:0009966) 2/198 4.708871e-02 LRRK2;RSPO3
460 regulation of macromolecule metabolic process (GO:0060255) 2/200 4.786710e-02 IL10;PRDM1
461 negative regulation of interleukin-2 production (GO:0032703) 1/22 4.848545e-02 TNFAIP3
462 negative regulation of lymphocyte activation (GO:0051250) 1/22 4.848545e-02 TNFAIP3
463 regulation of endoplasmic reticulum stress-induced intrinsic apoptotic signaling pathway (GO:1902235) 1/22 4.848545e-02 LRRK2
464 positive regulation of amyloid precursor protein catabolic process (GO:1902993) 1/22 4.848545e-02 IFNG
465 regulation of angiogenesis (GO:0045765) 2/203 4.867177e-02 CD40;TNFAIP3
466 negative regulation of GTPase activity (GO:0034260) 1/23 4.969388e-02 LRRK2
467 negative regulation of intracellular protein transport (GO:0090317) 1/23 4.969388e-02 LRRK2
468 regulation of neural precursor cell proliferation (GO:2000177) 1/23 4.969388e-02 LRRK2
469 ERK1 and ERK2 cascade (GO:0070371) 1/23 4.969388e-02 PTGER4
470 regulation of SMAD protein signal transduction (GO:0060390) 1/23 4.969388e-02 JAK2
471 regulation of steroid metabolic process (GO:0019218) 1/23 4.969388e-02 RORC
472 regulation of toll-like receptor 4 signaling pathway (GO:0034143) 1/23 4.969388e-02 TNFAIP3
473 positive regulation of epithelial cell apoptotic process (GO:1904037) 1/23 4.969388e-02 CD40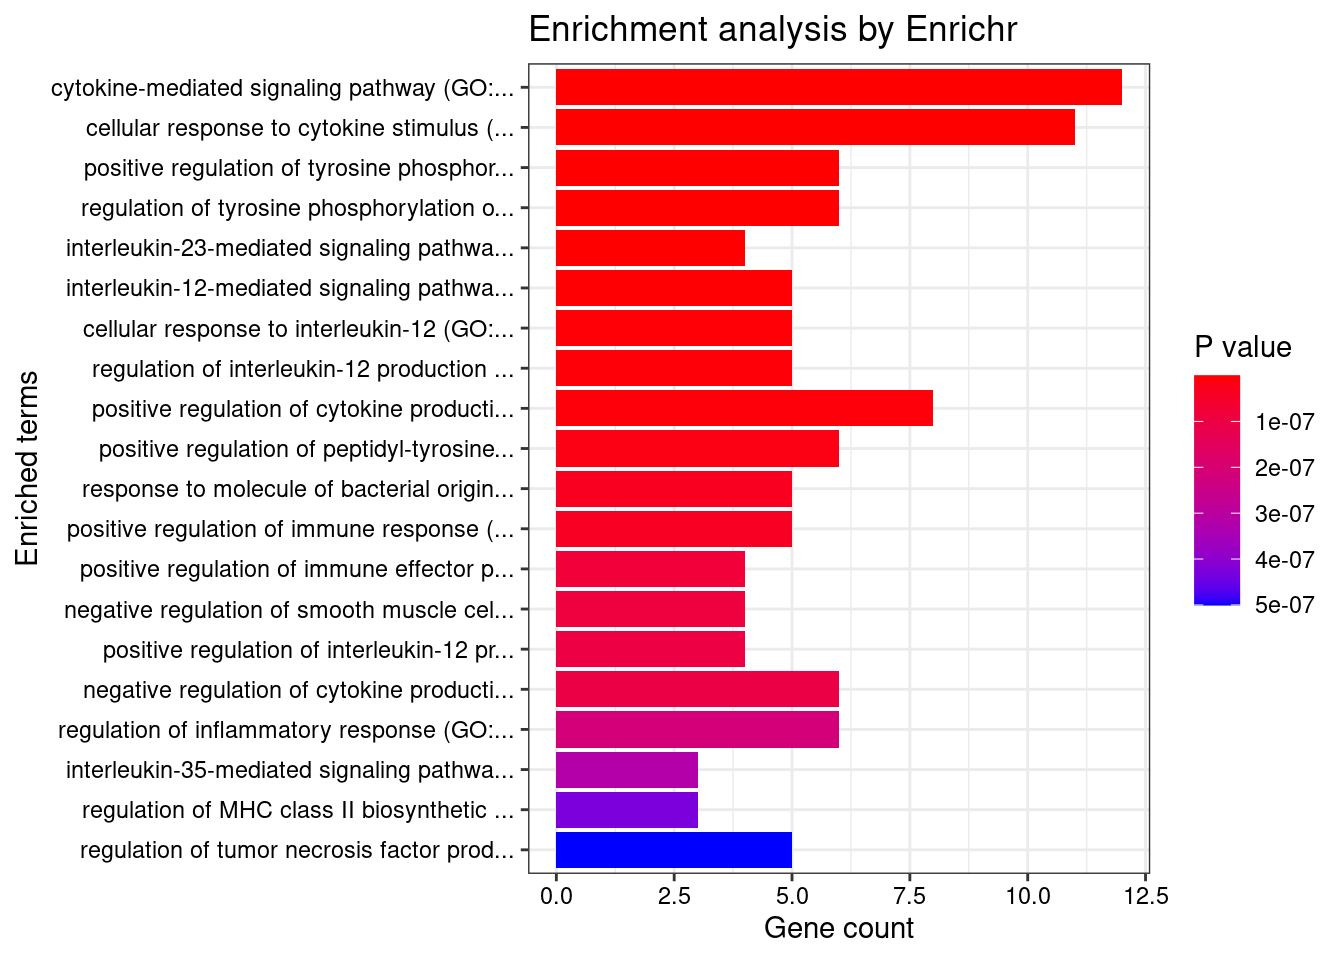
| Version | Author | Date |
|---|---|---|
| 177114d | wesleycrouse | 2022-05-04 |
save(enrich_results, file="ABC_IBD_genes_enrichment.RData")
write.csv(enrich_results, file="ABC_IBD_genes_enrichment.csv")
Summary table for selected tissue groups
#mapping genename to ensembl
genename_mapping <- data.frame(genename=as.character(), ensembl_id=as.character(), weight=as.character())

for (i in 1:length(results_dirs)){
  results_dir <- results_dirs[i]
  weight <- rev(unlist(strsplit(results_dir, "/")))[1]
  analysis_id <- paste(trait_id, weight, sep="_")

  sqlite <- RSQLite::dbDriver("SQLite")
  db = RSQLite::dbConnect(sqlite, paste0("/project2/compbio/predictdb/mashr_models/mashr_", weight, ".db"))
  query <- function(...) RSQLite::dbGetQuery(db, ...)
  gene_info <- query("select gene, genename, gene_type from extra")
  RSQLite::dbDisconnect(db)

  genename_mapping <- rbind(genename_mapping, cbind(gene_info[,c("gene","genename")],weight))
}

genename_mapping <- genename_mapping[,c("gene","genename"),drop=F]
genename_mapping <- genename_mapping[!duplicated(genename_mapping),]
selected_groups <- c("Blood or Immune", "Digestive")
selected_genes <- unique(unlist(sapply(df_group[selected_groups], function(x){x$ctwas})))
weight_groups <- weight_groups[order(weight_groups$group),]
selected_weights <- weight_groups$weight[weight_groups$group %in% selected_groups]
gene_pips_by_weight <- gene_pips_by_weight_bkup
results_table <- as.data.frame(round(gene_pips_by_weight[selected_genes,selected_weights],3))
results_table$n_discovered <- apply(results_table>0.8,1,sum,na.rm=T)
results_table$n_imputed <- apply(results_table, 1, function(x){sum(!is.na(x))-1})
results_table$ensembl_gene_id <- genename_mapping$gene[sapply(rownames(results_table), match, table=genename_mapping$genename)]
results_table$ensembl_gene_id <- sapply(results_table$ensembl_gene_id, function(x){unlist(strsplit(x, "[.]"))[1]})
results_table <- cbind(results_table, G_list[sapply(results_table$ensembl_gene_id, match, table=G_list$ensembl_gene_id),c("chromosome_name","start_position","end_position","nearby","nearest")])
results_table$known <- rownames(results_table) %in% known_genes
load("group_enrichment_results.RData")
group_enrichment_results$group <- as.character(group_enrichment_results$group)
group_enrichment_results$db <- as.character(group_enrichment_results$db)
group_enrichment_results <- group_enrichment_results[group_enrichment_results$group %in% selected_groups,,drop=F]
results_table$enriched_terms <- sapply(rownames(results_table), function(x){paste(group_enrichment_results$Term[grep(x, group_enrichment_results$Genes)],collapse="; ")})
write.csv(results_table, file=paste0("summary_table_ulcerative_colitis.csv"))Overlap of enrichment analysis
#collect GO terms for selected genes
db <- "GO_Biological_Process_2021"
GO_enrichment <- enrichr(selected_genes, db)
Uploading data to Enrichr... Done.
Querying GO_Biological_Process_2021... Done.
Parsing results... Done.enrich_results_selected_genes <- GO_enrichment[[db]]
load("ABC_IBD_genes_enrichment.RData")
enrich_results_known_genes <- enrich_results
overlap_table <- as.data.frame(matrix(F, nrow(enrich_results_known_genes), length(selected_genes)))
overlap_table <- cbind(enrich_results_known_genes$Term, overlap_table)
colnames(overlap_table) <- c("Term", selected_genes)
for (i in 1:nrow(overlap_table)){
Term <- overlap_table$Term[i]
if (Term %in% enrich_results_selected_genes$Term){
Term_genes <- enrich_results_selected_genes$Genes[enrich_results_selected_genes$Term==Term]
overlap_table[i, unlist(strsplit(Term_genes, ";"))] <- T
}
}
write.csv(overlap_table, file="GO_overlap_ulcerative_colitis.csv")Results and figures for the paper
Gene expression explains a small proportion of heritability
Note that the published MESC results in Yao et al. analyzed the same traits from Finucane 2015, which used ulcerative colitis summary statistics from Jostin’s 2012. We used more recent results from de Lange 2017. MESC also used prediction models from GTEx v7 while we used prediction models from GTEx v8.
Trend lines are fit with (red) and without (blue) an intercept.
library(ggrepel)

mesc_results <- as.data.frame(readxl::read_xlsx("MESC_published_results.xlsx", sheet="Table S4", skip=1))
mesc_results <- mesc_results[mesc_results$Trait %in% "Ulcerative Colitis",]
rownames(mesc_results) <- mesc_results$`Expression score tissue`
mesc_results <- mesc_results[sapply(selected_weights, function(x){paste(unlist(strsplit(x,"_")),collapse=" ")}),]


output$pve_med <- output$pve_g / (output$pve_g + output$pve_s)
rownames(output) <- output$weight
df_plot <- output[selected_weights,]

df_plot <- data.frame(tissue=as.character(mesc_results$`Expression score tissue`),  mesc=as.numeric(mesc_results$`h2med/h2g`), ctwas=(df_plot$pve_med))

p <- ggplot(df_plot, aes(mesc, ctwas, label = tissue)) + geom_point(color = "blue", size=3)
p <- p + geom_text_repel() + labs(title = "Heritability Explained by Gene Expression in Tissues") + ylab("(Gene PVE) / (Total PVE) using cTWAS") + xlab("(h2med) / (h2g) using MESC")
p <- p + geom_abline(slope=1, intercept=0, linetype=3)
p <- p + xlim(0,0.2) + ylim(0,0.2)

fit <- lm(ctwas~0+mesc, data=df_plot)
p <- p + geom_abline(slope=summary(fit)$coefficients["mesc","Estimate"], intercept=0, linetype=2, color="blue")

fit <- lm(ctwas~mesc, data=df_plot)
p <- p + geom_abline(slope=summary(fit)$coefficients["mesc","Estimate"], intercept=summary(fit)$coefficients["(Intercept)","Estimate"], linetype=3, color="red")

p <- p + theme_bw()

p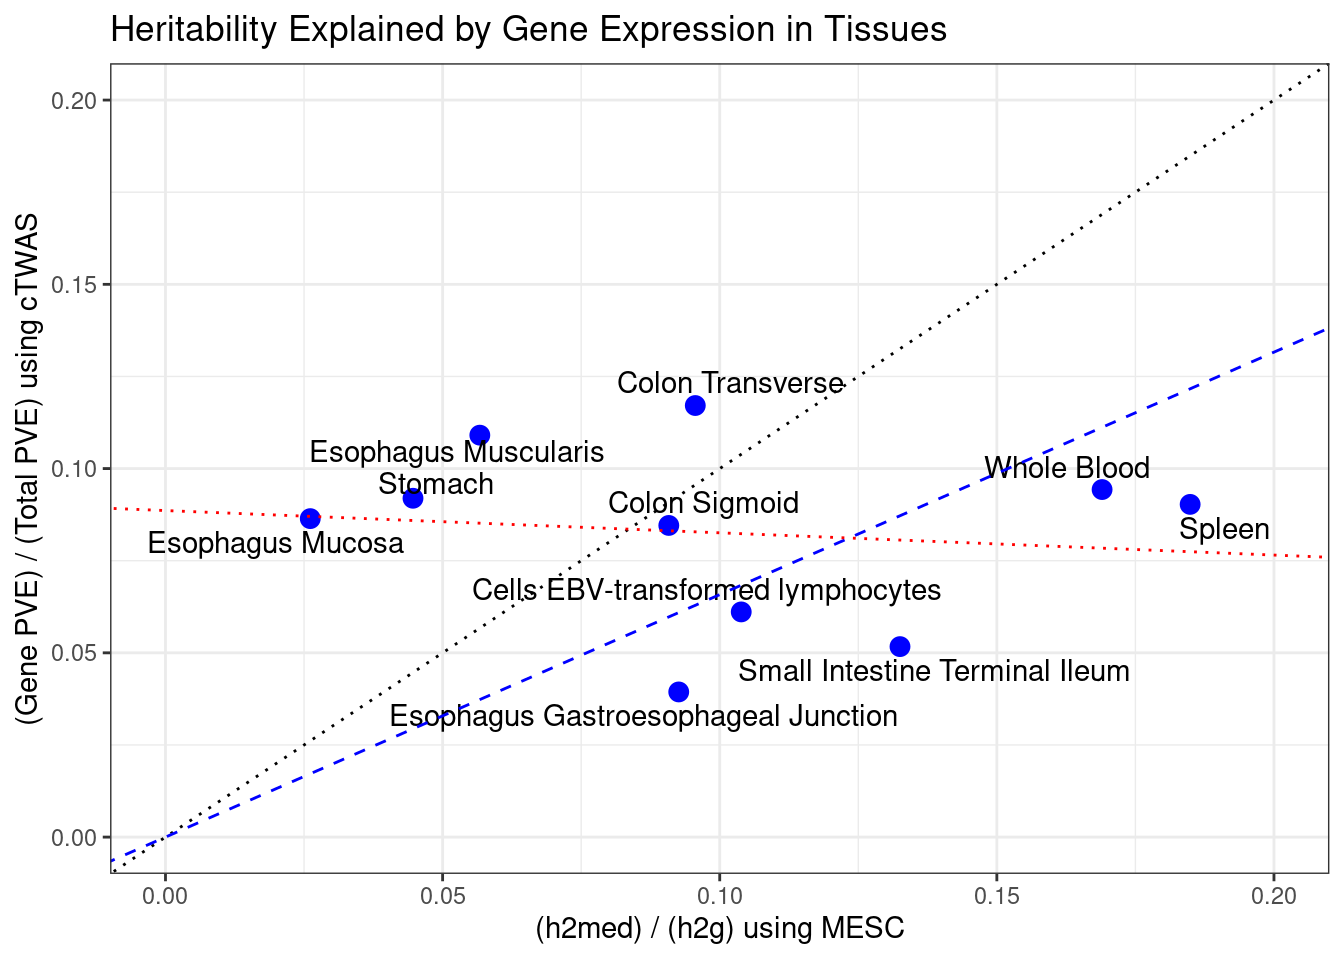
#report correlation between cTWAS and MESC
cor(df_plot$mesc, df_plot$ctwas)
[1] -0.1253261cTWAS finds fewer genes than TWAS
Trend lines are fit with (red) and without (blue) an intercept.
df_plot <- output
df_plot <- df_plot[selected_weights,,drop=F]
df_plot$tissue <- sapply(df_plot$weight, function(x){paste(unlist(strsplit(x,"_")),collapse=" ")})

p <- ggplot(df_plot, aes(n_twas, n_ctwas, label = tissue)) + geom_point(color = "blue", size=3)
p <- p + geom_text_repel() + labs(title = "Number of Genes Discovered using cTWAS and TWAS by Tissue") + ylab("Number of cTWAS genes") + xlab("Number of TWAS genes")
p <- p + scale_y_continuous(breaks=seq(0,10,2))
p <- p + scale_x_continuous(breaks=seq(0,90,5))
p <- p + theme_bw()

fit <- lm(n_ctwas~0+n_twas, data=df_plot)
p <- p + geom_abline(slope=summary(fit)$coefficients["n_twas","Estimate"], intercept=0, linetype=2, color="blue")

fit <- lm(n_ctwas~n_twas, data=df_plot)
p <- p + geom_abline(slope=summary(fit)$coefficients["n_twas","Estimate"], intercept=summary(fit)$coefficients["(Intercept)","Estimate"], linetype=3, color="red")

p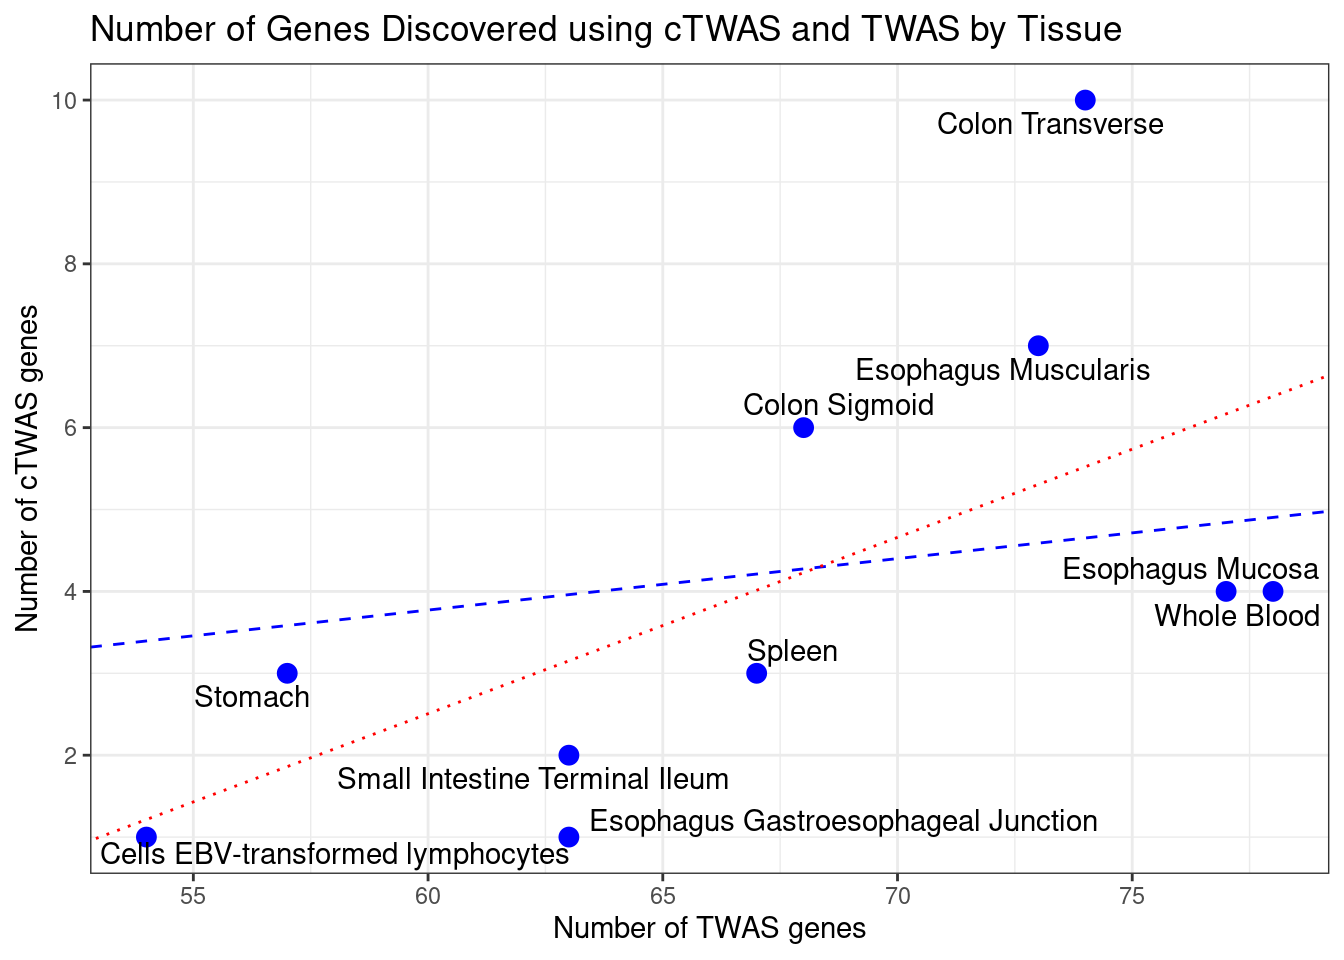
#report correlation between cTWAS and TWAS
cor(df_plot$n_ctwas, df_plot$n_twas)
[1] 0.6211548Most cTWAS genes were found in a small number of tissues
#number of tissues with PIP>0.5 for cTWAS genes
gene_pips_by_weight_bkup <- gene_pips_by_weight
gene_pips_by_weight[is.na(gene_pips_by_weight)] <- 0

gene_pips_by_weight <- gene_pips_by_weight[,selected_weights,drop=F]

ctwas_frequency <- rowSums(gene_pips_by_weight>0.5)
hist(ctwas_frequency, col="grey", breaks=0:max(ctwas_frequency), xlim=c(0,ncol(gene_pips_by_weight)),
     xlab="Number of Tissues with PIP>0.5",
     ylab="Number of cTWAS Genes",
     main="Tissue Specificity for cTWAS Genes")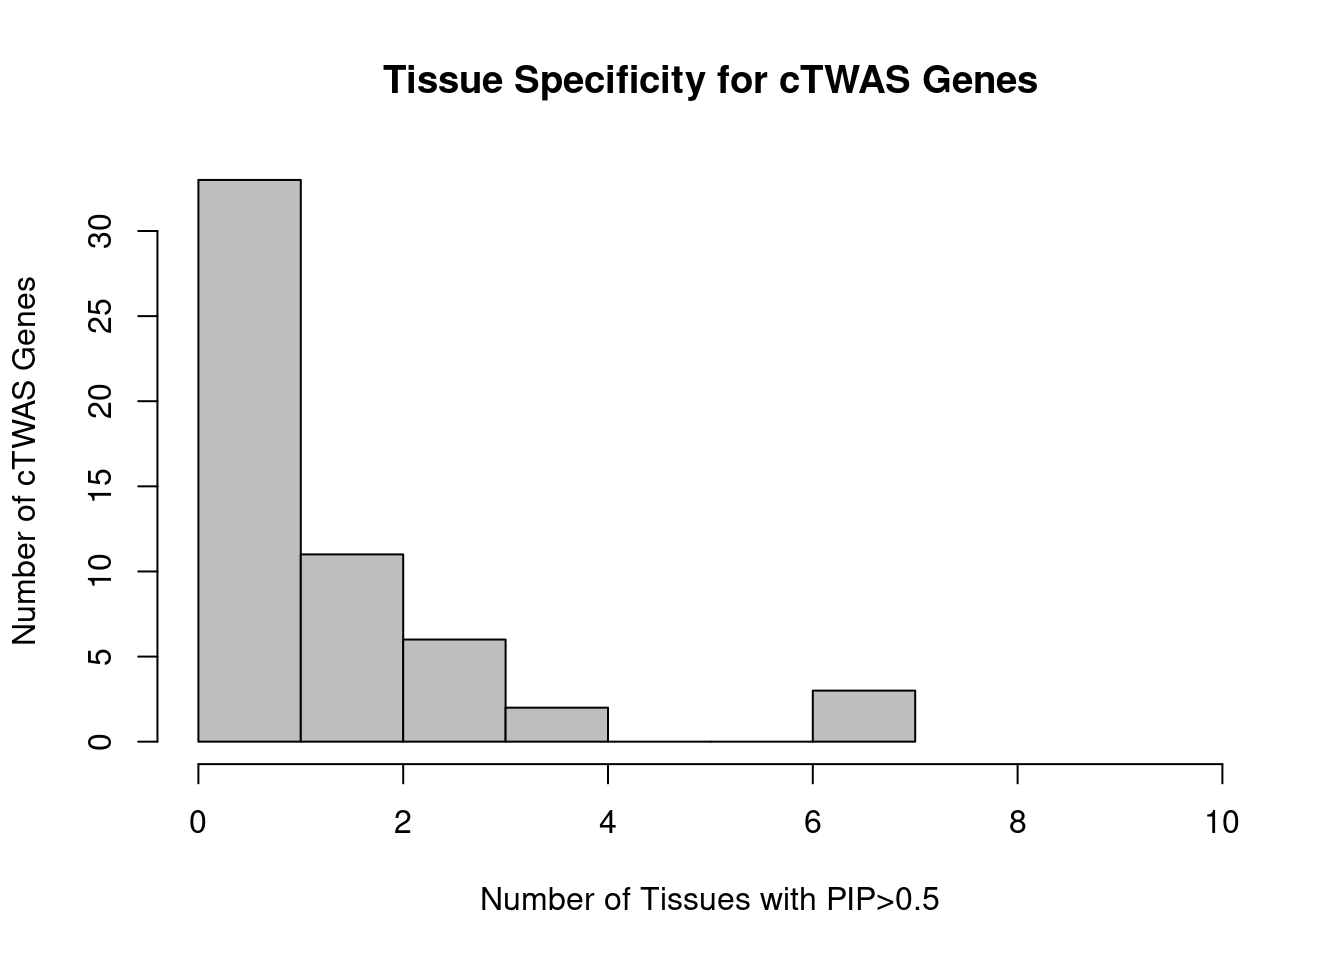
#report number of genes in each tissue bin
table(ctwas_frequency)
ctwas_frequency
0 1 2 3 4 7
18 15 11 6 2 3 Many cTWAS genes are novel
“Novel” is defined as 1) not in the silver standard, and 2) not the gene nearest to a genome-wide significant GWAS peak
#barplot of number of cTWAS genes in each tissue
output <- output[output$weight %in% selected_weights,,drop=F]
output <- output[order(-output$n_ctwas),,drop=F]

output$tissue <- sapply(output$weight, function(x){paste(unlist(strsplit(x,"_")),collapse=" ")})

par(mar=c(10.1, 4.1, 4.1, 2.1))
barplot(output$n_ctwas, names.arg=output$tissue, las=2, ylab="Number of cTWAS Genes", cex.names=0.6, main="Number of cTWAS Genes by Tissue")


results_table$novel <- !(results_table$nearest | results_table$known)
output$n_novel <- sapply(output$weight, function(x){sum(results_table[df[[x]]$ctwas,"novel"], na.rm=T)})

barplot(output$n_novel, names.arg=output$tissue, las=2, col="blue", add=T, xaxt='n', yaxt='n')

legend("topright",
       legend = c("Silver Standard or\nNearest to GWAS Peak", "Novel"),
       fill = c("grey", "blue"))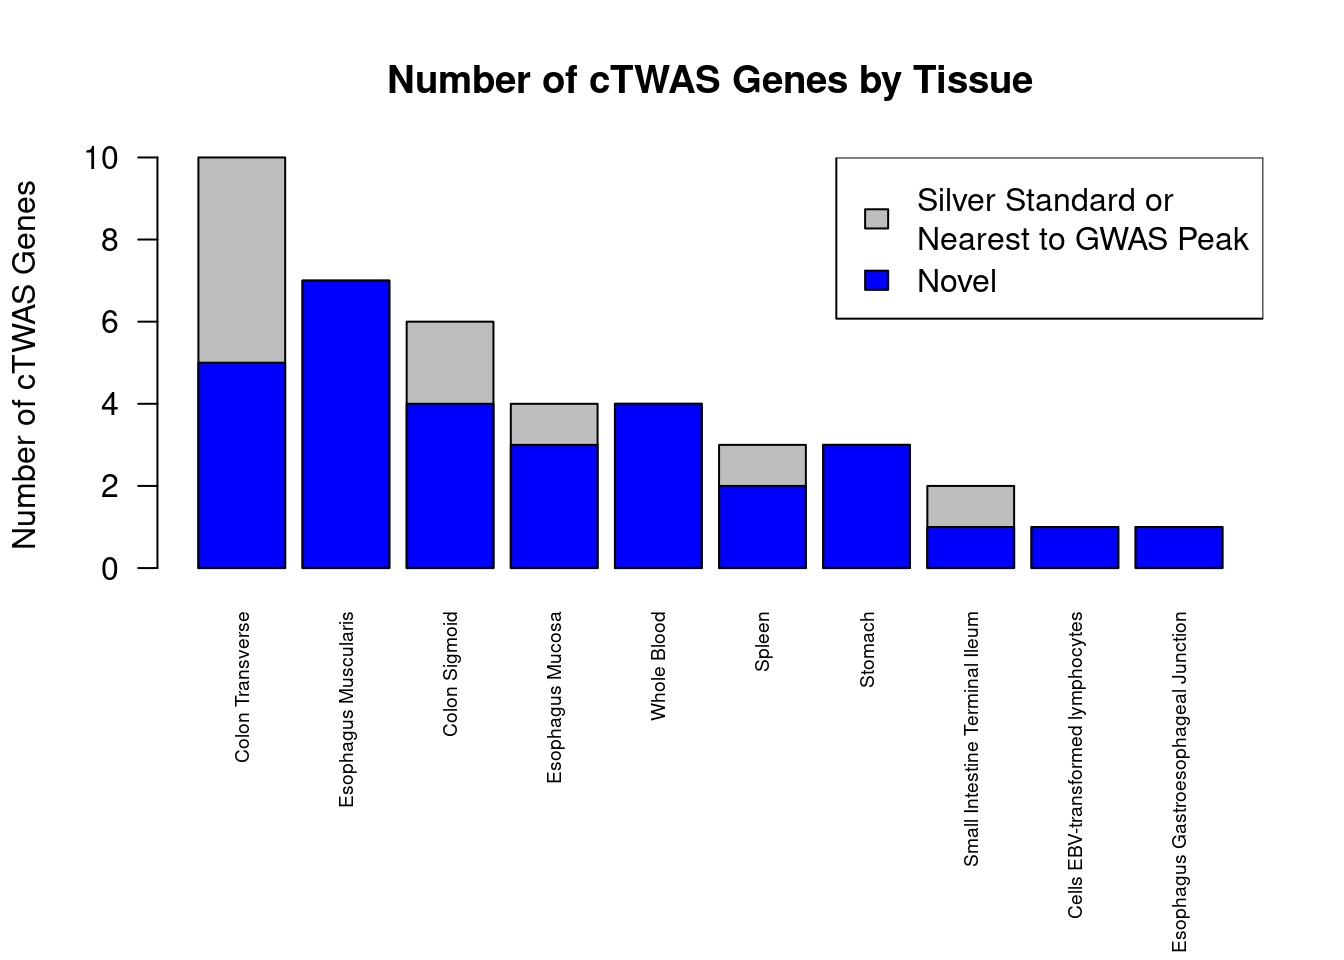
| Version | Author | Date |
|---|---|---|
| 6f82cb0 | wesleycrouse | 2022-05-13 |
Summary table of results
selected_weights_whitespace <- sapply(selected_weights, function(x){paste(unlist(strsplit(x, "_")), collapse=" ")})

results_summary <- data.frame(genename=as.character(rownames(results_table)),
                              ensembl_gene_id=results_table$ensembl_gene_id,
                              chromosome=results_table$chromosome_name,
                              start_position=results_table$start_position,
                              max_pip_tissue=selected_weights_whitespace[apply(results_table[,selected_weights], 1, which.max)],
                              max_pip=apply(results_table[,selected_weights], 1, max, na.rm=T),
                              other_tissues_detected=apply(results_table[,selected_weights],1,function(x){paste(selected_weights_whitespace[which(x>0.8 & x!=max(x,na.rm=T))], collapse="; ")}),
                              nearby=results_table$nearby,
                              nearest=results_table$nearest,
                              known=results_table$known,
                              enriched_terms=results_table$enriched_terms)

write.csv(results_summary, file=paste0("results_summary_ulcerative_colitis.csv"))
GO enrichment for genes in selected tissues
#enrichment for cTWAS genes using enrichR
library(enrichR)

dbs <- c("GO_Biological_Process_2021")

GO_enrichment <- enrichr(selected_genes, dbs)
Uploading data to Enrichr... Done.
Querying GO_Biological_Process_2021... Done.
Parsing results... Done.for (db in dbs){
cat(paste0(db, "\n\n"))
enrich_results <- GO_enrichment[[db]]
enrich_results <- enrich_results[enrich_results$Adjusted.P.value<0.05,c("Term", "Overlap", "Adjusted.P.value", "Genes")]
print(enrich_results)
print(plotEnrich(GO_enrichment[[db]]))
}GO_Biological_Process_2021
Term Overlap Adjusted.P.value Genes
1 positive regulation of antigen receptor-mediated signaling pathway (GO:0050857) 3/21 0.0006927445 PRKCB;RAB29;PRKD2
2 positive regulation of vascular endothelial growth factor receptor signaling pathway (GO:0030949) 2/10 0.0084672081 PRKCB;PRKD2
3 cytokine-mediated signaling pathway (GO:0019221) 6/621 0.0084672081 MUC1;CCL20;IRF8;IRF5;CCR5;CXCL5
4 positive regulation of T cell receptor signaling pathway (GO:0050862) 2/14 0.0105162728 RAB29;PRKD2
5 inflammatory response (GO:0006954) 4/230 0.0105162728 CCL20;ITGAL;CCR5;CXCL5
6 cellular response to cytokine stimulus (GO:0071345) 5/482 0.0134351353 MUC1;CCL20;IRF8;IRF5;CCR5
7 regulation of vascular endothelial growth factor receptor signaling pathway (GO:0030947) 2/24 0.0173311614 PRKCB;PRKD2
8 cellular response to interferon-gamma (GO:0071346) 3/121 0.0173311614 CCL20;IRF8;IRF5
9 regulation of T cell receptor signaling pathway (GO:0050856) 2/35 0.0285323096 RAB29;PRKD2
10 positive regulation of NF-kappaB transcription factor activity (GO:0051092) 3/155 0.0285323096 PRKCB;CARD9;PRKD2
11 positive regulation of ERK1 and ERK2 cascade (GO:0070374) 3/172 0.0337611868 CCL20;CARD9;PRKD2
12 mitochondrion organization (GO:0007005) 3/175 0.0337611868 BIK;RAB29;TYMP
13 cellular defense response (GO:0006968) 2/49 0.0419737954 LSP1;CCR5
14 chemokine-mediated signaling pathway (GO:0070098) 2/56 0.0479772139 CCL20;CXCL5
15 cellular response to chemokine (GO:1990869) 2/60 0.0479772139 CCL20;CXCL5
16 neutrophil mediated immunity (GO:0002446) 4/488 0.0479772139 FCGR2A;CARD9;HSPA6;ITGAL
17 cellular response to type I interferon (GO:0071357) 2/65 0.0479772139 IRF8;IRF5
18 type I interferon signaling pathway (GO:0060337) 2/65 0.0479772139 IRF8;IRF5
19 regulation of ERK1 and ERK2 cascade (GO:0070372) 3/238 0.0479772139 CCL20;CARD9;PRKD2
20 interferon-gamma-mediated signaling pathway (GO:0060333) 2/68 0.0479772139 IRF8;IRF5
21 positive regulation of DNA-binding transcription factor activity (GO:0051091) 3/246 0.0479772139 PRKCB;CARD9;PRKD2
22 cell chemotaxis (GO:0060326) 2/69 0.0479772139 CCL20;CCR5
23 neutrophil chemotaxis (GO:0030593) 2/70 0.0479772139 CCL20;CXCL5
24 granulocyte chemotaxis (GO:0071621) 2/73 0.0499238165 CCL20;CXCL5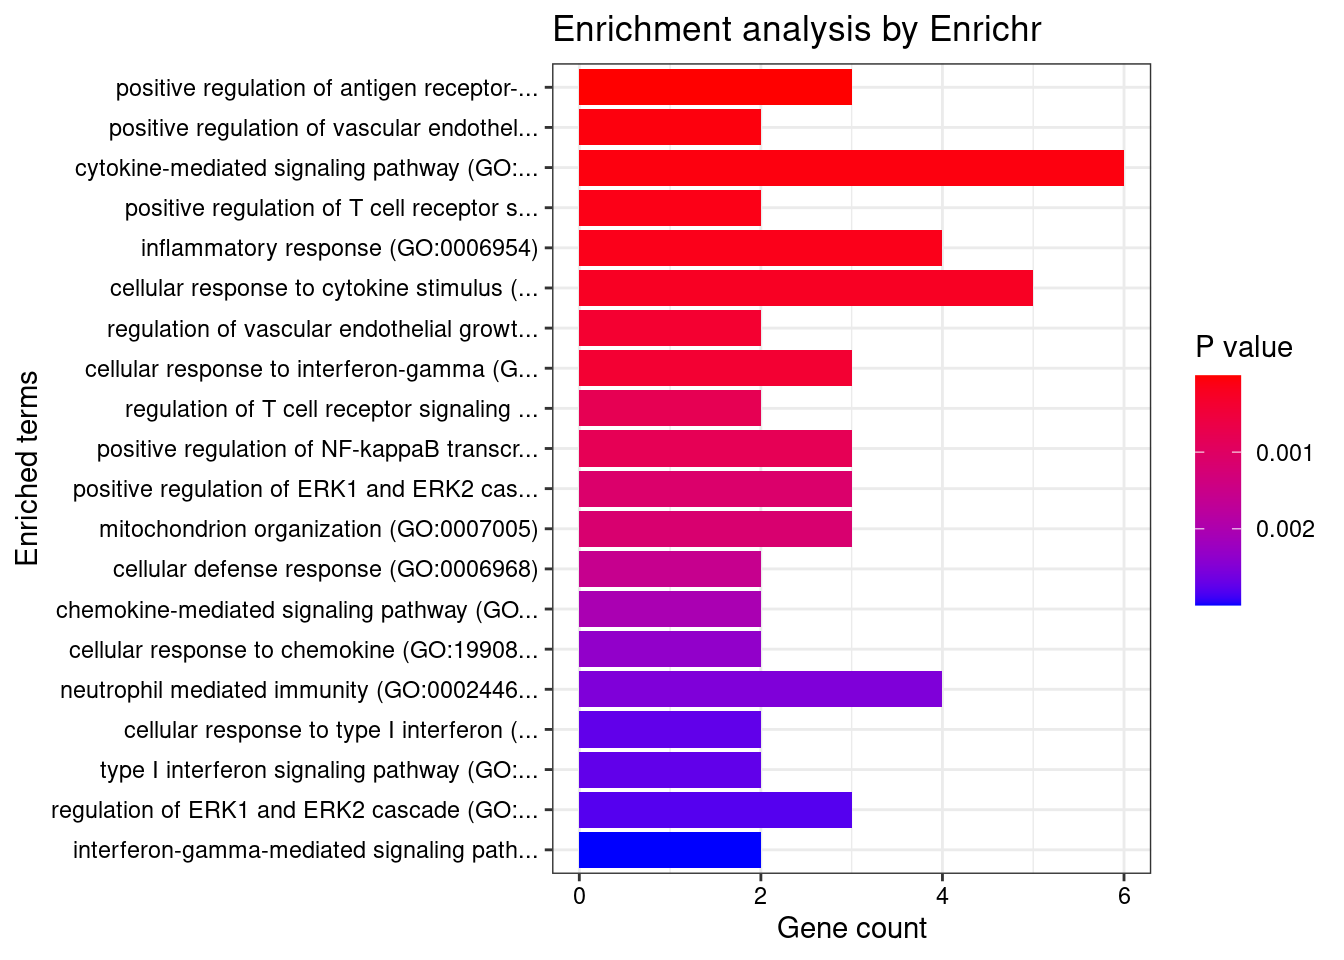
| Version | Author | Date |
|---|---|---|
| 25b7218 | wesleycrouse | 2022-05-14 |
Locus plots for HSPA6
locus_plot <- function(genename, tissue, plot_eqtl = T, label="cTWAS", xlim=NULL){
  results_dir <- results_dirs[grep(tissue, results_dirs)]
  weight <- rev(unlist(strsplit(results_dir, "/")))[1]
  analysis_id <- paste(trait_id, weight, sep="_")

  #load ctwas results
  ctwas_res <- data.table::fread(paste0(results_dir, "/", analysis_id, "_ctwas.susieIrss.txt"))

  #make unique identifier for regions and effects
  ctwas_res$region_tag <- paste(ctwas_res$region_tag1, ctwas_res$region_tag2, sep="_")
  ctwas_res$region_cs_tag <- paste(ctwas_res$region_tag, ctwas_res$cs_index, sep="_")

  #load z scores for SNPs
  load(paste0(results_dir, "/", analysis_id, "_expr_z_snp.Rd"))

  #separate gene and SNP results
  ctwas_gene_res <- ctwas_res[ctwas_res$type == "gene", ]
  ctwas_gene_res <- data.frame(ctwas_gene_res)
  ctwas_snp_res <- ctwas_res[ctwas_res$type == "SNP", ]
  ctwas_snp_res <- data.frame(ctwas_snp_res)

  #add gene information to results
  sqlite <- RSQLite::dbDriver("SQLite")
  db = RSQLite::dbConnect(sqlite, paste0("/project2/compbio/predictdb/mashr_models/mashr_", weight, ".db"))
  query <- function(...) RSQLite::dbGetQuery(db, ...)
  gene_info <- query("select gene, genename, gene_type from extra")
  RSQLite::dbDisconnect(db)

  ctwas_gene_res <- cbind(ctwas_gene_res, gene_info[sapply(ctwas_gene_res$id, match, gene_info$gene), c("genename", "gene_type")])

  #add z scores to results
  load(paste0(results_dir, "/", analysis_id, "_expr_z_gene.Rd"))
  ctwas_gene_res$z <- z_gene[ctwas_gene_res$id,]$z

  z_snp <- z_snp[z_snp$id %in% ctwas_snp_res$id,]
  ctwas_snp_res$z <- z_snp$z[match(ctwas_snp_res$id, z_snp$id)]

  #merge gene and snp results with added information
  ctwas_snp_res$genename=NA
  ctwas_snp_res$gene_type=NA

  ctwas_res <- rbind(ctwas_gene_res, ctwas_snp_res[,colnames(ctwas_gene_res)])

  region_tag <- ctwas_res$region_tag[which(ctwas_res$genename==genename)]

  region_tag1 <- unlist(strsplit(region_tag, "_"))[1]
  region_tag2 <- unlist(strsplit(region_tag, "_"))[2]

  a <- ctwas_res[ctwas_res$region_tag==region_tag,]

  rm(ctwas_res)

  regionlist <- readRDS(paste0(results_dir, "/", analysis_id, "_ctwas.regionlist.RDS"))
  region <- regionlist[[as.numeric(region_tag1)]][[region_tag2]]

  R_snp_info <- do.call(rbind, lapply(region$regRDS, function(x){data.table::fread(paste0(tools::file_path_sans_ext(x), ".Rvar"))}))

  a$pos[a$type=="gene"] <- G_list$start_position[match(sapply(a$id[a$type=="gene"], function(x){unlist(strsplit(x, "[.]"))[1]}) ,G_list$ensembl_gene_id)]
  a$pos <- a$pos/1000000

  if (!is.null(xlim)){
    if (is.na(xlim[1])){
      xlim[1] <- min(a$pos)
    }
    if (is.na(xlim[2])){
      xlim[2] <- max(a$pos)
    }
    a <- a[a$pos>=xlim[1] & a$pos<=xlim[2],,drop=F]
  }

  focus <- a$id[which(a$genename==genename)]
  a$iffocus <- as.numeric(a$id==focus)

  a$PVALUE <- (-log(2) - pnorm(abs(a$z), lower.tail=F, log.p=T))/log(10)

  R_gene <- readRDS(region$R_g_file)
  R_snp_gene <- readRDS(region$R_sg_file)
  R_snp <- as.matrix(Matrix::bdiag(lapply(region$regRDS, readRDS)))

  rownames(R_gene) <- region$gid
  colnames(R_gene) <- region$gid
  rownames(R_snp_gene) <- R_snp_info$id
  colnames(R_snp_gene) <- region$gid
  rownames(R_snp) <- R_snp_info$id
  colnames(R_snp) <- R_snp_info$id

  a$r2max <- NA

  a$r2max[a$type=="gene"] <- R_gene[focus,a$id[a$type=="gene"]]
  a$r2max[a$type=="SNP"] <- R_snp_gene[a$id[a$type=="SNP"],focus]

  r2cut <- 0.4
  colorsall <- c("#7fc97f", "#beaed4", "#fdc086")

  layout(matrix(1:2, ncol = 1), widths = 1, heights = c(1.5,1.5), respect = FALSE)
  par(mar = c(0, 4.1, 4.1, 2.1))

  plot(a$pos[a$type=="SNP"], a$PVALUE[a$type == "SNP"], pch = 21, xlab=paste0("Chromosome ", region_tag1, " position (Mb)"), frame.plot=FALSE, bg = colorsall[1], ylab = "-log10(p value)", panel.first = grid(), ylim =c(-(1/6)*max(a$PVALUE), max(a$PVALUE)*1.2), xaxt = 'n')

  points(a$pos[a$type=="SNP" & a$r2max > r2cut], a$PVALUE[a$type == "SNP"  & a$r2max > r2cut], pch = 21, bg = "purple")
  points(a$pos[a$type=="SNP" & a$iffocus == 1], a$PVALUE[a$type == "SNP" & a$iffocus == 1], pch = 21, bg = "salmon")
  points(a$pos[a$type=="gene"], a$PVALUE[a$type == "gene"], pch = 22, bg = colorsall[1], cex = 2)
  points(a$pos[a$type=="gene" & a$r2max > r2cut], a$PVALUE[a$type == "gene"  & a$r2max > r2cut], pch = 22, bg = "purple", cex = 2)
  points(a$pos[a$type=="gene" & a$iffocus == 1], a$PVALUE[a$type == "gene" & a$iffocus == 1], pch = 22, bg = "salmon", cex = 2)

  alpha=0.05
  abline(h=-log10(alpha/nrow(ctwas_gene_res)), col ="red", lty = 2)

  if (isTRUE(plot_eqtl)){
    for (cgene in a[a$type=="gene" & a$iffocus == 1, ]$id){
      load(paste0(results_dir, "/",analysis_id, "_expr_chr", region_tag1, ".exprqc.Rd"))
      eqtls <- rownames(wgtlist[[cgene]])
      points(a[a$id %in% eqtls,]$pos, rep( -(1/6)*max(a$PVALUE), nrow(a[a$id %in% eqtls,])), pch = "|", col = "salmon", cex = 1.5)
    }
  }

  if (label=="TWAS"){
    text(a$pos[a$id==focus], a$PVALUE[a$id==focus], labels=ctwas_gene_res$genename[ctwas_gene_res$id==focus], pos=3, cex=0.6)
  }

  par(mar = c(4.1, 4.1, 0.5, 2.1))

  plot(a$pos[a$type=="SNP"], a$PVALUE[a$type == "SNP"], pch = 19, xlab=paste0("Chromosome ", region_tag1, " position (Mb)"),frame.plot=FALSE, col = "white", ylim= c(0,1.1), ylab = "cTWAS PIP")

  grid()
  points(a$pos[a$type=="SNP"], a$susie_pip[a$type == "SNP"], pch = 21, xlab="Genomic position", bg = colorsall[1])
  points(a$pos[a$type=="SNP" & a$r2max > r2cut], a$susie_pip[a$type == "SNP"  & a$r2max >r2cut], pch = 21, bg = "purple")
  points(a$pos[a$type=="SNP" & a$iffocus == 1], a$susie_pip[a$type == "SNP" & a$iffocus == 1], pch = 21, bg = "salmon")
  points(a$pos[a$type=="gene"], a$susie_pip[a$type == "gene"], pch = 22, bg = colorsall[1], cex = 2)
  points(a$pos[a$type=="gene" & a$r2max > r2cut], a$susie_pip[a$type == "gene"  & a$r2max > r2cut], pch = 22, bg = "purple", cex = 2)
  points(a$pos[a$type=="gene" & a$iffocus == 1], a$susie_pip[a$type == "gene" & a$iffocus == 1], pch = 22, bg = "salmon", cex = 2)

  legend(max(a$pos)-0.2*(max(a$pos)-min(a$pos)), y= 1 ,c("Gene", "SNP","Lead TWAS Gene", "R2 > 0.4", "R2 <= 0.4"), pch = c(22,21,19,19,19), col = c("black", "black", "salmon", "purple", colorsall[1]), cex=0.7, title.adj = 0)

  if (label=="cTWAS"){
    text(a$pos[a$id==focus], a$susie_pip[a$id==focus], labels=ctwas_gene_res$genename[ctwas_gene_res$id==focus], pos=3, cex=0.6)
  }

  return(a)
}
genename <- "HSPA6"
tissue <- names(which.max(results_table[genename,selected_weights]))
a <- locus_plot(genename, tissue, xlim=c(161.25, 161.75))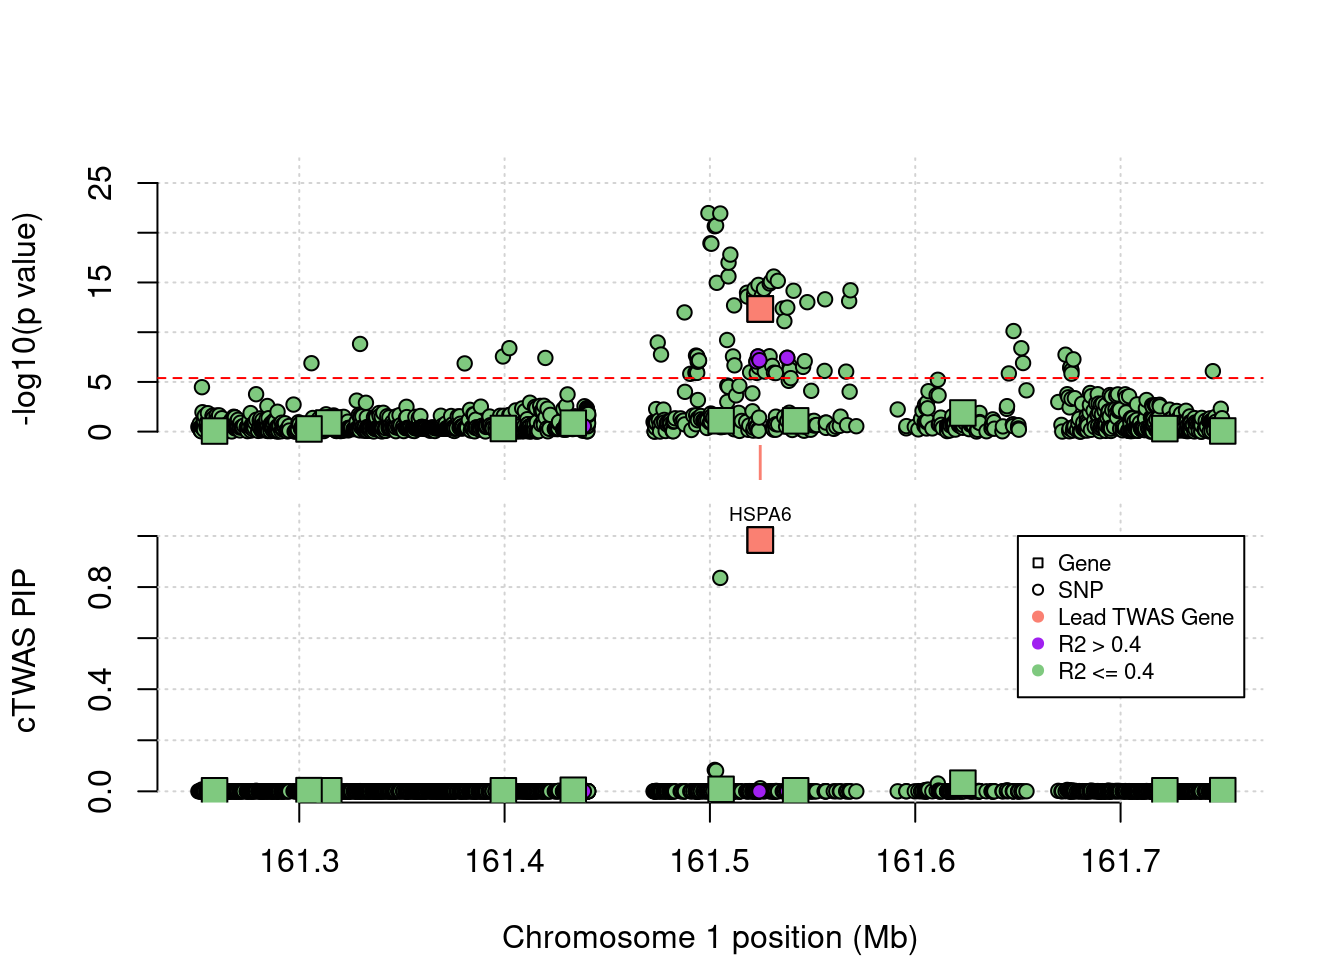
| Version | Author | Date |
|---|---|---|
| 5d013d9 | wesleycrouse | 2022-05-15 |
#ctwas results
head(a[order(-a$susie_pip), c("chrom", "pos", "id", "genename", "type", "susie_pip", "PVALUE") ], 10)
chrom pos id genename type susie_pip PVALUE
9640 1 161.5245 ENSG00000173110.7 HSPA6 gene 0.984159410 12.334770
750178 1 161.5050 rs7522794 <NA> SNP 0.835774319 21.933521
750174 1 161.5024 rs10800309 <NA> SNP 0.083910914 20.653191
750175 1 161.5030 rs10800314 <NA> SNP 0.080419254 20.715485
7892 1 161.6232 ENSG00000162747.9 FCGR3B gene 0.031950483 1.876826
750337 1 161.6110 rs112369311 <NA> SNP 0.030515458 5.214095
750242 1 161.5245 rs9427403 <NA> SNP 0.012113477 12.334770
6140 1 161.5054 ENSG00000143226.13 FCGR2A gene 0.008009073 1.094270
749353 1 161.2526 rs149296304 <NA> SNP 0.007104969 4.468214
750334 1 161.6064 rs3754052 <NA> SNP 0.006186127 4.066273#nearest gene to GWAS peak
G_list[G_list$chromosome_name==unique(a$chrom) & G_list$start_position > min(a$pos*1000000) & G_list$end_position < max(a$pos*1000000),] hgnc_symbol chromosome_name start_position end_position gene_biotype ensembl_gene_id nearby nearest
1124 1 161403409 161470523 lncRNA ENSG00000283360 TRUE FALSE
2681 PCP4L1 1 161258745 161285450 protein_coding ENSG00000248485 TRUE FALSE
2682 CFAP126 1 161364733 161367876 protein_coding ENSG00000188931 TRUE FALSE
2684 1 161399409 161422424 lncRNA ENSG00000283696 TRUE FALSE
2685 1 161399998 161401868 lncRNA ENSG00000288093 TRUE FALSE
2689 1 161433444 161440996 lncRNA ENSG00000283317 TRUE FALSE
2724 MPZ 1 161304735 161309968 protein_coding ENSG00000158887 TRUE FALSE
2951 1 161513176 161605099 lncRNA ENSG00000273112 TRUE FALSE
2952 HSPA6 1 161524540 161526894 protein_coding ENSG00000173110 TRUE FALSE
2954 1 161556290 161557078 lncRNA ENSG00000224515 TRUE FALSE
2957 FCGR3B 1 161623196 161631963 protein_coding ENSG00000162747 TRUE FALSE
2958 1 161671978 161674824 lncRNA ENSG00000234211 TRUE FALSE
2960 FCGR2A 1 161505430 161524013 protein_coding ENSG00000143226 TRUE TRUE
3203 FCGR3A 1 161541759 161550737 protein_coding ENSG00000203747 TRUE FALSE
3426 SDHC 1 161314381 161363206 protein_coding ENSG00000143252 TRUE FALSE
3427 1 161368022 161371964 lncRNA ENSG00000288670 TRUE FALSE
3603 FCRLA 1 161706972 161714352 protein_coding ENSG00000132185 TRUE FALSE
3604 FCRLB 1 161721563 161728143 protein_coding ENSG00000162746 TRUE FALSE
5049 FCGR2B 1 161663143 161678654 protein_coding ENSG00000072694 TRUE FALSE
5087 1 161518705 161519568 lncRNA ENSG00000289273 TRUE FALSE
5500 1 161364227 161364751 lncRNA ENSG00000289106 TRUE FALSE
5501 1 161389547 161389950 lncRNA ENSG00000289141 TRUE FALSE####################
#checking additional tissue
a <- locus_plot(genename, "Esophagus_Mucosa", xlim=c(161.25, 161.75))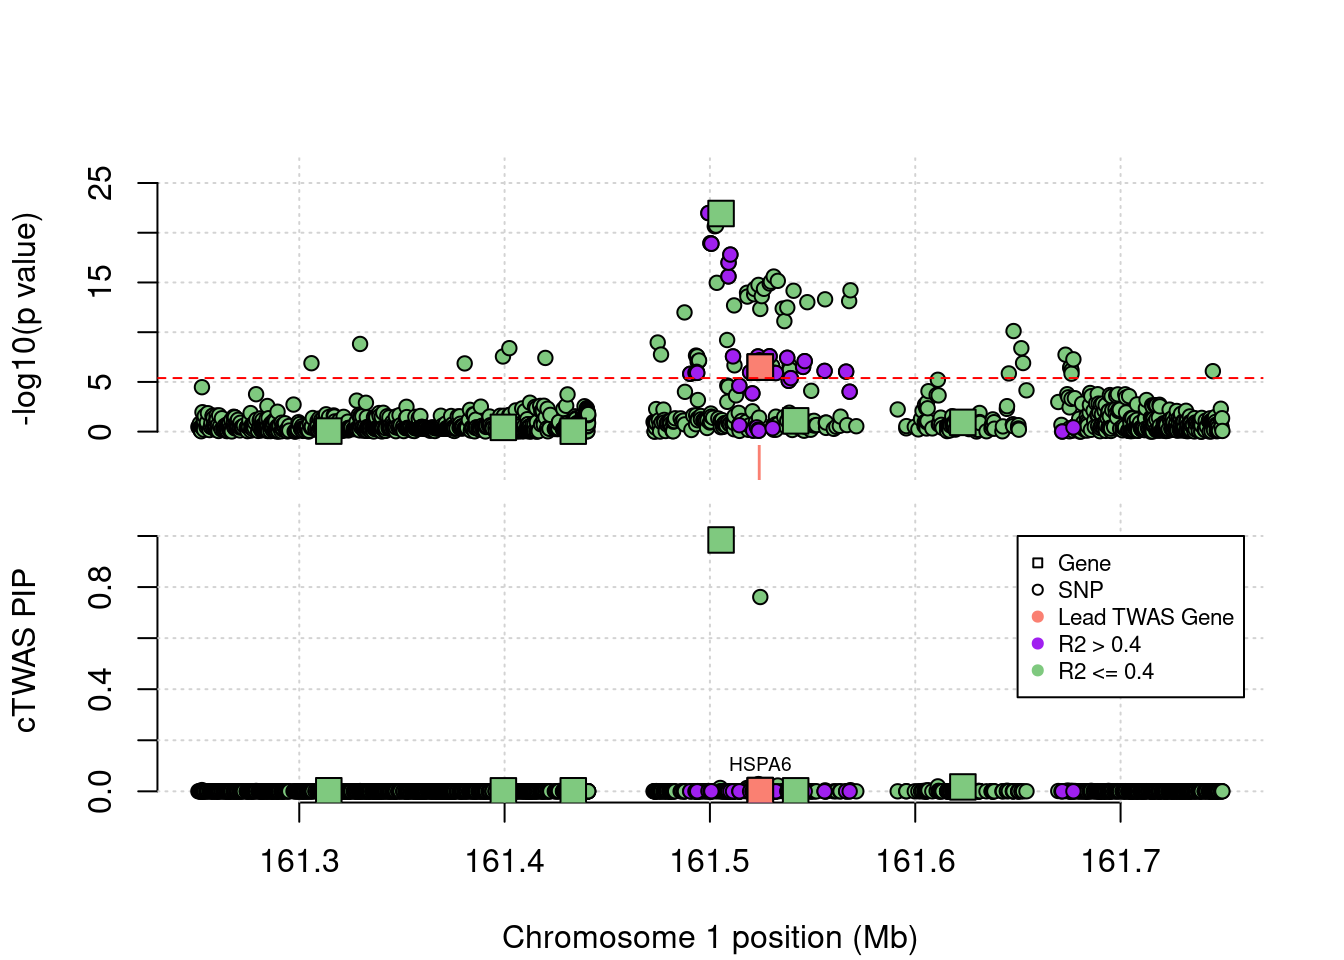
| Version | Author | Date |
|---|---|---|
| 5d013d9 | wesleycrouse | 2022-05-15 |
#ctwas results
head(a[order(-a$susie_pip), c("chrom", "pos", "id", "genename", "type", "susie_pip", "PVALUE") ], 10)
chrom pos id genename type susie_pip PVALUE
6145 1 161.5054 ENSG00000143226.13 FCGR2A gene 0.98435141 21.9335213
753358 1 161.5245 rs9427403 <NA> SNP 0.76088340 12.3347703
753353 1 161.5236 rs11580574 <NA> SNP 0.02841777 14.7539541
753378 1 161.5331 rs79568124 <NA> SNP 0.02279356 15.1620178
753364 1 161.5297 rs11578245 <NA> SNP 0.02017255 15.0826860
753453 1 161.6110 rs112369311 <NA> SNP 0.01939739 5.2140950
7894 1 161.6232 ENSG00000162747.9 FCGR3B gene 0.01720681 0.9326207
753363 1 161.5291 rs10919301 <NA> SNP 0.01600313 14.8914977
753390 1 161.5388 rs10919543 <NA> SNP 0.01529464 6.6294281
753365 1 161.5303 rs2099684 <NA> SNP 0.01451939 6.6073912Locus plots for IRF8
genename <- "IRF8"
tissue <- names(which.max(results_table[genename,selected_weights]))

print(tissue)
[1] "Colon_Transverse"a <- locus_plot(genename, tissue, xlim=c(85.75, 86.25))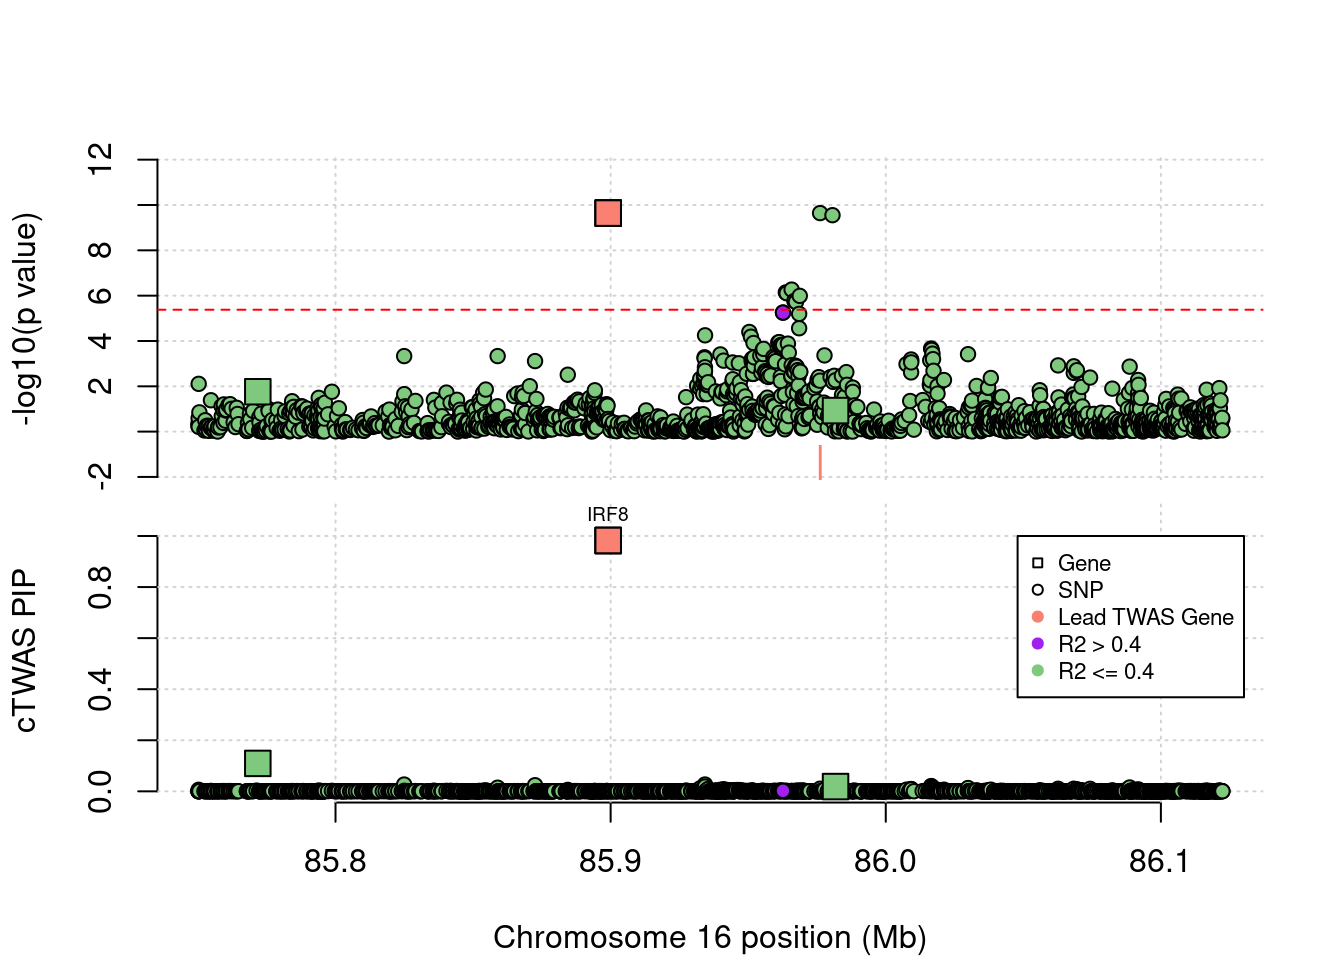
| Version | Author | Date |
|---|---|---|
| 5d013d9 | wesleycrouse | 2022-05-15 |
#ctwas results
head(a[order(-a$susie_pip), c("chrom", "pos", "id", "genename", "type", "susie_pip", "PVALUE") ], 10)
chrom pos id genename type susie_pip PVALUE
5809 16 85.89912 ENSG00000140968.10 IRF8 gene 0.98214979 9.6418774
4598 16 85.77176 ENSG00000131148.8 EMC8 gene 0.10936762 1.7602582
801791 16 85.93429 rs2970090 <NA> SNP 0.02659675 2.6822612
801365 16 85.82495 rs72805138 <NA> SNP 0.02657671 3.3323060
801530 16 85.87253 rs72805168 <NA> SNP 0.02390375 3.1122164
802162 16 86.01649 rs72807072 <NA> SNP 0.02060438 3.6674424
802163 16 86.01669 rs72807073 <NA> SNP 0.01877971 3.6072555
13917 16 85.98175 ENSG00000269667.1 RP11-542M13.2 gene 0.01863386 0.9302245
801792 16 85.93431 rs56239618 <NA> SNP 0.01848331 4.2494413
801787 16 85.93414 rs74032085 <NA> SNP 0.01740854 3.2799639#nearest gene to GWAS peak
G_list[G_list$chromosome_name==unique(a$chrom) & G_list$start_position > min(a$pos*1000000) & G_list$end_position < max(a$pos*1000000),] hgnc_symbol chromosome_name start_position end_position gene_biotype ensembl_gene_id nearby nearest
23002 EMC8 16 85771758 85799608 protein_coding ENSG00000131148 TRUE FALSE
23004 16 85784382 85787617 lncRNA ENSG00000270184 TRUE FALSE
23005 16 85792415 85792933 lncRNA ENSG00000270159 TRUE FALSE
23006 COX4I1 16 85798633 85807068 protein_coding ENSG00000131143 TRUE FALSE
23009 16 85846309 85848138 lncRNA ENSG00000286510 TRUE FALSE
23011 IRF8 16 85899116 85922606 protein_coding ENSG00000140968 TRUE FALSE
23013 16 85924984 85948824 lncRNA ENSG00000285163 TRUE FALSE
23014 LINC02132 16 85935276 85936223 lncRNA ENSG00000268804 TRUE FALSE
23015 16 85963328 85985386 lncRNA ENSG00000285040 TRUE TRUE
23016 16 85981750 85984881 lncRNA ENSG00000269667 TRUE FALSE
23017 16 85986764 85995899 lncRNA ENSG00000285012 TRUE FALSE
23019 16 86081409 86089526 lncRNA ENSG00000261177 TRUE FALSELocus plots for CERKL
genename <- "CERKL"

tissue <- names(which.max(results_table[genename,selected_weights]))

print(tissue)
[1] "Colon_Transverse"a <- locus_plot(genename, tissue, xlim=c(NA, 181.75))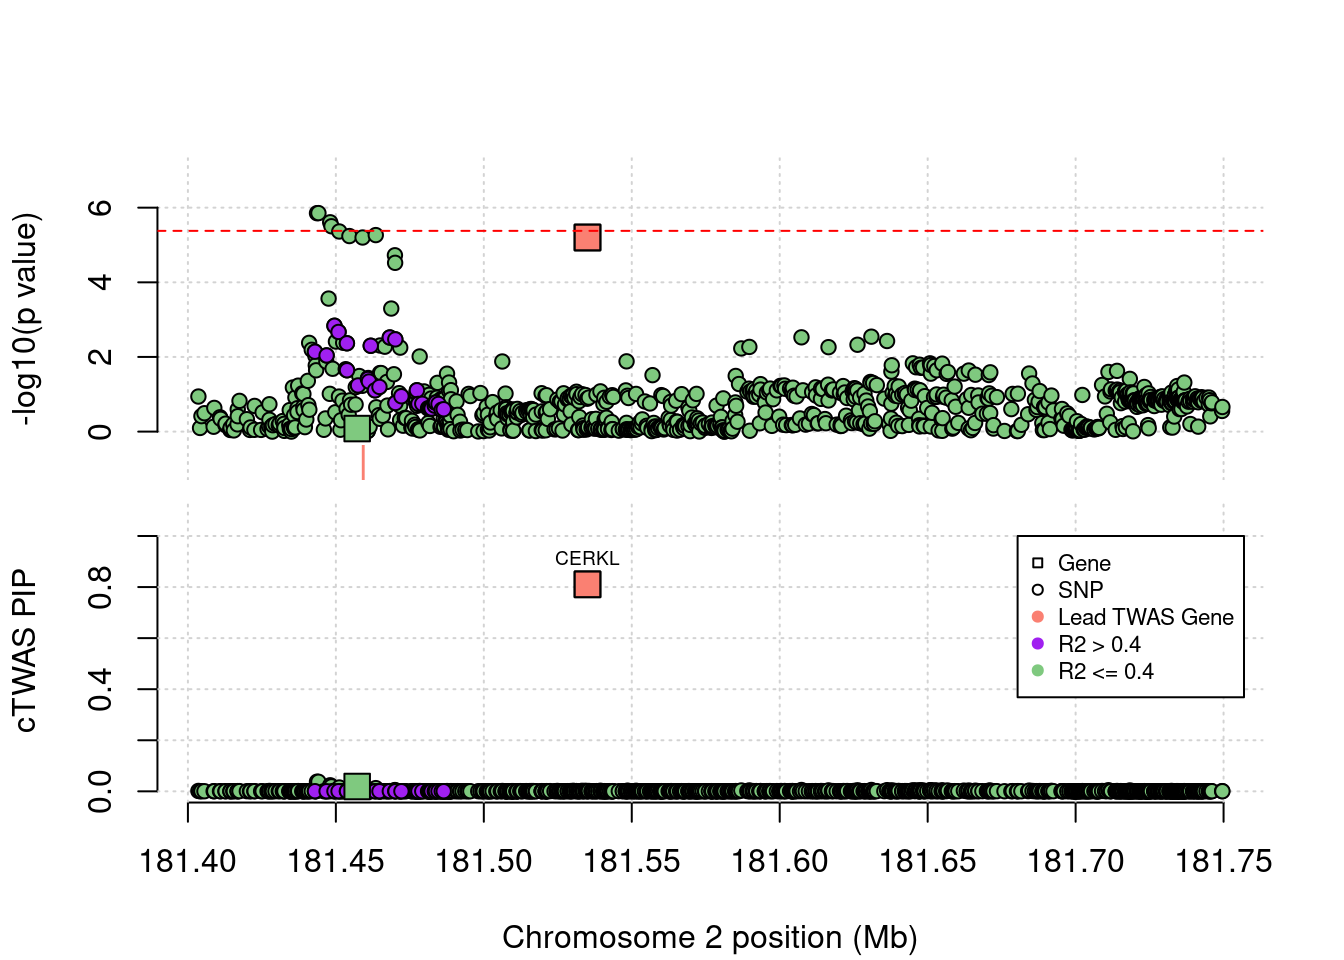
| Version | Author | Date |
|---|---|---|
| 5d013d9 | wesleycrouse | 2022-05-15 |
#ctwas results
head(a[order(-a$susie_pip), c("chrom", "pos", "id", "genename", "type", "susie_pip", "PVALUE") ], 10)
chrom pos id genename type susie_pip PVALUE
11148 2 181.5350 ENSG00000188452.13 CERKL gene 0.81038235 5.19996360
757043 2 181.4436 rs6740847 <NA> SNP 0.03760715 5.85146378
757044 2 181.4441 rs6731125 <NA> SNP 0.03738030 5.85386183
757051 2 181.4481 rs4667282 <NA> SNP 0.02362734 5.60751883
757052 2 181.4485 rs4667283 <NA> SNP 0.01939238 5.50082147
3182 2 181.4572 ENSG00000115232.13 ITGA4 gene 0.01894273 0.08182011
757059 2 181.4512 rs7573465 <NA> SNP 0.01494514 5.36116055
757088 2 181.4635 rs2124440 <NA> SNP 0.01249562 5.26462367
757069 2 181.4546 rs1449263 <NA> SNP 0.01193769 5.23871009
757078 2 181.4590 rs1375493 <NA> SNP 0.01109060 5.19996360#nearest gene to GWAS peak
G_list[G_list$chromosome_name==unique(a$chrom) & G_list$start_position > min(a$pos*1000000) & G_list$end_position < max(a$pos*1000000),] hgnc_symbol chromosome_name start_position end_position gene_biotype ensembl_gene_id nearby nearest
33550 2 181422154 181425749 lncRNA ENSG00000226681 FALSE FALSE
33551 ITGA4 2 181457202 181538940 protein_coding ENSG00000115232 FALSE FALSE
33552 2 181683113 181685707 lncRNA ENSG00000234595 FALSE FALSE
33553 2 181690380 181693415 lncRNA ENSG00000225570 FALSE FALSE
33708 CERKL 2 181535041 181680665 protein_coding ENSG00000188452 FALSE FALSE
33709 NEUROD1 2 181668295 181680827 protein_coding ENSG00000162992 FALSE FALSE
sessionInfo()R version 3.6.1 (2019-07-05)
Platform: x86_64-pc-linux-gnu (64-bit)
Running under: Scientific Linux 7.4 (Nitrogen)
Matrix products: default
BLAS/LAPACK: /software/openblas-0.2.19-el7-x86_64/lib/libopenblas_haswellp-r0.2.19.so
locale:
[1] LC_CTYPE=en_US.UTF-8 LC_NUMERIC=C LC_TIME=en_US.UTF-8 LC_COLLATE=en_US.UTF-8 LC_MONETARY=en_US.UTF-8 LC_MESSAGES=en_US.UTF-8 LC_PAPER=en_US.UTF-8 LC_NAME=C LC_ADDRESS=C LC_TELEPHONE=C LC_MEASUREMENT=en_US.UTF-8 LC_IDENTIFICATION=C
attached base packages:
[1] stats graphics grDevices utils datasets methods base
other attached packages:
[1] ggrepel_0.9.1 ggplot2_3.3.5 disgenet2r_0.99.2 WebGestaltR_0.4.4 enrichR_3.0
loaded via a namespace (and not attached):
[1] Rcpp_1.0.6 svglite_1.2.2 lattice_0.20-38 rprojroot_2.0.2 digest_0.6.20 foreach_1.5.1 utf8_1.2.1 cellranger_1.1.0 R6_2.5.0 plyr_1.8.4 RSQLite_2.2.7 evaluate_0.14 httr_1.4.1 pillar_1.6.1 gdtools_0.1.9 rlang_0.4.11 readxl_1.3.1 curl_3.3 data.table_1.14.0 blob_1.2.1 whisker_0.3-2 Matrix_1.2-18 rmarkdown_1.13 apcluster_1.4.8 labeling_0.3 readr_1.4.0 stringr_1.4.0 bit_4.0.4 igraph_1.2.4.1 munsell_0.5.0 compiler_3.6.1 httpuv_1.5.1 xfun_0.8 pkgconfig_2.0.3 htmltools_0.3.6 tidyselect_1.1.0 tibble_3.1.2 workflowr_1.6.2 codetools_0.2-16 fansi_0.5.0 crayon_1.4.1 dplyr_1.0.7 withr_2.4.1 later_0.8.0 grid_3.6.1 jsonlite_1.6 gtable_0.3.0 lifecycle_1.0.0 DBI_1.1.1 git2r_0.26.1 magrittr_2.0.1 scales_1.1.0 cachem_1.0.5 stringi_1.4.3 farver_2.1.0
[56] reshape2_1.4.3 fs_1.3.1 promises_1.0.1 doRNG_1.8.2 doParallel_1.0.16 ellipsis_0.3.2 generics_0.0.2 vctrs_0.3.8 rjson_0.2.20 iterators_1.0.13 tools_3.6.1 bit64_4.0.5 glue_1.4.2 purrr_0.3.4 hms_1.1.0 rngtools_1.5 fastmap_1.1.0 parallel_3.6.1 yaml_2.2.0 colorspace_1.4-1 memoise_2.0.0 knitr_1.23