Crohn’s disease - all weights (no lncRNA)
wesleycrouse
2022-04-04
Last updated: 2022-06-14
Checks: 7 0
Knit directory: ctwas_applied/
This reproducible R Markdown analysis was created with workflowr (version 1.6.2). The Checks tab describes the reproducibility checks that were applied when the results were created. The Past versions tab lists the development history.
Great! Since the R Markdown file has been committed to the Git repository, you know the exact version of the code that produced these results.
Great job! The global environment was empty. Objects defined in the global environment can affect the analysis in your R Markdown file in unknown ways. For reproduciblity it’s best to always run the code in an empty environment.
The command set.seed(20210726) was run prior to running the code in the R Markdown file. Setting a seed ensures that any results that rely on randomness, e.g. subsampling or permutations, are reproducible.
Great job! Recording the operating system, R version, and package versions is critical for reproducibility.
Nice! There were no cached chunks for this analysis, so you can be confident that you successfully produced the results during this run.
Great job! Using relative paths to the files within your workflowr project makes it easier to run your code on other machines.
Great! You are using Git for version control. Tracking code development and connecting the code version to the results is critical for reproducibility.
The results in this page were generated with repository version 39e5422. See the Past versions tab to see a history of the changes made to the R Markdown and HTML files.
Note that you need to be careful to ensure that all relevant files for the analysis have been committed to Git prior to generating the results (you can use wflow_publish or wflow_git_commit). workflowr only checks the R Markdown file, but you know if there are other scripts or data files that it depends on. Below is the status of the Git repository when the results were generated:
Untracked files:
    Untracked:  group_enrichment_results.RData
    Untracked:  workspace.RData
    Untracked:  workspace2.RData
    Untracked:  workspace3.RData
    Untracked:  z_snp_pos_ebi-a-GCST004131.RData
    Untracked:  z_snp_pos_ebi-a-GCST004132.RData
    Untracked:  z_snp_pos_ebi-a-GCST004133.RData
    Untracked:  z_snp_pos_ukb-d-30780_irnt.RData
Note that any generated files, e.g. HTML, png, CSS, etc., are not included in this status report because it is ok for generated content to have uncommitted changes.
These are the previous versions of the repository in which changes were made to the R Markdown (analysis/ebi-a-GCST004132_allweights_nolnc.Rmd) and HTML (docs/ebi-a-GCST004132_allweights_nolnc.html) files. If you’ve configured a remote Git repository (see ?wflow_git_remote), click on the hyperlinks in the table below to view the files as they were in that past version.
| File | Version | Author | Date | Message |
|---|---|---|---|---|
| Rmd | 39e5422 | wesleycrouse | 2022-06-14 | summary table for IBDQ |
| Rmd | 0136d2e | wesleycrouse | 2022-06-10 | reports without lncRNA |
| html | 0136d2e | wesleycrouse | 2022-06-10 | reports without lncRNA |
options(width=1000)trait_id <- "ebi-a-GCST004132"
trait_name <- "Crohn's disease"
source("/project2/mstephens/wcrouse/UKB_analysis_allweights/ctwas_config.R")
trait_dir <- paste0("/project2/mstephens/wcrouse/UKB_analysis_allweights/", trait_id)
results_dirs <- list.dirs(trait_dir, recursive=F)
results_dirs <- results_dirs[grep("nolnc", results_dirs)]Load cTWAS results for all weights
# df <- list()
#
# for (i in 1:length(results_dirs)){
#   print(i)
#
#   results_dir <- results_dirs[i]
#   weight <- rev(unlist(strsplit(results_dir, "/")))[1]
#   weight <- unlist(strsplit(weight, split="_nolnc"))
#   analysis_id <- paste(trait_id, weight, sep="_")
#
#   #load ctwas results
#   ctwas_res <- data.table::fread(paste0(results_dir, "/", analysis_id, "_ctwas.susieIrss.txt"))
#
#   #make unique identifier for regions and effects
#   ctwas_res$region_tag <- paste(ctwas_res$region_tag1, ctwas_res$region_tag2, sep="_")
#   ctwas_res$region_cs_tag <- paste(ctwas_res$region_tag, ctwas_res$cs_index, sep="_")
#
#   #load z scores for SNPs and collect sample size
#   load(paste0(results_dir, "/", analysis_id, "_expr_z_snp.Rd"))
#
#   sample_size <- z_snp$ss
#   sample_size <- as.numeric(names(which.max(table(sample_size))))
#
#   #separate gene and SNP results
#   ctwas_gene_res <- ctwas_res[ctwas_res$type == "gene", ]
#   ctwas_gene_res <- data.frame(ctwas_gene_res)
#   ctwas_snp_res <- ctwas_res[ctwas_res$type == "SNP", ]
#   ctwas_snp_res <- data.frame(ctwas_snp_res)
#
#   #add gene information to results
#   sqlite <- RSQLite::dbDriver("SQLite")
#   db = RSQLite::dbConnect(sqlite, paste0("/project2/mstephens/wcrouse/predictdb_nolnc/mashr_", weight, "_nolnc.db"))
#   query <- function(...) RSQLite::dbGetQuery(db, ...)
#   gene_info <- query("select gene, genename, gene_type from extra")
#   RSQLite::dbDisconnect(db)
#
#   ctwas_gene_res <- cbind(ctwas_gene_res, gene_info[sapply(ctwas_gene_res$id, match, gene_info$gene), c("genename", "gene_type")])
#
#   #add z scores to results
#   load(paste0(results_dir, "/", analysis_id, "_expr_z_gene.Rd"))
#   ctwas_gene_res$z <- z_gene[ctwas_gene_res$id,]$z
#
#   z_snp <- z_snp[z_snp$id %in% ctwas_snp_res$id,]
#   ctwas_snp_res$z <- z_snp$z[match(ctwas_snp_res$id, z_snp$id)]
#
#   #merge gene and snp results with added information
#   ctwas_snp_res$genename=NA
#   ctwas_snp_res$gene_type=NA
#
#   ctwas_res <- rbind(ctwas_gene_res, ctwas_snp_res[,colnames(ctwas_gene_res)])
#
#   #get number of eQTL for genes
#   num_eqtl <- c()
#   for (i in 1:22){
#     load(paste0(results_dir, "/", analysis_id, "_expr_chr", i, ".exprqc.Rd"))
#     num_eqtl <- c(num_eqtl, unlist(lapply(wgtlist, nrow)))
#   }
#   ctwas_gene_res$num_eqtl <- num_eqtl[ctwas_gene_res$id]
#
#   #get number of SNPs from s1 results; adjust for thin argument
#   ctwas_res_s1 <- data.table::fread(paste0(results_dir, "/", analysis_id, "_ctwas.s1.susieIrss.txt"))
#   n_snps <- sum(ctwas_res_s1$type=="SNP")/thin
#   rm(ctwas_res_s1)
#
#   #load estimated parameters
#   load(paste0(results_dir, "/", analysis_id, "_ctwas.s2.susieIrssres.Rd"))
#
#   #estimated group prior
#   estimated_group_prior <- group_prior_rec[,ncol(group_prior_rec)]
#   names(estimated_group_prior) <- c("gene", "snp")
#   estimated_group_prior["snp"] <- estimated_group_prior["snp"]*thin #adjust parameter to account for thin argument
#
#   #estimated group prior variance
#   estimated_group_prior_var <- group_prior_var_rec[,ncol(group_prior_var_rec)]
#   names(estimated_group_prior_var) <- c("gene", "snp")
#
#   #report group size
#   group_size <- c(nrow(ctwas_gene_res), n_snps)
#
#   #estimated group PVE
#   estimated_group_pve <- estimated_group_prior_var*estimated_group_prior*group_size/sample_size
#   names(estimated_group_pve) <- c("gene", "snp")
#
#   #ctwas genes using PIP>0.8
#   ctwas_genes_index <- ctwas_gene_res$susie_pip>0.8
#   ctwas_genes <- ctwas_gene_res$genename[ctwas_genes_index]
#
#   #twas genes using bonferroni threshold
#   alpha <- 0.05
#   sig_thresh <- qnorm(1-(alpha/nrow(ctwas_gene_res)/2), lower=T)
#
#   twas_genes_index <- abs(ctwas_gene_res$z) > sig_thresh
#   twas_genes <- ctwas_gene_res$genename[twas_genes_index]
#
#   #gene PIPs and z scores
#   gene_pips <- ctwas_gene_res[,c("genename", "region_tag", "susie_pip", "z", "region_cs_tag", "num_eqtl")]
#
#   #total PIPs by region
#   regions <- unique(ctwas_gene_res$region_tag)
#   region_pips <- data.frame(region=regions, stringsAsFactors=F)
#   region_pips$gene_pip <- sapply(regions, function(x){sum(ctwas_gene_res$susie_pip[ctwas_gene_res$region_tag==x])})
#   region_pips$snp_pip <- sapply(regions, function(x){sum(ctwas_snp_res$susie_pip[ctwas_snp_res$region_tag==x])})
#   region_pips$snp_maxz <- sapply(regions, function(x){max(abs(ctwas_snp_res$z[ctwas_snp_res$region_tag==x]))})
#   region_pips$which_snp_maxz <- sapply(regions, function(x){ctwas_snp_res_index <- ctwas_snp_res$region_tag==x; ctwas_snp_res$id[ctwas_snp_res_index][which.max(abs(ctwas_snp_res$z[ctwas_snp_res_index]))]})
#
#   #total PIPs by causal set
#   regions_cs <- unique(ctwas_gene_res$region_cs_tag)
#   region_cs_pips <- data.frame(region_cs=regions_cs, stringsAsFactors=F)
#   region_cs_pips$gene_pip <- sapply(regions_cs, function(x){sum(ctwas_gene_res$susie_pip[ctwas_gene_res$region_cs_tag==x])})
#   region_cs_pips$snp_pip <- sapply(regions_cs, function(x){sum(ctwas_snp_res$susie_pip[ctwas_snp_res$region_cs_tag==x])})
#
#   df[[weight]] <- list(prior=estimated_group_prior,
#                      prior_var=estimated_group_prior_var,
#                      pve=estimated_group_pve,
#                      ctwas=ctwas_genes,
#                      twas=twas_genes,
#                      gene_pips=gene_pips,
#                      region_pips=region_pips,
#                      sig_thresh=sig_thresh,
#                      region_cs_pips=region_cs_pips)
# }
#
# save(df, file=paste(trait_dir, "results_df_nolnc.RData", sep="/"))
load(paste(trait_dir, "results_df_nolnc.RData", sep="/"))

output <- data.frame(weight=names(df),
                     prior_g=unlist(lapply(df, function(x){x$prior["gene"]})),
                     prior_s=unlist(lapply(df, function(x){x$prior["snp"]})),
                     prior_var_g=unlist(lapply(df, function(x){x$prior_var["gene"]})),
                     prior_var_s=unlist(lapply(df, function(x){x$prior_var["snp"]})),
                     pve_g=unlist(lapply(df, function(x){x$pve["gene"]})),
                     pve_s=unlist(lapply(df, function(x){x$pve["snp"]})),
                     n_ctwas=unlist(lapply(df, function(x){length(x$ctwas)})),
                     n_twas=unlist(lapply(df, function(x){length(x$twas)})),
                     row.names=NULL,
                     stringsAsFactors=F)
Plot estimated prior parameters and PVE
#plot estimated group prior

output <- output[order(-output$prior_g),]

par(mar=c(10.1, 4.1, 4.1, 2.1))

plot(output$prior_g, type="l", ylim=c(0, max(output$prior_g, output$prior_s)*1.1),
     xlab="", ylab="Estimated Group Prior", xaxt = "n", col="blue")
lines(output$prior_s)

axis(1, at = 1:nrow(output),
     labels = output$weight,
     las=2,
     cex.axis=0.6)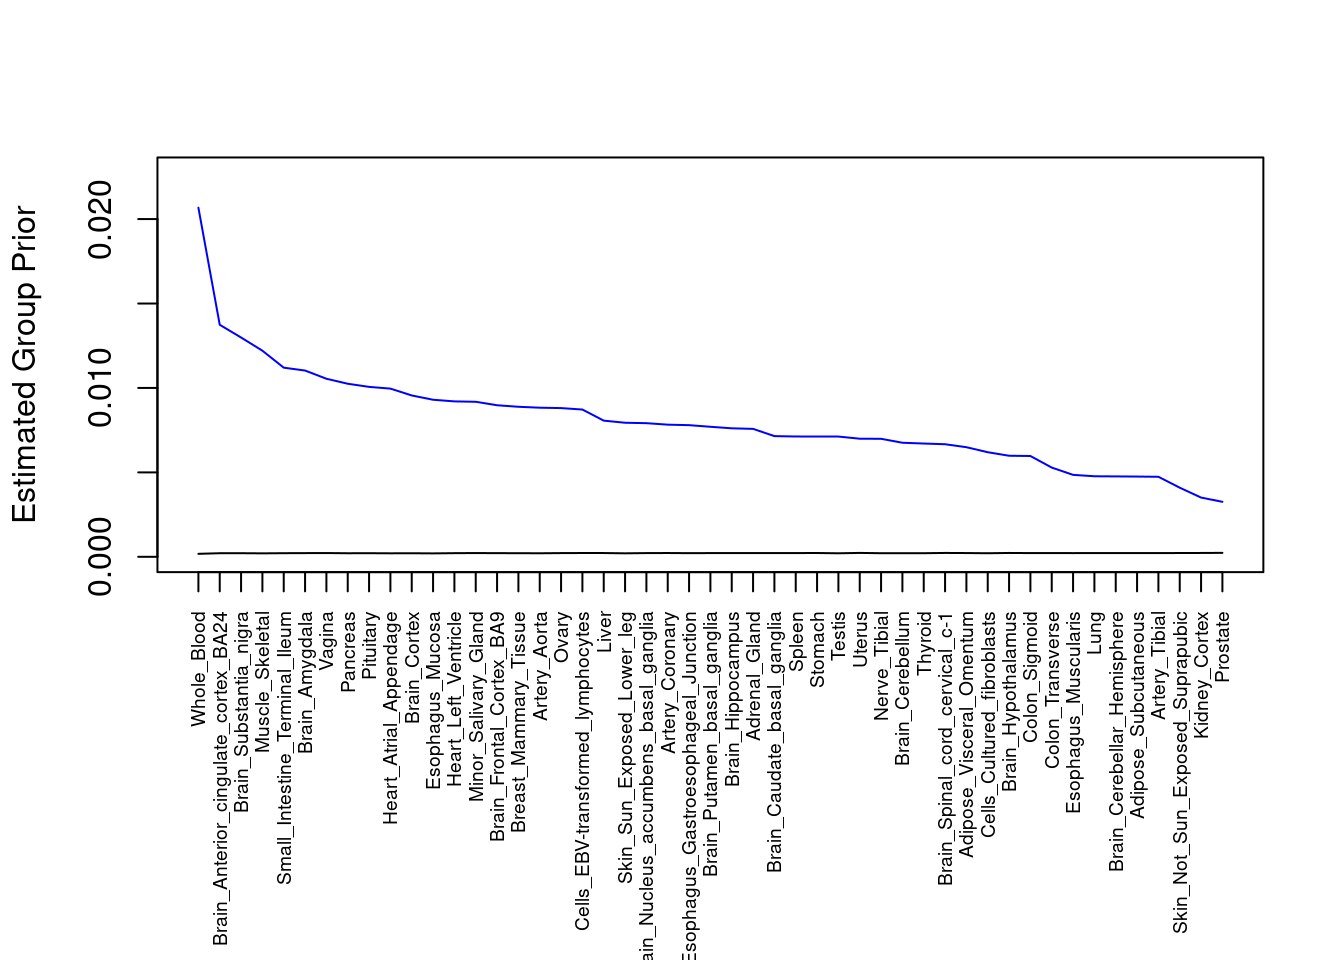
| Version | Author | Date |
|---|---|---|
| 0136d2e | wesleycrouse | 2022-06-10 |
####################
#plot estimated group prior variance

par(mar=c(10.1, 4.1, 4.1, 2.1))

plot(output$prior_var_g, type="l", ylim=c(0, max(output$prior_var_g, output$prior_var_s)*1.1),
     xlab="", ylab="Estimated Group Prior Variance", xaxt = "n", col="blue")
lines(output$prior_var_s)

axis(1, at = 1:nrow(output),
     labels = output$weight,
     las=2,
     cex.axis=0.6)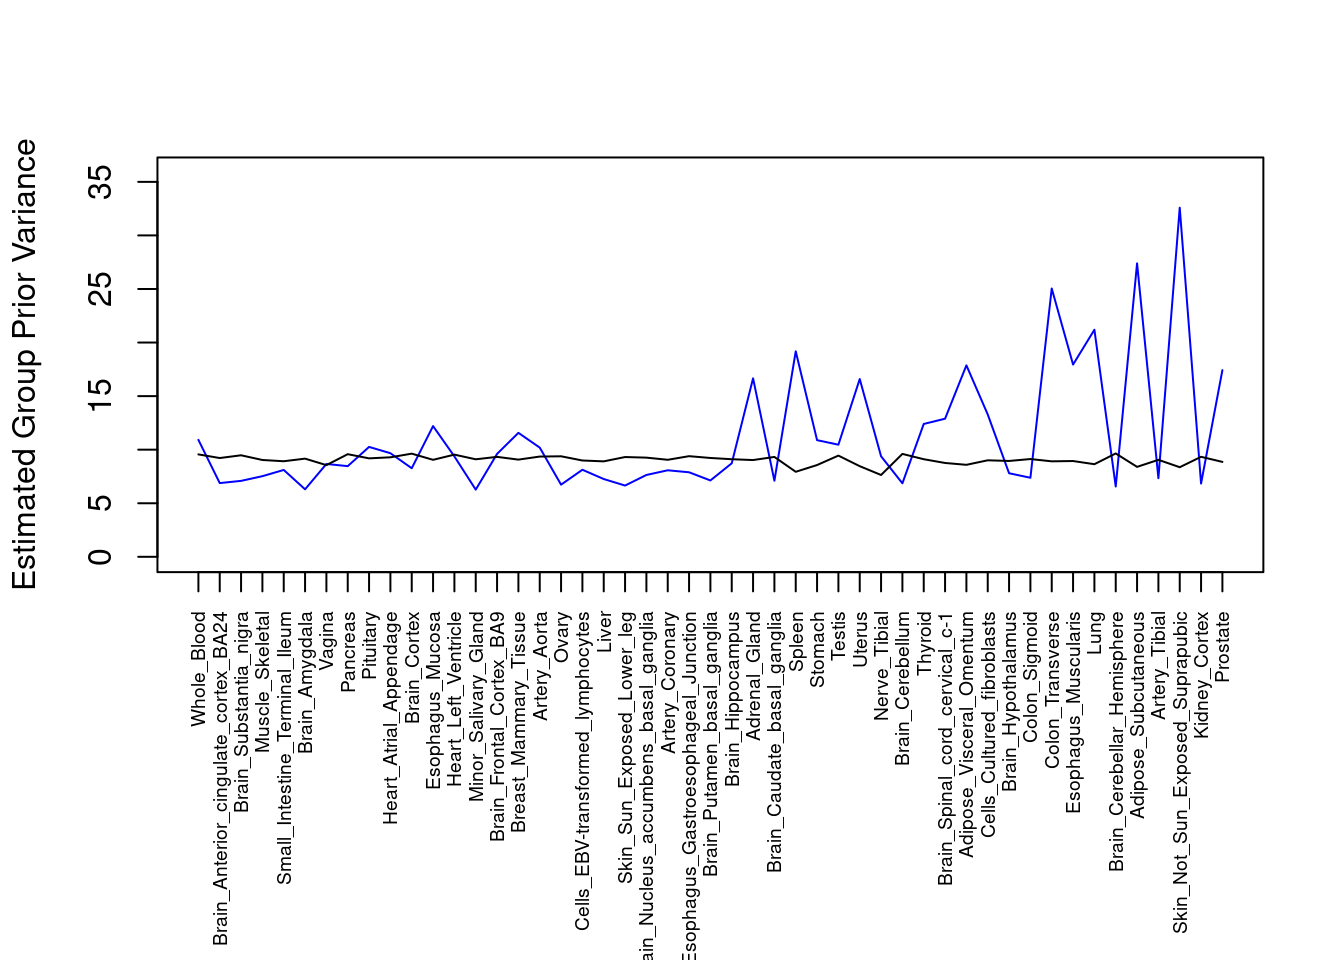
| Version | Author | Date |
|---|---|---|
| 0136d2e | wesleycrouse | 2022-06-10 |
####################
#plot PVE

output <- output[order(-output$pve_g),]

par(mar=c(10.1, 4.1, 4.1, 2.1))

plot(output$pve_g, type="l", ylim=c(0, max(output$pve_g+output$pve_s)*1.1),
     xlab="", ylab="Estimated PVE", xaxt = "n", col="blue")
lines(output$pve_s)
lines(output$pve_g+output$pve_s, lty=2)

axis(1, at = 1:nrow(output),
     labels = output$weight,
     las=2,
     cex.axis=0.6)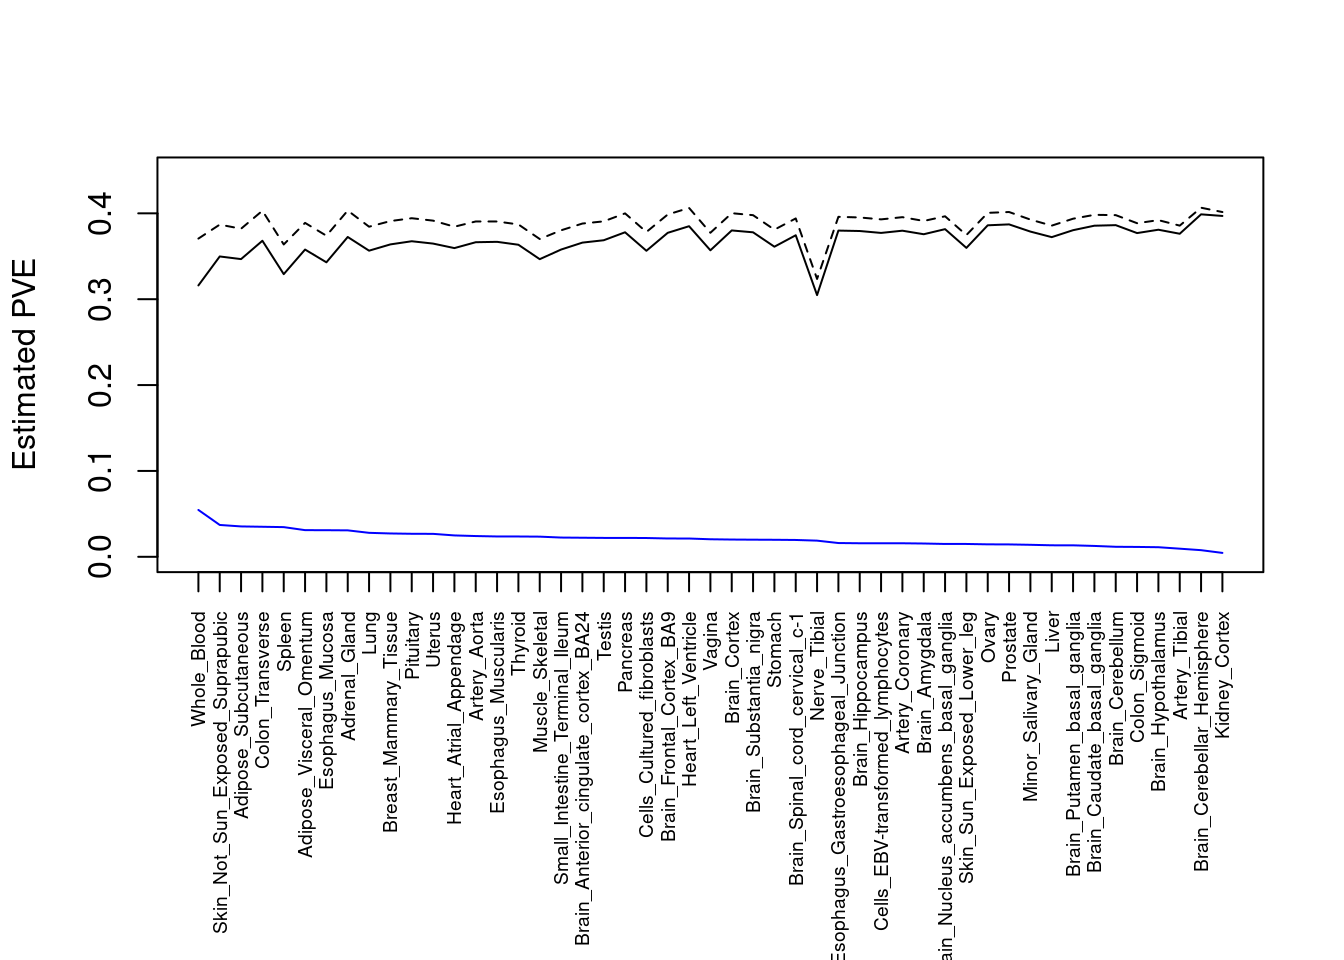
| Version | Author | Date |
|---|---|---|
| 0136d2e | wesleycrouse | 2022-06-10 |
Number of cTWAS and TWAS genes
cTWAS genes are the set of genes with PIP>0.8 in any tissue. TWAS genes are the set of genes with significant z score (Bonferroni within tissue) in any tissue.
#plot number of significant cTWAS and TWAS genes in each tissue
plot(output$n_ctwas, output$n_twas, xlab="Number of cTWAS Genes", ylab="Number of TWAS Genes")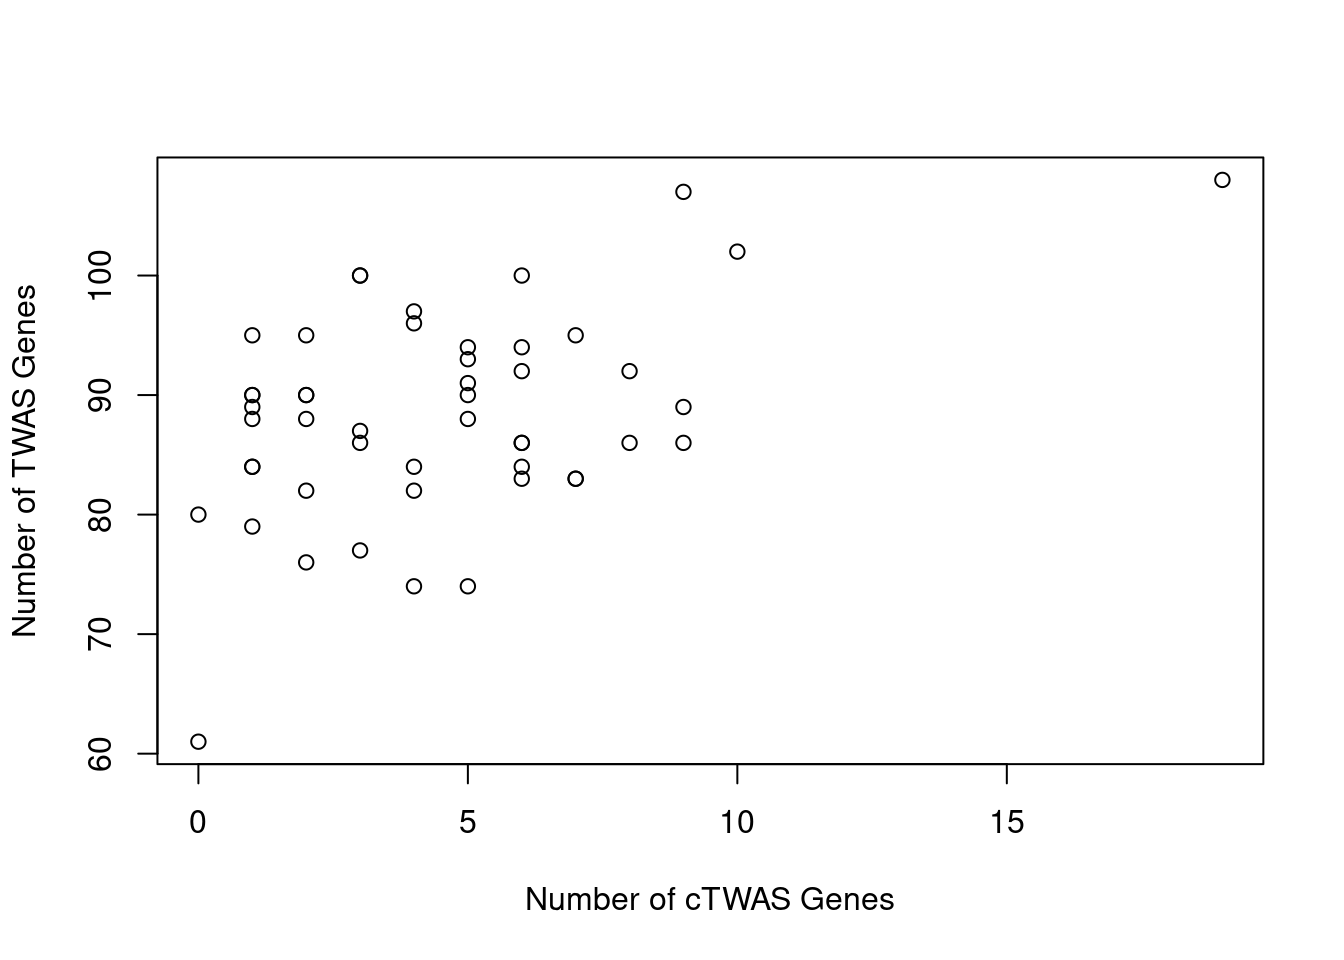
| Version | Author | Date |
|---|---|---|
| 0136d2e | wesleycrouse | 2022-06-10 |
#number of ctwas_genes
ctwas_genes <- unique(unlist(lapply(df, function(x){x$ctwas})))
length(ctwas_genes)
[1] 88#number of twas_genes
twas_genes <- unique(unlist(lapply(df, function(x){x$twas})))
length(twas_genes)[1] 438Enrichment analysis for cTWAS genes
GO
#enrichment for cTWAS genes using enrichR
library(enrichR)
Welcome to enrichR
Checking connection ... Enrichr ... Connection is Live!
FlyEnrichr ... Connection is available!
WormEnrichr ... Connection is available!
YeastEnrichr ... Connection is available!
FishEnrichr ... Connection is available!dbs <- c("GO_Biological_Process_2021", "GO_Cellular_Component_2021", "GO_Molecular_Function_2021")
GO_enrichment <- enrichr(ctwas_genes, dbs)Uploading data to Enrichr... Done.
Querying GO_Biological_Process_2021... Done.
Querying GO_Cellular_Component_2021... Done.
Querying GO_Molecular_Function_2021... Done.
Parsing results... Done.for (db in dbs){
cat(paste0(db, "\n\n"))
enrich_results <- GO_enrichment[[db]]
enrich_results <- enrich_results[enrich_results$Adjusted.P.value<0.05,c("Term", "Overlap", "Adjusted.P.value", "Genes")]
print(enrich_results)
print(plotEnrich(GO_enrichment[[db]]))
}GO_Biological_Process_2021
Term Overlap Adjusted.P.value Genes
1 cytokine-mediated signaling pathway (GO:0019221) 13/621 0.002063929 CD40;CIITA;TNFSF15;IFNGR2;FOS;MMP9;IL18RAP;BCL2L11;SOCS1;TNFSF4;LTBR;HLA-DQB1;IP6K2
2 negative regulation of insulin receptor signaling pathway (GO:0046627) 4/27 0.002063929 SOCS1;RPS6KB1;TSC2;PTPN2
3 negative regulation of cellular response to insulin stimulus (GO:1900077) 4/28 0.002063929 SOCS1;RPS6KB1;TSC2;PTPN2
4 transmembrane receptor protein tyrosine kinase signaling pathway (GO:0007169) 10/404 0.002631675 DDR1;GIGYF1;CNKSR1;RGS14;NCF4;TSC2;ITGAV;MMP9;PTPN2;CDK5R1
5 positive regulation of production of molecular mediator of immune response (GO:0002702) 4/38 0.004317125 LACC1;TNFSF4;CD244;VAMP3
6 regulation of response to interferon-gamma (GO:0060330) 3/14 0.004517535 SOCS1;IFNGR2;PTPN2
7 regulation of insulin receptor signaling pathway (GO:0046626) 4/45 0.006079964 SOCS1;RPS6KB1;TSC2;PTPN2
8 positive regulation of I-kappaB kinase/NF-kappaB signaling (GO:0043123) 6/171 0.012721157 CD40;PPP5C;NDFIP1;CARD9;RBCK1;LTBR
9 regulation of interferon-gamma-mediated signaling pathway (GO:0060334) 3/23 0.014239203 SOCS1;IFNGR2;PTPN2
10 regulation of cytokine-mediated signaling pathway (GO:0001959) 4/74 0.029827064 SOCS1;IFNGR2;RBCK1;PTPN2
11 regulation of I-kappaB kinase/NF-kappaB signaling (GO:0043122) 6/224 0.038003063 CD40;PPP5C;NDFIP1;CARD9;RBCK1;LTBR
12 positive regulation of CD4-positive, alpha-beta T cell differentiation (GO:0043372) 2/8 0.038003063 SOCS1;TNFSF4
13 response to cytokine (GO:0034097) 5/150 0.038003063 CD40;CIITA;SMAD3;SMPD1;PTPN2
14 negative regulation of lipid localization (GO:1905953) 2/9 0.045200858 ITGAV;PTPN2
15 negative regulation of tyrosine phosphorylation of STAT protein (GO:0042532) 2/10 0.049297093 SOCS1;PTPN2
16 regulation of receptor binding (GO:1900120) 2/10 0.049297093 ADAM15;MMP9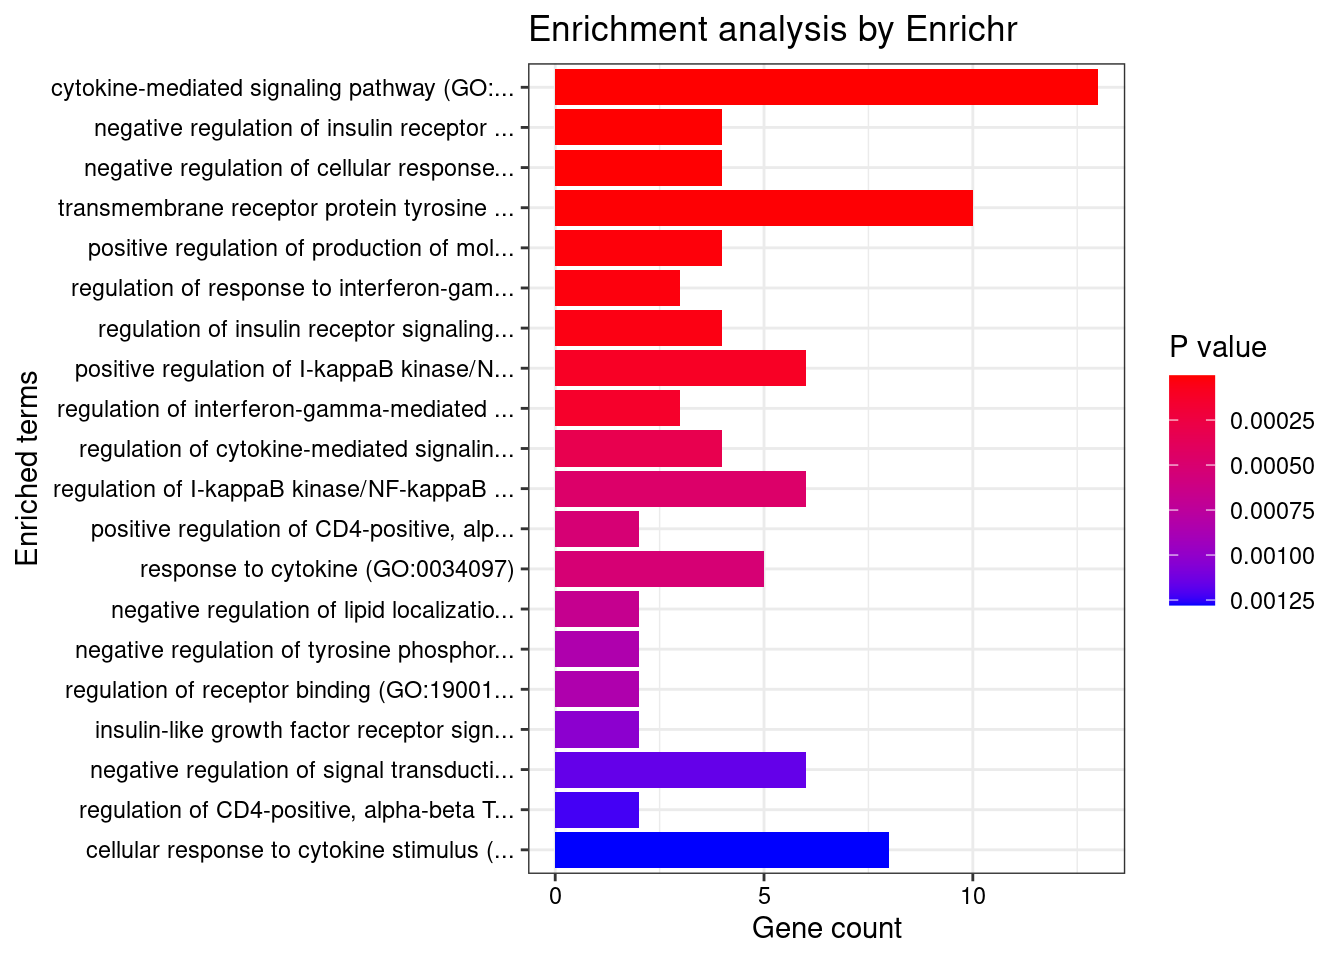
| Version | Author | Date |
|---|---|---|
| 0136d2e | wesleycrouse | 2022-06-10 |
GO_Cellular_Component_2021

[1] Term             Overlap          Adjusted.P.value Genes
<0 rows> (or 0-length row.names)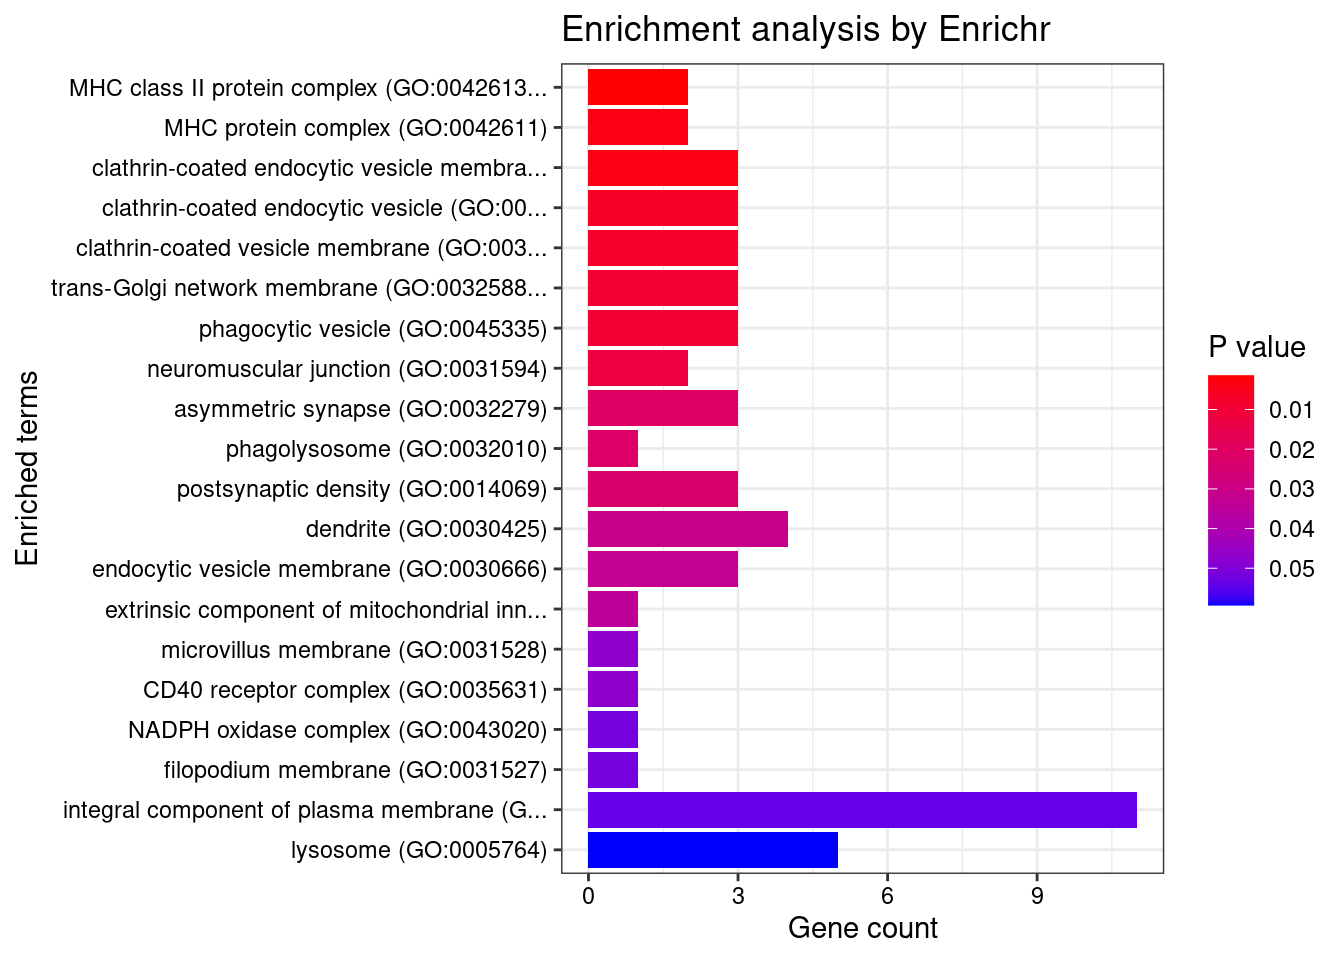
| Version | Author | Date |
|---|---|---|
| 0136d2e | wesleycrouse | 2022-06-10 |
GO_Molecular_Function_2021

[1] Term             Overlap          Adjusted.P.value Genes
<0 rows> (or 0-length row.names)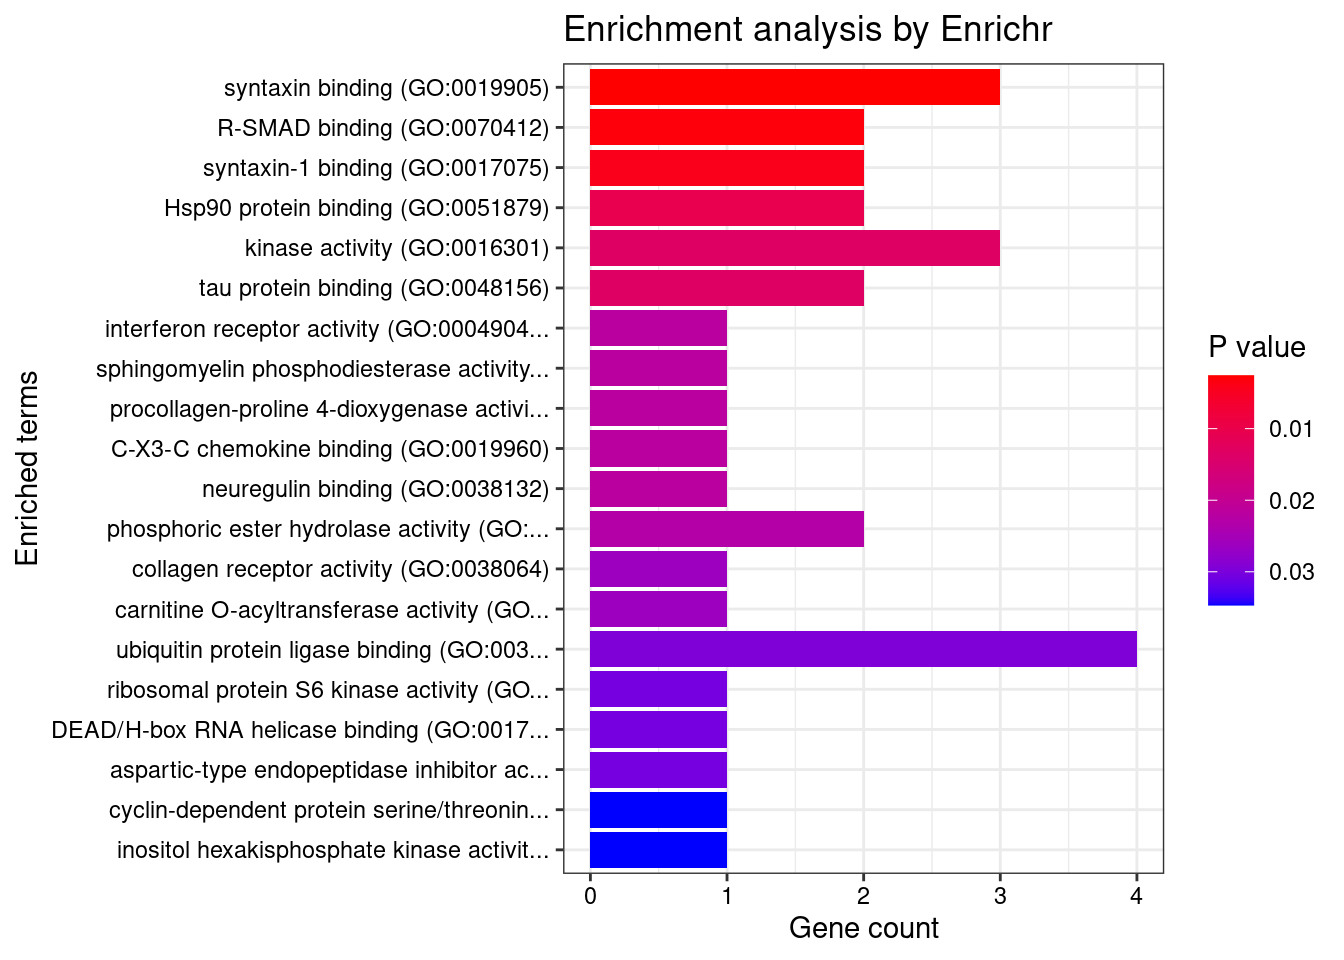
| Version | Author | Date |
|---|---|---|
| 0136d2e | wesleycrouse | 2022-06-10 |
KEGG
#enrichment for cTWAS genes using KEGG

library(WebGestaltR)******************************************* ** Welcome to WebGestaltR ! ** *******************************************background <- unique(unlist(lapply(df, function(x){x$gene_pips$genename})))
#listGeneSet()
databases <- c("pathway_KEGG")
enrichResult <- WebGestaltR(enrichMethod="ORA", organism="hsapiens",
interestGene=ctwas_genes, referenceGene=background,
enrichDatabase=databases, interestGeneType="genesymbol",
referenceGeneType="genesymbol", isOutput=F)Loading the functional categories...
Loading the ID list...
Loading the reference list...
Performing the enrichment analysis...enrichResult[,c("description", "size", "overlap", "FDR", "userId")] description size overlap FDR userId
1 Leishmaniasis 64 6 0.001857302 HLA-DMB;NCF4;FCGR2A;FOS;IFNGR2;HLA-DQB1
2 Inflammatory bowel disease (IBD) 57 5 0.005710433 HLA-DMB;IL18RAP;IFNGR2;HLA-DQB1;SMAD3
3 Phagosome 138 7 0.005710433 HLA-DMB;M6PR;VAMP3;NCF4;FCGR2A;ITGAV;HLA-DQB1
4 Toxoplasmosis 104 6 0.007551916 HLA-DMB;CD40;CIITA;IFNGR2;SOCS1;HLA-DQB1
5 Osteoclast differentiation 116 6 0.011063914 NCF4;FCGR2A;FOS;IFNGR2;FOSL2;SOCS1
6 Intestinal immune network for IgA production 43 4 0.013093495 HLA-DMB;CD40;LTBR;HLA-DQB1
7 Th17 cell differentiation 97 5 0.029186659 HLA-DMB;FOS;IFNGR2;HLA-DQB1;SMAD3
8 Asthma 25 3 0.029511620 HLA-DMB;CD40;HLA-DQB1
9 Tuberculosis 157 6 0.031261822 CARD9;HLA-DMB;FCGR2A;CIITA;IFNGR2;HLA-DQB1
10 Allograft rejection 32 3 0.044717605 HLA-DMB;CD40;HLA-DQB1
11 Human T-cell leukemia virus 1 infection 239 7 0.044717605 HLA-DMB;CD40;LTBR;FOS;ADCY9;HLA-DQB1;SMAD3DisGeNET
#enrichment for cTWAS genes using DisGeNET
# devtools::install_bitbucket("ibi_group/disgenet2r")
library(disgenet2r)
disgenet_api_key <- get_disgenet_api_key(
email = "wesleycrouse@gmail.com",
password = "uchicago1" )
Sys.setenv(DISGENET_API_KEY= disgenet_api_key)
res_enrich <- disease_enrichment(entities=ctwas_genes, vocabulary = "HGNC", database = "CURATED")FGFR1OP gene(s) from the input list not found in DisGeNET CURATEDHLA-DMB gene(s) from the input list not found in DisGeNET CURATEDOSER1 gene(s) from the input list not found in DisGeNET CURATEDADCY9 gene(s) from the input list not found in DisGeNET CURATEDC3orf62 gene(s) from the input list not found in DisGeNET CURATEDSTXBP3 gene(s) from the input list not found in DisGeNET CURATEDNDFIP1 gene(s) from the input list not found in DisGeNET CURATEDSPIRE2 gene(s) from the input list not found in DisGeNET CURATEDKRTCAP3 gene(s) from the input list not found in DisGeNET CURATEDFAM171B gene(s) from the input list not found in DisGeNET CURATEDC1orf106 gene(s) from the input list not found in DisGeNET CURATEDCH25H gene(s) from the input list not found in DisGeNET CURATEDZGLP1 gene(s) from the input list not found in DisGeNET CURATEDGIGYF1 gene(s) from the input list not found in DisGeNET CURATEDVAMP3 gene(s) from the input list not found in DisGeNET CURATEDSDCCAG3 gene(s) from the input list not found in DisGeNET CURATEDSPNS2 gene(s) from the input list not found in DisGeNET CURATEDTMEM229B gene(s) from the input list not found in DisGeNET CURATEDPLEKHH2 gene(s) from the input list not found in DisGeNET CURATEDAPBB1 gene(s) from the input list not found in DisGeNET CURATEDAPEH gene(s) from the input list not found in DisGeNET CURATEDMUC3A gene(s) from the input list not found in DisGeNET CURATEDDEF8 gene(s) from the input list not found in DisGeNET CURATEDEVA1B gene(s) from the input list not found in DisGeNET CURATEDSH3D21 gene(s) from the input list not found in DisGeNET CURATEDRGS14 gene(s) from the input list not found in DisGeNET CURATEDADAM15 gene(s) from the input list not found in DisGeNET CURATEDOAZ3 gene(s) from the input list not found in DisGeNET CURATEDAGAP5 gene(s) from the input list not found in DisGeNET CURATEDC11orf58 gene(s) from the input list not found in DisGeNET CURATEDOR2H2 gene(s) from the input list not found in DisGeNET CURATEDPPP5C gene(s) from the input list not found in DisGeNET CURATEDif (any(res_enrich@qresult$FDR < 0.05)){
print(res_enrich@qresult[res_enrich@qresult$FDR < 0.05, c("Description", "FDR", "Ratio", "BgRatio")])
} Description FDR Ratio BgRatio
191 Crohn's disease of large bowel 5.756608e-07 7/56 44/9703
232 Crohn's disease of the ileum 5.756608e-07 7/56 44/9703
317 Regional enteritis 5.756608e-07 7/56 44/9703
368 IIeocolitis 5.756608e-07 7/56 44/9703
44 Crohn Disease 1.168845e-06 7/56 50/9703
38 Ulcerative Colitis 5.092757e-06 7/56 63/9703
83 Inflammatory Bowel Diseases 3.178355e-03 4/56 35/9703
12 Rheumatoid Arthritis 3.574558e-03 7/56 174/9703
115 Mucocutaneous Lymph Node Syndrome 1.054802e-02 2/56 4/9703
22 Brain Diseases 1.865754e-02 3/56 25/9703
90 Fibroid Tumor 1.963113e-02 2/56 6/9703
173 Encephalopathies 1.963113e-02 3/56 27/9703
9 Aortic Aneurysm 2.190538e-02 2/56 7/9703
169 Uterine Fibroids 2.190538e-02 2/56 7/9703
431 Juvenile pauciarticular chronic arthritis 2.190538e-02 2/56 7/9703
85 Jacksonian Seizure 3.637636e-02 4/56 101/9703
186 Complex partial seizures 3.637636e-02 4/56 101/9703
211 Generalized seizures 3.637636e-02 4/56 101/9703
212 Clonic Seizures 3.637636e-02 4/56 101/9703
238 Visual seizure 3.637636e-02 4/56 101/9703
239 Tonic Seizures 3.637636e-02 4/56 102/9703
240 Epileptic drop attack 3.637636e-02 4/56 101/9703
291 Seizures, Somatosensory 3.637636e-02 4/56 101/9703
292 Seizures, Auditory 3.637636e-02 4/56 101/9703
293 Olfactory seizure 3.637636e-02 4/56 101/9703
294 Gustatory seizure 3.637636e-02 4/56 101/9703
295 Vertiginous seizure 3.637636e-02 4/56 101/9703
302 Tonic - clonic seizures 3.637636e-02 4/56 104/9703
332 Non-epileptic convulsion 3.637636e-02 4/56 101/9703
334 Single Seizure 3.637636e-02 4/56 101/9703
336 Atonic Absence Seizures 3.637636e-02 4/56 101/9703
347 Convulsive Seizures 3.637636e-02 4/56 101/9703
348 Seizures, Focal 3.637636e-02 4/56 104/9703
349 Seizures, Sensory 3.637636e-02 4/56 101/9703
442 Nonepileptic Seizures 3.637636e-02 4/56 101/9703
457 Convulsions 3.637636e-02 4/56 102/9703
467 Absence Seizures 3.637636e-02 4/56 102/9703
468 Epileptic Seizures 3.637636e-02 4/56 101/9703
469 Myoclonic Seizures 3.637636e-02 4/56 104/9703
470 Generalized Absence Seizures 3.637636e-02 4/56 101/9703
56 Enteritis 3.990377e-02 1/56 1/9703
103 Malaria 3.990377e-02 2/56 20/9703
120 Narcolepsy 3.990377e-02 2/56 17/9703
125 Niemann-Pick Diseases 3.990377e-02 1/56 1/9703
142 Pulmonary Emphysema 3.990377e-02 2/56 17/9703
150 Systemic Scleroderma 3.990377e-02 2/56 19/9703
195 Caliciviridae Infections 3.990377e-02 1/56 1/9703
207 Infections, Calicivirus 3.990377e-02 1/56 1/9703
208 Kleine-Levin Syndrome 3.990377e-02 1/56 1/9703
224 Libman-Sacks Disease 3.990377e-02 3/56 58/9703
233 Niemann-Pick Disease, Type A 3.990377e-02 1/56 1/9703
234 Niemann-Pick Disease, Type B 3.990377e-02 1/56 1/9703
235 Niemann-Pick Disease, Type E 3.990377e-02 1/56 1/9703
346 Narcolepsy-Cataplexy Syndrome 3.990377e-02 2/56 16/9703
387 Deep seated dermatophytosis 3.990377e-02 1/56 1/9703
414 Bare Lymphocyte Syndrome, Type II, Complementation Group A 3.990377e-02 1/56 1/9703
421 Inflammatory Bowel Disease 10 3.990377e-02 1/56 1/9703
426 VITAMIN B12 PLASMA LEVEL QUANTITATIVE TRAIT LOCUS 1 3.990377e-02 1/56 1/9703
428 Metaphyseal Anadysplasia 2 3.990377e-02 1/56 1/9703
439 LOEYS-DIETZ SYNDROME 3 3.990377e-02 1/56 1/9703
440 GRANULOMATOUS DISEASE, CHRONIC, AUTOSOMAL RECESSIVE, CYTOCHROME b-POSITIVE, TYPE III 3.990377e-02 1/56 1/9703
443 Infection caused by Norovirus 3.990377e-02 1/56 1/9703
450 NEPHROTIC SYNDROME, TYPE 9 3.990377e-02 1/56 1/9703
454 IMMUNODEFICIENCY 28 3.990377e-02 1/56 1/9703
456 COMBINED OXIDATIVE PHOSPHORYLATION DEFICIENCY 20 3.990377e-02 1/56 1/9703
458 EPILEPSY, IDIOPATHIC GENERALIZED, SUSCEPTIBILITY TO, 14 3.990377e-02 1/56 1/9703
459 MICROCEPHALY 16, PRIMARY, AUTOSOMAL RECESSIVE 3.990377e-02 1/56 1/9703
460 EPILEPTIC ENCEPHALOPATHY, EARLY INFANTILE, 34 3.990377e-02 1/56 1/9703
461 SPASTIC PARAPLEGIA 73, AUTOSOMAL DOMINANT 3.990377e-02 1/56 1/9703
466 MYOPIA 25, AUTOSOMAL DOMINANT 3.990377e-02 1/56 1/9703
487 Polyglucosan body myopathy type 1 3.990377e-02 1/56 1/9703
237 Petit mal status 4.253339e-02 3/56 67/9703
256 Grand Mal Status Epilepticus 4.253339e-02 3/56 67/9703
283 Complex Partial Status Epilepticus 4.253339e-02 3/56 67/9703
350 Status Epilepticus, Subclinical 4.253339e-02 3/56 67/9703
351 Non-Convulsive Status Epilepticus 4.253339e-02 3/56 67/9703
352 Simple Partial Status Epilepticus 4.253339e-02 3/56 67/9703
156 Status Epilepticus 4.374828e-02 3/56 68/9703
180 Juvenile-Onset Still Disease 4.646735e-02 4/56 135/9703
100 Lupus Erythematosus, Systemic 4.805778e-02 3/56 71/9703Gene sets curated by Macarthur Lab
gene_set_dir <- "/project2/mstephens/wcrouse/gene_sets/"
gene_set_files <- c("gwascatalog.tsv",
"mgi_essential.tsv",
"core_essentials_hart.tsv",
"clinvar_path_likelypath.tsv",
"fda_approved_drug_targets.tsv")
gene_sets <- lapply(gene_set_files, function(x){as.character(read.table(paste0(gene_set_dir, x))[,1])})
names(gene_sets) <- sapply(gene_set_files, function(x){unlist(strsplit(x, "[.]"))[1]})
gene_lists <- list(ctwas_genes=ctwas_genes)
#background is union of genes analyzed in all tissue
background <- unique(unlist(lapply(df, function(x){x$gene_pips$genename})))
#genes in gene_sets filtered to ensure inclusion in background
gene_sets <- lapply(gene_sets, function(x){x[x %in% background]})
####################
hyp_score <- data.frame()
size <- c()
ngenes <- c()
for (i in 1:length(gene_sets)) {
for (j in 1:length(gene_lists)){
group1 <- length(gene_sets[[i]])
group2 <- length(as.vector(gene_lists[[j]]))
size <- c(size, group1)
Overlap <- length(intersect(gene_sets[[i]],as.vector(gene_lists[[j]])))
ngenes <- c(ngenes, Overlap)
Total <- length(background)
hyp_score[i,j] <- phyper(Overlap-1, group2, Total-group2, group1,lower.tail=F)
}
}
rownames(hyp_score) <- names(gene_sets)
colnames(hyp_score) <- names(gene_lists)
hyp_score_padj <- apply(hyp_score,2, p.adjust, method="BH", n=(nrow(hyp_score)*ncol(hyp_score)))
hyp_score_padj <- as.data.frame(hyp_score_padj)
hyp_score_padj$gene_set <- rownames(hyp_score_padj)
hyp_score_padj$nset <- size
hyp_score_padj$ngenes <- ngenes
hyp_score_padj$percent <- ngenes/size
hyp_score_padj <- hyp_score_padj[order(hyp_score_padj$ctwas_genes),]
colnames(hyp_score_padj)[1] <- "padj"
hyp_score_padj <- hyp_score_padj[,c(2:5,1)]
rownames(hyp_score_padj)<- NULL
hyp_score_padj gene_set nset ngenes percent padj
1 gwascatalog 5969 51 0.008544145 4.286184e-05
2 mgi_essential 2305 17 0.007375271 1.977733e-01
3 clinvar_path_likelypath 2771 14 0.005052328 7.224533e-01
4 fda_approved_drug_targets 352 2 0.005681818 7.224533e-01
5 core_essentials_hart 265 0 0.000000000 1.000000e+00Enrichment analysis for TWAS genes
#enrichment for TWAS genes
dbs <- c("GO_Biological_Process_2021", "GO_Cellular_Component_2021", "GO_Molecular_Function_2021")
GO_enrichment <- enrichr(twas_genes, dbs)Uploading data to Enrichr... Done.
Querying GO_Biological_Process_2021... Done.
Querying GO_Cellular_Component_2021... Done.
Querying GO_Molecular_Function_2021... Done.
Parsing results... Done.for (db in dbs){
cat(paste0(db, "\n\n"))
enrich_results <- GO_enrichment[[db]]
enrich_results <- enrich_results[enrich_results$Adjusted.P.value<0.05,c("Term", "Overlap", "Adjusted.P.value", "Genes")]
print(enrich_results)
print(plotEnrich(GO_enrichment[[db]]))
}GO_Biological_Process_2021
Term Overlap Adjusted.P.value Genes
1 cytokine-mediated signaling pathway (GO:0019221) 57/621 8.790411e-17 CIITA;CD40;TNFRSF6B;IL23R;IL27;RPS6KA4;IL18RAP;PSMD3;IL12B;TNFSF11;MAP3K8;JAK2;IL6R;RIPK2;IFNGR2;IL13;HLA-B;HLA-C;FOS;HLA-A;TYK2;HLA-G;MMP9;PSMA6;IRF1;CSNK2B;LTA;IRF6;HLA-DQB2;HLA-DQB1;CCL13;CCL11;CUL1;NOD2;IL1RL1;MUC1;BCL2L11;SOCS1;CAMK2G;HLA-DQA1;IL12RB2;IP6K2;STAT5A;STAT5B;TNFSF15;STAT3;LIF;PSMB8;PSMB9;IL4;POMC;TNFSF4;IL2RA;TNFSF8;LTBR;TRIM31;IL18R1
2 cellular response to cytokine stimulus (GO:0071345) 37/482 5.197519e-08 CCL13;CD40;CCL11;IL23R;GBA;AIF1;ZFP36L2;ZFP36L1;SBNO2;MUC1;BCL2L11;SOCS1;IL12B;TNFSF11;JAK2;IL6R;IL12RB2;STAT5A;STAT5B;SMAD3;IFNGR2;STAT3;IL13;LIF;FOS;TYK2;MMP9;IRGM;RHOA;IL4;POMC;IL2RA;IRF1;ARHGEF2;SLC26A6;PTPN2;IL18R1
3 cellular response to interferon-gamma (GO:0071346) 18/121 1.287629e-07 CCL13;CIITA;CCL11;IFNGR2;HLA-B;HLA-C;HLA-A;HLA-G;AIF1;IRF1;IRF6;JAK2;TRIM31;CAMK2G;HLA-DQA1;SLC26A6;HLA-DQB2;HLA-DQB1
4 interferon-gamma-mediated signaling pathway (GO:0060333) 14/68 1.287629e-07 CIITA;IFNGR2;HLA-B;HLA-C;HLA-A;HLA-G;IRF1;IRF6;JAK2;TRIM31;CAMK2G;HLA-DQB2;HLA-DQA1;HLA-DQB1
5 positive regulation of cytokine production (GO:0001819) 29/335 1.798857e-07 PTGER4;CD40;IL23R;IL27;PARK7;NOD2;AIF1;AGER;RASGRP1;FLOT1;POLR2E;IL12B;IL6R;IL12RB2;RIPK2;IL13;CARD9;STAT3;HLA-A;HLA-G;CCDC88B;IL4;LACC1;PTPRC;TNFSF4;IRF1;ARHGEF2;IL18R1;CD244
6 antigen processing and presentation of exogenous peptide antigen via MHC class I (GO:0042590) 13/78 5.825916e-06 NCF4;HLA-B;TAP2;HLA-C;TAP1;LNPEP;HLA-A;HLA-G;PSMB8;PSMB9;PSMA6;PSMD3;ITGAV
7 cellular response to tumor necrosis factor (GO:0071356) 19/194 1.860315e-05 CCL13;CD40;TNFRSF6B;CCL11;TNFSF15;GBA;PSMB8;ZFP36L2;PSMB9;ZFP36L1;PSMA6;TNFSF4;PSMD3;LTA;TNFSF11;TNFSF8;ARHGEF2;LTBR;JAK2
8 antigen processing and presentation of exogenous peptide antigen via MHC class I, TAP-dependent (GO:0002479) 12/73 1.860315e-05 PSMA6;NCF4;PSMD3;HLA-B;TAP2;HLA-C;TAP1;ITGAV;HLA-A;HLA-G;PSMB8;PSMB9
9 antigen processing and presentation of exogenous peptide antigen via MHC class I, TAP-independent (GO:0002480) 5/8 7.504107e-05 HLA-B;HLA-C;LNPEP;HLA-A;HLA-G
10 T cell receptor signaling pathway (GO:0050852) 16/158 1.002025e-04 DENND1B;MOG;RIPK2;CUL1;HLA-A;BTNL2;PSMB8;PSMB9;PSMA6;PTPRC;PSMD3;ICOSLG;HLA-DQA1;LAT;HLA-DQB2;HLA-DQB1
11 antigen processing and presentation of peptide antigen via MHC class I (GO:0002474) 8/33 1.002025e-04 ERAP2;HLA-B;TAP2;HLA-C;TAP1;HLA-A;HLA-G;SEC24C
12 interleukin-23-mediated signaling pathway (GO:0038155) 5/9 1.226372e-04 IL23R;STAT3;IL12B;TYK2;JAK2
13 positive regulation of T cell activation (GO:0050870) 11/75 1.226372e-04 CCDC88B;IL4;HLA-DMB;PTPRC;IL23R;TNFSF4;IL12B;TNFSF11;HLA-A;NOD2;AIF1
14 regulation of inflammatory response (GO:0050727) 18/206 1.226372e-04 PTGER4;IL13;GBA;PARK7;NOD2;MMP9;IL4;CYLD;LACC1;PSMA6;SBNO2;FNDC4;TNFSF4;IL12B;JAK2;GPSM3;PTPN2;BRD4
15 antigen receptor-mediated signaling pathway (GO:0050851) 17/185 1.226372e-04 DENND1B;MOG;RIPK2;CUL1;HLA-A;BTNL2;LIME1;PSMB8;PSMB9;PSMA6;PTPRC;PSMD3;ICOSLG;HLA-DQA1;LAT;HLA-DQB2;HLA-DQB1
16 regulation of T cell proliferation (GO:0042129) 11/76 1.262113e-04 CCDC88B;IL4;HLA-DMB;PTPRC;IL23R;TNFSF4;IL12B;IL27;TNFSF8;HLA-G;AIF1
17 regulation of MAP kinase activity (GO:0043405) 12/97 2.113341e-04 CD40;EDN3;LRRK2;SMPD1;GBA;ERBB2;TNFSF11;MST1R;NOD2;TRIB1;RASGRP1;LIME1
18 tumor necrosis factor-mediated signaling pathway (GO:0033209) 13/116 2.198946e-04 CD40;TNFRSF6B;TNFSF15;PSMB8;PSMB9;PSMA6;TNFSF4;PSMD3;LTA;TNFSF11;TNFSF8;LTBR;JAK2
19 positive regulation of T cell proliferation (GO:0042102) 10/66 2.198946e-04 CCDC88B;IL4;HLA-DMB;PTPRC;IL23R;TNFSF4;IL12B;AGER;AIF1;ICOSLG
20 regulation of tyrosine phosphorylation of STAT protein (GO:0042509) 10/68 2.768714e-04 IL4;CD40;SOCS1;IL23R;STAT3;LIF;IL12B;JAK2;IL6R;PTPN2
21 regulation of lymphocyte proliferation (GO:0050670) 6/19 2.784332e-04 LST1;IL12B;IL27;TNFSF8;ZNF335;IKZF3
22 regulation of T cell mediated cytotoxicity (GO:0001914) 7/29 2.784332e-04 PTPRC;IL23R;HLA-B;IL12B;HLA-A;AGER;HLA-G
23 positive regulation of interferon-gamma production (GO:0032729) 9/57 4.254137e-04 IL23R;TNFSF4;IL12B;IL27;HLA-A;RASGRP1;CD244;IL18R1;IL12RB2
24 positive regulation of lymphocyte proliferation (GO:0050671) 10/75 5.739041e-04 CCDC88B;IL4;CD40;HLA-DMB;PTPRC;IL23R;TNFSF4;IL12B;ZNF335;AIF1
25 regulation of cytokine production (GO:0001817) 14/150 5.860382e-04 PTGER4;PPP1R11;MOG;CARD9;HLA-B;BTNL2;RPS6KA4;CCDC88B;PTPRC;SYT11;TNFSF4;FLOT1;IL12B;ICOSLG
26 positive regulation of interleukin-12 production (GO:0032735) 7/34 6.561412e-04 CD40;RIPK2;IL23R;TNFSF4;IL12B;AGER;HLA-G
27 antigen processing and presentation of endogenous peptide antigen via MHC class I via ER pathway (GO:0002484) 4/7 6.561412e-04 HLA-B;HLA-C;HLA-A;HLA-G
28 antigen processing and presentation of endogenous peptide antigen via MHC class I via ER pathway, TAP-independent (GO:0002486) 4/7 6.561412e-04 HLA-B;HLA-C;HLA-A;HLA-G
29 nucleotide-binding oligomerization domain containing 2 signaling pathway (GO:0070431) 4/7 6.561412e-04 LACC1;RIPK2;NOD2;IRGM
30 regulation of interferon-gamma-mediated signaling pathway (GO:0060334) 6/23 6.561412e-04 SOCS1;IFNGR2;CDC37;JAK2;IRGM;PTPN2
31 antigen processing and presentation of endogenous peptide antigen (GO:0002483) 5/14 6.561412e-04 ERAP2;TAP2;TAP1;HLA-A;HLA-G
32 regulation of response to interferon-gamma (GO:0060330) 5/14 6.561412e-04 SOCS1;IFNGR2;CDC37;JAK2;PTPN2
33 immune response-regulating cell surface receptor signaling pathway (GO:0002768) 5/14 6.561412e-04 BAG6;CD40;NCR3;HLA-G;MICB
34 regulation of interleukin-10 production (GO:0032653) 8/48 6.609068e-04 IL4;IL23R;TNFSF4;IL13;STAT3;IL12B;NOD2;AGER
35 regulation of immune response (GO:0050776) 15/179 7.314246e-04 DENND1B;CD40;ITGA4;HLA-B;HLA-C;ICAM5;HLA-A;HLA-G;ADCY7;IL4;NCR3;TNFSF4;IRF1;MICA;MICB
36 cellular response to type I interferon (GO:0071357) 9/65 8.050277e-04 IRF1;HLA-B;HLA-C;HLA-A;TYK2;IRF6;HLA-G;PSMB8;IP6K2
37 type I interferon signaling pathway (GO:0060337) 9/65 8.050277e-04 IRF1;HLA-B;HLA-C;HLA-A;TYK2;IRF6;HLA-G;PSMB8;IP6K2
38 regulation of defense response (GO:0031347) 10/83 9.101929e-04 PSMA6;CYLD;LACC1;SBNO2;IRF1;TNFSF4;PARK7;NOD2;JAK2;BRD4
39 regulation of interleukin-12 production (GO:0032655) 8/51 9.180477e-04 CD40;RIPK2;IL23R;TNFSF4;HLA-B;IL12B;HLA-G;AGER
40 antigen processing and presentation of endogenous peptide antigen via MHC class I (GO:0019885) 4/8 9.576036e-04 ERAP2;TAP2;TAP1;HLA-A
41 regulation of tumor necrosis factor production (GO:0032680) 12/124 1.150306e-03 IL4;POMC;PTPRC;SYT11;NFKBIL1;STAT3;IL12B;ARHGEF2;NOD2;JAK2;AGER;RASGRP1
42 positive regulation of protein serine/threonine kinase activity (GO:0071902) 11/106 1.296331e-03 CD40;CCNY;EDN3;LRRK2;ERBB2;TNFSF11;MST1R;NOD2;RASGRP1;IRGM;RHOA
43 regulation of B cell activation (GO:0050864) 6/28 1.604375e-03 IL4;TNFSF4;NOD2;IKZF3;ZFP36L2;ZFP36L1
44 regulation of interleukin-6 production (GO:0032675) 11/110 1.754954e-03 SYT11;TNFSF4;GBA;CARD9;STAT3;HLA-B;ARHGEF2;NOD2;IL6R;AGER;AIF1
45 positive regulation of DNA-binding transcription factor activity (GO:0051091) 17/246 1.861955e-03 CD40;SMAD3;RIPK2;CARD9;STAT3;ARID5B;PARK7;NOD2;AGER;RPS6KA4;PSMA6;IL18RAP;FLOT1;TNFSF11;ARHGEF2;TRIM31;IL18R1
46 positive regulation of leukocyte mediated cytotoxicity (GO:0001912) 7/43 2.096827e-03 NCR3;IL23R;HLA-B;IL12B;HLA-A;RASGRP1;HLA-G
47 positive regulation of NF-kappaB transcription factor activity (GO:0051092) 13/155 2.096827e-03 CD40;RIPK2;CARD9;STAT3;NOD2;AGER;RPS6KA4;PSMA6;IL18RAP;FLOT1;TNFSF11;ARHGEF2;IL18R1
48 positive regulation of peptidyl-tyrosine phosphorylation (GO:0050731) 12/134 2.135854e-03 EFNA1;IL4;CD40;PTPRC;RIPK2;IL23R;STAT3;LIF;IL12B;ARHGEF2;JAK2;IL6R
49 positive regulation of tyrosine phosphorylation of STAT protein (GO:0042531) 8/59 2.183923e-03 IL4;CD40;IL23R;STAT3;LIF;IL12B;JAK2;IL6R
50 MAPK cascade (GO:0000165) 19/303 2.234376e-03 PTGER4;LRRK2;CUL1;RASGRP1;PSMB8;ZFP36L2;PSMB9;ZFP36L1;PSMA6;PPP5C;IL2RA;PSMD3;RASA2;ERBB2;MAP3K8;ITGAV;JAK2;MARK3;LAT
51 inflammatory response (GO:0006954) 16/230 2.576370e-03 PTGER4;CCL13;CD40;CIITA;CCL11;RIPK2;STAT3;FOS;AIF1;IL4;PRDX5;NCR3;TNFSF4;IL2RA;REL;LAT
52 positive regulation of interleukin-10 production (GO:0032733) 6/32 2.963201e-03 IL4;TNFSF4;IL13;STAT3;IL12B;NOD2
53 inositol phosphate biosynthetic process (GO:0032958) 4/11 3.233341e-03 ITPKC;IPMK;IP6K1;IP6K2
54 positive regulation of T cell cytokine production (GO:0002726) 5/21 3.590662e-03 IL4;DENND1B;TNFSF4;HLA-A;IL18R1
55 positive regulation of protein phosphorylation (GO:0001934) 21/371 3.601595e-03 CD40;RIPK2;LRRK2;LIF;ITLN1;PARK7;AGER;RASGRP1;MMP9;IRGM;RPS6KA4;EFNA1;RAD50;PTPRC;CSNK2B;ERBB2;FLOT1;ARHGEF2;JAK2;IL6R;LAT
56 antigen processing and presentation of exogenous peptide antigen (GO:0002478) 10/103 4.062107e-03 HLA-DMA;HLA-DMB;HLA-A;HLA-DOA;KLC1;HLA-DOB;SEC24C;HLA-DQA1;HLA-DQB2;HLA-DQB1
57 positive regulation of lymphocyte activation (GO:0051251) 6/35 4.580599e-03 CCDC88B;TNFSF4;IL12B;TNFSF11;NOD2;ZNF335
58 regulation of interferon-gamma production (GO:0032649) 9/86 4.928707e-03 IL23R;TNFSF4;IL12B;IL27;HLA-A;RASGRP1;CD244;IL18R1;IL12RB2
59 response to cytokine (GO:0034097) 12/150 5.042185e-03 CD40;CIITA;SMAD3;IL23R;SMPD1;STAT3;REL;JAK2;IL6R;RHOA;IL18R1;PTPN2
60 macrophage activation (GO:0042116) 6/36 5.042185e-03 IL4;SBNO2;IL13;JAK2;AGER;AIF1
61 positive regulation of T cell mediated immunity (GO:0002711) 6/36 5.042185e-03 IL23R;TNFSF4;HLA-B;IL12B;HLA-A;HLA-G
62 positive regulation of MAP kinase activity (GO:0043406) 8/69 5.378717e-03 CD40;EDN3;LRRK2;ERBB2;TNFSF11;MST1R;NOD2;RASGRP1
63 regulation of response to external stimulus (GO:0032101) 11/130 5.654483e-03 CYLD;LACC1;PSMA6;SBNO2;TNFSF4;IRF1;SAG;PARK7;NOD2;JAK2;BRD4
64 cellular response to interleukin-1 (GO:0071347) 12/155 6.533212e-03 RPS6KA4;PSMA6;CCL13;CD40;CCL11;RIPK2;PSMD3;CUL1;MAP3K8;NOD2;PSMB8;PSMB9
65 regulation of peptidyl-tyrosine phosphorylation (GO:0050730) 9/92 6.940965e-03 EFNA1;PTPRC;RIPK2;IL23R;LIF;IL12B;ARHGEF2;JAK2;IL6R
66 T cell activation (GO:0042110) 9/92 6.940965e-03 IL4;PTPRC;TNFSF4;RASGRP1;ICOSLG;MICA;LAT;PTPN2;MICB
67 response to peptide (GO:1901652) 6/39 6.940965e-03 STAT5A;STAT5B;STAT3;NOD2;AGER;MMP9
68 growth hormone receptor signaling pathway via JAK-STAT (GO:0060397) 4/14 6.940965e-03 STAT5A;STAT5B;STAT3;JAK2
69 T cell differentiation in thymus (GO:0033077) 4/14 6.940965e-03 PTPRC;CCR6;ZFP36L2;ZFP36L1
70 positive regulation of granulocyte macrophage colony-stimulating factor production (GO:0032725) 4/14 6.940965e-03 IL23R;CARD9;IL12B;RASGRP1
71 positive regulation of type 2 immune response (GO:0002830) 4/14 6.940965e-03 IL4;DENND1B;TNFSF4;NOD2
72 negative regulation of cytokine production (GO:0001818) 13/182 6.940965e-03 PTGER4;UBA7;PPP1R11;IL23R;GBA;AGER;ADCY7;RPS6KA4;CYLD;PTPRC;SYT11;TNFSF4;IL12B
73 glycolipid transport (GO:0046836) 3/6 6.940965e-03 CLN3;RFT1;PLTP
74 protection from natural killer cell mediated cytotoxicity (GO:0042270) 3/6 6.940965e-03 HLA-B;HLA-A;HLA-G
75 regulation of cytokine-mediated signaling pathway (GO:0001959) 8/74 7.287340e-03 CYLD;SOCS1;PTPRC;IFNGR2;CDC37;JAK2;HIPK1;PTPN2
76 interleukin-1-mediated signaling pathway (GO:0070498) 9/94 7.342482e-03 RPS6KA4;PSMA6;RIPK2;PSMD3;CUL1;MAP3K8;NOD2;PSMB8;PSMB9
77 regulation of regulatory T cell differentiation (GO:0045589) 5/26 7.342482e-03 SOCS1;IL2RA;IRF1;TNFSF4;HLA-G
78 positive regulation of T cell mediated cytotoxicity (GO:0001916) 5/26 7.342482e-03 IL23R;HLA-B;IL12B;HLA-A;HLA-G
79 positive regulation of interleukin-6 production (GO:0032755) 8/76 8.264503e-03 TNFSF4;CARD9;STAT3;ARHGEF2;NOD2;IL6R;AGER;AIF1
80 interleukin-27-mediated signaling pathway (GO:0070106) 4/15 8.264503e-03 STAT3;IL27;TYK2;JAK2
81 positive regulation of tumor necrosis factor production (GO:0032760) 8/77 8.829343e-03 PTPRC;STAT3;IL12B;ARHGEF2;NOD2;JAK2;AGER;RASGRP1
82 negative regulation of multicellular organismal process (GO:0051241) 14/214 8.829343e-03 PTGER4;PPP1R11;SFMBT1;PLCL1;IL13;LNPEP;AGER;RPS6KA4;EFNA1;IL4;APOM;SYT11;IP6K1;IL18R1
83 antigen processing and presentation of exogenous peptide antigen via MHC class II (GO:0019886) 9/98 9.360003e-03 HLA-DMA;HLA-DMB;HLA-DOA;KLC1;HLA-DOB;SEC24C;HLA-DQA1;HLA-DQB2;HLA-DQB1
84 nucleotide-binding oligomerization domain containing signaling pathway (GO:0070423) 5/28 9.611315e-03 CYLD;LACC1;RIPK2;NOD2;IRGM
85 natural killer cell activation (GO:0030101) 6/43 9.611315e-03 BAG6;NCR3;PTPRC;IL12B;RASGRP1;CD244
86 positive regulation of T cell differentiation (GO:0045582) 6/43 9.611315e-03 IL4;SOCS1;IL23R;TNFSF4;IL12B;HLA-G
87 cellular response to corticosteroid stimulus (GO:0071384) 4/16 9.611315e-03 BCL2L11;ZFP36L2;UBE2L3;ZFP36L1
88 regulation of granulocyte macrophage colony-stimulating factor production (GO:0032645) 4/16 9.611315e-03 IL23R;CARD9;IL12B;RASGRP1
89 negative regulation of natural killer cell mediated cytotoxicity (GO:0045953) 4/16 9.611315e-03 HLA-B;HLA-A;HLA-G;MICA
90 polyol biosynthetic process (GO:0046173) 4/16 9.611315e-03 ITPKC;IPMK;IP6K1;IP6K2
91 regulation of T cell tolerance induction (GO:0002664) 3/7 9.611315e-03 IL2RA;HLA-B;HLA-G
92 positive regulation of activation of Janus kinase activity (GO:0010536) 3/7 9.611315e-03 IL23R;IL12B;IL6R
93 antigen processing and presentation of peptide antigen via MHC class II (GO:0002495) 9/100 9.717740e-03 HLA-DMA;HLA-DMB;HLA-DOA;KLC1;HLA-DOB;SEC24C;HLA-DQA1;HLA-DQB2;HLA-DQB1
94 cellular response to organic substance (GO:0071310) 10/123 1.044940e-02 STAT5B;SMAD3;RPS6KB1;LRRK2;ERBB2;STAT3;PARK7;RHOA;IL18R1;PTPN2
95 innate immune response (GO:0045087) 17/302 1.052110e-02 CD40;CIITA;PPP1R14B;RIPK2;IL23R;CARD9;NOD2;AGER;IRGM;IL4;CYLD;ADAM15;SMPD1;REL;RNF39;TRIM31;TRIM10
96 positive regulation of tumor necrosis factor superfamily cytokine production (GO:1903557) 8/81 1.063723e-02 PTPRC;STAT3;IL12B;ARHGEF2;NOD2;JAK2;AGER;RASGRP1
97 stress-activated MAPK cascade (GO:0051403) 7/62 1.068762e-02 PTGER4;RIPK2;CUL1;MAP3K8;NOD2;TRIB1;ZFP36L1
98 positive regulation of intracellular signal transduction (GO:1902533) 25/546 1.204048e-02 CD40;PARK7;NOD2;MST1R;LITAF;AGER;BCL2L11;ERBB2;IL12B;TNFSF11;ITGAV;RPL37;JAK2;BRD4;BOK;NDFIP1;RIPK2;CARD9;LIF;RHOA;PPP5C;PTPRC;REL;NUPR1;LTBR
99 regulation of activation of Janus kinase activity (GO:0010533) 3/8 1.352819e-02 IL23R;IL12B;IL6R
100 regulation of apoptotic cell clearance (GO:2000425) 3/8 1.352819e-02 C4B;C4A;C2
101 positive regulation of apoptotic cell clearance (GO:2000427) 3/8 1.352819e-02 C4B;C4A;C2
102 positive regulation of MHC class II biosynthetic process (GO:0045348) 3/8 1.352819e-02 IL4;CIITA;JAK2
103 cellular response to glucocorticoid stimulus (GO:0071385) 4/18 1.352819e-02 BCL2L11;ZFP36L2;UBE2L3;ZFP36L1
104 positive regulation of response to endoplasmic reticulum stress (GO:1905898) 4/18 1.352819e-02 BAG6;BCL2L11;RNFT1;BOK
105 positive regulation of immune effector process (GO:0002699) 5/32 1.498929e-02 HLA-DMB;PTPRC;IL23R;TNFSF4;IL12B
106 cellular response to interleukin-7 (GO:0098761) 4/19 1.636899e-02 STAT5A;STAT5B;SOCS1;STAT3
107 interleukin-7-mediated signaling pathway (GO:0038111) 4/19 1.636899e-02 STAT5A;STAT5B;SOCS1;STAT3
108 response to tumor necrosis factor (GO:0034612) 9/110 1.656284e-02 CCL13;CD40;CCL11;SMPD1;GBA;ARHGEF2;JAK2;ZFP36L2;ZFP36L1
109 regulation of interleukin-17 production (GO:0032660) 5/33 1.656284e-02 IL23R;TNFSF4;CARD9;IL12B;NOD2
110 positive regulation of cytokine production involved in immune response (GO:0002720) 5/33 1.656284e-02 LACC1;TNFSF4;NOD2;HLA-A;HLA-G
111 cellular response to interleukin-9 (GO:0071355) 3/9 1.785946e-02 STAT5A;STAT5B;STAT3
112 cellular response to muramyl dipeptide (GO:0071225) 3/9 1.785946e-02 RIPK2;ARHGEF2;NOD2
113 regulation of T-helper 1 type immune response (GO:0002825) 3/9 1.785946e-02 IL23R;IL12B;IL27
114 interleukin-9-mediated signaling pathway (GO:0038113) 3/9 1.785946e-02 STAT5A;STAT5B;STAT3
115 positive regulation of memory T cell differentiation (GO:0043382) 3/9 1.785946e-02 IL23R;TNFSF4;IL12B
116 regulation of programmed necrotic cell death (GO:0062098) 4/20 1.808192e-02 CYLD;CDC37;FLOT1;NUPR1
117 growth hormone receptor signaling pathway (GO:0060396) 4/20 1.808192e-02 STAT5A;STAT5B;STAT3;JAK2
118 positive regulation of activated T cell proliferation (GO:0042104) 4/20 1.808192e-02 IL23R;IL12B;AGER;ICOSLG
119 positive regulation of alpha-beta T cell activation (GO:0046635) 4/20 1.808192e-02 IL23R;TNFSF4;IL12B;HLA-A
120 positive regulation of protein modification process (GO:0031401) 13/214 1.966538e-02 CD40;LRRK2;GBA;ITLN1;AGER;RASGRP1;MMP9;IRGM;EFNA1;SMPD1;CNEP1R1;ERBB2;FLOT1
121 glycolipid metabolic process (GO:0006664) 6/52 1.966538e-02 GALC;PGAP3;SMPD1;GBA;NEU1;FUT2
122 negative regulation of mitotic cell cycle phase transition (GO:1901991) 8/92 1.966538e-02 PSMA6;PSMD3;CUL1;BRD7;ZFP36L2;PSMB8;ZFP36L1;PSMB9
123 extrinsic apoptotic signaling pathway (GO:0097191) 7/72 2.093922e-02 IL4;SMAD3;ITGAV;JAK2;HIPK1;IL6R;BOK
124 regulation of osteoclast differentiation (GO:0045670) 5/36 2.193894e-02 IL4;IL23R;IL12B;TNFSF11;TCTA
125 positive regulation of myeloid leukocyte differentiation (GO:0002763) 5/36 2.193894e-02 IL23R;LIF;IL12B;TNFSF11;ZFP36L1
126 cAMP biosynthetic process (GO:0006171) 3/10 2.237597e-02 ADCY9;ADCY3;ADCY7
127 regulation of epithelial cell apoptotic process (GO:1904035) 3/10 2.237597e-02 NUPR1;BOK;ZFP36L1
128 regulation of memory T cell differentiation (GO:0043380) 3/10 2.237597e-02 IL23R;TNFSF4;IL12B
129 regulation of T-helper 17 type immune response (GO:2000316) 3/10 2.237597e-02 IL23R;CARD9;IL12B
130 NIK/NF-kappaB signaling (GO:0038061) 7/74 2.331546e-02 PSMA6;TNFSF15;PSMD3;CUL1;REL;PSMB8;PSMB9
131 regulation of endoplasmic reticulum stress-induced intrinsic apoptotic signaling pathway (GO:1902235) 4/22 2.377424e-02 BCL2L11;LRRK2;PARK7;BOK
132 microglial cell activation (GO:0001774) 4/22 2.377424e-02 IL4;JAK2;AGER;AIF1
133 positive regulation of production of molecular mediator of immune response (GO:0002702) 5/38 2.648725e-02 LACC1;PTPRC;TNFSF4;NOD2;CD244
134 phosphorylation (GO:0016310) 19/400 2.674439e-02 PRRT1;CERKL;DGKE;PRKAA1;CCL11;DGKD;LRRK2;STAT3;STK19;TYK2;HIPK1;RUNX3;CLK2;RPS6KA4;ERBB2;COQ8B;JAK2;TRIB1;MARK3
135 positive regulation of I-kappaB kinase/NF-kappaB signaling (GO:0043123) 11/171 2.674439e-02 PPP5C;CD40;NDFIP1;RIPK2;CARD9;REL;NOD2;LTBR;LITAF;RHOA;BRD4
136 regulation of necroptotic process (GO:0060544) 4/23 2.674439e-02 CYLD;CDC37;FLOT1;ARHGEF2
137 ERK1 and ERK2 cascade (GO:0070371) 4/23 2.674439e-02 PTGER4;ITGAV;ZFP36L2;ZFP36L1
138 positive regulation of histone acetylation (GO:0035066) 4/23 2.674439e-02 RPS6KA4;MUC1;LIF;BRD7
139 positive regulation of interleukin-17 production (GO:0032740) 4/23 2.674439e-02 IL23R;CARD9;IL12B;NOD2
140 positive regulation of phosphorylation (GO:0042327) 14/253 2.674439e-02 DDR1;CD40;PRKAA1;LRRK2;ITLN1;MST1R;AGER;RASGRP1;MMP9;IRGM;EFNA1;RAD50;ERBB2;FLOT1
141 cellular response to peptide (GO:1901653) 6/57 2.674439e-02 ITGA4;RIPK2;ARHGEF2;NOD2;AGER;ZFP36L1
142 regulation of ERAD pathway (GO:1904292) 3/11 2.674439e-02 BAG6;USP19;RNFT1
143 cellular response to interleukin-2 (GO:0071352) 3/11 2.674439e-02 STAT5A;STAT5B;IL2RA
144 interleukin-2-mediated signaling pathway (GO:0038110) 3/11 2.674439e-02 STAT5A;STAT5B;IL2RA
145 interleukin-35-mediated signaling pathway (GO:0070757) 3/11 2.674439e-02 STAT3;JAK2;IL12RB2
146 positive regulation of cellular respiration (GO:1901857) 3/11 2.674439e-02 IL4;NUPR1;PARK7
147 organophosphate biosynthetic process (GO:0090407) 5/39 2.700126e-02 ITPKC;IPMK;IP6K1;FADS1;IP6K2
148 positive regulation of transcription by RNA polymerase II (GO:0045944) 34/908 3.002514e-02 CIITA;CD40;ELL;ATF6B;NOTCH4;PARK7;NOD2;LITAF;RPS6KA4;SBNO2;MUC1;NFATC2IP;TNFSF11;ZNF300;BRD4;STAT5B;EGR2;SMAD3;RIPK2;ZBTB38;STAT3;LIF;FOS;POU5F1;FOSL2;IL4;POMC;MED24;ZGLP1;IRF1;REL;ARHGEF2;IRF6;ZNF335
149 cellular response to oxidative stress (GO:0034599) 9/125 3.023089e-02 PRDX5;PRKAA1;GPX1;LRRK2;NCF4;PARK7;FOS;MMP9;AIF1
150 apoptotic process (GO:0006915) 13/231 3.144491e-02 GSDMA;MAGI3;ATP2A1;TRAIP;BAG6;BCL2L11;ADAM15;IRF1;IL2RA;LTA;JAK2;IER3;BOK
151 response to interferon-gamma (GO:0034341) 7/80 3.168432e-02 CCL13;CD40;CIITA;CCL11;IL23R;AIF1;SLC26A6
152 regulation of CD4-positive, alpha-beta T cell differentiation (GO:0043370) 3/12 3.282107e-02 SOCS1;TNFSF4;RUNX3
153 regulation of dendritic cell differentiation (GO:2001198) 3/12 3.282107e-02 HLA-B;AGER;HLA-G
154 regulation of MHC class II biosynthetic process (GO:0045346) 3/12 3.282107e-02 IL4;CIITA;JAK2
155 positive regulation of T-helper 1 type immune response (GO:0002827) 3/12 3.282107e-02 IL23R;IL12B;IL18R1
156 positive regulation of T-helper 17 type immune response (GO:2000318) 3/12 3.282107e-02 IL23R;CARD9;IL12B
157 receptor signaling pathway via STAT (GO:0097696) 4/25 3.282107e-02 STAT5A;STAT5B;STAT3;JAK2
158 phosphatidylinositol phosphate biosynthetic process (GO:0046854) 5/42 3.517819e-02 ITPKC;SOCS1;IP6K1;EFR3B;IP6K2
159 cellular response to interleukin-15 (GO:0071350) 3/13 4.043883e-02 STAT5A;STAT5B;STAT3
160 response to muramyl dipeptide (GO:0032495) 3/13 4.043883e-02 RIPK2;NOD2;ARHGEF2
161 interleukin-15-mediated signaling pathway (GO:0035723) 3/13 4.043883e-02 STAT5A;STAT5B;STAT3
162 positive regulation of adaptive immune response based on somatic recombination of immune receptors built from immunoglobulin superfamily domains (GO:0002824) 3/13 4.043883e-02 IL23R;CARD9;IL12B
163 regulation of endothelial cell apoptotic process (GO:2000351) 5/44 4.200590e-02 IL4;CD40;ITGA4;IL13;HLA-G
164 response to glucocorticoid (GO:0051384) 4/27 4.211346e-02 BCL2L11;ZFP36L2;UBE2L3;ZFP36L1
165 regulation of transcription from RNA polymerase II promoter in response to stress (GO:0043618) 7/87 4.682571e-02 PSMA6;MUC1;EGLN2;PSMD3;CUL2;PSMB8;PSMB9
166 positive regulation of MAPK cascade (GO:0043410) 14/274 4.703097e-02 CCL13;CD40;CCL11;EDN3;LRRK2;CARD9;LIF;MST1R;NOD2;AGER;RASGRP1;PTPRC;ERBB2;TNFSF11
167 cellular response to epidermal growth factor stimulus (GO:0071364) 4/28 4.714372e-02 STAT5B;ERBB2;ZFP36L2;ZFP36L1
168 cellular response to interleukin-6 (GO:0071354) 4/28 4.714372e-02 SBNO2;STAT3;JAK2;IL6R
169 cAMP metabolic process (GO:0046058) 3/14 4.741738e-02 ADCY9;ADCY3;ADCY7
170 detection of bacterium (GO:0016045) 3/14 4.741738e-02 HLA-B;HLA-A;NOD2
171 T-helper cell differentiation (GO:0042093) 3/14 4.741738e-02 PTGER4;IL4;IL12B
172 negative regulation of neuroinflammatory response (GO:0150079) 3/14 4.741738e-02 IL4;PTPRC;SYT11
173 positive regulation of alpha-beta T cell differentiation (GO:0046638) 3/14 4.741738e-02 SOCS1;TNFSF4;RUNX3
174 protein phosphorylation (GO:0006468) 21/496 4.830327e-02 PRRT1;DDR1;PRKAA1;CCL11;LRRK2;STK19;TYK2;HIPK1;RUNX3;CLK2;RPS6KA4;SBK1;CAMKV;RPS6KB1;RPS6KA2;CSNK2B;ERBB2;COQ8B;JAK2;TRIB1;MARK3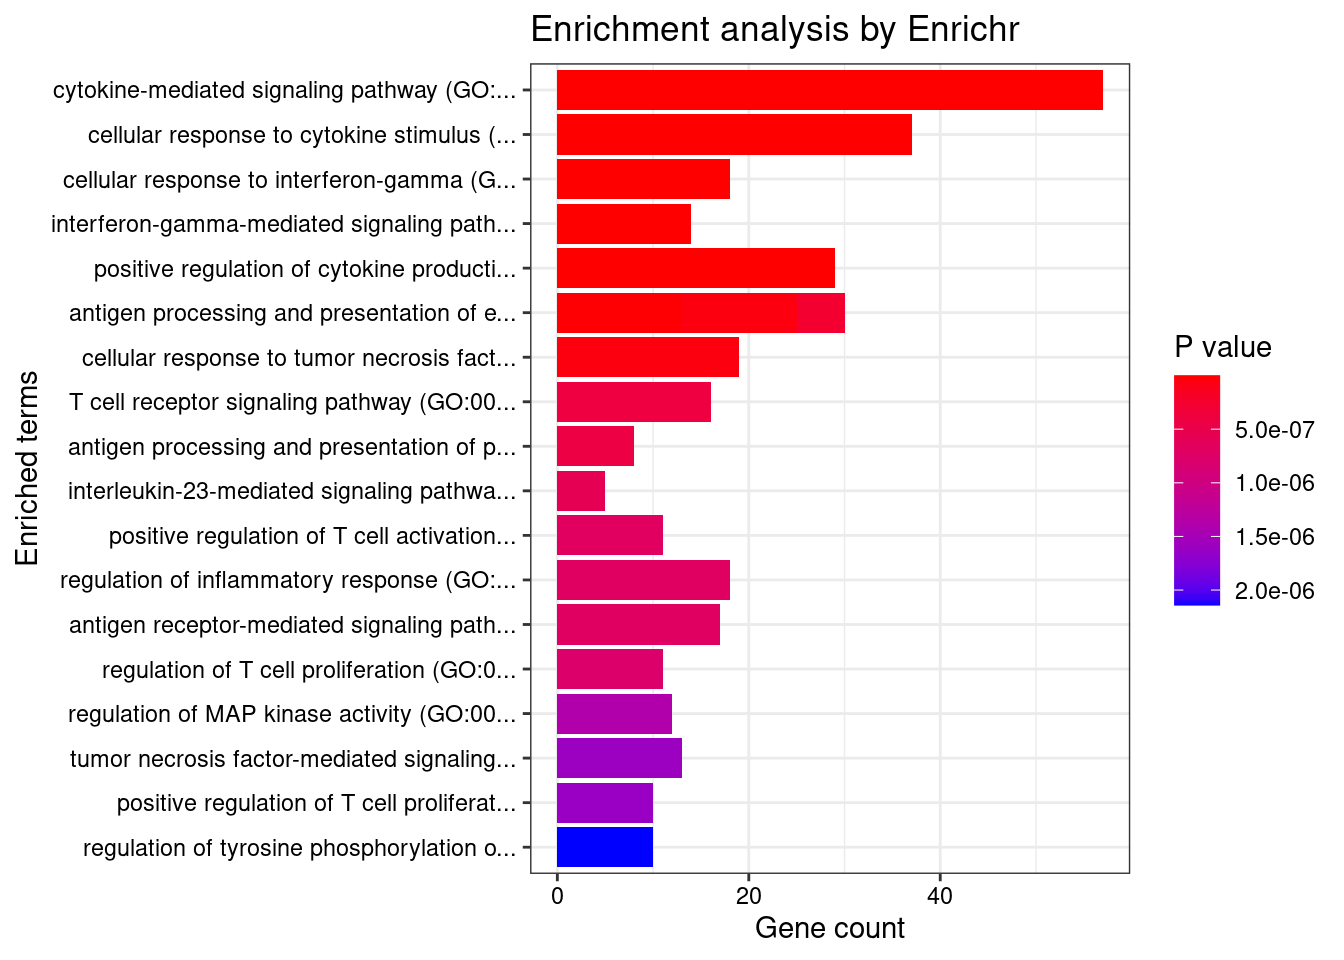
| Version | Author | Date |
|---|---|---|
| 0136d2e | wesleycrouse | 2022-06-10 |
GO_Cellular_Component_2021
Term Overlap Adjusted.P.value Genes
1 MHC protein complex (GO:0042611) 10/20 7.691299e-10 HLA-DMA;HLA-DMB;HLA-B;HLA-C;HLA-A;HLA-DOA;HLA-DOB;HLA-DQA1;HLA-DQB2;HLA-DQB1
2 MHC class II protein complex (GO:0042613) 7/13 3.898076e-07 HLA-DMA;HLA-DMB;HLA-DOA;HLA-DOB;HLA-DQA1;HLA-DQB2;HLA-DQB1
3 integral component of lumenal side of endoplasmic reticulum membrane (GO:0071556) 7/28 1.011797e-04 HLA-B;HLA-C;HLA-A;HLA-G;HLA-DQA1;HLA-DQB2;HLA-DQB1
4 lumenal side of endoplasmic reticulum membrane (GO:0098553) 7/28 1.011797e-04 HLA-B;HLA-C;HLA-A;HLA-G;HLA-DQA1;HLA-DQB2;HLA-DQB1
5 ER to Golgi transport vesicle membrane (GO:0012507) 9/54 1.023840e-04 SEC16A;HLA-B;HLA-C;HLA-A;HLA-G;SEC24C;HLA-DQB2;HLA-DQA1;HLA-DQB1
6 coated vesicle membrane (GO:0030662) 9/55 1.023840e-04 SEC16A;HLA-B;HLA-C;HLA-A;HLA-G;SEC24C;HLA-DQB2;HLA-DQA1;HLA-DQB1
7 transport vesicle membrane (GO:0030658) 9/60 1.852275e-04 SEC16A;HLA-B;HLA-C;HLA-A;HLA-G;SEC24C;HLA-DQB2;HLA-DQA1;HLA-DQB1
8 COPII-coated ER to Golgi transport vesicle (GO:0030134) 9/79 1.563833e-03 SEC16A;HLA-B;HLA-C;HLA-A;HLA-G;SEC24C;HLA-DQB2;HLA-DQA1;HLA-DQB1
9 phagocytic vesicle (GO:0045335) 10/100 1.679899e-03 SYT11;NCF4;HLA-B;TAP2;HLA-C;TAP1;ITGAV;HLA-A;NOD2;HLA-G
10 lysosome (GO:0005764) 24/477 3.312576e-03 STARD3;USP4;LRRK2;RNASET2;GBA;LNPEP;CTSW;LITAF;GALC;CLN3;HLA-DMA;HLA-DMB;NAGLU;SYT11;SMPD1;NEU1;SPNS1;FLOT1;PPT2;HLA-DOA;HLA-DOB;HLA-DQA1;HLA-DQB2;HLA-DQB1
11 MHC class I protein complex (GO:0042612) 3/6 3.990457e-03 HLA-B;HLA-C;HLA-A
12 endosome lumen (GO:0031904) 5/26 4.078684e-03 IL12B;LNPEP;JAK2;PDLIM4;AP4B1
13 integral component of endoplasmic reticulum membrane (GO:0030176) 11/142 5.084433e-03 CLN3;ATF6B;HLA-B;TAP2;HLA-C;TAP1;HLA-A;HLA-G;HLA-DQA1;HLA-DQB2;HLA-DQB1
14 phagocytic vesicle membrane (GO:0030670) 6/45 6.649872e-03 HLA-B;TAP2;HLA-C;TAP1;HLA-A;HLA-G
15 lytic vacuole (GO:0000323) 13/219 1.666020e-02 USP4;LRRK2;RNASET2;GBA;CTSW;GALC;CLN3;NAGLU;SYT11;SMPD1;NEU1;PPT2;HLA-DOB
16 early endosome membrane (GO:0031901) 8/97 1.810170e-02 CLN3;HLA-B;HLA-C;HLA-A;HLA-G;LITAF;SNX20;BOK
17 recycling endosome membrane (GO:0055038) 6/58 2.143337e-02 HLA-B;HLA-C;HLA-A;HLA-G;SCAMP3;BOK
18 lytic vacuole membrane (GO:0098852) 14/267 2.932636e-02 STARD3;GBA;LNPEP;LITAF;CLN3;HLA-DMA;HLA-DMB;SPNS1;FLOT1;HLA-DOA;HLA-DOB;HLA-DQA1;HLA-DQB2;HLA-DQB1
19 endocytic vesicle membrane (GO:0030666) 10/158 2.999339e-02 HLA-B;TAP2;HLA-C;TAP1;HLA-A;HLA-G;CAMK2G;HLA-DQA1;HLA-DQB2;HLA-DQB1
20 early endosome lumen (GO:0031905) 2/5 4.539411e-02 LNPEP;PDLIM4
21 spermatoproteasome complex (GO:1990111) 2/5 4.539411e-02 PSMB8;PSMB9
22 recycling endosome (GO:0055037) 9/145 4.539411e-02 CLN3;SYT11;HLA-B;HLA-C;HLA-A;HLA-G;PDLIM4;SCAMP3;BOK
23 secondary lysosome (GO:0005767) 3/16 4.539411e-02 CLN3;LRRK2;NCF4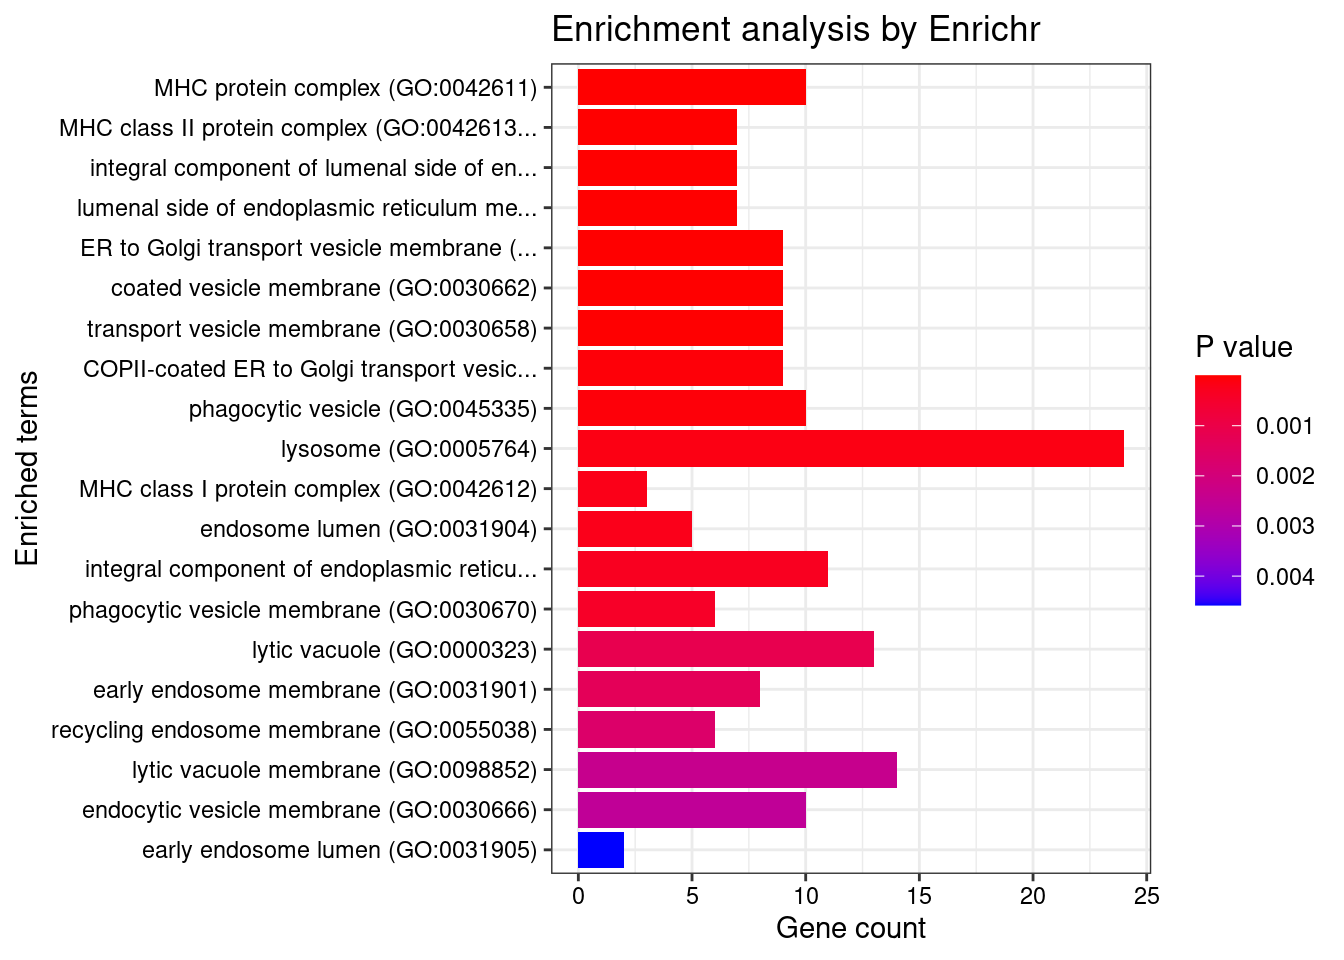
| Version | Author | Date |
|---|---|---|
| 0136d2e | wesleycrouse | 2022-06-10 |
GO_Molecular_Function_2021
Term Overlap Adjusted.P.value Genes
1 MHC class II receptor activity (GO:0032395) 5/10 0.0004725844 HLA-DOA;HLA-DOB;HLA-DQA1;HLA-DQB2;HLA-DQB1
2 cytokine receptor binding (GO:0005126) 11/105 0.0031302601 IL4;SMAD3;IL23R;TNFSF4;LIF;IL12B;TNFSF11;IL27;TYK2;JAK2;IL6R
3 cytokine receptor activity (GO:0004896) 10/88 0.0031302601 IL1RL1;IL18RAP;IL23R;IFNGR2;IL2RA;IL12B;CCR6;IL6R;IL18R1;IL12RB2
4 kinase activity (GO:0016301) 11/112 0.0036847511 CERKL;ITPKC;DGKE;DGKD;LRRK2;IPMK;COQ8B;CKB;IP6K1;COASY;IP6K2
5 interleukin-12 receptor binding (GO:0005143) 3/6 0.0165649114 IL23R;IL12B;JAK2
6 CARD domain binding (GO:0050700) 4/16 0.0199493561 RIPK2;CARD9;NOD2;IRGM
7 ribosomal protein S6 kinase activity (GO:0004711) 3/7 0.0199493561 RPS6KA4;RPS6KB1;RPS6KA2
8 MHC class I protein binding (GO:0042288) 4/17 0.0199493561 TUBB;TAP2;TAP1;CD244
9 MHC class II protein complex binding (GO:0023026) 4/17 0.0199493561 HLA-DMA;HLA-DMB;HLA-DOA;HLA-DOB
10 inositol hexakisphosphate kinase activity (GO:0000828) 3/8 0.0224432894 ITPKC;IP6K1;IP6K2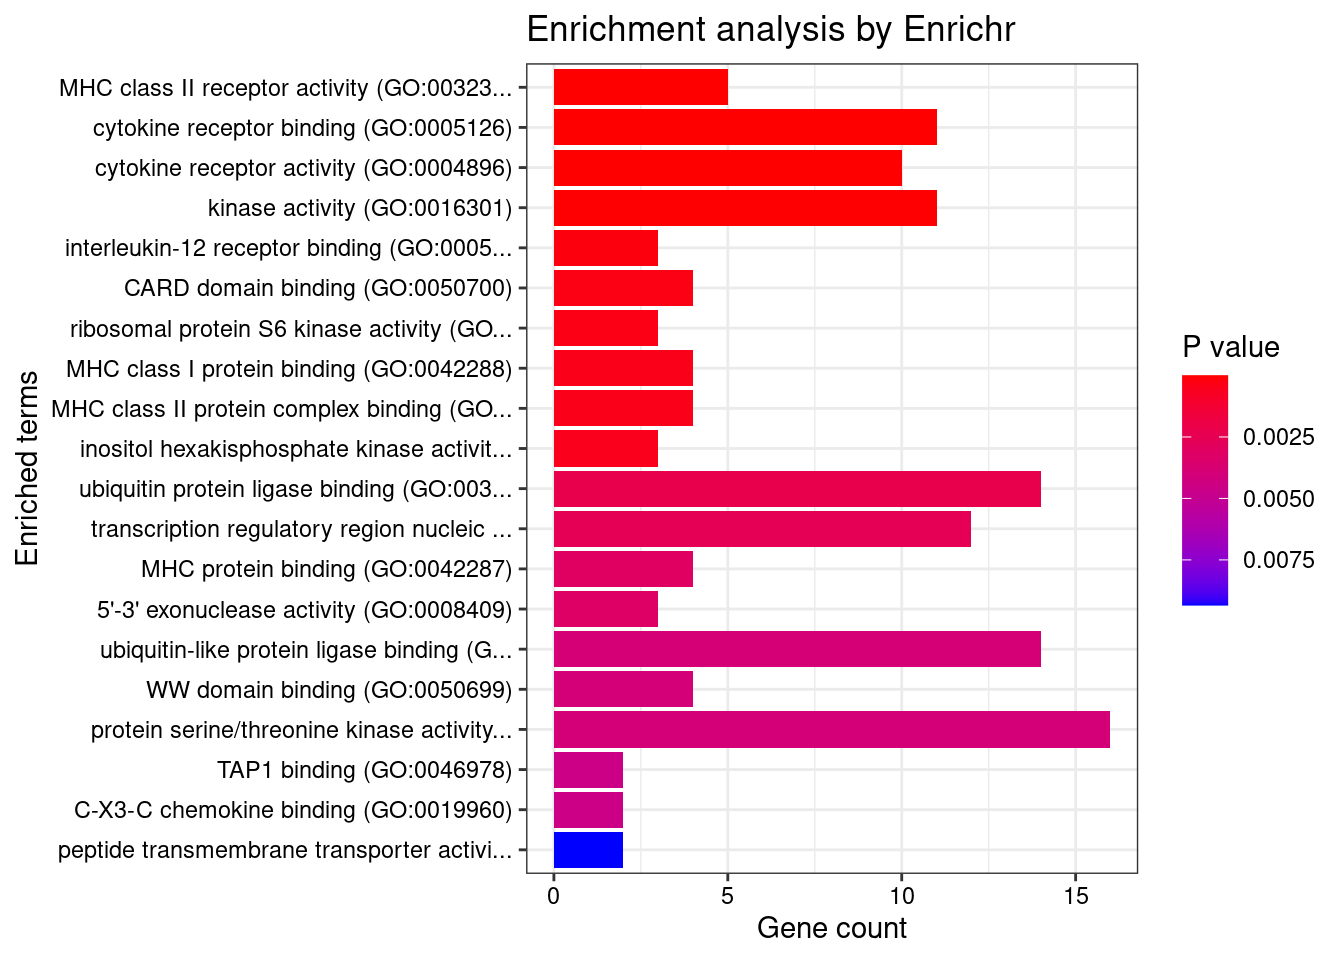
| Version | Author | Date |
|---|---|---|
| 0136d2e | wesleycrouse | 2022-06-10 |
Enrichment analysis for cTWAS genes in top tissues separately
GO
output <- output[order(-output$pve_g),]
top_tissues <- output$weight[1:5]
for (tissue in top_tissues){
cat(paste0(tissue, "\n\n"))
ctwas_genes_tissue <- df[[tissue]]$ctwas
cat(paste0("Number of cTWAS Genes in Tissue: ", length(ctwas_genes_tissue), "\n\n"))
dbs <- c("GO_Biological_Process_2021")
GO_enrichment <- enrichr(ctwas_genes_tissue, dbs)
for (db in dbs){
cat(paste0("\n", db, "\n\n"))
enrich_results <- GO_enrichment[[db]]
enrich_results <- enrich_results[enrich_results$Adjusted.P.value<0.05,c("Term", "Overlap", "Adjusted.P.value", "Genes")]
print(enrich_results)
print(plotEnrich(GO_enrichment[[db]]))
}
}Whole_Blood
Number of cTWAS Genes in Tissue: 19
Uploading data to Enrichr... Done.
Querying GO_Biological_Process_2021... Done.
Parsing results... Done.
GO_Biological_Process_2021
Term Overlap Adjusted.P.value Genes
1 positive regulation of CD4-positive, alpha-beta T cell differentiation (GO:0043372) 2/8 0.006104974 SOCS1;TNFSF4
2 regulation of CD4-positive, alpha-beta T cell differentiation (GO:0043370) 2/12 0.006104974 SOCS1;TNFSF4
3 positive regulation of CD4-positive, alpha-beta T cell activation (GO:2000516) 2/13 0.006104974 SOCS1;TNFSF4
4 positive regulation of alpha-beta T cell differentiation (GO:0046638) 2/14 0.006104974 SOCS1;TNFSF4
5 regulation of regulatory T cell differentiation (GO:0045589) 2/26 0.014376616 SOCS1;TNFSF4
6 negative regulation of insulin receptor signaling pathway (GO:0046627) 2/27 0.014376616 SOCS1;RPS6KB1
7 negative regulation of cellular response to insulin stimulus (GO:1900077) 2/28 0.014376616 SOCS1;RPS6KB1
8 regulation of interleukin-17 production (GO:0032660) 2/33 0.017521775 TNFSF4;CARD9
9 positive regulation of T cell differentiation (GO:0045582) 2/43 0.026104810 SOCS1;TNFSF4
10 regulation of insulin receptor signaling pathway (GO:0046626) 2/45 0.026104810 SOCS1;RPS6KB1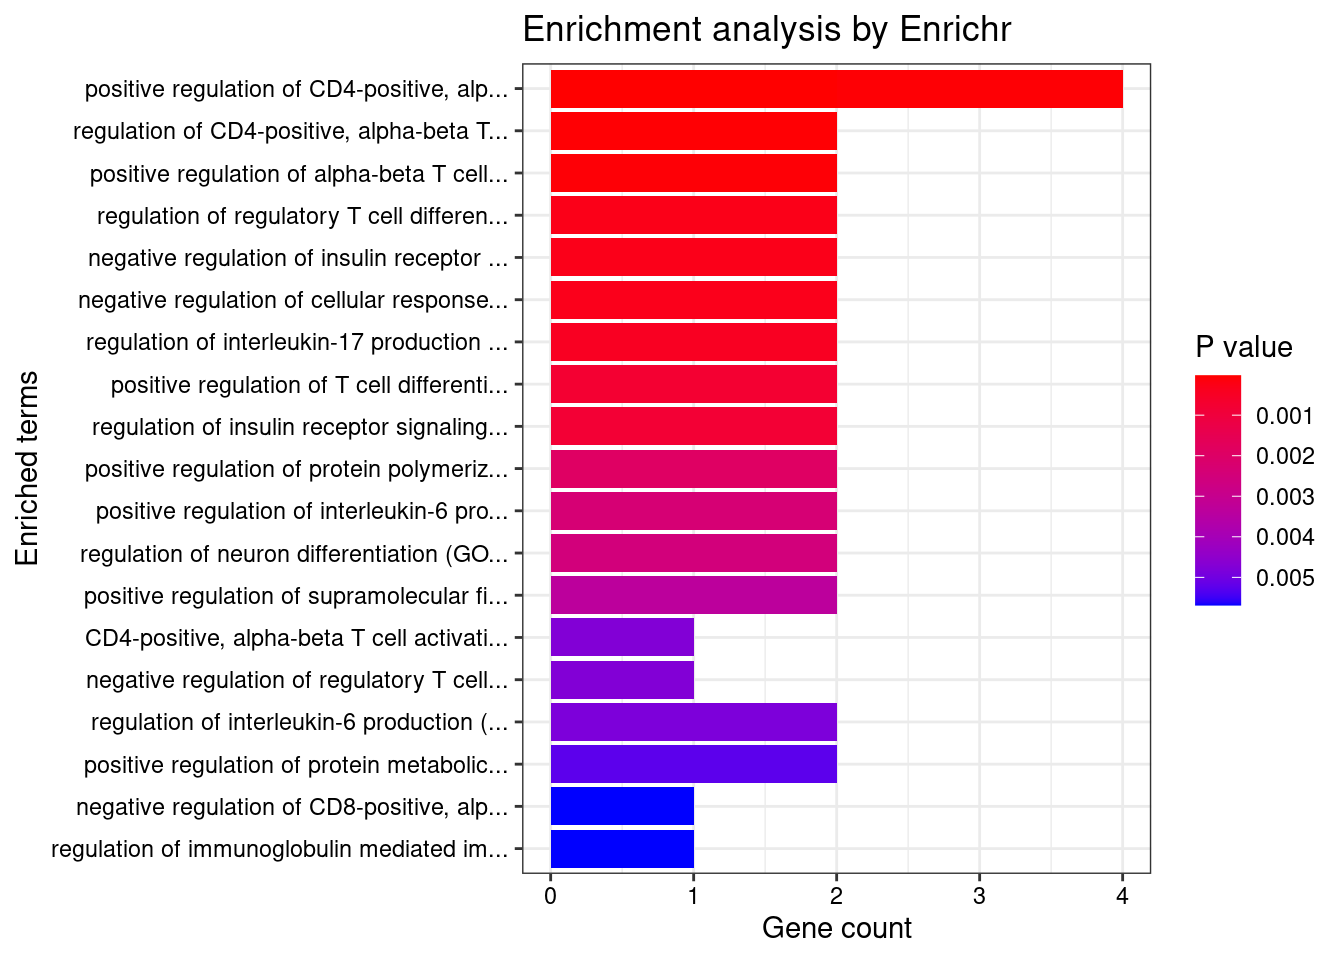
| Version | Author | Date |
|---|---|---|
| 0136d2e | wesleycrouse | 2022-06-10 |
Skin_Not_Sun_Exposed_Suprapubic
Number of cTWAS Genes in Tissue: 9
Uploading data to Enrichr... Done.
Querying GO_Biological_Process_2021... Done.
Parsing results... Done.
GO_Biological_Process_2021
[1] Term Overlap Adjusted.P.value Genes
<0 rows> (or 0-length row.names)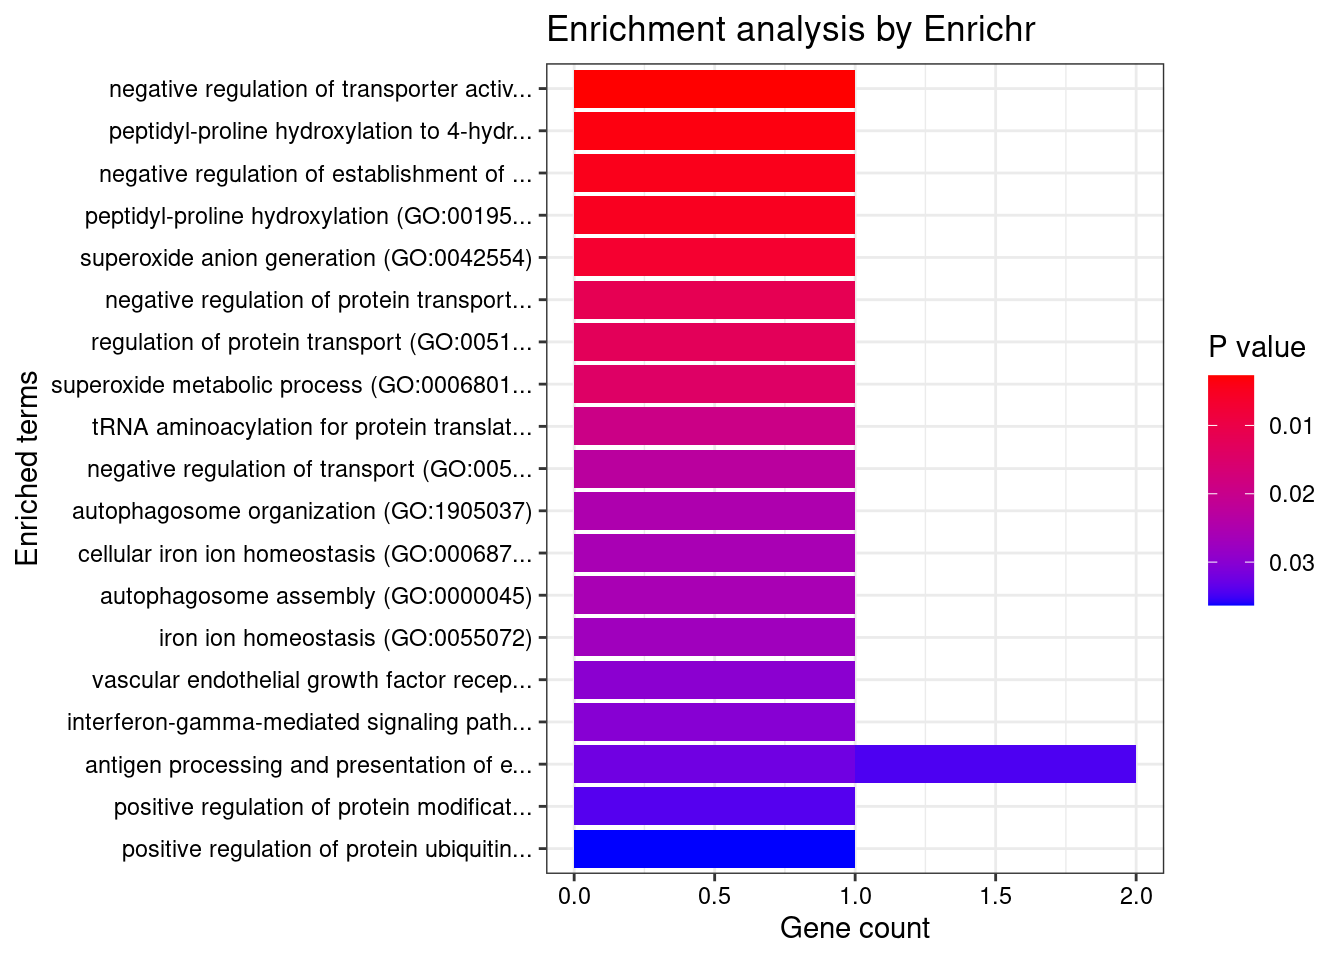
| Version | Author | Date |
|---|---|---|
| 0136d2e | wesleycrouse | 2022-06-10 |
Adipose_Subcutaneous
Number of cTWAS Genes in Tissue: 7
Uploading data to Enrichr... Done.
Querying GO_Biological_Process_2021... Done.
Parsing results... Done.
GO_Biological_Process_2021
Term Overlap Adjusted.P.value Genes
1 positive regulation of protein metabolic process (GO:0051247) 2/115 0.02893479 CARD9;OAZ3
2 B cell chemotaxis (GO:0035754) 1/6 0.02893479 CH25H
3 myeloid leukocyte mediated immunity (GO:0002444) 1/8 0.02893479 CARD9
4 regulation of T-helper 17 type immune response (GO:2000316) 1/10 0.02893479 CARD9
5 immunoglobulin mediated immune response (GO:0016064) 1/10 0.02893479 CARD9
6 negative regulation of transmembrane transport (GO:0034763) 1/10 0.02893479 OAZ3
7 B cell mediated immunity (GO:0019724) 1/11 0.02893479 CARD9
8 positive regulation of T-helper 17 type immune response (GO:2000318) 1/12 0.02893479 CARD9
9 positive regulation of adaptive immune response based on somatic recombination of immune receptors built from immunoglobulin superfamily domains (GO:0002824) 1/13 0.02893479 CARD9
10 homeostasis of number of cells (GO:0048872) 1/13 0.02893479 CARD9
11 antifungal innate immune response (GO:0061760) 1/13 0.02893479 CARD9
12 positive regulation of granulocyte macrophage colony-stimulating factor production (GO:0032725) 1/14 0.02893479 CARD9
13 regulation of granulocyte macrophage colony-stimulating factor production (GO:0032645) 1/16 0.02974369 CARD9
14 positive regulation of cytokine production involved in inflammatory response (GO:1900017) 1/17 0.02974369 CARD9
15 positive regulation of stress-activated protein kinase signaling cascade (GO:0070304) 1/18 0.02974369 CARD9
16 positive regulation of interleukin-17 production (GO:0032740) 1/23 0.03496115 CARD9
17 defense response to fungus (GO:0050832) 1/24 0.03496115 CARD9
18 bile acid biosynthetic process (GO:0006699) 1/27 0.03712953 CH25H
19 modulation by host of symbiont process (GO:0051851) 1/32 0.03886266 CARD9
20 bile acid metabolic process (GO:0008206) 1/33 0.03886266 CH25H
21 regulation of interleukin-17 production (GO:0032660) 1/33 0.03886266 CARD9
22 sterol biosynthetic process (GO:0016126) 1/38 0.04268482 CH25H
23 regulation of cytokine production involved in inflammatory response (GO:1900015) 1/43 0.04492404 CARD9
24 lymphocyte chemotaxis (GO:0048247) 1/44 0.04492404 CH25H
25 secondary alcohol metabolic process (GO:1902652) 1/49 0.04492404 CH25H
26 regulation of stress-activated MAPK cascade (GO:0032872) 1/49 0.04492404 CARD9
27 organic hydroxy compound biosynthetic process (GO:1901617) 1/50 0.04492404 CH25H
28 regulation of cellular amine metabolic process (GO:0033238) 1/51 0.04492404 OAZ3
29 regulation of cellular amino acid metabolic process (GO:0006521) 1/54 0.04570893 OAZ3
30 autophagosome organization (GO:1905037) 1/56 0.04570893 ATG16L1
31 autophagosome assembly (GO:0000045) 1/58 0.04570893 ATG16L1
32 positive regulation of cysteine-type endopeptidase activity (GO:2001056) 1/62 0.04570893 CARD9
33 monocarboxylic acid biosynthetic process (GO:0072330) 1/63 0.04570893 CH25H
34 regulation of cellular ketone metabolic process (GO:0010565) 1/64 0.04570893 OAZ3
35 steroid biosynthetic process (GO:0006694) 1/65 0.04570893 CH25H
36 positive regulation of catabolic process (GO:0009896) 1/67 0.04579288 OAZ3
37 sterol metabolic process (GO:0016125) 1/70 0.04652933 CH25H
38 positive regulation of JNK cascade (GO:0046330) 1/73 0.04722528 CARD9
39 positive regulation of interleukin-6 production (GO:0032755) 1/76 0.04729397 CARD9
40 cholesterol metabolic process (GO:0008203) 1/77 0.04729397 CH25H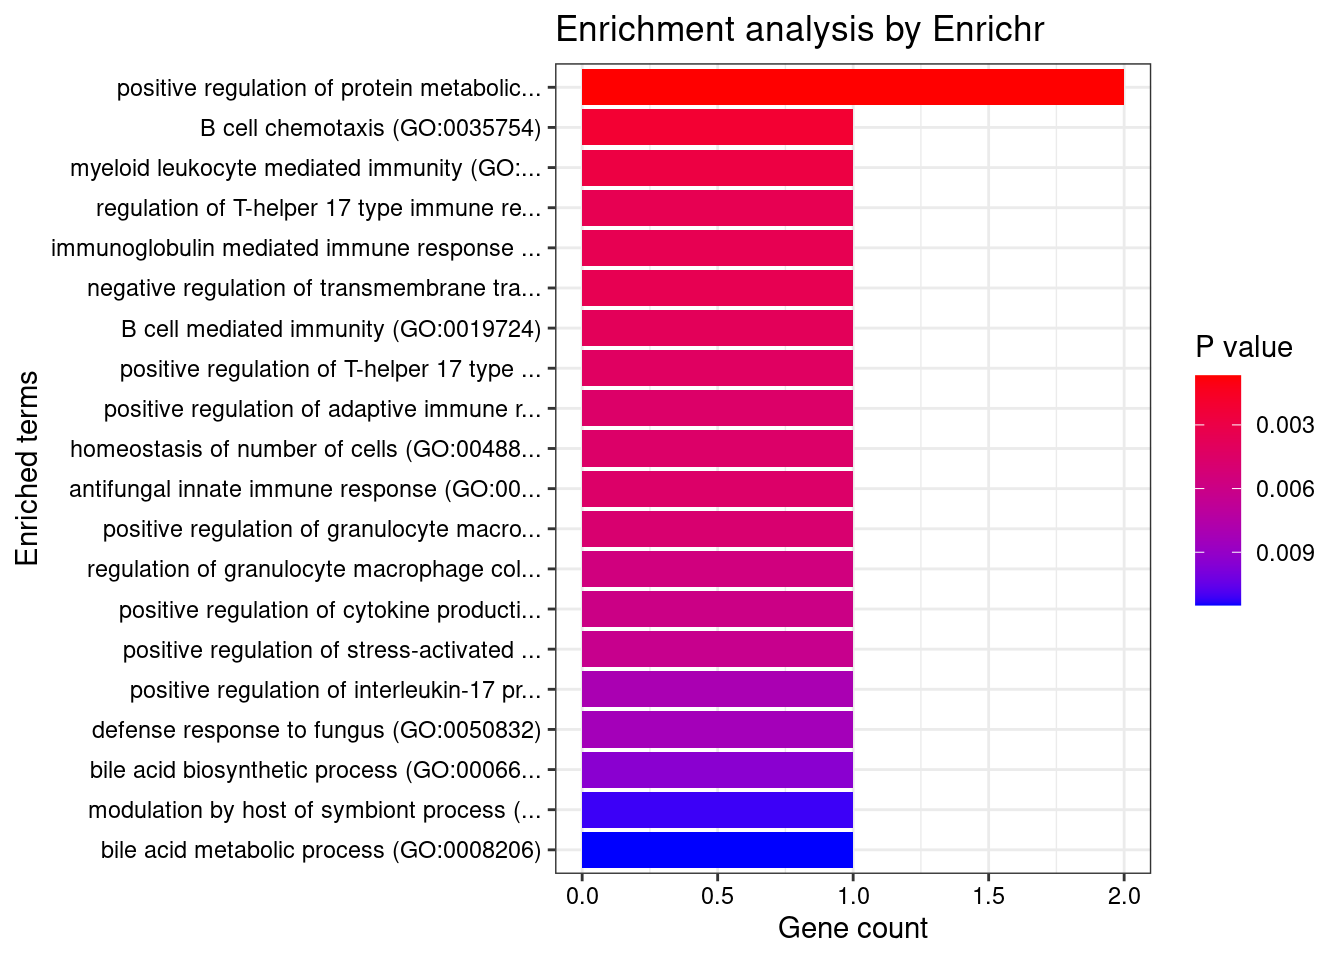
| Version | Author | Date |
|---|---|---|
| 0136d2e | wesleycrouse | 2022-06-10 |
Colon_Transverse
Number of cTWAS Genes in Tissue: 6
Uploading data to Enrichr... Done.
Querying GO_Biological_Process_2021... Done.
Parsing results... Done.
GO_Biological_Process_2021
Term Overlap Adjusted.P.value Genes
1 oocyte development (GO:0048599) 1/5 0.02238280 ZGLP1
2 cleavage furrow formation (GO:0036089) 1/7 0.02238280 SPIRE2
3 parallel actin filament bundle assembly (GO:0030046) 1/7 0.02238280 SPIRE2
4 actin filament network formation (GO:0051639) 1/11 0.02636661 SPIRE2
5 regulation of response to interferon-gamma (GO:0060330) 1/14 0.02683597 IFNGR2
6 actin nucleation (GO:0045010) 1/21 0.03145586 SPIRE2
7 regulation of interferon-gamma-mediated signaling pathway (GO:0060334) 1/23 0.03145586 IFNGR2
8 actin filament polymerization (GO:0030041) 1/29 0.03188387 SPIRE2
9 plasma membrane invagination (GO:0099024) 1/30 0.03188387 SPIRE2
10 positive regulation of double-strand break repair (GO:2000781) 1/40 0.03307673 SPIRE2
11 regulation of double-strand break repair (GO:2000779) 1/42 0.03307673 SPIRE2
12 positive regulation of DNA repair (GO:0045739) 1/48 0.03307673 SPIRE2
13 positive regulation of actin filament polymerization (GO:0030838) 1/49 0.03307673 SPIRE2
14 actin polymerization or depolymerization (GO:0008154) 1/50 0.03307673 SPIRE2
15 autophagosome organization (GO:1905037) 1/56 0.03307673 ATG16L1
16 autophagosome assembly (GO:0000045) 1/58 0.03307673 ATG16L1
17 protein polymerization (GO:0051258) 1/59 0.03307673 SPIRE2
18 interferon-gamma-mediated signaling pathway (GO:0060333) 1/68 0.03519716 IFNGR2
19 cytoskeleton-dependent cytokinesis (GO:0061640) 1/72 0.03519716 SPIRE2
20 regulation of cytokine-mediated signaling pathway (GO:0001959) 1/74 0.03519716 IFNGR2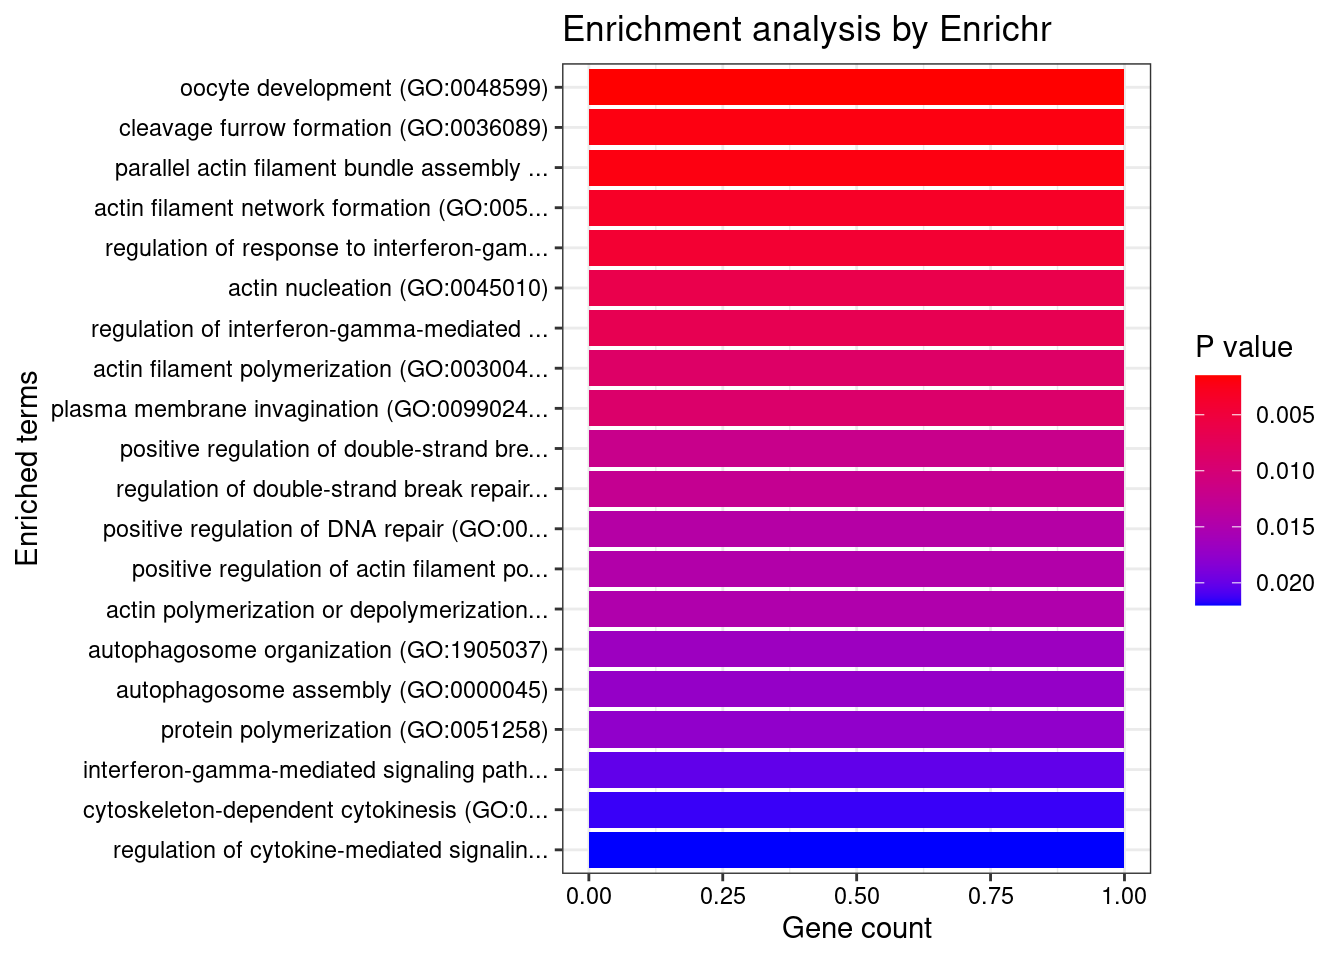
| Version | Author | Date |
|---|---|---|
| 0136d2e | wesleycrouse | 2022-06-10 |
Spleen
Number of cTWAS Genes in Tissue: 5
Uploading data to Enrichr... Done.
Querying GO_Biological_Process_2021... Done.
Parsing results... Done.
GO_Biological_Process_2021
Term Overlap Adjusted.P.value Genes
1 positive regulation of cysteine-type endopeptidase activity involved in apoptotic process (GO:0043280) 2/119 0.01976609 TNFSF15;CARD9
2 oocyte development (GO:0048599) 1/5 0.01976609 ZGLP1
3 myeloid leukocyte mediated immunity (GO:0002444) 1/8 0.01976609 CARD9
4 regulation of T-helper 17 type immune response (GO:2000316) 1/10 0.01976609 CARD9
5 immunoglobulin mediated immune response (GO:0016064) 1/10 0.01976609 CARD9
6 B cell mediated immunity (GO:0019724) 1/11 0.01976609 CARD9
7 positive regulation of T-helper 17 type immune response (GO:2000318) 1/12 0.01976609 CARD9
8 positive regulation of adaptive immune response based on somatic recombination of immune receptors built from immunoglobulin superfamily domains (GO:0002824) 1/13 0.01976609 CARD9
9 homeostasis of number of cells (GO:0048872) 1/13 0.01976609 CARD9
10 antifungal innate immune response (GO:0061760) 1/13 0.01976609 CARD9
11 positive regulation of granulocyte macrophage colony-stimulating factor production (GO:0032725) 1/14 0.01976609 CARD9
12 activation of NF-kappaB-inducing kinase activity (GO:0007250) 1/16 0.01976609 TNFSF15
13 regulation of granulocyte macrophage colony-stimulating factor production (GO:0032645) 1/16 0.01976609 CARD9
14 positive regulation of cytokine production involved in inflammatory response (GO:1900017) 1/17 0.01976609 CARD9
15 positive regulation of stress-activated protein kinase signaling cascade (GO:0070304) 1/18 0.01976609 CARD9
16 neutrophil mediated immunity (GO:0002446) 2/488 0.02194918 RNASET2;CARD9
17 positive regulation of interleukin-17 production (GO:0032740) 1/23 0.02194918 CARD9
18 defense response to fungus (GO:0050832) 1/24 0.02194918 CARD9
19 modulation by host of symbiont process (GO:0051851) 1/32 0.02713771 CARD9
20 regulation of interleukin-17 production (GO:0032660) 1/33 0.02713771 CARD9
21 nucleobase-containing compound catabolic process (GO:0034655) 1/41 0.03208535 RNASET2
22 regulation of cytokine production involved in inflammatory response (GO:1900015) 1/43 0.03211450 CARD9
23 RNA catabolic process (GO:0006401) 1/49 0.03352585 RNASET2
24 regulation of stress-activated MAPK cascade (GO:0032872) 1/49 0.03352585 CARD9
25 cellular macromolecule catabolic process (GO:0044265) 1/53 0.03479824 RNASET2
26 positive regulation of cysteine-type endopeptidase activity (GO:2001056) 1/62 0.03910652 CARD9
27 positive regulation of JNK cascade (GO:0046330) 1/73 0.04291792 CARD9
28 NIK/NF-kappaB signaling (GO:0038061) 1/74 0.04291792 TNFSF15
29 positive regulation of interleukin-6 production (GO:0032755) 1/76 0.04291792 CARD9
30 activation of cysteine-type endopeptidase activity involved in apoptotic process (GO:0006919) 1/81 0.04419465 TNFSF15
31 regulation of cysteine-type endopeptidase activity involved in apoptotic process (GO:0043281) 1/89 0.04599470 CARD9
32 protein complex oligomerization (GO:0051259) 1/90 0.04599470 CARD9
33 positive regulation of stress-activated MAPK cascade (GO:0032874) 1/99 0.04696835 CARD9
34 regulation of JNK cascade (GO:0046328) 1/105 0.04696835 CARD9
35 regulation of interleukin-6 production (GO:0032675) 1/110 0.04696835 CARD9
36 activation of protein kinase activity (GO:0032147) 1/114 0.04696835 TNFSF15
37 positive regulation of protein metabolic process (GO:0051247) 1/115 0.04696835 CARD9
38 cellular response to lectin (GO:1990858) 1/115 0.04696835 CARD9
39 stimulatory C-type lectin receptor signaling pathway (GO:0002223) 1/115 0.04696835 CARD9
40 tumor necrosis factor-mediated signaling pathway (GO:0033209) 1/116 0.04696835 TNFSF15
41 innate immune response activating cell surface receptor signaling pathway (GO:0002220) 1/119 0.04696835 CARD9
42 protein homooligomerization (GO:0051260) 1/121 0.04696835 CARD9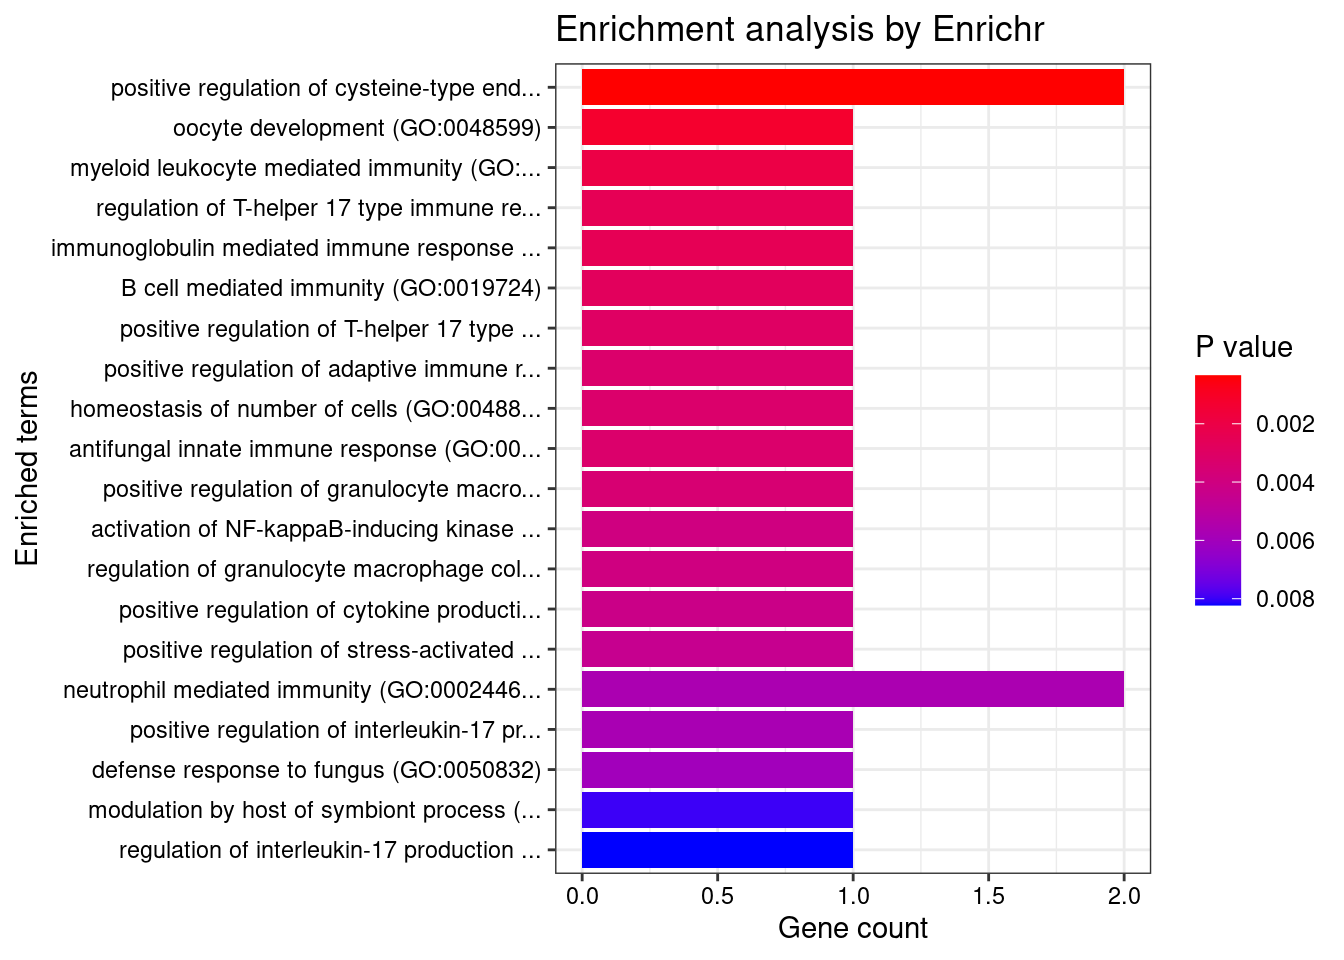
| Version | Author | Date |
|---|---|---|
| 0136d2e | wesleycrouse | 2022-06-10 |
KEGG
output <- output[order(-output$pve_g),]
top_tissues <- output$weight[1:5]
for (tissue in top_tissues){
cat(paste0(tissue, "\n\n"))
ctwas_genes_tissue <- df[[tissue]]$ctwas
background_tissue <- df[[tissue]]$gene_pips$genename
cat(paste0("Number of cTWAS Genes in Tissue: ", length(ctwas_genes_tissue), "\n\n"))
databases <- c("pathway_KEGG")
enrichResult <- NULL
try(enrichResult <- WebGestaltR(enrichMethod="ORA", organism="hsapiens",
interestGene=ctwas_genes_tissue, referenceGene=background_tissue,
enrichDatabase=databases, interestGeneType="genesymbol",
referenceGeneType="genesymbol", isOutput=F))
if (!is.null(enrichResult)){
print(enrichResult[,c("description", "size", "overlap", "FDR", "userId")])
}
cat("\n")
} Whole_Blood
Number of cTWAS Genes in Tissue: 19
Loading the functional categories...
Loading the ID list...
Loading the reference list...
Performing the enrichment analysis...Warning in oraEnrichment(interestGeneList, referenceGeneList, geneSet, minNum = minNum, : No significant gene set is identified based on FDR 0.05!
Skin_Not_Sun_Exposed_Suprapubic
Number of cTWAS Genes in Tissue: 9
Loading the functional categories...
Loading the ID list...
Loading the reference list...
Performing the enrichment analysis...Warning in oraEnrichment(interestGeneList, referenceGeneList, geneSet, minNum = minNum, : No significant gene set is identified based on FDR 0.05!
Adipose_Subcutaneous
Number of cTWAS Genes in Tissue: 7
Loading the functional categories...
Loading the ID list...
Loading the reference list...
Performing the enrichment analysis...Warning in oraEnrichment(interestGeneList, referenceGeneList, geneSet, minNum = minNum, : No significant gene set is identified based on FDR 0.05!
Colon_Transverse
Number of cTWAS Genes in Tissue: 6
Loading the functional categories...
Loading the ID list...
Loading the reference list...
Performing the enrichment analysis...Warning in oraEnrichment(interestGeneList, referenceGeneList, geneSet, minNum = minNum, : No significant gene set is identified based on FDR 0.05!
Spleen
Number of cTWAS Genes in Tissue: 5
Loading the functional categories...
Loading the ID list...
Loading the reference list...
Performing the enrichment analysis...Warning in oraEnrichment(interestGeneList, referenceGeneList, geneSet, minNum = minNum, : No significant gene set is identified based on FDR 0.05!DisGeNET
output <- output[order(-output$pve_g),]
top_tissues <- output$weight[1:5]
for (tissue in top_tissues){
cat(paste0(tissue, "\n\n"))
ctwas_genes_tissue <- df[[tissue]]$ctwas
cat(paste0("Number of cTWAS Genes in Tissue: ", length(ctwas_genes_tissue), "\n\n"))
res_enrich <- disease_enrichment(entities=ctwas_genes_tissue, vocabulary = "HGNC", database = "CURATED")
if (any(res_enrich@qresult$FDR < 0.05)){
  print(res_enrich@qresult[res_enrich@qresult$FDR < 0.05, c("Description", "FDR", "Ratio",  "BgRatio")])
}
cat("\n")
} Whole_Blood
Number of cTWAS Genes in Tissue: 19OAZ3 gene(s) from the input list not found in DisGeNET CURATEDEVA1B gene(s) from the input list not found in DisGeNET CURATEDOR2H2 gene(s) from the input list not found in DisGeNET CURATEDPPP5C gene(s) from the input list not found in DisGeNET CURATEDFAM171B gene(s) from the input list not found in DisGeNET CURATEDTMEM229B gene(s) from the input list not found in DisGeNET CURATED Description FDR Ratio BgRatio
3 Brain Diseases 0.02112685 2/13 25/9703
37 Encephalopathies 0.02112685 2/13 27/9703
17 Inflammatory Bowel Diseases 0.02373158 2/13 35/9703
64 Deep seated dermatophytosis 0.02478870 1/13 1/9703
66 Candidiasis, Familial, 2 0.02831242 1/13 2/9703
68 Angiocentric glioma 0.02831242 1/13 2/9703
69 Leukoencephalopathy, Cystic, Without Megalencephaly 0.02831242 1/13 2/9703
5 Ulcerative Colitis 0.02859916 2/13 63/9703
51 Myopathy, Centronuclear, Autosomal Recessive 0.04398710 1/13 4/9703
Skin_Not_Sun_Exposed_Suprapubic
Number of cTWAS Genes in Tissue: 9EVA1B gene(s) from the input list not found in DisGeNET CURATEDNDFIP1 gene(s) from the input list not found in DisGeNET CURATED Description FDR Ratio BgRatio
29 Crohn's disease of large bowel 4.665228e-05 3/7 44/9703
33 Crohn's disease of the ileum 4.665228e-05 3/7 44/9703
38 Regional enteritis 4.665228e-05 3/7 44/9703
44 IIeocolitis 4.665228e-05 3/7 44/9703
5 Crohn Disease 5.513042e-05 3/7 50/9703
31 Kleine-Levin Syndrome 4.473304e-03 1/7 1/9703
48 Inflammatory Bowel Disease 10 4.473304e-03 1/7 1/9703
50 GRANULOMATOUS DISEASE, CHRONIC, AUTOSOMAL RECESSIVE, CYTOCHROME b-POSITIVE, TYPE III 4.473304e-03 1/7 1/9703
55 COMBINED OXIDATIVE PHOSPHORYLATION DEFICIENCY 20 4.473304e-03 1/7 1/9703
58 MYOPIA 25, AUTOSOMAL DOMINANT 4.473304e-03 1/7 1/9703
17 Megaesophagus 7.453202e-03 1/7 2/9703
62 Limbic encephalitis with leucine-rich glioma-inactivated 1 antibodies 7.453202e-03 1/7 2/9703
23 Bullous pemphigoid 1.031663e-02 1/7 3/9703
8 Esophageal Achalasia 1.051566e-02 1/7 4/9703
21 Oropharyngeal Neoplasms 1.051566e-02 1/7 4/9703
42 Idiopathic achalasia of esophagus 1.051566e-02 1/7 4/9703
49 Oropharyngeal Carcinoma 1.051566e-02 1/7 4/9703
1 Angioedema 1.488797e-02 1/7 6/9703
15 Creutzfeldt-Jakob disease 2.758932e-02 1/7 13/9703
36 New Variant Creutzfeldt-Jakob Disease 2.758932e-02 1/7 13/9703
39 Creutzfeldt-Jakob Disease, Familial 2.758932e-02 1/7 13/9703
18 Moyamoya Disease 3.026835e-02 1/7 17/9703
20 Narcolepsy 3.026835e-02 1/7 17/9703
27 Urticaria 3.026835e-02 1/7 16/9703
41 Narcolepsy-Cataplexy Syndrome 3.026835e-02 1/7 16/9703
26 Systemic Scleroderma 3.250810e-02 1/7 19/9703
6 Drug Eruptions 3.649591e-02 1/7 23/9703
37 Morbilliform Drug Reaction 3.649591e-02 1/7 23/9703
Adipose_Subcutaneous
Number of cTWAS Genes in Tissue: 7OAZ3 gene(s) from the input list not found in DisGeNET CURATEDFGFR1OP gene(s) from the input list not found in DisGeNET CURATEDEVA1B gene(s) from the input list not found in DisGeNET CURATEDCH25H gene(s) from the input list not found in DisGeNET CURATED Description FDR Ratio BgRatio
5 Inflammatory Bowel Diseases 0.0001804346 2/3 35/9703
9 Crohn's disease of large bowel 0.0001804346 2/3 44/9703
10 Crohn's disease of the ileum 0.0001804346 2/3 44/9703
11 Regional enteritis 0.0001804346 2/3 44/9703
12 IIeocolitis 0.0001804346 2/3 44/9703
3 Crohn Disease 0.0001946273 2/3 50/9703
13 Deep seated dermatophytosis 0.0005797774 1/3 1/9703
15 Inflammatory Bowel Disease 10 0.0005797774 1/3 1/9703
14 Candidiasis, Familial, 2 0.0010306091 1/3 2/9703
8 Ankylosing spondylitis 0.0050967831 1/3 11/9703
4 IGA Glomerulonephritis 0.0142875987 1/3 34/9703
6 Pustulosis of Palms and Soles 0.0202196317 1/3 57/9703
7 Psoriasis 0.0202196317 1/3 57/9703
2 Ulcerative Colitis 0.0207388700 1/3 63/9703
Colon_Transverse
Number of cTWAS Genes in Tissue: 6SPIRE2 gene(s) from the input list not found in DisGeNET CURATEDZGLP1 gene(s) from the input list not found in DisGeNET CURATEDEVA1B gene(s) from the input list not found in DisGeNET CURATED Description FDR Ratio BgRatio
38 Hurthle Cell Tumor 0.007884159 1/3 2/9703
43 Oxyphilic Adenoma 0.007884159 1/3 2/9703
44 Inflammatory Bowel Disease 10 0.007884159 1/3 1/9703
46 IMMUNODEFICIENCY 28 0.007884159 1/3 1/9703
8 Psychosis, Brief Reactive 0.036747247 1/3 14/9703
12 Schizophreniform Disorders 0.036747247 1/3 14/9703
2 Depression, Bipolar 0.038636234 1/3 79/9703
4 Crohn Disease 0.038636234 1/3 50/9703
5 Inflammatory Bowel Diseases 0.038636234 1/3 35/9703
6 Jacksonian Seizure 0.038636234 1/3 101/9703
7 Manic Disorder 0.038636234 1/3 71/9703
9 Psychotic Disorders 0.038636234 1/3 101/9703
10 Schizoaffective Disorder 0.038636234 1/3 29/9703
14 Complex partial seizures 0.038636234 1/3 101/9703
15 Crohn's disease of large bowel 0.038636234 1/3 44/9703
16 Generalized seizures 0.038636234 1/3 101/9703
17 Clonic Seizures 0.038636234 1/3 101/9703
18 Crohn's disease of the ileum 0.038636234 1/3 44/9703
19 Visual seizure 0.038636234 1/3 101/9703
20 Tonic Seizures 0.038636234 1/3 102/9703
21 Epileptic drop attack 0.038636234 1/3 101/9703
23 Manic 0.038636234 1/3 78/9703
24 Seizures, Somatosensory 0.038636234 1/3 101/9703
25 Seizures, Auditory 0.038636234 1/3 101/9703
26 Olfactory seizure 0.038636234 1/3 101/9703
27 Gustatory seizure 0.038636234 1/3 101/9703
28 Vertiginous seizure 0.038636234 1/3 101/9703
29 Tonic - clonic seizures 0.038636234 1/3 104/9703
30 Regional enteritis 0.038636234 1/3 44/9703
31 Non-epileptic convulsion 0.038636234 1/3 101/9703
32 Single Seizure 0.038636234 1/3 101/9703
33 Atonic Absence Seizures 0.038636234 1/3 101/9703
34 Convulsive Seizures 0.038636234 1/3 101/9703
35 Seizures, Focal 0.038636234 1/3 104/9703
36 Seizures, Sensory 0.038636234 1/3 101/9703
37 IIeocolitis 0.038636234 1/3 44/9703
45 Nonepileptic Seizures 0.038636234 1/3 101/9703
47 Convulsions 0.038636234 1/3 102/9703
48 Absence Seizures 0.038636234 1/3 102/9703
49 Epileptic Seizures 0.038636234 1/3 101/9703
50 Myoclonic Seizures 0.038636234 1/3 104/9703
51 Generalized Absence Seizures 0.038636234 1/3 101/9703
3 Renal Cell Carcinoma 0.042388118 1/3 128/9703
39 Chromophobe Renal Cell Carcinoma 0.042388118 1/3 128/9703
40 Sarcomatoid Renal Cell Carcinoma 0.042388118 1/3 128/9703
41 Collecting Duct Carcinoma of the Kidney 0.042388118 1/3 128/9703
42 Papillary Renal Cell Carcinoma 0.042388118 1/3 128/9703
22 Conventional (Clear Cell) Renal Cell Carcinoma 0.047890889 1/3 148/9703
Spleen
Number of cTWAS Genes in Tissue: 5ZGLP1 gene(s) from the input list not found in DisGeNET CURATEDOR2H2 gene(s) from the input list not found in DisGeNET CURATED Description FDR Ratio BgRatio
8 Inflammatory Bowel Diseases 0.0006813437 2/3 35/9703
3 Ulcerative Colitis 0.0011160483 2/3 63/9703
4 Enteritis 0.0013914657 1/3 1/9703
15 Deep seated dermatophytosis 0.0013914657 1/3 1/9703
16 Candidiasis, Familial, 2 0.0018550963 1/3 2/9703
17 Leukoencephalopathy, Cystic, Without Megalencephaly 0.0018550963 1/3 2/9703
6 Graves Disease 0.0071502093 1/3 9/9703
11 Ankylosing spondylitis 0.0076451747 1/3 11/9703
1 Brain Diseases 0.0149875873 1/3 25/9703
12 Encephalopathies 0.0149875873 1/3 27/9703
5 IGA Glomerulonephritis 0.0171451184 1/3 34/9703
2 Primary biliary cirrhosis 0.0216964198 1/3 47/9703
10 Degenerative polyarthritis 0.0366236896 1/3 93/9703
13 Osteoarthrosis Deformans 0.0366236896 1/3 93/9703
7 Inflammation 0.0465148664 1/3 127/9703Gene sets curated by Macarthur Lab
output <- output[order(-output$pve_g),]
top_tissues <- output$weight[1:5]

gene_set_dir <- "/project2/mstephens/wcrouse/gene_sets/"
gene_set_files <- c("gwascatalog.tsv",
                    "mgi_essential.tsv",
                    "core_essentials_hart.tsv",
                    "clinvar_path_likelypath.tsv",
                    "fda_approved_drug_targets.tsv")

for (tissue in top_tissues){
  cat(paste0(tissue, "\n\n"))

  ctwas_genes_tissue <- df[[tissue]]$ctwas
  background_tissue <- df[[tissue]]$gene_pips$genename

  cat(paste0("Number of cTWAS Genes in Tissue: ", length(ctwas_genes_tissue), "\n\n"))

  gene_sets <- lapply(gene_set_files, function(x){as.character(read.table(paste0(gene_set_dir, x))[,1])})
  names(gene_sets) <- sapply(gene_set_files, function(x){unlist(strsplit(x, "[.]"))[1]})

  gene_lists <- list(ctwas_genes_tissue=ctwas_genes_tissue)

  #genes in gene_sets filtered to ensure inclusion in background
  gene_sets <- lapply(gene_sets, function(x){x[x %in% background_tissue]})

  ##########
  hyp_score <- data.frame()
  size <- c()
  ngenes <- c()

  for (i in 1:length(gene_sets)) {
    for (j in 1:length(gene_lists)){
      group1 <- length(gene_sets[[i]])
      group2 <- length(as.vector(gene_lists[[j]]))
      size <- c(size, group1)
      Overlap <- length(intersect(gene_sets[[i]],as.vector(gene_lists[[j]])))
      ngenes <- c(ngenes, Overlap)
      Total <- length(background_tissue)
      hyp_score[i,j] <- phyper(Overlap-1, group2, Total-group2, group1,lower.tail=F)
    }
  }
  rownames(hyp_score) <- names(gene_sets)
  colnames(hyp_score) <- names(gene_lists)

  hyp_score_padj <- apply(hyp_score,2, p.adjust, method="BH", n=(nrow(hyp_score)*ncol(hyp_score)))
  hyp_score_padj <- as.data.frame(hyp_score_padj)
  hyp_score_padj$gene_set <- rownames(hyp_score_padj)
  hyp_score_padj$nset <- size
  hyp_score_padj$ngenes <- ngenes
  hyp_score_padj$percent <- ngenes/size

  hyp_score_padj <- hyp_score_padj[order(hyp_score_padj$ctwas_genes),]
  colnames(hyp_score_padj)[1] <- "padj"
  hyp_score_padj <- hyp_score_padj[,c(2:5,1)]
  rownames(hyp_score_padj)<- NULL

  print(hyp_score_padj)

  cat("\n")
}
Whole_Blood
Number of cTWAS Genes in Tissue: 19
gene_set nset ngenes percent padj
1 gwascatalog 3492 10 0.002863688 0.5059604
2 mgi_essential 1254 3 0.002392344 1.0000000
3 core_essentials_hart 153 0 0.000000000 1.0000000
4 clinvar_path_likelypath 1607 3 0.001866833 1.0000000
5 fda_approved_drug_targets 177 0 0.000000000 1.0000000
Skin_Not_Sun_Exposed_Suprapubic
Number of cTWAS Genes in Tissue: 9
gene_set nset ngenes percent padj
1 gwascatalog 3938 6 0.001523616 0.2542909
2 mgi_essential 1461 3 0.002053388 0.2542909
3 clinvar_path_likelypath 1832 2 0.001091703 0.7451377
4 core_essentials_hart 173 0 0.000000000 1.0000000
5 fda_approved_drug_targets 207 0 0.000000000 1.0000000
Adipose_Subcutaneous
Number of cTWAS Genes in Tissue: 7
gene_set nset ngenes percent padj
1 gwascatalog 3849 3 0.0007794232 1
2 mgi_essential 1405 1 0.0007117438 1
3 core_essentials_hart 172 0 0.0000000000 1
4 clinvar_path_likelypath 1789 1 0.0005589715 1
5 fda_approved_drug_targets 206 0 0.0000000000 1
Colon_Transverse
Number of cTWAS Genes in Tissue: 6
gene_set nset ngenes percent padj
1 gwascatalog 3737 4 0.0010703773 0.5929204
2 mgi_essential 1372 1 0.0007288630 1.0000000
3 core_essentials_hart 178 0 0.0000000000 1.0000000
4 clinvar_path_likelypath 1760 1 0.0005681818 1.0000000
5 fda_approved_drug_targets 197 0 0.0000000000 1.0000000
Spleen
Number of cTWAS Genes in Tissue: 5
gene_set nset ngenes percent padj
1 gwascatalog 3582 4 0.001116695 0.2748348
2 clinvar_path_likelypath 1669 2 0.001198322 0.4772366
3 mgi_essential 1266 0 0.000000000 1.0000000
4 core_essentials_hart 170 0 0.000000000 1.0000000
5 fda_approved_drug_targets 182 0 0.000000000 1.0000000Summary of results across tissues
weight_groups <- as.data.frame(matrix(c("Adipose_Subcutaneous", "Adipose",
                                        "Adipose_Visceral_Omentum", "Adipose",
                                        "Adrenal_Gland", "Endocrine",
                                        "Artery_Aorta", "Cardiovascular",
                                        "Artery_Coronary", "Cardiovascular",
                                        "Artery_Tibial", "Cardiovascular",
                                        "Brain_Amygdala", "CNS",
                                        "Brain_Anterior_cingulate_cortex_BA24", "CNS",
                                        "Brain_Caudate_basal_ganglia", "CNS",
                                        "Brain_Cerebellar_Hemisphere", "CNS",
                                        "Brain_Cerebellum", "CNS",
                                        "Brain_Cortex", "CNS",
                                        "Brain_Frontal_Cortex_BA9", "CNS",
                                        "Brain_Hippocampus", "CNS",
                                        "Brain_Hypothalamus", "CNS",
                                        "Brain_Nucleus_accumbens_basal_ganglia", "CNS",
                                        "Brain_Putamen_basal_ganglia", "CNS",
                                        "Brain_Spinal_cord_cervical_c-1", "CNS",
                                        "Brain_Substantia_nigra", "CNS",
                                        "Breast_Mammary_Tissue", "None",
                                        "Cells_Cultured_fibroblasts", "Skin",
                                        "Cells_EBV-transformed_lymphocytes", "Blood or Immune",
                                        "Colon_Sigmoid", "Digestive",
                                        "Colon_Transverse", "Digestive",
                                        "Esophagus_Gastroesophageal_Junction", "Digestive",
                                        "Esophagus_Mucosa", "Digestive",
                                        "Esophagus_Muscularis", "Digestive",
                                        "Heart_Atrial_Appendage", "Cardiovascular",
                                        "Heart_Left_Ventricle", "Cardiovascular",
                                        "Kidney_Cortex", "None",
                                        "Liver", "None",
                                        "Lung", "None",
                                        "Minor_Salivary_Gland", "None",
                                        "Muscle_Skeletal", "None",
                                        "Nerve_Tibial", "None",
                                        "Ovary", "None",
                                        "Pancreas", "None",
                                        "Pituitary", "Endocrine",
                                        "Prostate", "None",
                                        "Skin_Not_Sun_Exposed_Suprapubic", "Skin",
                                        "Skin_Sun_Exposed_Lower_leg", "Skin",
                                        "Small_Intestine_Terminal_Ileum", "Digestive",
                                        "Spleen", "Blood or Immune",
                                        "Stomach", "Digestive",
                                        "Testis", "Endocrine",
                                        "Thyroid", "Endocrine",
                                        "Uterus", "None",
                                        "Vagina", "None",
                                        "Whole_Blood", "Blood or Immune"),
                                      nrow=49, ncol=2, byrow=T), stringsAsFactors=F)
colnames(weight_groups) <- c("weight", "group")

#display tissue groups
print(weight_groups)
weight group
1 Adipose_Subcutaneous Adipose
2 Adipose_Visceral_Omentum Adipose
3 Adrenal_Gland Endocrine
4 Artery_Aorta Cardiovascular
5 Artery_Coronary Cardiovascular
6 Artery_Tibial Cardiovascular
7 Brain_Amygdala CNS
8 Brain_Anterior_cingulate_cortex_BA24 CNS
9 Brain_Caudate_basal_ganglia CNS
10 Brain_Cerebellar_Hemisphere CNS
11 Brain_Cerebellum CNS
12 Brain_Cortex CNS
13 Brain_Frontal_Cortex_BA9 CNS
14 Brain_Hippocampus CNS
15 Brain_Hypothalamus CNS
16 Brain_Nucleus_accumbens_basal_ganglia CNS
17 Brain_Putamen_basal_ganglia CNS
18 Brain_Spinal_cord_cervical_c-1 CNS
19 Brain_Substantia_nigra CNS
20 Breast_Mammary_Tissue None
21 Cells_Cultured_fibroblasts Skin
22 Cells_EBV-transformed_lymphocytes Blood or Immune
23 Colon_Sigmoid Digestive
24 Colon_Transverse Digestive
25 Esophagus_Gastroesophageal_Junction Digestive
26 Esophagus_Mucosa Digestive
27 Esophagus_Muscularis Digestive
28 Heart_Atrial_Appendage Cardiovascular
29 Heart_Left_Ventricle Cardiovascular
30 Kidney_Cortex None
31 Liver None
32 Lung None
33 Minor_Salivary_Gland None
34 Muscle_Skeletal None
35 Nerve_Tibial None
36 Ovary None
37 Pancreas None
38 Pituitary Endocrine
39 Prostate None
40 Skin_Not_Sun_Exposed_Suprapubic Skin
41 Skin_Sun_Exposed_Lower_leg Skin
42 Small_Intestine_Terminal_Ileum Digestive
43 Spleen Blood or Immune
44 Stomach Digestive
45 Testis Endocrine
46 Thyroid Endocrine
47 Uterus None
48 Vagina None
49 Whole_Blood Blood or Immunegroups <- unique(weight_groups$group)
df_group <- list()
for (i in 1:length(groups)){
group <- groups[i]
weights <- weight_groups$weight[weight_groups$group==group]
df_group[[group]] <- list(ctwas=unique(unlist(lapply(df[weights], function(x){x$ctwas}))),
background=unique(unlist(lapply(df[weights], function(x){x$gene_pips$genename}))))
}
output <- output[sapply(weight_groups$weight, match, output$weight),,drop=F]
output$group <- weight_groups$group
output$n_ctwas_group <- sapply(output$group, function(x){length(df_group[[x]][["ctwas"]])})
output$n_ctwas_group[output$group=="None"] <- 0
#barplot of number of cTWAS genes in each tissue
output <- output[order(-output$n_ctwas),,drop=F]
par(mar=c(10.1, 4.1, 4.1, 2.1))
barplot(output$n_ctwas, names.arg=output$weight, las=2, ylab="Number of cTWAS Genes", cex.names=0.6, main="Number of cTWAS Genes by Tissue")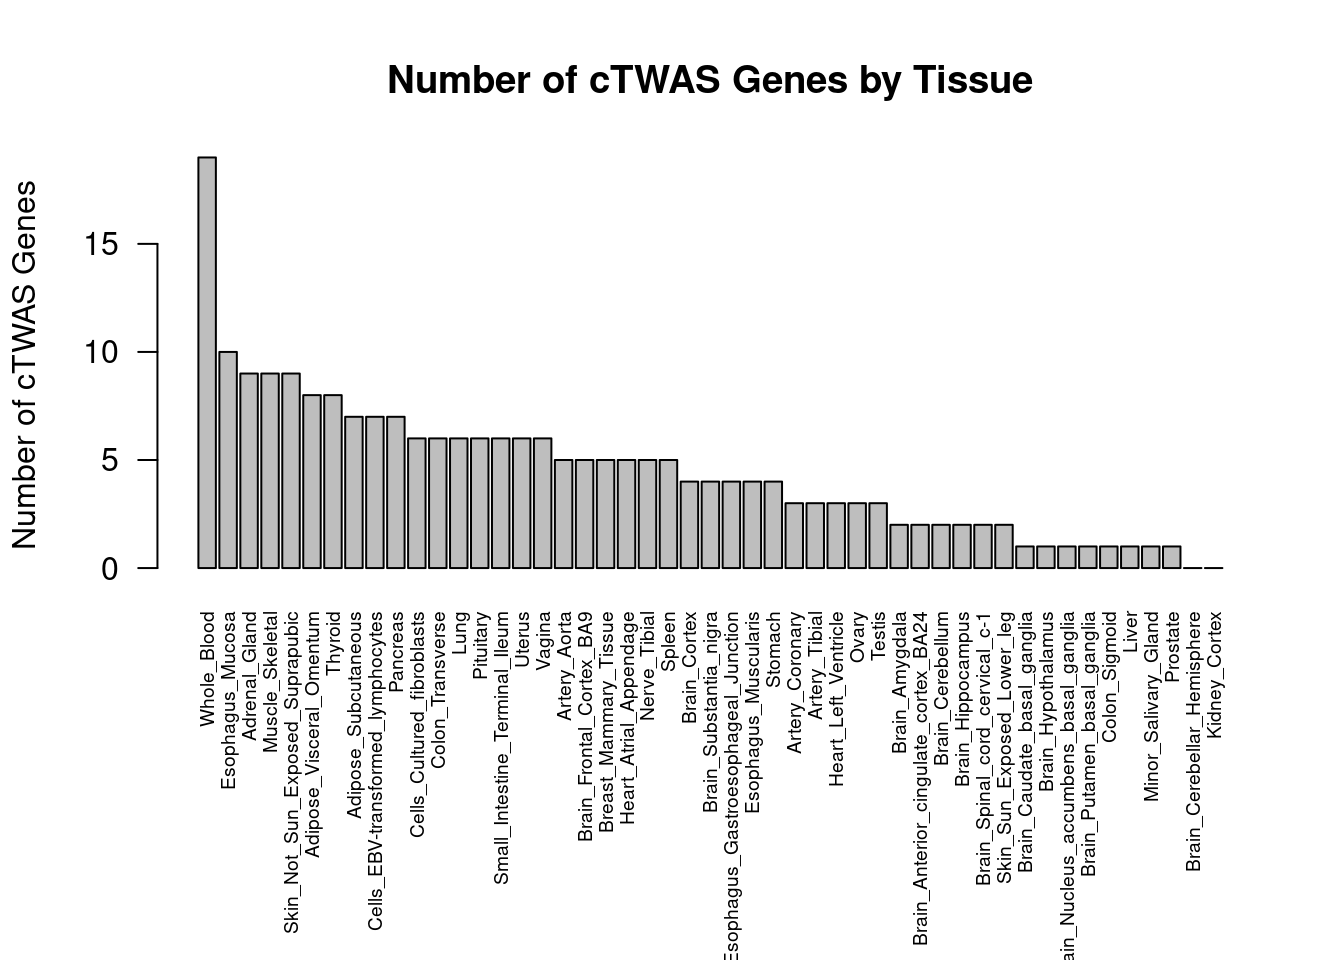
| Version | Author | Date |
|---|---|---|
| 0136d2e | wesleycrouse | 2022-06-10 |
#barplot of number of cTWAS genes in each tissue
df_plot <- -sort(-sapply(groups[groups!="None"], function(x){length(df_group[[x]][["ctwas"]])}))

par(mar=c(10.1, 4.1, 4.1, 2.1))
barplot(df_plot, las=2, ylab="Number of cTWAS Genes", main="Number of cTWAS Genes by Tissue Group")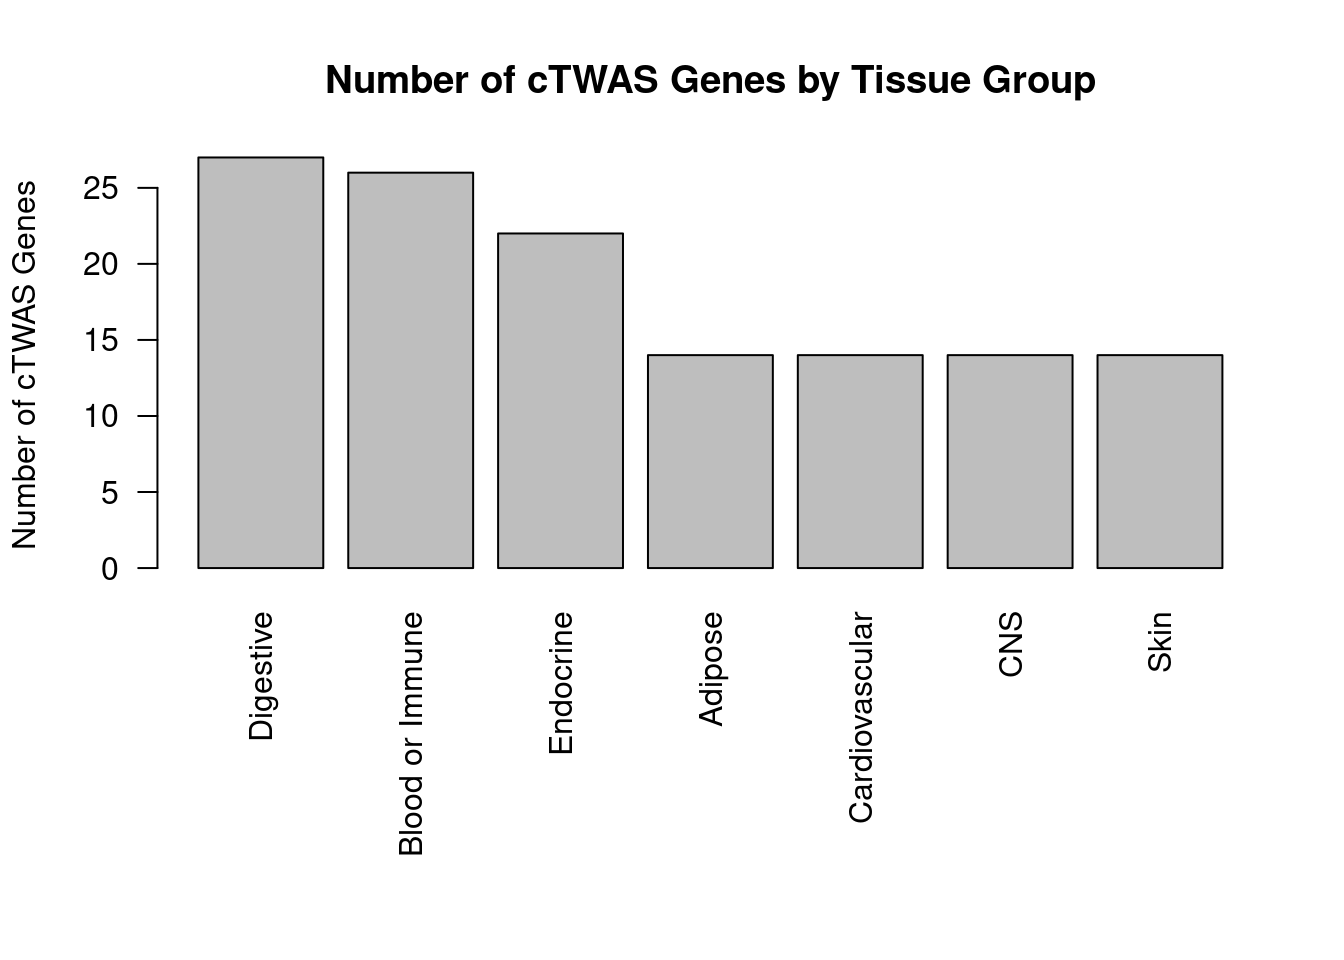
| Version | Author | Date |
|---|---|---|
| 0136d2e | wesleycrouse | 2022-06-10 |
Enrichment analysis for cTWAS genes in each tissue group
GO
suppressWarnings(rm(group_enrichment_results))

for (group in names(df_group)){
  cat(paste0(group, "\n\n"))

  ctwas_genes_group <- df_group[[group]]$ctwas

  cat(paste0("Number of cTWAS Genes in Tissue Group: ", length(ctwas_genes_group), "\n\n"))

  dbs <- c("GO_Biological_Process_2021")
  GO_enrichment <- enrichr(ctwas_genes_group, dbs)

  for (db in dbs){
    cat(paste0("\n", db, "\n\n"))
    enrich_results <- GO_enrichment[[db]]
    enrich_results <- enrich_results[enrich_results$Adjusted.P.value<0.05,c("Term", "Overlap", "Adjusted.P.value", "Genes")]
    print(enrich_results)
    print(plotEnrich(GO_enrichment[[db]]))

    if (nrow(enrich_results)>0){
      if (!exists("group_enrichment_results")){
        group_enrichment_results <- cbind(group, db, enrich_results)
      } else {
        group_enrichment_results <- rbind(group_enrichment_results, cbind(group, db, enrich_results))
      }
    }
  }

}
Adipose
Number of cTWAS Genes in Tissue Group: 14
Uploading data to Enrichr... Done.
Querying GO_Biological_Process_2021... Done.
Parsing results... Done.
GO_Biological_Process_2021
[1] Term Overlap Adjusted.P.value Genes
<0 rows> (or 0-length row.names)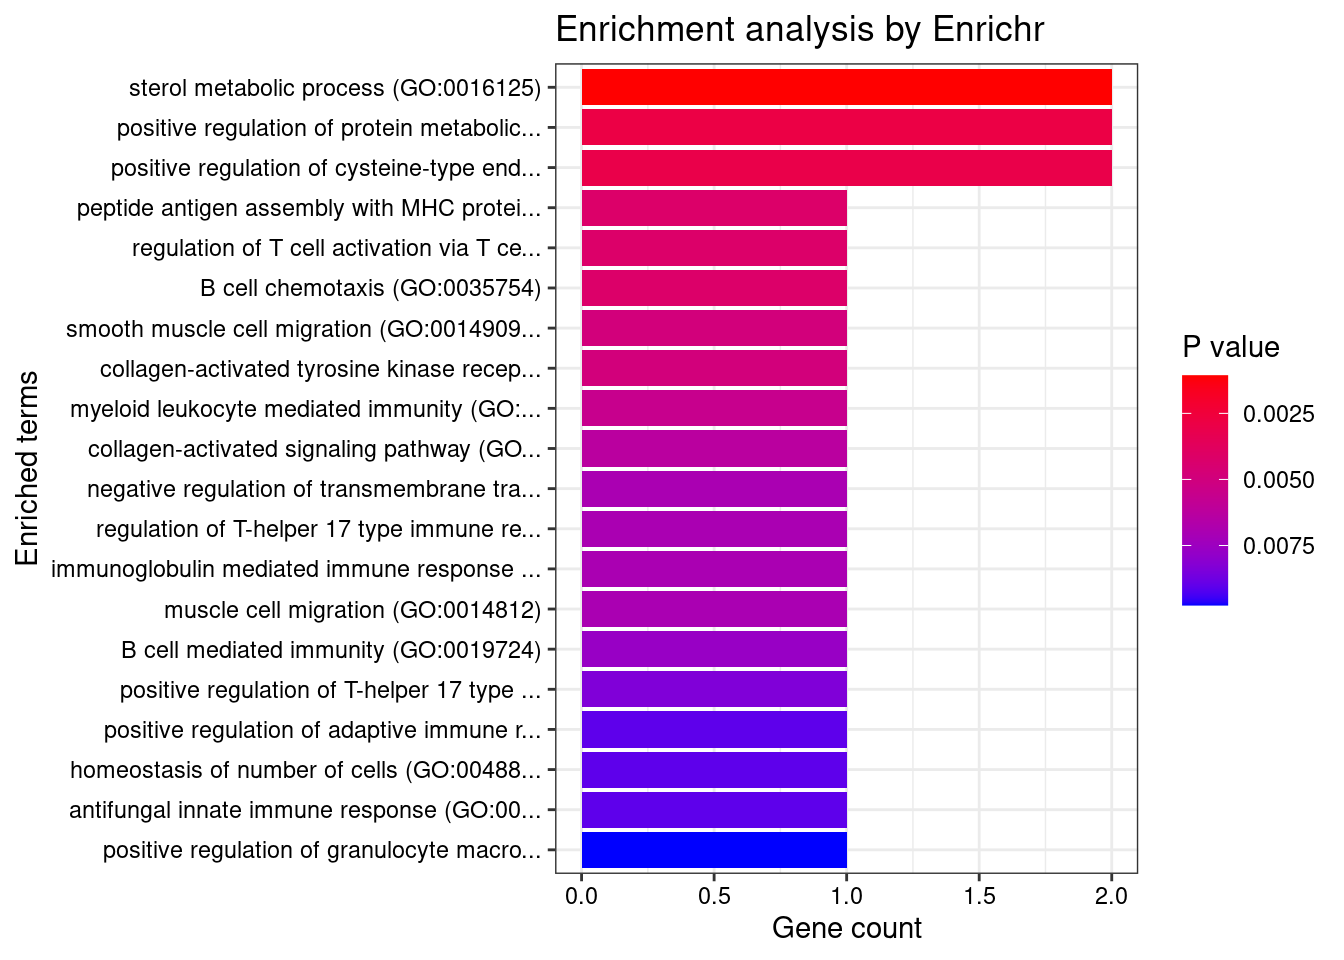
| Version | Author | Date |
|---|---|---|
| 0136d2e | wesleycrouse | 2022-06-10 |
Endocrine

Number of cTWAS Genes in Tissue Group: 22

Uploading data to Enrichr... Done.
  Querying GO_Biological_Process_2021... Done.
Parsing results... Done.

GO_Biological_Process_2021

[1] Term             Overlap          Adjusted.P.value Genes
<0 rows> (or 0-length row.names)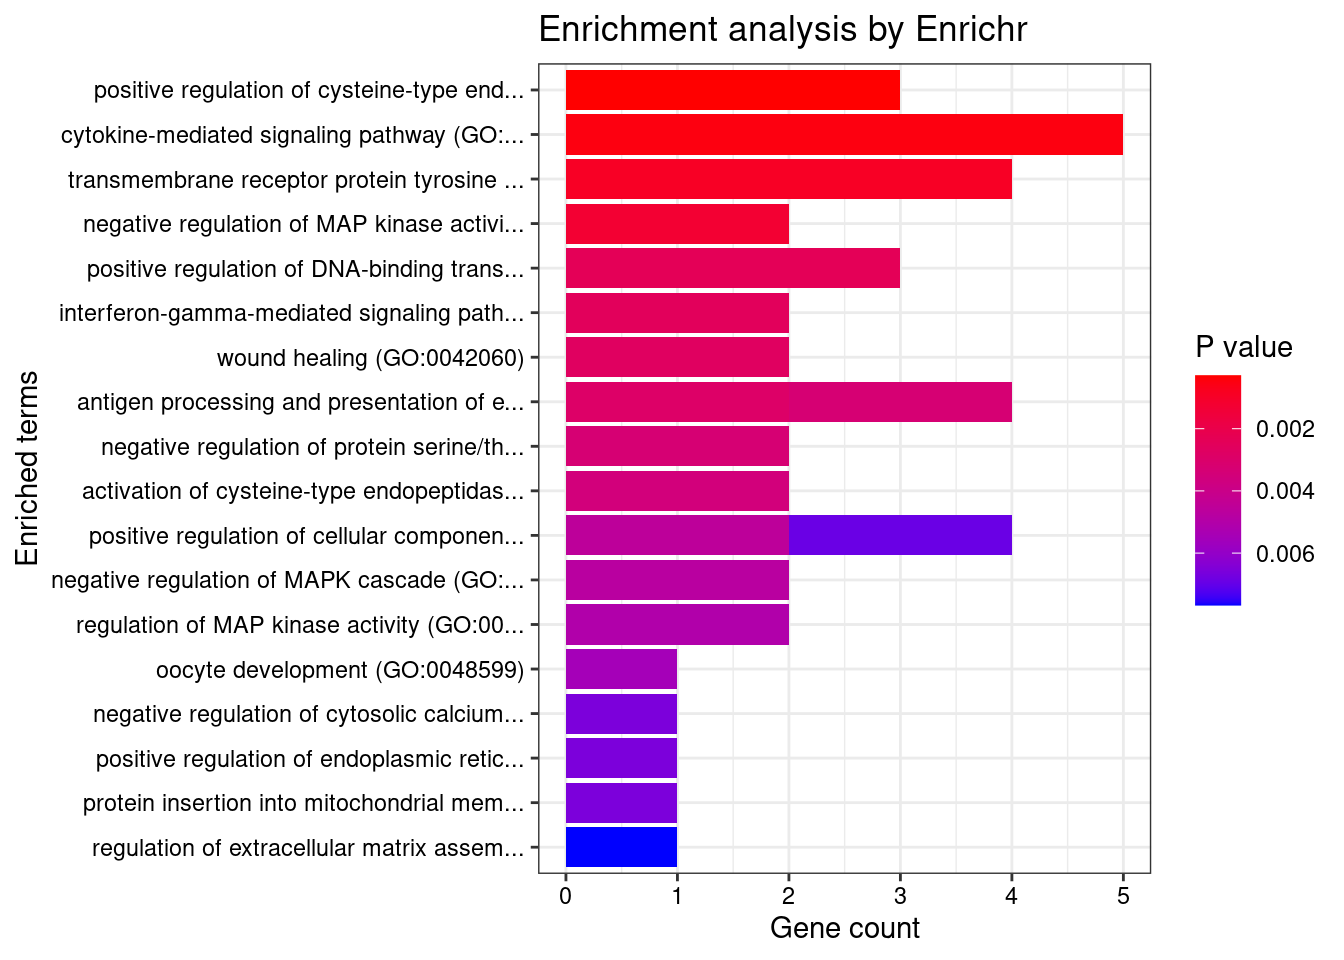
| Version | Author | Date |
|---|---|---|
| 0136d2e | wesleycrouse | 2022-06-10 |
Cardiovascular

Number of cTWAS Genes in Tissue Group: 14

Uploading data to Enrichr... Done.
  Querying GO_Biological_Process_2021... Done.
Parsing results... Done.

GO_Biological_Process_2021

[1] Term             Overlap          Adjusted.P.value Genes
<0 rows> (or 0-length row.names)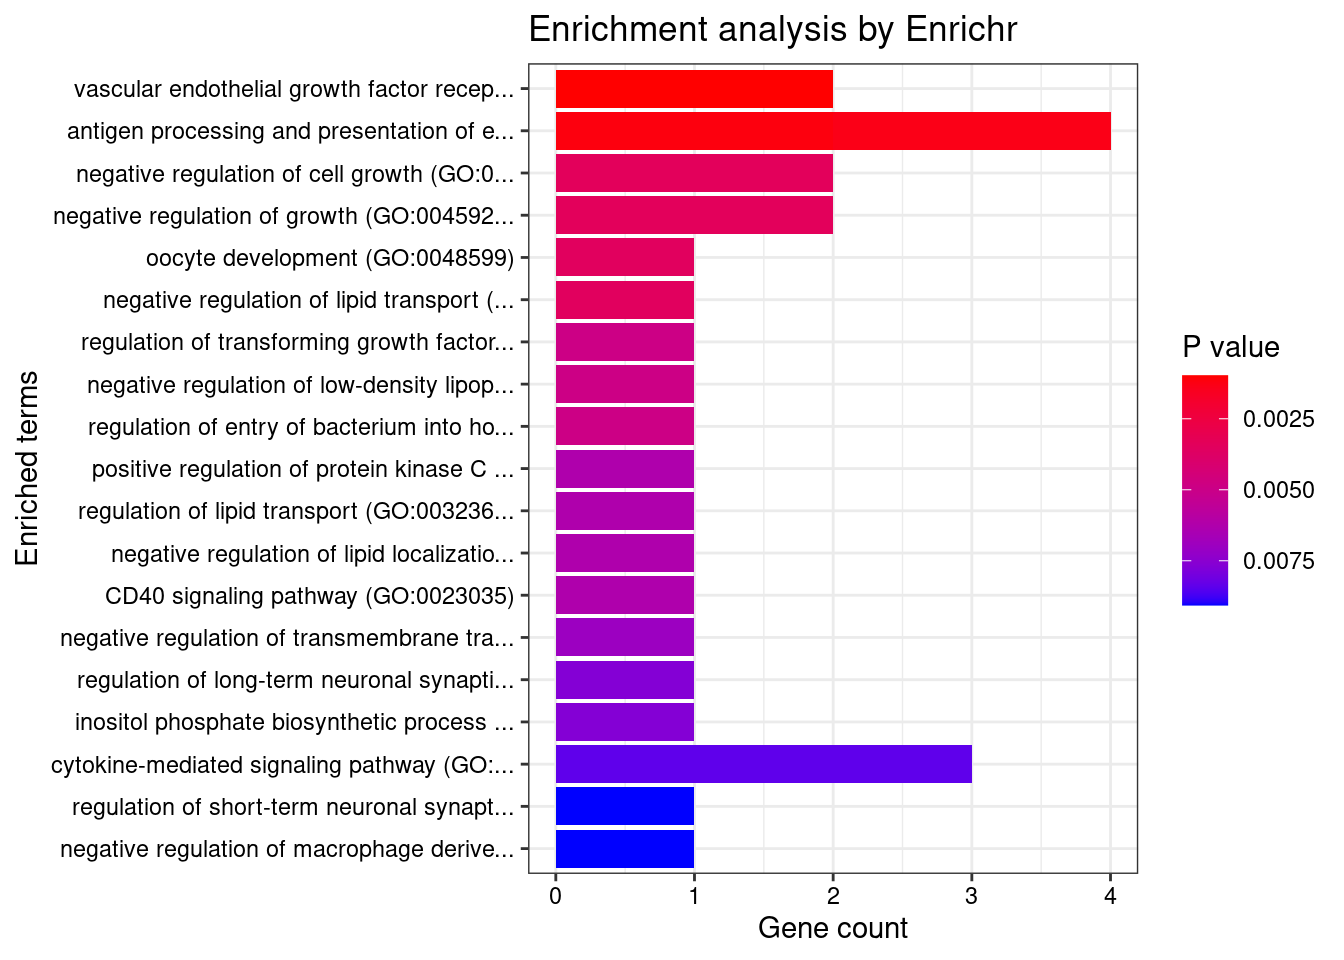
| Version | Author | Date |
|---|---|---|
| 0136d2e | wesleycrouse | 2022-06-10 |
CNS

Number of cTWAS Genes in Tissue Group: 14

Uploading data to Enrichr... Done.
  Querying GO_Biological_Process_2021... Done.
Parsing results... Done.

GO_Biological_Process_2021

[1] Term             Overlap          Adjusted.P.value Genes
<0 rows> (or 0-length row.names)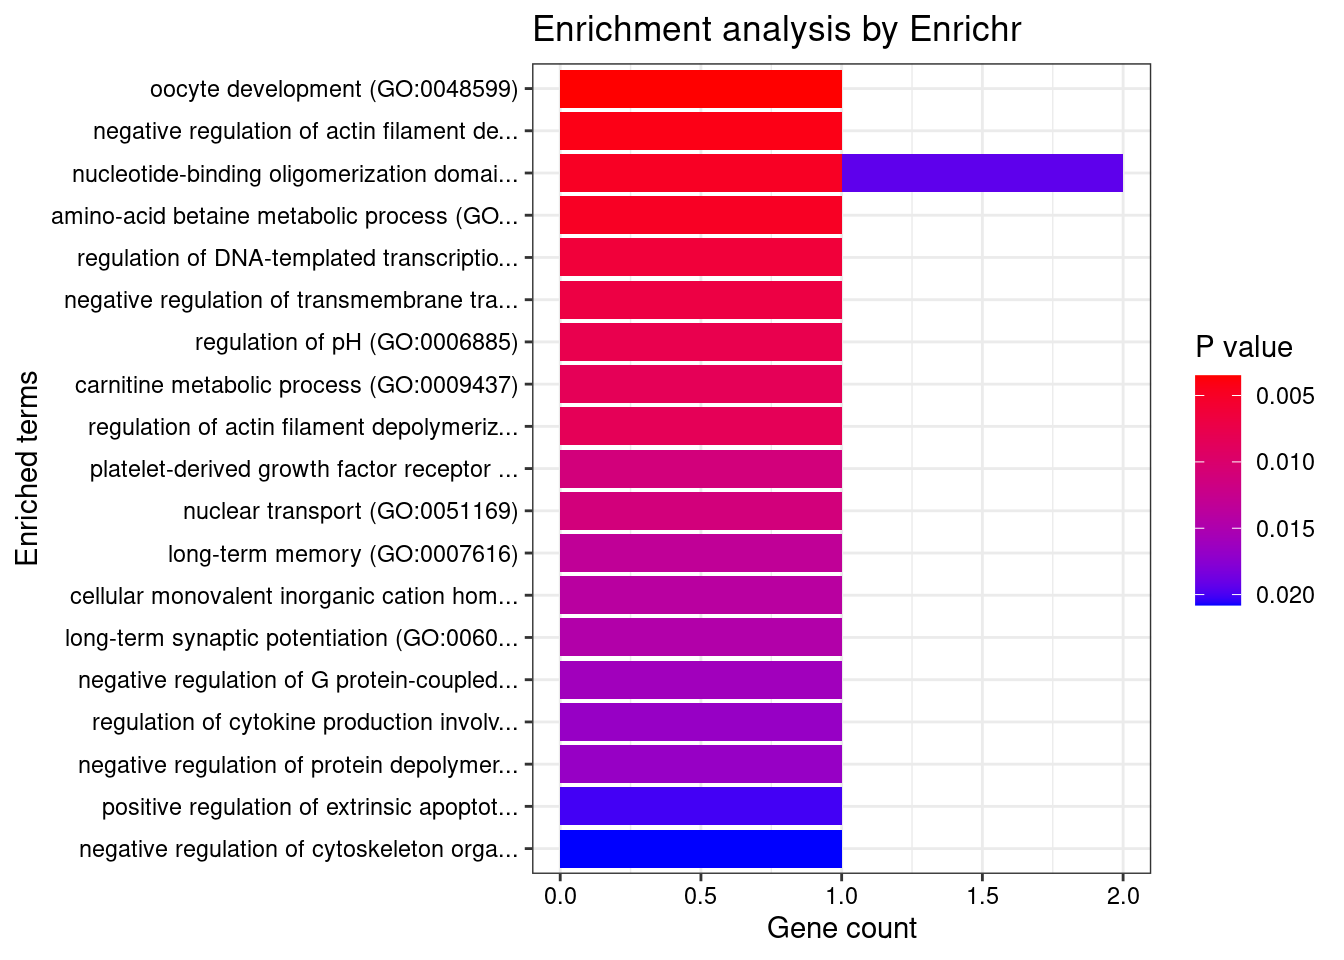
| Version | Author | Date |
|---|---|---|
| 0136d2e | wesleycrouse | 2022-06-10 |
None

Number of cTWAS Genes in Tissue Group: 30

Uploading data to Enrichr... Done.
  Querying GO_Biological_Process_2021... Done.
Parsing results... Done.

GO_Biological_Process_2021

                                                                             Term Overlap Adjusted.P.value                                          Genes
1                                cytokine-mediated signaling pathway (GO:0019221)   7/621       0.01104590 CIITA;CD40;BCL2L11;TNFSF15;IFNGR2;FOS;HLA-DQB1
2              insulin-like growth factor receptor signaling pathway (GO:0048009)    2/11       0.01343275                                    GIGYF1;TSC2
3         positive regulation of I-kappaB kinase/NF-kappaB signaling (GO:0043123)   4/171       0.01343275                        CD40;NDFIP1;CARD9;RBCK1
4                        interferon-gamma-mediated signaling pathway (GO:0060333)    3/68       0.01343275                          CIITA;IFNGR2;HLA-DQB1
5 immune response-regulating cell surface receptor signaling pathway (GO:0002768)    2/14       0.01471839                                      CD40;MICB
6   transmembrane receptor protein tyrosine kinase signaling pathway (GO:0007169)   5/404       0.01793936                  CNKSR1;GIGYF1;RGS14;NCF4;TSC2
7                  regulation of I-kappaB kinase/NF-kappaB signaling (GO:0043122)   4/224       0.01793936                        CD40;NDFIP1;CARD9;RBCK1
8                              cellular response to interferon-gamma (GO:0071346)   3/121       0.03658195                          CIITA;IFNGR2;HLA-DQB1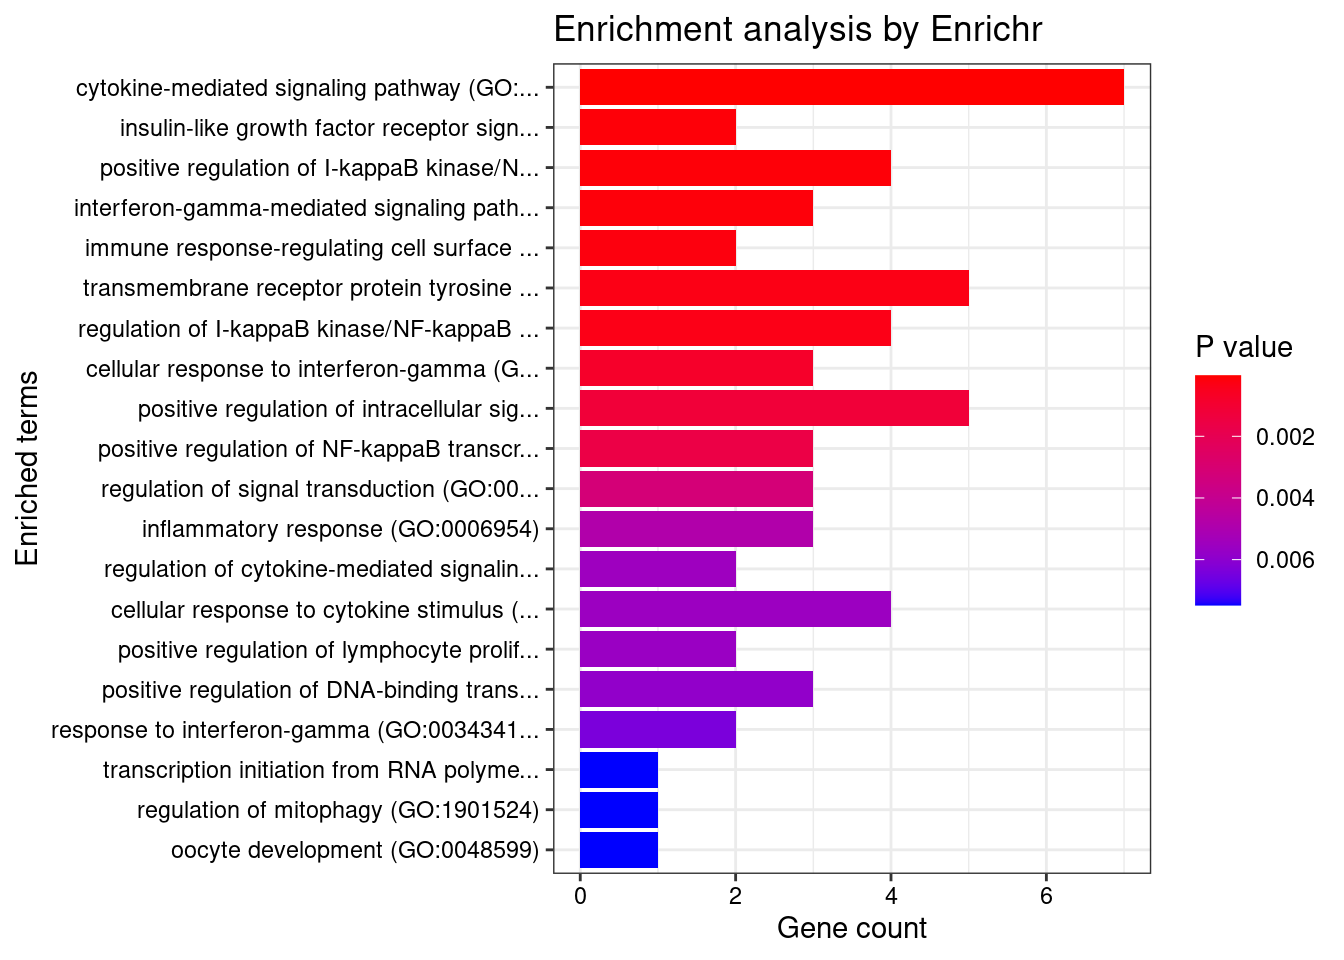
| Version | Author | Date |
|---|---|---|
| 0136d2e | wesleycrouse | 2022-06-10 |
Skin

Number of cTWAS Genes in Tissue Group: 14

Uploading data to Enrichr... Done.
  Querying GO_Biological_Process_2021... Done.
Parsing results... Done.

GO_Biological_Process_2021

                                                                           Term Overlap Adjusted.P.value             Genes
1                                   regulation of receptor binding (GO:1900120)    2/10      0.004408441       ADAM15;MMP9
2                                 extracellular matrix disassembly (GO:0022617)    2/66      0.046477055       ADAM15;MMP9
3                                   cellular component disassembly (GO:0022411)    2/66      0.046477055       ADAM15;MMP9
4 regulation of epidermal growth factor receptor signaling pathway (GO:0042058)    2/67      0.046477055        MMP9;PTPN2
5                                extracellular matrix organization (GO:0030198)   3/300      0.046477055 ADAM15;P4HA2;MMP9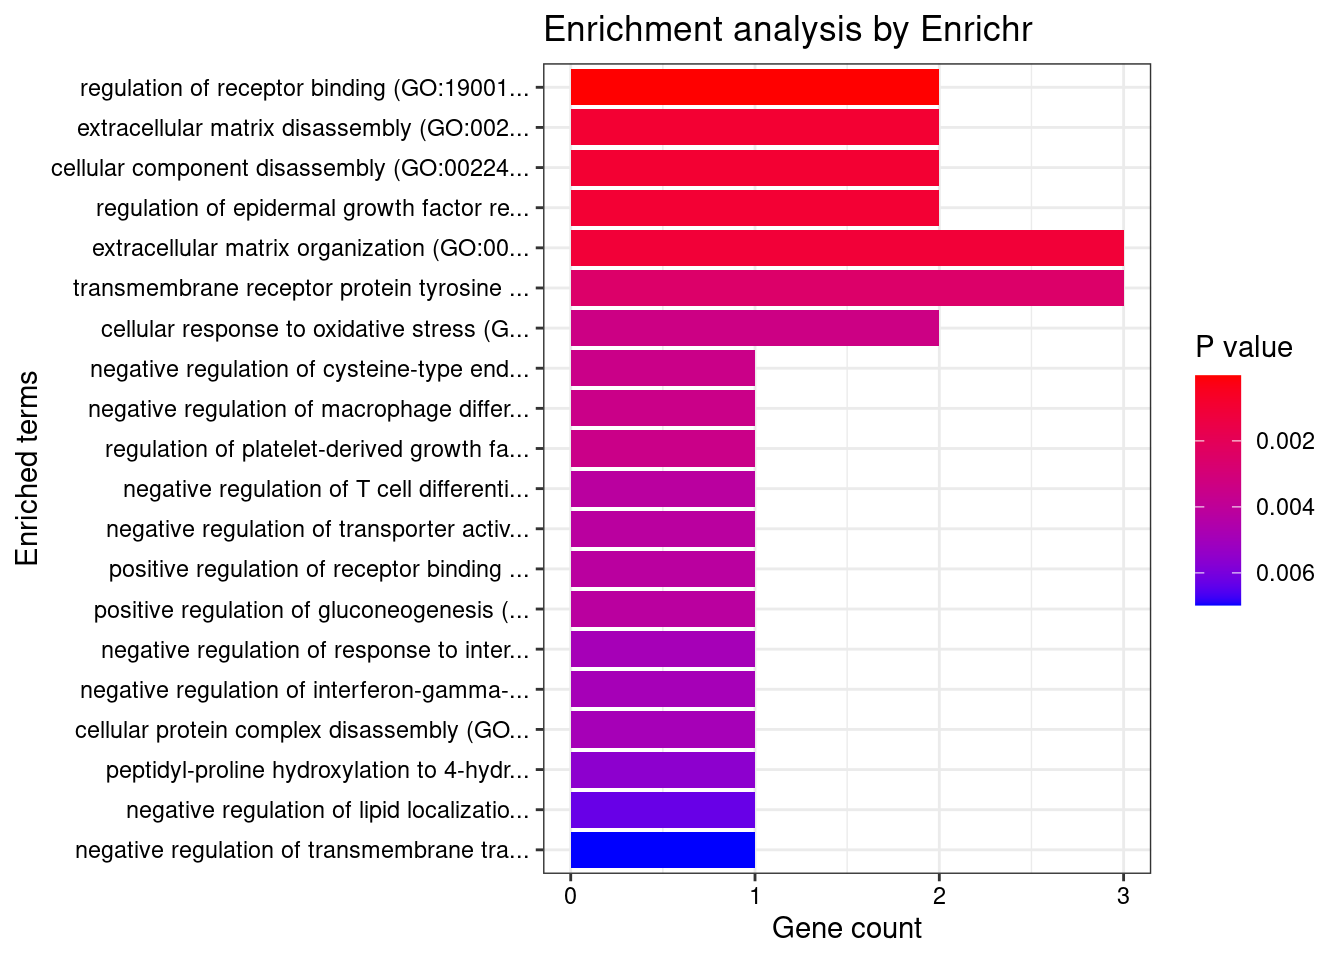
| Version | Author | Date |
|---|---|---|
| 0136d2e | wesleycrouse | 2022-06-10 |
Blood or Immune

Number of cTWAS Genes in Tissue Group: 26

Uploading data to Enrichr... Done.
  Querying GO_Biological_Process_2021... Done.
Parsing results... Done.

GO_Biological_Process_2021

                                                                                  Term Overlap Adjusted.P.value                             Genes
1              positive regulation of I-kappaB kinase/NF-kappaB signaling (GO:0043123)   5/171     0.0009116126     PPP5C;NDFIP1;CARD9;LTBR;RBCK1
2                       regulation of I-kappaB kinase/NF-kappaB signaling (GO:0043122)   5/224     0.0017018817     PPP5C;NDFIP1;CARD9;LTBR;RBCK1
3  positive regulation of CD4-positive, alpha-beta T cell differentiation (GO:0043372)     2/8     0.0056149858                      SOCS1;TNFSF4
4           regulation of CD4-positive, alpha-beta T cell differentiation (GO:0043370)    2/12     0.0090807560                      SOCS1;TNFSF4
5       positive regulation of CD4-positive, alpha-beta T cell activation (GO:2000516)    2/13     0.0090807560                      SOCS1;TNFSF4
6                positive regulation of alpha-beta T cell differentiation (GO:0046638)    2/14     0.0090807560                      SOCS1;TNFSF4
7                        tumor necrosis factor-mediated signaling pathway (GO:0033209)   3/116     0.0205890466               TNFSF15;TNFSF4;LTBR
8                         regulation of regulatory T cell differentiation (GO:0045589)    2/26     0.0205890466                      SOCS1;TNFSF4
9               negative regulation of insulin receptor signaling pathway (GO:0046627)    2/27     0.0205890466                     SOCS1;RPS6KB1
10           negative regulation of cellular response to insulin stimulus (GO:1900077)    2/28     0.0205890466                     SOCS1;RPS6KB1
11               positive regulation of intracellular signal transduction (GO:1902533)   5/546     0.0205890466     PPP5C;NDFIP1;CARD9;LTBR;RBCK1
12                                regulation of interleukin-17 production (GO:0032660)    2/33     0.0259474289                      TNFSF4;CARD9
13         positive regulation of NF-kappaB transcription factor activity (GO:0051092)   3/155     0.0288789621               IL18RAP;CARD9;RBCK1
14                                    cytokine-mediated signaling pathway (GO:0019221)   5/621     0.0288789621 IL18RAP;SOCS1;TNFSF15;TNFSF4;LTBR
15                          positive regulation of T cell differentiation (GO:0045582)    2/43     0.0352185359                      SOCS1;TNFSF4
16                       regulation of insulin receptor signaling pathway (GO:0046626)    2/45     0.0361407251                     SOCS1;RPS6KB1
17                             cellular response to tumor necrosis factor (GO:0071356)   3/194     0.0433746240               TNFSF15;TNFSF4;LTBR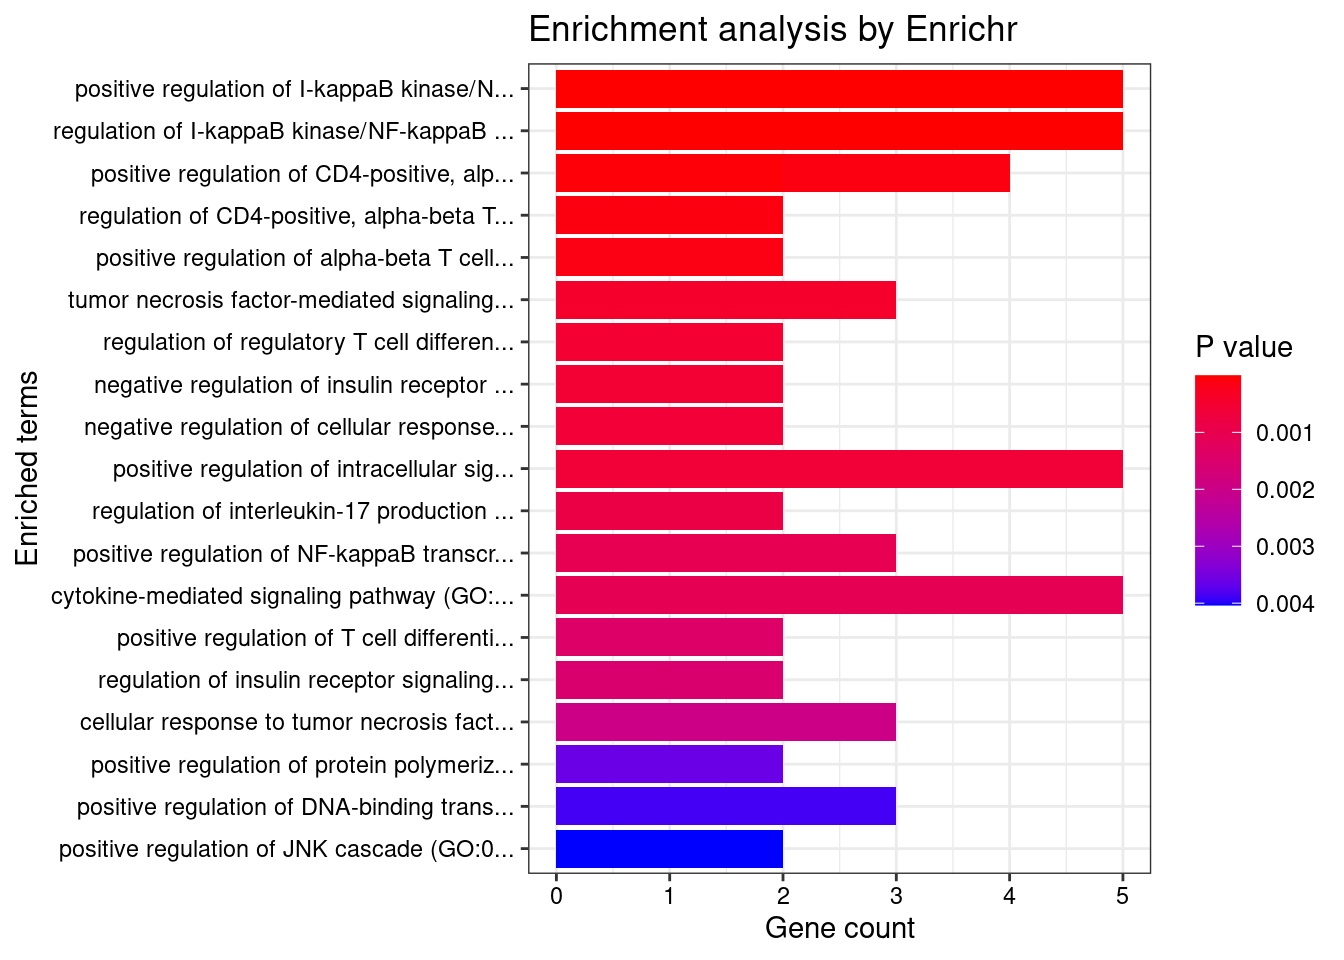
| Version | Author | Date |
|---|---|---|
| 0136d2e | wesleycrouse | 2022-06-10 |
Digestive

Number of cTWAS Genes in Tissue Group: 27

Uploading data to Enrichr... Done.
  Querying GO_Biological_Process_2021... Done.
Parsing results... Done.

GO_Biological_Process_2021

                                                     Term Overlap Adjusted.P.value        Genes
1 regulation of response to interferon-gamma (GO:0060330)    2/14       0.04458921 SOCS1;IFNGR2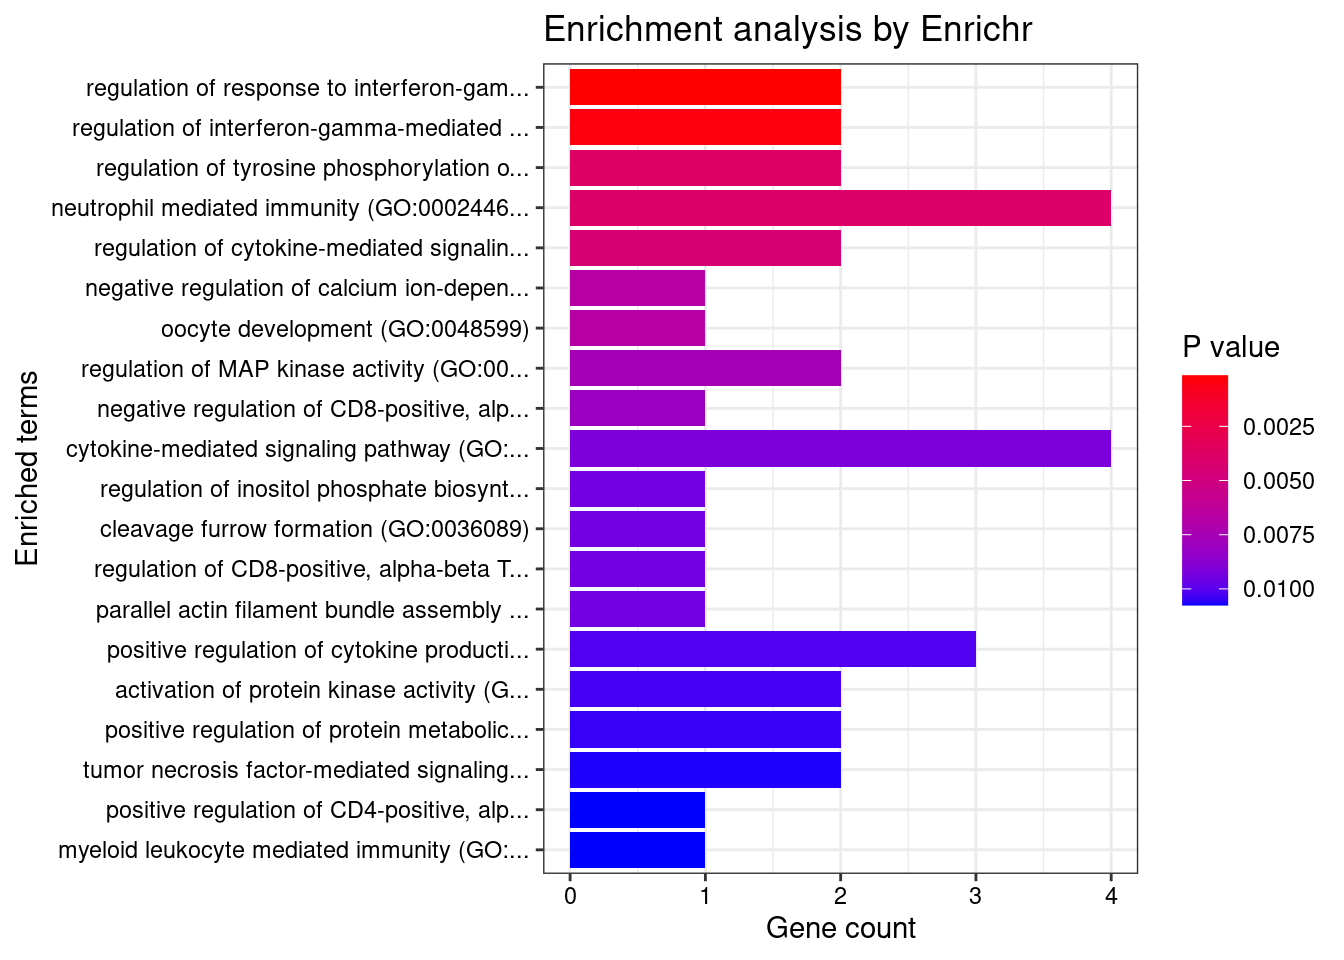
| Version | Author | Date |
|---|---|---|
| 0136d2e | wesleycrouse | 2022-06-10 |
if (exists("group_enrichment_results")){
  save(group_enrichment_results, file="group_enrichment_results.RData")
}
KEGG
for (group in names(df_group)){
  cat(paste0(group, "\n\n"))

  ctwas_genes_group <- df_group[[group]]$ctwas
  background_group <- df_group[[group]]$background

  cat(paste0("Number of cTWAS Genes in Tissue Group: ", length(ctwas_genes_group), "\n\n"))

  databases <- c("pathway_KEGG")

  enrichResult <- WebGestaltR(enrichMethod="ORA", organism="hsapiens",
                              interestGene=ctwas_genes_group, referenceGene=background_group,
                              enrichDatabase=databases, interestGeneType="genesymbol",
                              referenceGeneType="genesymbol", isOutput=F)

  if (!is.null(enrichResult)){
    print(enrichResult[,c("description", "size", "overlap", "FDR", "userId")])
  }

  cat("\n")
}
Adipose
Number of cTWAS Genes in Tissue Group: 14
Loading the functional categories...
Loading the ID list...
Loading the reference list...
Performing the enrichment analysis...Warning in oraEnrichment(interestGeneList, referenceGeneList, geneSet, minNum = minNum, : No significant gene set is identified based on FDR 0.05!
Endocrine

Number of cTWAS Genes in Tissue Group: 22

Loading the functional categories...
Loading the ID list...
Loading the reference list...
Performing the enrichment analysis...
                       description size overlap         FDR                        userId
1 Inflammatory bowel disease (IBD)   46       4 0.001152104 IL18RAP;IFNGR2;HLA-DQB1;SMAD3
2                    Leishmaniasis   53       3 0.041830029          IFNGR2;HLA-DQB1;NCF4

Cardiovascular

Number of cTWAS Genes in Tissue Group: 14

Loading the functional categories...
Loading the ID list...
Loading the reference list...
Performing the enrichment analysis...
Warning in oraEnrichment(interestGeneList, referenceGeneList, geneSet, minNum = minNum, : No significant gene set is identified based on FDR 0.05!
CNS

Number of cTWAS Genes in Tissue Group: 14

Loading the functional categories...
Loading the ID list...
Loading the reference list...
Performing the enrichment analysis...
Warning in oraEnrichment(interestGeneList, referenceGeneList, geneSet, minNum = minNum, : No significant gene set is identified based on FDR 0.05!
None

Number of cTWAS Genes in Tissue Group: 30

Loading the functional categories...
Loading the ID list...
Loading the reference list...
Performing the enrichment analysis...
                                    description size overlap          FDR                              userId
1                                 Leishmaniasis   61       5 0.0002436398    FOS;NCF4;HLA-DQB1;HLA-DMB;IFNGR2
2                                 Toxoplasmosis   99       5 0.0013650899  CIITA;HLA-DQB1;HLA-DMB;CD40;IFNGR2
3                                        Asthma   24       3 0.0038533519               HLA-DQB1;HLA-DMB;CD40
4                                  Tuberculosis  144       5 0.0038533519 CARD9;CIITA;HLA-DQB1;HLA-DMB;IFNGR2
5              Th1 and Th2 cell differentiation   74       4 0.0038533519         FOS;HLA-DQB1;HLA-DMB;IFNGR2
6                           Allograft rejection   29       3 0.0043610890               HLA-DQB1;HLA-DMB;CD40
7                     Th17 cell differentiation   87       4 0.0048466966         FOS;HLA-DQB1;HLA-DMB;IFNGR2
8                    Autoimmune thyroid disease   33       3 0.0048466966               HLA-DQB1;HLA-DMB;CD40
9  Intestinal immune network for IgA production   41       3 0.0082897905               HLA-DQB1;HLA-DMB;CD40
10             Inflammatory bowel disease (IBD)   50       3 0.0134841318             HLA-DQB1;HLA-DMB;IFNGR2
11                            Viral myocarditis   52       3 0.0137691859               HLA-DQB1;HLA-DMB;CD40
12          Antigen processing and presentation   55       3 0.0148977648              CIITA;HLA-DQB1;HLA-DMB
13                                  Influenza A  141       4 0.0178782481       CIITA;HLA-DQB1;HLA-DMB;IFNGR2
14                     Herpes simplex infection  146       4 0.0189303390         FOS;HLA-DQB1;HLA-DMB;IFNGR2
15                 Systemic lupus erythematosus   74       3 0.0275292795               HLA-DQB1;HLA-DMB;CD40
16                         Rheumatoid arthritis   76       3 0.0275292795                FOS;HLA-DQB1;HLA-DMB
17                 Epstein-Barr virus infection  170       4 0.0275292795       HLA-DQB1;HLA-DMB;BCL2L11;CD40

Skin

Number of cTWAS Genes in Tissue Group: 14

Loading the functional categories...
Loading the ID list...
Loading the reference list...
Performing the enrichment analysis...
Warning in oraEnrichment(interestGeneList, referenceGeneList, geneSet, minNum = minNum, : No significant gene set is identified based on FDR 0.05!
Blood or Immune

Number of cTWAS Genes in Tissue Group: 26

Loading the functional categories...
Loading the ID list...
Loading the reference list...
Performing the enrichment analysis...
Warning in oraEnrichment(interestGeneList, referenceGeneList, geneSet, minNum = minNum, : No significant gene set is identified based on FDR 0.05!
Digestive

Number of cTWAS Genes in Tissue Group: 27

Loading the functional categories...
Loading the ID list...
Loading the reference list...
Performing the enrichment analysis...
                 description size overlap          FDR                         userId
1 Osteoclast differentiation  103       5 0.0006595188 IFNGR2;FOSL2;NCF4;SOCS1;FCGR2A
DisGeNET
for (group in names(df_group)){
  cat(paste0(group, "\n\n"))

  ctwas_genes_group <- df_group[[group]]$ctwas

  cat(paste0("Number of cTWAS Genes in Tissue Group: ", length(ctwas_genes_group), "\n\n"))

  res_enrich <- disease_enrichment(entities=ctwas_genes_group, vocabulary = "HGNC", database = "CURATED")

  if (any(res_enrich@qresult$FDR < 0.05)){
    print(res_enrich@qresult[res_enrich@qresult$FDR < 0.05, c("Description", "FDR", "Ratio",  "BgRatio")])
  }

  cat("\n")
}
Adipose
Number of cTWAS Genes in Tissue Group: 14FGFR1OP gene(s) from the input list not found in DisGeNET CURATEDEVA1B gene(s) from the input list not found in DisGeNET CURATEDSDCCAG3 gene(s) from the input list not found in DisGeNET CURATEDOAZ3 gene(s) from the input list not found in DisGeNET CURATEDCH25H gene(s) from the input list not found in DisGeNET CURATEDHLA-DMB gene(s) from the input list not found in DisGeNET CURATED Description FDR Ratio BgRatio
14 Inflammatory Bowel Diseases 0.0001333141 3/8 35/9703
7 Crohn Disease 0.0051306718 2/8 50/9703
10 Enteritis 0.0051306718 1/8 1/9703
29 Crohn's disease of large bowel 0.0051306718 2/8 44/9703
40 Crohn's disease of the ileum 0.0051306718 2/8 44/9703
43 Regional enteritis 0.0051306718 2/8 44/9703
44 IIeocolitis 0.0051306718 2/8 44/9703
51 Deep seated dermatophytosis 0.0051306718 1/8 1/9703
54 Inflammatory Bowel Disease 10 0.0051306718 1/8 1/9703
6 Ulcerative Colitis 0.0063467850 2/8 63/9703
53 Candidiasis, Familial, 2 0.0076932311 1/8 2/9703
55 Leukoencephalopathy, Cystic, Without Megalencephaly 0.0076932311 1/8 2/9703
12 Graves Disease 0.0258991653 1/8 9/9703
30 Megaconial Myopathies 0.0258991653 1/8 9/9703
31 Pleoconial Myopathies 0.0258991653 1/8 9/9703
45 Luft Disease 0.0258991653 1/8 9/9703
23 Ankylosing spondylitis 0.0281170741 1/8 11/9703
32 Mitochondrial Myopathies 0.0281170741 1/8 11/9703
Endocrine
Number of cTWAS Genes in Tissue Group: 22ZGLP1 gene(s) from the input list not found in DisGeNET CURATEDVAMP3 gene(s) from the input list not found in DisGeNET CURATEDEVA1B gene(s) from the input list not found in DisGeNET CURATEDRGS14 gene(s) from the input list not found in DisGeNET CURATEDGIGYF1 gene(s) from the input list not found in DisGeNET CURATED Description FDR Ratio BgRatio
70 Crohn's disease of large bowel 3.548615e-05 4/17 44/9703
79 Crohn's disease of the ileum 3.548615e-05 4/17 44/9703
109 Regional enteritis 3.548615e-05 4/17 44/9703
130 IIeocolitis 3.548615e-05 4/17 44/9703
15 Crohn Disease 4.785179e-05 4/17 50/9703
11 Ulcerative Colitis 1.017074e-04 4/17 63/9703
32 Inflammatory Bowel Diseases 6.825255e-04 3/17 35/9703
56 Systemic Scleroderma 1.026031e-02 2/17 19/9703
20 Enteritis 1.287498e-02 1/17 1/9703
25 IGA Glomerulonephritis 1.287498e-02 2/17 34/9703
47 Niemann-Pick Diseases 1.287498e-02 1/17 1/9703
72 Kleine-Levin Syndrome 1.287498e-02 1/17 1/9703
80 Niemann-Pick Disease, Type A 1.287498e-02 1/17 1/9703
81 Niemann-Pick Disease, Type B 1.287498e-02 1/17 1/9703
82 Niemann-Pick Disease, Type E 1.287498e-02 1/17 1/9703
132 Deep seated dermatophytosis 1.287498e-02 1/17 1/9703
141 LOEYS-DIETZ SYNDROME 3 1.287498e-02 1/17 1/9703
142 GRANULOMATOUS DISEASE, CHRONIC, AUTOSOMAL RECESSIVE, CYTOCHROME b-POSITIVE, TYPE III 1.287498e-02 1/17 1/9703
148 NEPHROTIC SYNDROME, TYPE 9 1.287498e-02 1/17 1/9703
150 IMMUNODEFICIENCY 28 1.287498e-02 1/17 1/9703
152 EPILEPSY, IDIOPATHIC GENERALIZED, SUSCEPTIBILITY TO, 14 1.287498e-02 1/17 1/9703
153 EPILEPTIC ENCEPHALOPATHY, EARLY INFANTILE, 34 1.287498e-02 1/17 1/9703
154 SPASTIC PARAPLEGIA 73, AUTOSOMAL DOMINANT 1.287498e-02 1/17 1/9703
39 Megaesophagus 2.276002e-02 1/17 2/9703
135 Candidiasis, Familial, 2 2.276002e-02 1/17 2/9703
166 Limbic encephalitis with leucine-rich glioma-inactivated 1 antibodies 2.276002e-02 1/17 2/9703
52 Bullous pemphigoid 3.284848e-02 1/17 3/9703
24 Esophageal Achalasia 3.811518e-02 1/17 4/9703
48 Oropharyngeal Neoplasms 3.811518e-02 1/17 4/9703
127 Idiopathic achalasia of esophagus 3.811518e-02 1/17 4/9703
137 Oropharyngeal Carcinoma 3.811518e-02 1/17 4/9703
2 Aneurysm, Dissecting 4.099295e-02 1/17 5/9703
89 Dissection of aorta 4.099295e-02 1/17 5/9703
134 Loeys-Dietz Aortic Aneurysm Syndrome 4.099295e-02 1/17 5/9703
155 Dissection, Blood Vessel 4.099295e-02 1/17 5/9703
162 Loeys-Dietz Syndrome, Type 1a 4.099295e-02 1/17 5/9703
3 Angioedema 4.423590e-02 1/17 6/9703
9 Cholangitis, Sclerosing 4.423590e-02 1/17 6/9703
36 Fibroid Tumor 4.423590e-02 1/17 6/9703
87 Idiopathic generalized epilepsy 4.423590e-02 1/17 6/9703
49 Degenerative polyarthritis 4.530946e-02 2/17 93/9703
66 Osteoarthrosis Deformans 4.530946e-02 2/17 93/9703
4 Aortic Aneurysm 4.583648e-02 1/17 7/9703
63 Uterine Fibroids 4.583648e-02 1/17 7/9703
138 Loeys-Dietz Syndrome 4.583648e-02 1/17 7/9703
Cardiovascular
Number of cTWAS Genes in Tissue Group: 14APBB1 gene(s) from the input list not found in DisGeNET CURATEDZGLP1 gene(s) from the input list not found in DisGeNET CURATEDOAZ3 gene(s) from the input list not found in DisGeNET CURATEDAGAP5 gene(s) from the input list not found in DisGeNET CURATEDEVA1B gene(s) from the input list not found in DisGeNET CURATEDSH3D21 gene(s) from the input list not found in DisGeNET CURATED Description FDR Ratio BgRatio
27 Hyperimmunoglobulin M syndrome 0.02265938 1/8 3/9703
47 Hyper-IgM Immunodeficiency Syndrome, Type 2 0.02265938 1/8 3/9703
48 Hyper-IgM Immunodeficiency Syndrome, Type 3 0.02265938 1/8 3/9703
49 Hyper-IgM Immunodeficiency Syndrome, Type 5 0.02265938 1/8 3/9703
53 GRANULOMATOUS DISEASE, CHRONIC, AUTOSOMAL RECESSIVE, CYTOCHROME b-POSITIVE, TYPE III 0.02265938 1/8 1/9703
54 IMMUNODEFICIENCY 28 0.02265938 1/8 1/9703
14 Mucocutaneous Lymph Node Syndrome 0.02588709 1/8 4/9703
CNS
Number of cTWAS Genes in Tissue Group: 14APBB1 gene(s) from the input list not found in DisGeNET CURATEDPLEKHH2 gene(s) from the input list not found in DisGeNET CURATEDZGLP1 gene(s) from the input list not found in DisGeNET CURATEDKRTCAP3 gene(s) from the input list not found in DisGeNET CURATEDOAZ3 gene(s) from the input list not found in DisGeNET CURATEDEVA1B gene(s) from the input list not found in DisGeNET CURATEDSH3D21 gene(s) from the input list not found in DisGeNET CURATEDRGS14 gene(s) from the input list not found in DisGeNET CURATEDC11orf58 gene(s) from the input list not found in DisGeNET CURATED Description FDR Ratio BgRatio
7 Malaria 0.0009655922 2/5 20/9703
23 SPASTIC PARAPLEGIA 73, AUTOSOMAL DOMINANT 0.0061842919 1/5 1/9703
9 Mucocutaneous Lymph Node Syndrome 0.0098887484 1/5 4/9703
19 Systemic onset juvenile chronic arthritis 0.0098887484 1/5 4/9703
22 Rheumatoid Arthritis, Systemic Juvenile 0.0098887484 1/5 3/9703
18 Pulmonary Cystic Fibrosis 0.0158762556 1/5 9/9703
21 Fibrocystic Disease of Pancreas 0.0158762556 1/5 9/9703
4 Cystic Fibrosis 0.0160394246 1/5 11/9703
14 Sicca Syndrome 0.0160394246 1/5 13/9703
20 Sjogren's Syndrome 0.0160394246 1/5 13/9703
10 Systemic Scleroderma 0.0212847757 1/5 19/9703
12 Thrombocytopenia 0.0297186765 1/5 29/9703
13 Thrombosis 0.0428637207 1/5 49/9703
16 Thrombus 0.0428637207 1/5 46/9703
24 Peripheral Nervous System Diseases 0.0440429706 1/5 54/9703
17 Libman-Sacks Disease 0.0443122639 1/5 58/9703
3 Ulcerative Colitis 0.0452542986 1/5 63/9703
6 Lupus Erythematosus, Systemic 0.0480881100 1/5 71/9703
None
Number of cTWAS Genes in Tissue Group: 30MUC3A gene(s) from the input list not found in DisGeNET CURATEDDEF8 gene(s) from the input list not found in DisGeNET CURATEDZGLP1 gene(s) from the input list not found in DisGeNET CURATEDHLA-DMB gene(s) from the input list not found in DisGeNET CURATEDC3orf62 gene(s) from the input list not found in DisGeNET CURATEDGIGYF1 gene(s) from the input list not found in DisGeNET CURATEDOAZ3 gene(s) from the input list not found in DisGeNET CURATEDEVA1B gene(s) from the input list not found in DisGeNET CURATEDC11orf58 gene(s) from the input list not found in DisGeNET CURATEDRGS14 gene(s) from the input list not found in DisGeNET CURATEDNDFIP1 gene(s) from the input list not found in DisGeNET CURATED Description FDR Ratio BgRatio
47 Jacksonian Seizure 0.007489882 3/19 101/9703
77 Status Epilepticus 0.007489882 3/19 68/9703
85 Epilepsy, Cryptogenic 0.007489882 3/19 82/9703
90 Complex partial seizures 0.007489882 3/19 101/9703
99 Generalized seizures 0.007489882 3/19 101/9703
100 Clonic Seizures 0.007489882 3/19 101/9703
102 Aura 0.007489882 3/19 82/9703
112 Petit mal status 0.007489882 3/19 67/9703
113 Visual seizure 0.007489882 3/19 101/9703
114 Tonic Seizures 0.007489882 3/19 102/9703
115 Epileptic drop attack 0.007489882 3/19 101/9703
121 Grand Mal Status Epilepticus 0.007489882 3/19 67/9703
131 Complex Partial Status Epilepticus 0.007489882 3/19 67/9703
135 Seizures, Somatosensory 0.007489882 3/19 101/9703
136 Seizures, Auditory 0.007489882 3/19 101/9703
137 Olfactory seizure 0.007489882 3/19 101/9703
138 Gustatory seizure 0.007489882 3/19 101/9703
139 Vertiginous seizure 0.007489882 3/19 101/9703
141 Tonic - clonic seizures 0.007489882 3/19 104/9703
156 Non-epileptic convulsion 0.007489882 3/19 101/9703
157 Single Seizure 0.007489882 3/19 101/9703
158 Awakening Epilepsy 0.007489882 3/19 82/9703
159 Atonic Absence Seizures 0.007489882 3/19 101/9703
168 Convulsive Seizures 0.007489882 3/19 101/9703
169 Seizures, Focal 0.007489882 3/19 104/9703
170 Seizures, Sensory 0.007489882 3/19 101/9703
171 Status Epilepticus, Subclinical 0.007489882 3/19 67/9703
172 Non-Convulsive Status Epilepticus 0.007489882 3/19 67/9703
173 Simple Partial Status Epilepticus 0.007489882 3/19 67/9703
224 Nonepileptic Seizures 0.007489882 3/19 101/9703
234 Convulsions 0.007489882 3/19 102/9703
241 Absence Seizures 0.007489882 3/19 102/9703
242 Epileptic Seizures 0.007489882 3/19 101/9703
243 Myoclonic Seizures 0.007489882 3/19 104/9703
244 Generalized Absence Seizures 0.007489882 3/19 101/9703
8 Brain Diseases 0.007547911 2/19 25/9703
26 Epilepsy 0.008117389 3/19 109/9703
83 Encephalopathies 0.008346755 2/19 27/9703
25 Enteritis 0.009487104 1/19 1/9703
31 IGA Glomerulonephritis 0.009487104 2/19 34/9703
94 Caliciviridae Infections 0.009487104 1/19 1/9703
96 Infections, Calicivirus 0.009487104 1/19 1/9703
97 Kleine-Levin Syndrome 0.009487104 1/19 1/9703
194 Deep seated dermatophytosis 0.009487104 1/19 1/9703
209 Bare Lymphocyte Syndrome, Type II, Complementation Group A 0.009487104 1/19 1/9703
216 VITAMIN B12 PLASMA LEVEL QUANTITATIVE TRAIT LOCUS 1 0.009487104 1/19 1/9703
222 GRANULOMATOUS DISEASE, CHRONIC, AUTOSOMAL RECESSIVE, CYTOCHROME b-POSITIVE, TYPE III 0.009487104 1/19 1/9703
225 Infection caused by Norovirus 0.009487104 1/19 1/9703
232 IMMUNODEFICIENCY 28 0.009487104 1/19 1/9703
235 EPILEPSY, IDIOPATHIC GENERALIZED, SUSCEPTIBILITY TO, 14 0.009487104 1/19 1/9703
236 EPILEPTIC ENCEPHALOPATHY, EARLY INFANTILE, 34 0.009487104 1/19 1/9703
237 SPASTIC PARAPLEGIA 73, AUTOSOMAL DOMINANT 0.009487104 1/19 1/9703
256 Polyglucosan body myopathy type 1 0.009487104 1/19 1/9703
45 Inflammatory Bowel Diseases 0.009864232 2/19 35/9703
30 Osteitis Fibrosa Disseminata 0.014109150 1/19 2/9703
54 Megaesophagus 0.014109150 1/19 2/9703
60 Multiple Sclerosis 0.014109150 2/19 45/9703
93 Crohn's disease of large bowel 0.014109150 2/19 44/9703
110 Crohn's disease of the ileum 0.014109150 2/19 44/9703
148 Regional enteritis 0.014109150 2/19 44/9703
166 Multiple Sclerosis, Acute Fulminating 0.014109150 2/19 45/9703
184 IIeocolitis 0.014109150 2/19 44/9703
202 Polycystic kidneys, severe infantile with tuberous sclerosis 0.014109150 1/19 2/9703
206 TUBEROUS SCLEROSIS 1 (disorder) 0.014109150 1/19 2/9703
208 Candidiasis, Familial, 2 0.014109150 1/19 2/9703
210 TUBEROUS SCLEROSIS 2 (disorder) 0.014109150 1/19 2/9703
217 Leukoencephalopathy, Cystic, Without Megalencephaly 0.014109150 1/19 2/9703
233 POLYGLUCOSAN BODY MYOPATHY 1 WITH OR WITHOUT IMMUNODEFICIENCY 0.014109150 1/19 2/9703
250 Fibrocystic Dysplasia of Bone 0.014109150 1/19 2/9703
251 Fibrocartilaginous Dysplasia of Bone 0.014109150 1/19 2/9703
252 Limbic encephalitis with leucine-rich glioma-inactivated 1 antibodies 0.014109150 1/19 2/9703
19 Crohn Disease 0.014967475 2/19 50/9703
1 Addison Disease 0.017661538 1/19 3/9703
36 Severe Dengue 0.017661538 1/19 3/9703
69 Bullous pemphigoid 0.017661538 1/19 3/9703
80 Tuberous Sclerosis 0.017661538 1/19 3/9703
109 Fibrous skin tumor of tuberous sclerosis 0.017661538 1/19 3/9703
117 Hyperimmunoglobulin M syndrome 0.017661538 1/19 3/9703
125 Dengue Shock Syndrome 0.017661538 1/19 3/9703
199 Hyper-IgM Immunodeficiency Syndrome, Type 2 0.017661538 1/19 3/9703
200 Hyper-IgM Immunodeficiency Syndrome, Type 3 0.017661538 1/19 3/9703
201 Hyper-IgM Immunodeficiency Syndrome, Type 5 0.017661538 1/19 3/9703
203 FOCAL CORTICAL DYSPLASIA OF TAYLOR 0.017661538 1/19 3/9703
204 Focal Cortical Dysplasia of Taylor, Type IIa 0.017661538 1/19 3/9703
205 Focal Cortical Dysplasia of Taylor, Type IIb 0.017661538 1/19 3/9703
16 Ulcerative Colitis 0.019677640 2/19 63/9703
22 Lipoatrophic Diabetes Mellitus 0.021274307 1/19 4/9703
29 Esophageal Achalasia 0.021274307 1/19 4/9703
59 Mucocutaneous Lymph Node Syndrome 0.021274307 1/19 4/9703
66 Oropharyngeal Neoplasms 0.021274307 1/19 4/9703
180 Idiopathic achalasia of esophagus 0.021274307 1/19 4/9703
215 Oropharyngeal Carcinoma 0.021274307 1/19 4/9703
219 Bare lymphocyte syndrome 2 0.021274307 1/19 4/9703
231 Other License Status 0.021274307 1/19 4/9703
74 Seizures 0.022410363 3/19 218/9703
174 Lymphangioleiomyomatosis 0.026014726 1/19 5/9703
2 Angioedema 0.026035815 1/19 6/9703
14 Cholangitis, Sclerosing 0.026035815 1/19 6/9703
38 Hyperalgesia 0.026035815 2/19 84/9703
50 Fibroid Tumor 0.026035815 1/19 6/9703
98 Familial generalized lipodystrophy 0.026035815 1/19 6/9703
116 Idiopathic generalized epilepsy 0.026035815 1/19 6/9703
129 Cryptogenic Infantile Spasms 0.026035815 1/19 6/9703
130 Symptomatic Infantile Spasms 0.026035815 1/19 6/9703
140 Allodynia 0.026035815 2/19 84/9703
143 Nodding spasm 0.026035815 1/19 6/9703
145 Jackknife Seizures 0.026035815 1/19 6/9703
150 Hypsarrhythmia 0.026035815 1/19 6/9703
160 Hyperalgesia, Primary 0.026035815 2/19 84/9703
161 Hyperalgesia, Secondary 0.026035815 2/19 84/9703
162 Tactile Allodynia 0.026035815 2/19 84/9703
163 Hyperalgesia, Thermal 0.026035815 2/19 84/9703
197 spasmus nutans 0.026035815 1/19 6/9703
198 Salaam Seizures 0.026035815 1/19 6/9703
221 Mechanical Allodynia 0.026035815 2/19 84/9703
82 Uterine Fibroids 0.030085360 1/19 7/9703
146 Primary sclerosing cholangitis 0.033485414 1/19 8/9703
151 Pure Gonadal Dysgenesis, 46, XX 0.033485414 1/19 8/9703
185 Gonadal Dysgenesis, 46,XX 0.033485414 1/19 8/9703
18 Febrile Convulsions 0.036710720 1/19 9/9703
32 Graves Disease 0.036710720 1/19 9/9703
118 Adult Hepatocellular Carcinoma 0.036710720 1/19 9/9703
76 Ankylosing spondylitis 0.044421504 1/19 11/9703
79 Trigeminal Neuralgia 0.047262235 1/19 12/9703
132 Trigeminal Neuralgia, Idiopathic 0.047262235 1/19 12/9703
133 Secondary Trigeminal Neuralgia 0.047262235 1/19 12/9703
44 Inflammation 0.049579430 2/19 127/9703
48 Creutzfeldt-Jakob disease 0.049579430 1/19 13/9703
126 New Variant Creutzfeldt-Jakob Disease 0.049579430 1/19 13/9703
165 Creutzfeldt-Jakob Disease, Familial 0.049579430 1/19 13/9703
Skin
Number of cTWAS Genes in Tissue Group: 14EVA1B gene(s) from the input list not found in DisGeNET CURATEDOAZ3 gene(s) from the input list not found in DisGeNET CURATEDNDFIP1 gene(s) from the input list not found in DisGeNET CURATEDADAM15 gene(s) from the input list not found in DisGeNET CURATEDAPEH gene(s) from the input list not found in DisGeNET CURATED Description FDR Ratio BgRatio
89 Crohn's disease of large bowel 2.191535e-06 4/9 44/9703
101 Crohn's disease of the ileum 2.191535e-06 4/9 44/9703
133 Regional enteritis 2.191535e-06 4/9 44/9703
157 IIeocolitis 2.191535e-06 4/9 44/9703
27 Crohn Disease 2.966955e-06 4/9 50/9703
94 Kleine-Levin Syndrome 1.619160e-02 1/9 1/9703
168 Inflammatory Bowel Disease 10 1.619160e-02 1/9 1/9703
172 Metaphyseal Anadysplasia 2 1.619160e-02 1/9 1/9703
177 GRANULOMATOUS DISEASE, CHRONIC, AUTOSOMAL RECESSIVE, CYTOCHROME b-POSITIVE, TYPE III 1.619160e-02 1/9 1/9703
182 COMBINED OXIDATIVE PHOSPHORYLATION DEFICIENCY 20 1.619160e-02 1/9 1/9703
185 MYOPIA 25, AUTOSOMAL DOMINANT 1.619160e-02 1/9 1/9703
25 Ulcerative Colitis 2.225427e-02 2/9 63/9703
52 Megaesophagus 2.225427e-02 1/9 2/9703
126 Metaphyseal anadysplasia 2.225427e-02 1/9 2/9703
127 Mandibuloacral dysostosis 2.225427e-02 1/9 2/9703
190 Limbic encephalitis with leucine-rich glioma-inactivated 1 antibodies 2.225427e-02 1/9 2/9703
8 Asthma 2.426738e-02 2/9 80/9703
33 Glioblastoma 2.426738e-02 2/9 79/9703
66 Bullous pemphigoid 2.426738e-02 1/9 3/9703
67 Pericementitis 2.426738e-02 1/9 3/9703
116 Giant Cell Glioblastoma 2.426738e-02 2/9 84/9703
118 Stable angina 2.426738e-02 1/9 3/9703
32 Esophageal Achalasia 2.541249e-02 1/9 4/9703
49 Lupus Nephritis 2.541249e-02 1/9 4/9703
63 Oropharyngeal Neoplasms 2.541249e-02 1/9 4/9703
68 Periodontitis 2.541249e-02 1/9 4/9703
152 Idiopathic achalasia of esophagus 2.541249e-02 1/9 4/9703
170 Oropharyngeal Carcinoma 2.541249e-02 1/9 4/9703
3 Angioedema 2.732220e-02 1/9 6/9703
4 Aortic Aneurysm 2.732220e-02 1/9 7/9703
5 Aortic Diseases 2.732220e-02 1/9 6/9703
6 Aortic Rupture 2.732220e-02 1/9 5/9703
14 Bone neoplasms 2.732220e-02 1/9 8/9703
15 Cerebral Edema 2.732220e-02 1/9 8/9703
43 Lead Poisoning 2.732220e-02 1/9 7/9703
44 Leukemia, T-Cell 2.732220e-02 1/9 5/9703
53 Morphine Dependence 2.732220e-02 1/9 7/9703
55 Multiple Organ Failure 2.732220e-02 1/9 8/9703
91 Aortic Aneurysm, Thoracic 2.732220e-02 1/9 7/9703
108 Malignant Bone Neoplasm 2.732220e-02 1/9 8/9703
119 Aortic Aneurysm, Thoracoabdominal 2.732220e-02 1/9 7/9703
128 Vasogenic Cerebral Edema 2.732220e-02 1/9 8/9703
129 Cytotoxic Cerebral Edema 2.732220e-02 1/9 8/9703
132 Morphine Abuse 2.732220e-02 1/9 7/9703
138 Aortic Aneurysm, Ruptured 2.732220e-02 1/9 5/9703
141 Vasogenic Brain Edema 2.732220e-02 1/9 8/9703
142 Cytotoxic Brain Edema 2.732220e-02 1/9 8/9703
163 Brain Edema 2.732220e-02 1/9 8/9703
164 Glioblastoma Multiforme 2.732220e-02 2/9 111/9703
173 Juvenile pauciarticular chronic arthritis 2.732220e-02 1/9 7/9703
174 Neointima 2.732220e-02 1/9 6/9703
175 Neointima Formation 2.732220e-02 1/9 6/9703
192 Marfan Syndrome, Type I 3.014509e-02 1/9 9/9703
90 Aortic Aneurysm, Abdominal 3.286073e-02 1/9 10/9703
7 Rheumatoid Arthritis 3.444693e-02 2/9 174/9703
31 Diabetic Neuropathies 3.444693e-02 1/9 14/9703
42 Creutzfeldt-Jakob disease 3.444693e-02 1/9 13/9703
51 Marfan Syndrome 3.444693e-02 1/9 11/9703
88 Premature Birth 3.444693e-02 1/9 11/9703
95 Centriacinar Emphysema 3.444693e-02 1/9 12/9703
100 Panacinar Emphysema 3.444693e-02 1/9 12/9703
102 Symmetric Diabetic Proximal Motor Neuropathy 3.444693e-02 1/9 14/9703
103 Asymmetric Diabetic Proximal Motor Neuropathy 3.444693e-02 1/9 14/9703
104 Diabetic Mononeuropathy 3.444693e-02 1/9 14/9703
105 Diabetic Polyneuropathies 3.444693e-02 1/9 14/9703
106 Diabetic Amyotrophy 3.444693e-02 1/9 14/9703
107 Diabetic Autonomic Neuropathy 3.444693e-02 1/9 14/9703
122 New Variant Creutzfeldt-Jakob Disease 3.444693e-02 1/9 13/9703
124 Diabetic Asymmetric Polyneuropathy 3.444693e-02 1/9 14/9703
143 Diabetic Neuralgia 3.444693e-02 1/9 14/9703
144 Creutzfeldt-Jakob Disease, Familial 3.444693e-02 1/9 13/9703
171 Focal Emphysema 3.444693e-02 1/9 12/9703
83 Urticaria 3.827237e-02 1/9 16/9703
146 Narcolepsy-Cataplexy Syndrome 3.827237e-02 1/9 16/9703
54 Moyamoya Disease 3.906397e-02 1/9 17/9703
58 Narcolepsy 3.906397e-02 1/9 17/9703
71 Pulmonary Emphysema 3.906397e-02 1/9 17/9703
62 Oral Submucous Fibrosis 4.029811e-02 1/9 18/9703
80 Gastric ulcer 4.029811e-02 1/9 18/9703
77 Systemic Scleroderma 4.198789e-02 1/9 19/9703
9 Astrocytoma 4.592573e-02 1/9 25/9703
28 Drug Eruptions 4.592573e-02 1/9 23/9703
73 Pyemia 4.592573e-02 1/9 24/9703
78 Septicemia 4.592573e-02 1/9 24/9703
93 Subependymal Giant Cell Astrocytoma 4.592573e-02 1/9 25/9703
98 Sepsis 4.592573e-02 1/9 24/9703
109 Juvenile Pilocytic Astrocytoma 4.592573e-02 1/9 25/9703
110 Diffuse Astrocytoma 4.592573e-02 1/9 25/9703
115 Pilocytic Astrocytoma 4.592573e-02 1/9 25/9703
117 Childhood Cerebral Astrocytoma 4.592573e-02 1/9 25/9703
125 Morbilliform Drug Reaction 4.592573e-02 1/9 23/9703
131 Mixed oligoastrocytoma 4.592573e-02 1/9 25/9703
139 Cerebral Astrocytoma 4.592573e-02 1/9 25/9703
140 Intracranial Astrocytoma 4.592573e-02 1/9 25/9703
165 Grade I Astrocytoma 4.592573e-02 1/9 25/9703
166 Severe Sepsis 4.592573e-02 1/9 24/9703
112 Protoplasmic astrocytoma 4.629633e-02 1/9 26/9703
113 Gemistocytic astrocytoma 4.629633e-02 1/9 26/9703
114 Fibrillary Astrocytoma 4.629633e-02 1/9 26/9703
75 Retinal Diseases 4.710555e-02 1/9 27/9703
111 Anaplastic astrocytoma 4.710555e-02 1/9 27/9703
37 Hyperplasia 4.788193e-02 1/9 28/9703
176 Cerebral Hemorrhage 4.788193e-02 1/9 28/9703
Blood or Immune
Number of cTWAS Genes in Tissue Group: 26ZGLP1 gene(s) from the input list not found in DisGeNET CURATEDGIGYF1 gene(s) from the input list not found in DisGeNET CURATEDOAZ3 gene(s) from the input list not found in DisGeNET CURATEDEVA1B gene(s) from the input list not found in DisGeNET CURATEDNDFIP1 gene(s) from the input list not found in DisGeNET CURATEDOR2H2 gene(s) from the input list not found in DisGeNET CURATEDPPP5C gene(s) from the input list not found in DisGeNET CURATEDFAM171B gene(s) from the input list not found in DisGeNET CURATEDTMEM229B gene(s) from the input list not found in DisGeNET CURATED Description FDR Ratio BgRatio
26 Inflammatory Bowel Diseases 0.003873029 3/17 35/9703
6 Ulcerative Colitis 0.011398349 3/17 63/9703
3 Brain Diseases 0.026672622 2/17 25/9703
12 Enteritis 0.026672622 1/17 1/9703
51 Encephalopathies 0.026672622 2/17 27/9703
116 Deep seated dermatophytosis 0.026672622 1/17 1/9703
130 EPILEPSY, IDIOPATHIC GENERALIZED, SUSCEPTIBILITY TO, 14 0.026672622 1/17 1/9703
131 EPILEPTIC ENCEPHALOPATHY, EARLY INFANTILE, 34 0.026672622 1/17 1/9703
137 Polyglucosan body myopathy type 1 0.026672622 1/17 1/9703
118 Candidiasis, Familial, 2 0.036900867 1/17 2/9703
120 Angiocentric glioma 0.036900867 1/17 2/9703
121 Leukoencephalopathy, Cystic, Without Megalencephaly 0.036900867 1/17 2/9703
128 POLYGLUCOSAN BODY MYOPATHY 1 WITH OR WITHOUT IMMUNODEFICIENCY 0.036900867 1/17 2/9703
Digestive
Number of cTWAS Genes in Tissue Group: 27C1orf106 gene(s) from the input list not found in DisGeNET CURATEDZGLP1 gene(s) from the input list not found in DisGeNET CURATEDGIGYF1 gene(s) from the input list not found in DisGeNET CURATEDOSER1 gene(s) from the input list not found in DisGeNET CURATEDADCY9 gene(s) from the input list not found in DisGeNET CURATEDOAZ3 gene(s) from the input list not found in DisGeNET CURATEDEVA1B gene(s) from the input list not found in DisGeNET CURATEDRGS14 gene(s) from the input list not found in DisGeNET CURATEDSTXBP3 gene(s) from the input list not found in DisGeNET CURATEDSPIRE2 gene(s) from the input list not found in DisGeNET CURATEDSPNS2 gene(s) from the input list not found in DisGeNET CURATED Description FDR Ratio BgRatio
24 Inflammatory Bowel Diseases 0.001657077 3/16 35/9703
35 Mucocutaneous Lymph Node Syndrome 0.001657077 2/16 4/9703
2 Rheumatoid Arthritis 0.005462179 4/16 174/9703
9 Ulcerative Colitis 0.005462179 3/16 63/9703
13 Enteritis 0.023417852 1/16 1/9703
113 Deep seated dermatophytosis 0.023417852 1/16 1/9703
124 Inflammatory Bowel Disease 10 0.023417852 1/16 1/9703
127 GRANULOMATOUS DISEASE, CHRONIC, AUTOSOMAL RECESSIVE, CYTOCHROME b-POSITIVE, TYPE III 0.023417852 1/16 1/9703
133 IMMUNODEFICIENCY 28 0.023417852 1/16 1/9703
135 MICROCEPHALY 16, PRIMARY, AUTOSOMAL RECESSIVE 0.023417852 1/16 1/9703
61 Crohn's disease of large bowel 0.023503314 2/16 44/9703
71 Crohn's disease of the ileum 0.023503314 2/16 44/9703
89 Regional enteritis 0.023503314 2/16 44/9703
102 IIeocolitis 0.023503314 2/16 44/9703
10 Crohn Disease 0.024631313 2/16 50/9703
104 Hurthle Cell Tumor 0.024631313 1/16 2/9703
115 Oxyphilic Adenoma 0.024631313 1/16 2/9703
123 Candidiasis, Familial, 2 0.024631313 1/16 2/9703
125 Leukoencephalopathy, Cystic, Without Megalencephaly 0.024631313 1/16 2/9703
76 Hyperimmunoglobulin M syndrome 0.030497817 1/16 3/9703
119 Hyper-IgM Immunodeficiency Syndrome, Type 2 0.030497817 1/16 3/9703
120 Hyper-IgM Immunodeficiency Syndrome, Type 3 0.030497817 1/16 3/9703
121 Hyper-IgM Immunodeficiency Syndrome, Type 5 0.030497817 1/16 3/9703Gene sets curated by Macarthur Lab
gene_set_dir <- "/project2/mstephens/wcrouse/gene_sets/"
gene_set_files <- c("gwascatalog.tsv",
                    "mgi_essential.tsv",
                    "core_essentials_hart.tsv",
                    "clinvar_path_likelypath.tsv",
                    "fda_approved_drug_targets.tsv")

for (group in names(df_group)){
  cat(paste0(group, "\n\n"))

  ctwas_genes_group <- df_group[[group]]$ctwas
  background_group <- df_group[[group]]$background

  cat(paste0("Number of cTWAS Genes in Tissue Group: ", length(ctwas_genes_group), "\n\n"))

  gene_sets <- lapply(gene_set_files, function(x){as.character(read.table(paste0(gene_set_dir, x))[,1])})
  names(gene_sets) <- sapply(gene_set_files, function(x){unlist(strsplit(x, "[.]"))[1]})

  gene_lists <- list(ctwas_genes_group=ctwas_genes_group)

  #genes in gene_sets filtered to ensure inclusion in background
  gene_sets <- lapply(gene_sets, function(x){x[x %in% background_group]})

  #hypergeometric test
  hyp_score <- data.frame()
  size <- c()
  ngenes <- c()

  for (i in 1:length(gene_sets)) {
    for (j in 1:length(gene_lists)){
      group1 <- length(gene_sets[[i]])
      group2 <- length(as.vector(gene_lists[[j]]))
      size <- c(size, group1)
      Overlap <- length(intersect(gene_sets[[i]],as.vector(gene_lists[[j]])))
      ngenes <- c(ngenes, Overlap)
      Total <- length(background_group)
      hyp_score[i,j] <- phyper(Overlap-1, group2, Total-group2, group1,lower.tail=F)
    }
  }
  rownames(hyp_score) <- names(gene_sets)
  colnames(hyp_score) <- names(gene_lists)

  #multiple testing correction
  hyp_score_padj <- apply(hyp_score,2, p.adjust, method="BH", n=(nrow(hyp_score)*ncol(hyp_score)))
  hyp_score_padj <- as.data.frame(hyp_score_padj)
  hyp_score_padj$gene_set <- rownames(hyp_score_padj)
  hyp_score_padj$nset <- size
  hyp_score_padj$ngenes <- ngenes
  hyp_score_padj$percent <- ngenes/size

  hyp_score_padj <- hyp_score_padj[order(hyp_score_padj$ctwas_genes),]
  colnames(hyp_score_padj)[1] <- "padj"
  hyp_score_padj <- hyp_score_padj[,c(2:5,1)]
  rownames(hyp_score_padj)<- NULL

  print(hyp_score_padj)

  cat("\n")
}
Adipose
Number of cTWAS Genes in Tissue Group: 14
gene_set nset ngenes percent padj
1 gwascatalog 4576 7 0.0015297203 0.6158326
2 fda_approved_drug_targets 258 1 0.0038759690 0.6158326
3 mgi_essential 1717 2 0.0011648224 0.8754863
4 clinvar_path_likelypath 2137 2 0.0009358914 0.8754863
5 core_essentials_hart 207 0 0.0000000000 1.0000000
Endocrine
Number of cTWAS Genes in Tissue Group: 22
gene_set nset ngenes percent padj
1 gwascatalog 5392 13 0.002410979 0.09365854
2 mgi_essential 2022 5 0.002472799 0.38798919
3 clinvar_path_likelypath 2486 5 0.002011263 0.46552118
4 core_essentials_hart 236 0 0.000000000 1.00000000
5 fda_approved_drug_targets 305 0 0.000000000 1.00000000
Cardiovascular
Number of cTWAS Genes in Tissue Group: 14
gene_set nset ngenes percent padj
1 gwascatalog 5192 7 0.001348228 0.6969919
2 mgi_essential 1970 3 0.001522843 0.6969919
3 clinvar_path_likelypath 2404 3 0.001247920 0.6969919
4 core_essentials_hart 242 0 0.000000000 1.0000000
5 fda_approved_drug_targets 287 0 0.000000000 1.0000000
CNS
Number of cTWAS Genes in Tissue Group: 14
gene_set nset ngenes percent padj
1 gwascatalog 5424 7 0.0012905605 0.9646488
2 mgi_essential 2090 1 0.0004784689 1.0000000
3 core_essentials_hart 244 0 0.0000000000 1.0000000
4 clinvar_path_likelypath 2529 0 0.0000000000 1.0000000
5 fda_approved_drug_targets 316 0 0.0000000000 1.0000000
None
Number of cTWAS Genes in Tissue Group: 30
gene_set nset ngenes percent padj
1 gwascatalog 5633 18 0.003195455 0.02688031
2 clinvar_path_likelypath 2609 9 0.003449598 0.11754157
3 mgi_essential 2146 7 0.003261883 0.16907145
4 core_essentials_hart 255 0 0.000000000 1.00000000
5 fda_approved_drug_targets 323 0 0.000000000 1.00000000
Skin
Number of cTWAS Genes in Tissue Group: 14
gene_set nset ngenes percent padj
1 gwascatalog 5105 9 0.001762977 0.1368260
2 mgi_essential 1921 3 0.001561687 0.4783253
3 fda_approved_drug_targets 276 1 0.003623188 0.4783253
4 clinvar_path_likelypath 2341 3 0.001281504 0.5087902
5 core_essentials_hart 227 0 0.000000000 1.0000000
Blood or Immune
Number of cTWAS Genes in Tissue Group: 26
gene_set nset ngenes percent padj
1 gwascatalog 4761 15 0.003150599 0.09062423
2 mgi_essential 1773 4 0.002256063 1.00000000
3 core_essentials_hart 216 0 0.000000000 1.00000000
4 clinvar_path_likelypath 2189 4 0.001827318 1.00000000
5 fda_approved_drug_targets 255 0 0.000000000 1.00000000
Digestive
Number of cTWAS Genes in Tissue Group: 27
gene_set nset ngenes percent padj
1 gwascatalog 5397 16 0.002964610 0.05003522
2 mgi_essential 2053 6 0.002922552 0.36990626
3 clinvar_path_likelypath 2491 5 0.002007226 0.76840982
4 core_essentials_hart 243 0 0.000000000 1.00000000
5 fda_approved_drug_targets 308 0 0.000000000 1.00000000Analysis of TWAS False Positives by Region
library(ggplot2)

pip_threshold <- 0.5

df_plot <- data.frame(Outcome=c("SNPs", "Genes", "Both", "Neither"), Frequency=rep(0,4))

for (i in 1:length(df)){
  gene_pips <- df[[i]]$gene_pips[df[[i]]$gene_pips$genename %in% df[[i]]$twas,,drop=F]
  gene_pips <- gene_pips[gene_pips$susie_pip < pip_threshold,,drop=F]

  region_pips <- df[[i]]$region_pips
  rownames(region_pips) <- region_pips$region

  gene_pips <- cbind(gene_pips, t(sapply(gene_pips$region_tag, function(x){unlist(region_pips[x,c("gene_pip", "snp_pip")])})))
  gene_pips$gene_pip <- gene_pips$gene_pip - gene_pips$susie_pip #subtract gene pip from region total to get combined pip for other genes in region

  df_plot$Frequency[df_plot$Outcome=="Neither"] <- df_plot$Frequency[df_plot$Outcome=="Neither"] + sum(gene_pips$gene_pip < 0.5 & gene_pips$snp_pip < 0.5)
  df_plot$Frequency[df_plot$Outcome=="Both"] <- df_plot$Frequency[df_plot$Outcome=="Both"] + sum(gene_pips$gene_pip > 0.5 & gene_pips$snp_pip > 0.5)
  df_plot$Frequency[df_plot$Outcome=="SNPs"] <- df_plot$Frequency[df_plot$Outcome=="SNPs"] + sum(gene_pips$gene_pip < 0.5 & gene_pips$snp_pip > 0.5)
  df_plot$Frequency[df_plot$Outcome=="Genes"] <- df_plot$Frequency[df_plot$Outcome=="Genes"] + sum(gene_pips$gene_pip > 0.5 & gene_pips$snp_pip < 0.5)
}

pie <- ggplot(df_plot, aes(x="", y=Frequency, fill=Outcome)) + geom_bar(width = 1, stat = "identity")
pie <- pie + coord_polar("y", start=0) + theme_minimal() + theme(axis.title.y=element_blank())
pie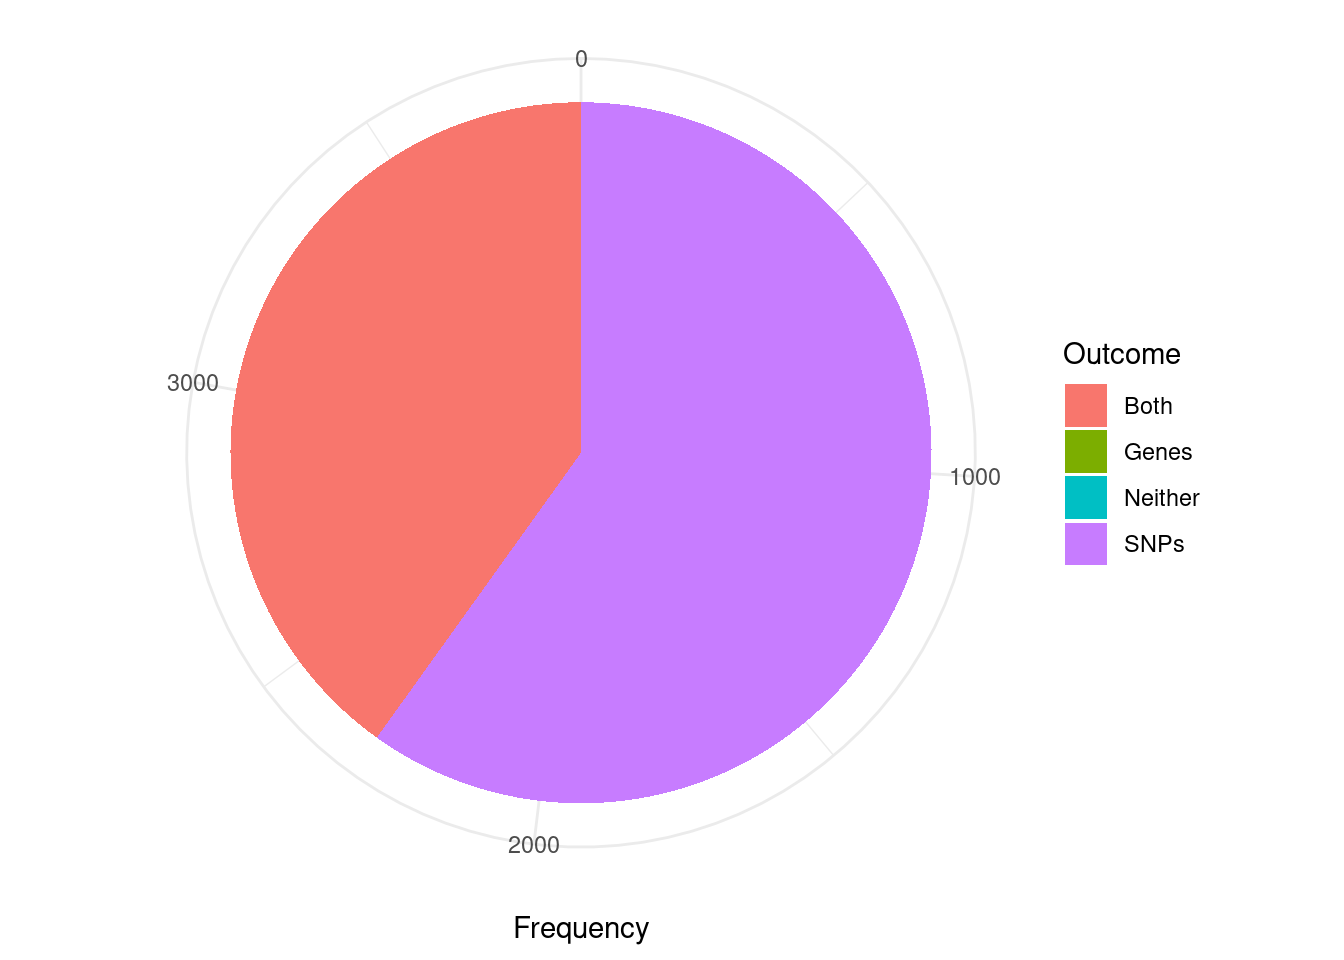
| Version | Author | Date |
|---|---|---|
| 0136d2e | wesleycrouse | 2022-06-10 |
Analysis of TWAS False Positives by Credible Set
cTWAS is using susie settings that mask credible sets consisting of variables with minimum pairwise correlations below a specified threshold. The default threshold is 0.5. I think this is intended to mask credible sets with “diffuse” support. As a consequence, many of the genes considered here (TWAS false positives; significant z score but low PIP) are not assigned to a credible set (have cs_index=0). For this reason, the first figure is not really appropriate for answering the question “are TWAS false positives due to SNPs or genes”.
The second figure includes only TWAS genes that are assigned to a reported causal set (i.e. they are in a “pure” causal set with high pairwise correlations). I think that this figure is closer to the intended analysis. However, it may be biased in some way because we have excluded many TWAS false positive genes that are in “impure” credible sets.
Some alternatives to these figures include the region-based analysis in the previous section; or re-analysis with lower/no minimum pairwise correlation threshold (“min_abs_corr” option in susie_get_cs) for reporting credible sets.
library(ggplot2)

####################
#using only genes assigned to a credible set

pip_threshold <- 0.5

df_plot <- data.frame(Outcome=c("SNPs", "Genes", "Both", "Neither"), Frequency=rep(0,4))

for (i in 1:length(df)){
  gene_pips <- df[[i]]$gene_pips[df[[i]]$gene_pips$genename %in% df[[i]]$twas,,drop=F]
  gene_pips <- gene_pips[gene_pips$susie_pip < pip_threshold,,drop=F]

  #exclude genes that are not assigned to a credible set, cs_index==0
  gene_pips <- gene_pips[as.numeric(sapply(gene_pips$region_cs_tag, function(x){rev(unlist(strsplit(x, "_")))[1]}))!=0,]

  region_cs_pips <- df[[i]]$region_cs_pips
  rownames(region_cs_pips) <- region_cs_pips$region_cs

  gene_pips <- cbind(gene_pips, t(sapply(gene_pips$region_cs_tag, function(x){unlist(region_cs_pips[x,c("gene_pip", "snp_pip")])})))
  gene_pips$gene_pip <- gene_pips$gene_pip - gene_pips$susie_pip #subtract gene pip from causal set total to get combined pip for other genes in causal set

  plot_cutoff <- 0.5

  df_plot$Frequency[df_plot$Outcome=="Neither"] <- df_plot$Frequency[df_plot$Outcome=="Neither"] + sum(gene_pips$gene_pip < plot_cutoff & gene_pips$snp_pip < plot_cutoff)
  df_plot$Frequency[df_plot$Outcome=="Both"] <- df_plot$Frequency[df_plot$Outcome=="Both"] + sum(gene_pips$gene_pip > plot_cutoff & gene_pips$snp_pip > plot_cutoff)
  df_plot$Frequency[df_plot$Outcome=="SNPs"] <- df_plot$Frequency[df_plot$Outcome=="SNPs"] + sum(gene_pips$gene_pip < plot_cutoff & gene_pips$snp_pip > plot_cutoff)
  df_plot$Frequency[df_plot$Outcome=="Genes"] <- df_plot$Frequency[df_plot$Outcome=="Genes"] + sum(gene_pips$gene_pip > plot_cutoff & gene_pips$snp_pip < plot_cutoff)
}

pie <- ggplot(df_plot, aes(x="", y=Frequency, fill=Outcome)) + geom_bar(width = 1, stat = "identity")
pie <- pie + coord_polar("y", start=0) + theme_minimal() + theme(axis.title.y=element_blank())
pie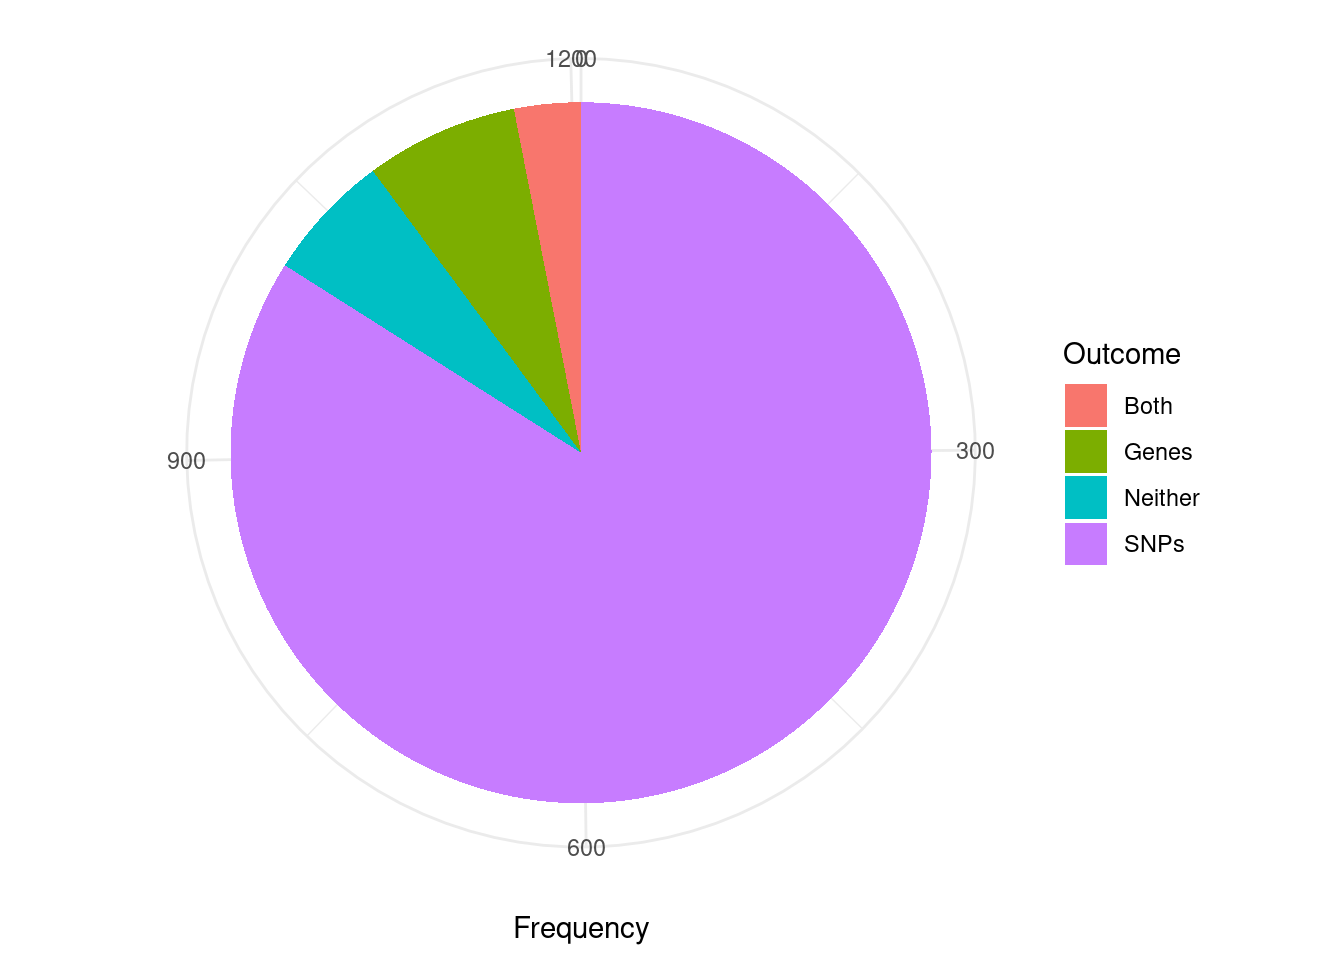
| Version | Author | Date |
|---|---|---|
| 0136d2e | wesleycrouse | 2022-06-10 |
cTWAS genes without genome-wide significant SNP nearby
novel_genes <- data.frame(genename=as.character(), weight=as.character(), susie_pip=as.numeric(), snp_maxz=as.numeric())

for (i in 1:length(df)){
  gene_pips <- df[[i]]$gene_pips[df[[i]]$gene_pips$genename %in% df[[i]]$ctwas,,drop=F]

  region_pips <- df[[i]]$region_pips
  rownames(region_pips) <- region_pips$region

  gene_pips <- cbind(gene_pips, sapply(gene_pips$region_tag, function(x){region_pips[x,"snp_maxz"]}))
  names(gene_pips)[ncol(gene_pips)] <- "snp_maxz"

  if (nrow(gene_pips)>0){
    gene_pips$weight <- names(df)[i]
    gene_pips <- gene_pips[gene_pips$snp_maxz < qnorm(1-(5E-8/2), lower=T),c("genename", "weight", "susie_pip", "snp_maxz")]

    novel_genes <- rbind(novel_genes, gene_pips)
  }
}

novel_genes_summary <- data.frame(genename=unique(novel_genes$genename))
novel_genes_summary$nweights <- sapply(novel_genes_summary$genename, function(x){length(novel_genes$weight[novel_genes$genename==x])})
novel_genes_summary$weights <- sapply(novel_genes_summary$genename, function(x){paste(novel_genes$weight[novel_genes$genename==x],collapse=", ")})

novel_genes_summary <- novel_genes_summary[order(-novel_genes_summary$nweights),]
novel_genes_summary[,c("genename","nweights")]
genename nweights
1 EVA1B 31
2 OAZ3 9
7 CPT1C 6
13 RGS14 4
16 GIGYF1 4
12 C11orf58 3
15 POLR3H 3
6 BCL2L11 2
9 APBB1 2
11 SH3D21 2
17 RBCK1 2
25 CNKSR1 2
3 CH25H 1
4 M6PR 1
5 VAMP3 1
8 IP6K2 1
10 FBXO45 1
14 FOS 1
18 SPIRE2 1
19 ADCY9 1
20 ANKLE2 1
21 ITGAV 1
22 MUC3A 1
23 TSC2 1
24 DEF8 1
26 ANKRD55 1
27 STXBP3 1
28 SPNS2 1
29 COQ8B 1
30 SMPD1 1
31 TNFSF4 1
32 BIN1 1
33 FAM171B 1
34 TIMD4 1
35 QKI 1
36 FAM53B 1
37 CAMKK1 1
38 CDK5R1 1
39 RPS6KB1 1
40 PPP5C 1Tissue-specificity for cTWAS genes
gene_pips_by_weight <- data.frame(genename=as.character(ctwas_genes))

for (i in 1:length(df)){
  gene_pips <- df[[i]]$gene_pips
  gene_pips <- gene_pips[match(ctwas_genes, gene_pips$genename),,drop=F]

  gene_pips_by_weight <- cbind(gene_pips_by_weight, gene_pips$susie_pip)
  names(gene_pips_by_weight)[ncol(gene_pips_by_weight)] <- names(df)[i]
}

gene_pips_by_weight <- as.matrix(gene_pips_by_weight[,-1])
rownames(gene_pips_by_weight) <- ctwas_genes

#handing missing values
gene_pips_by_weight_bkup <- gene_pips_by_weight
gene_pips_by_weight[is.na(gene_pips_by_weight)] <- 0

#number of tissues with PIP>0.5 for cTWAS genes
ctwas_frequency <- rowSums(gene_pips_by_weight>0.5)
hist(ctwas_frequency, col="grey", breaks=0:max(ctwas_frequency), xlim=c(0,ncol(gene_pips_by_weight)),
     xlab="Number of Tissues with PIP>0.5",
     ylab="Number of cTWAS Genes",
     main="Tissue Specificity for cTWAS Genes")
| Version | Author | Date |
|---|---|---|
| 0136d2e | wesleycrouse | 2022-06-10 |
#heatmap of gene PIPs
cluster_ctwas_genes <- hclust(dist(gene_pips_by_weight))
cluster_ctwas_weights <- hclust(dist(t(gene_pips_by_weight)))

plot(cluster_ctwas_weights, cex=0.6)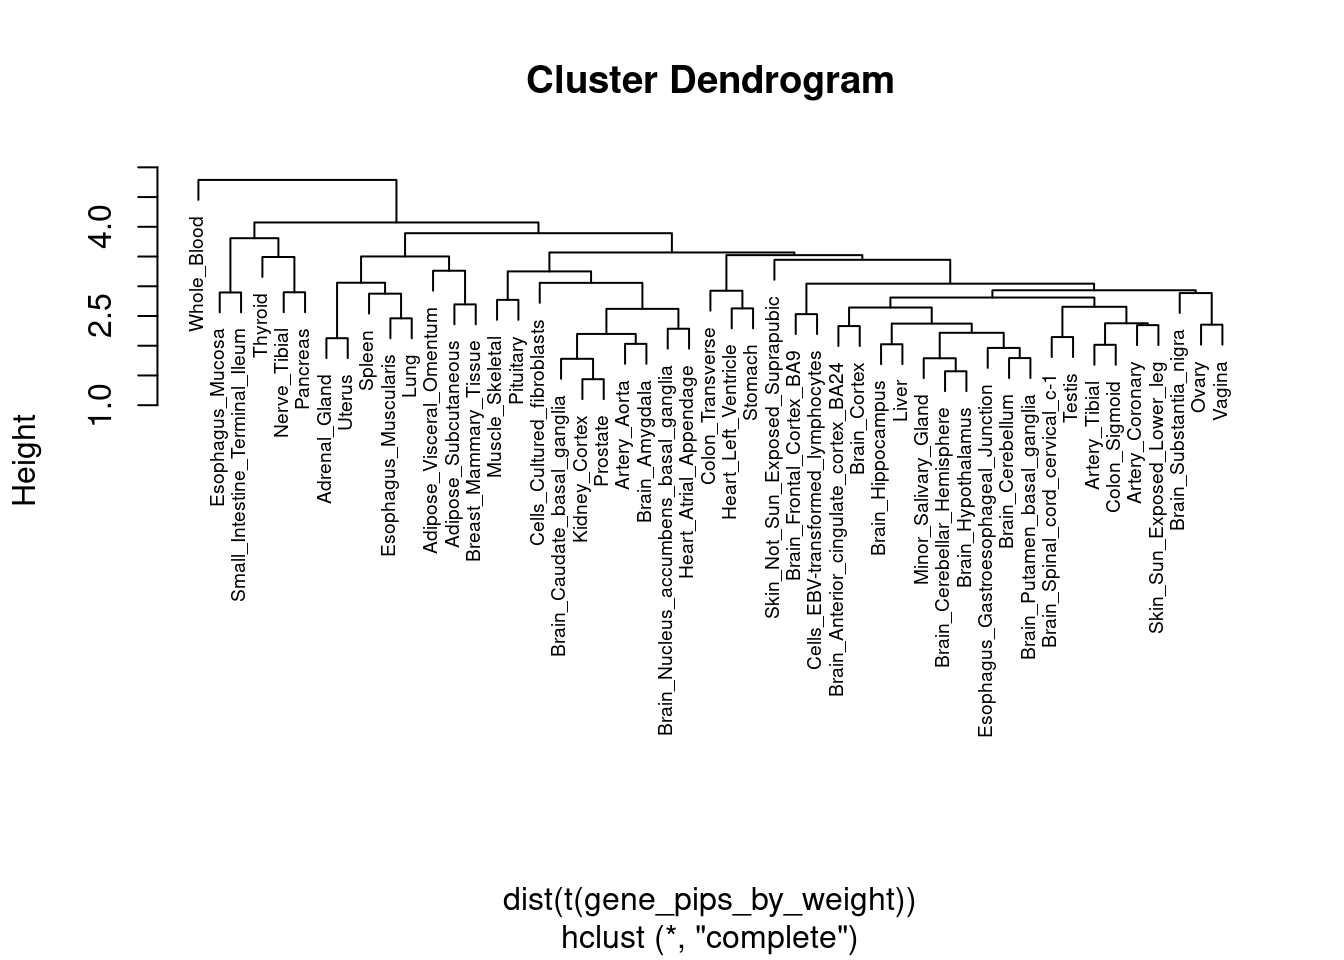
| Version | Author | Date |
|---|---|---|
| 0136d2e | wesleycrouse | 2022-06-10 |
plot(cluster_ctwas_genes, cex=0.6, labels=F)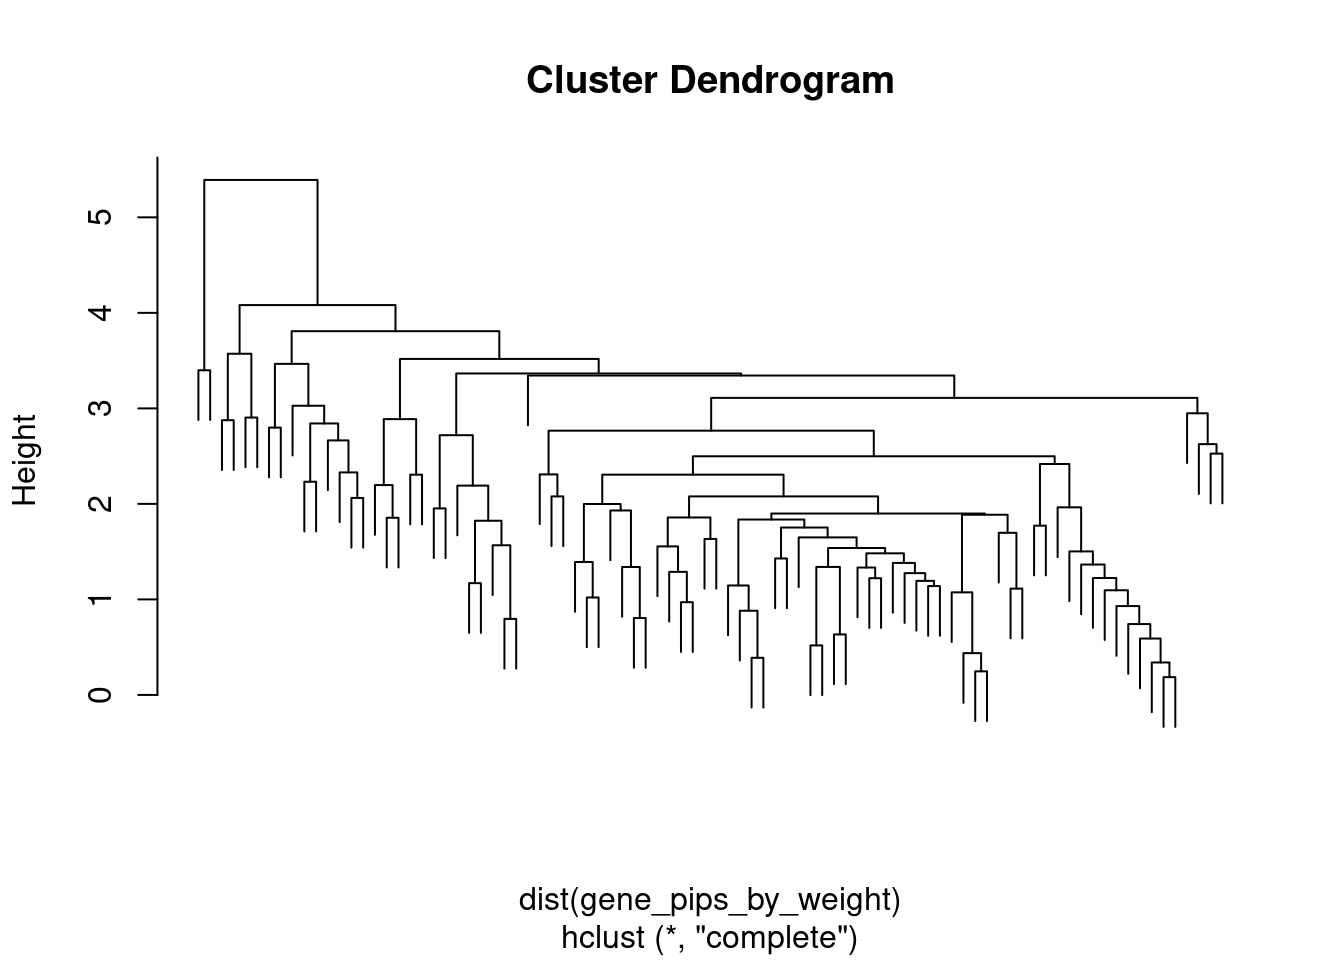
| Version | Author | Date |
|---|---|---|
| 0136d2e | wesleycrouse | 2022-06-10 |
par(mar=c(14.1, 4.1, 4.1, 2.1))

image(t(gene_pips_by_weight[rev(cluster_ctwas_genes$order),rev(cluster_ctwas_weights$order)]),
      axes=F)
mtext(text=colnames(gene_pips_by_weight)[cluster_ctwas_weights$order], side=1, line=0.3, at=seq(0,1,1/(ncol(gene_pips_by_weight)-1)), las=2, cex=0.8)
mtext(text=rownames(gene_pips_by_weight)[cluster_ctwas_genes$order], side=2, line=0.3, at=seq(0,1,1/(nrow(gene_pips_by_weight)-1)), las=1, cex=0.4)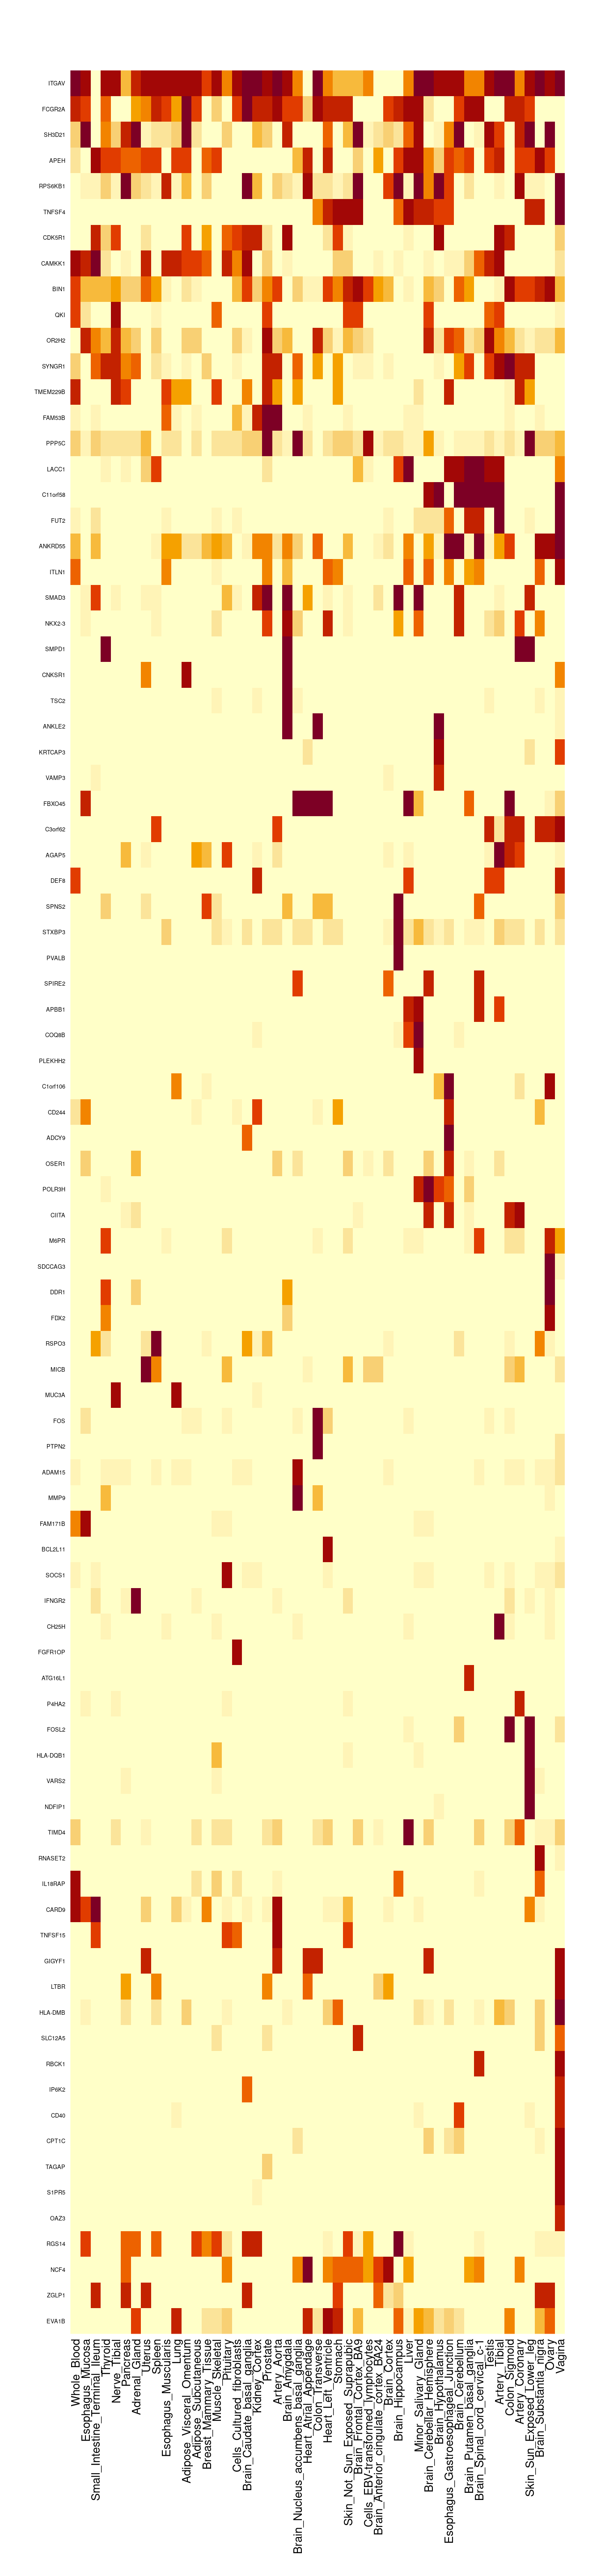
| Version | Author | Date |
|---|---|---|
| 0136d2e | wesleycrouse | 2022-06-10 |
cTWAS genes with highest proportion of total PIP on a single tissue
#genes with highest proportion of PIP on a single tissue
gene_pips_proportion <- gene_pips_by_weight/rowSums(gene_pips_by_weight)

proportion_table <- data.frame(genename=as.character(rownames(gene_pips_proportion)))
proportion_table$max_pip_prop <- apply(gene_pips_proportion,1,max)
proportion_table$max_weight <- colnames(gene_pips_proportion)[apply(gene_pips_proportion,1,which.max)]

proportion_table[order(-proportion_table$max_pip_prop),]
genename max_pip_prop max_weight
32 KRTCAP3 0.98281731 Brain_Hippocampus
60 RSPO3 0.92083279 Muscle_Skeletal
48 PVALB 0.76225004 Colon_Transverse
78 TNFSF4 0.74354016 Whole_Blood
42 PTPN2 0.74347630 Cells_Cultured_fibroblasts
87 RPS6KB1 0.63749279 Whole_Blood
74 NKX2-3 0.59653535 Thyroid
76 SMAD3 0.56337027 Thyroid
52 ADCY9 0.54724438 Esophagus_Mucosa
55 ANKLE2 0.49437213 Esophagus_Muscularis
69 ANKRD55 0.48435375 Small_Intestine_Terminal_Ileum
12 SDCCAG3 0.48188686 Adipose_Visceral_Omentum
57 AGAP5 0.44494994 Heart_Atrial_Appendage
51 C1orf106 0.41123197 Esophagus_Mucosa
67 P4HA2 0.40238124 Skin_Not_Sun_Exposed_Suprapubic
70 OR2H2 0.40161561 Whole_Blood
15 VAMP3 0.39918151 Adrenal_Gland
72 SPNS2 0.39572743 Stomach
26 FBXO45 0.38625845 Artery_Tibial
5 FGFR1OP 0.37937743 Adipose_Subcutaneous
82 QKI 0.37650718 Whole_Blood
63 TSC2 0.37356222 Nerve_Tibial
86 CDK5R1 0.37244140 Whole_Blood
50 CD244 0.35191982 Esophagus_Mucosa
46 SPIRE2 0.34275373 Colon_Transverse
75 SMPD1 0.33719933 Thyroid
7 CH25H 0.33476520 Adipose_Subcutaneous
85 CAMKK1 0.33448274 Whole_Blood
23 SYNGR1 0.33332582 Artery_Aorta
59 MICB 0.32479388 Muscle_Skeletal
79 BIN1 0.30551372 Whole_Blood
25 APBB1 0.30098879 Artery_Coronary
49 FOSL2 0.29604384 Skin_Not_Sun_Exposed_Suprapubic
3 ATG16L1 0.28603634 Adipose_Subcutaneous
64 DEF8 0.27813180 Ovary
14 FDX2 0.27311567 Adipose_Visceral_Omentum
71 STXBP3 0.26748514 Stomach
61 MUC3A 0.26725023 Muscle_Skeletal
77 FUT2 0.26481491 Vagina
37 CIITA 0.25729779 Breast_Mammary_Tissue
65 CNKSR1 0.25533790 Thyroid
36 FOS 0.25524388 Breast_Mammary_Tissue
62 HLA-DQB1 0.25500418 Skin_Not_Sun_Exposed_Suprapubic
58 C3orf62 0.23241407 Liver
13 M6PR 0.21943395 Adipose_Visceral_Omentum
8 DDR1 0.21062307 Adipose_Visceral_Omentum
73 COQ8B 0.20612511 Testis
83 FAM53B 0.20489205 Whole_Blood
43 MMP9 0.20471845 Cells_Cultured_fibroblasts
31 LACC1 0.19931663 Brain_Frontal_Cortex_BA9
33 PLEKHH2 0.19326496 Brain_Spinal_cord_cervical_c-1
38 POLR3H 0.18449206 Nerve_Tibial
84 TMEM229B 0.18426076 Whole_Blood
80 FAM171B 0.17004131 Whole_Blood
88 PPP5C 0.16974070 Whole_Blood
54 OSER1 0.16964425 Esophagus_Mucosa
66 ITLN1 0.16068986 Pituitary
39 ADAM15 0.15664154 Cells_Cultured_fibroblasts
17 BCL2L11 0.15034243 Adrenal_Gland
16 IL18RAP 0.15017175 Adrenal_Gland
30 LTBR 0.14845398 Brain_Frontal_Cortex_BA9
29 C11orf58 0.13424901 Brain_Substantia_nigra
53 SOCS1 0.13194102 Whole_Blood
68 VARS2 0.12269987 Skin_Not_Sun_Exposed_Suprapubic
24 IP6K2 0.12216610 Artery_Coronary
47 IFNGR2 0.12078173 Colon_Transverse
6 CARD9 0.11871104 Lung
34 FCGR2A 0.11190822 Brain_Substantia_nigra
28 SH3D21 0.10536577 Heart_Left_Ventricle
11 TNFSF15 0.10358712 Esophagus_Muscularis
41 NDFIP1 0.10278673 Cells_Cultured_fibroblasts
81 TIMD4 0.10276527 Whole_Blood
40 APEH 0.09851069 Cells_Cultured_fibroblasts
56 ITGAV 0.09083013 Heart_Atrial_Appendage
20 S1PR5 0.08427061 Whole_Blood
9 HLA-DMB 0.08421996 Vagina
44 GIGYF1 0.07949852 Thyroid
4 TAGAP 0.07603878 Adrenal_Gland
18 CPT1C 0.07029846 Brain_Substantia_nigra
19 SLC12A5 0.06731308 Pancreas
2 OAZ3 0.06256534 Muscle_Skeletal
10 RNASET2 0.06255830 Adipose_Visceral_Omentum
45 RBCK1 0.05831608 Uterus
22 NCF4 0.05343433 Esophagus_Mucosa
21 CD40 0.04728549 Pancreas
35 RGS14 0.04311284 Muscle_Skeletal
27 ZGLP1 0.03820756 Brain_Cortex
1 EVA1B 0.02812661 Whole_Bloodsave.image("workspace4.RData")Genes nearby and nearest to GWAS peaks
#####load positions for all genes on autosomes in ENSEMBL, subset to only protein coding and lncRNA with non-missing HGNC symbol
library(biomaRt)

ensembl <- useEnsembl(biomart="ENSEMBL_MART_ENSEMBL", dataset="hsapiens_gene_ensembl")
G_list <- getBM(filters= "chromosome_name", attributes= c("hgnc_symbol","chromosome_name","start_position","end_position","gene_biotype", "ensembl_gene_id"), values=1:22, mart=ensembl)

save(G_list, file=paste0("G_list_", trait_id, ".RData"))
load(paste0("G_list_", trait_id, ".RData"))

G_list <- G_list[G_list$gene_biotype %in% c("protein_coding"),]
G_list$hgnc_symbol[G_list$hgnc_symbol==""] <- "-"

#####load z scores from the analysis and add positions from the LD reference
# results_dir <- results_dirs[1]
# load(paste0(results_dir, "/", analysis_id, "_expr_z_snp.Rd"))
#
# LDR_dir <- "/project2/mstephens/wcrouse/UKB_LDR_0.1/"
# LDR_files <- list.files(LDR_dir)
# LDR_files <- LDR_files[grep(".Rvar" ,LDR_files)]
#
# z_snp$chrom <- as.integer(NA)
# z_snp$pos <- as.integer(NA)
#
# for (i in 1:length(LDR_files)){
#   print(i)
#
#   LDR_info <- read.table(paste0(LDR_dir, LDR_files[i]), header=T)
#   z_snp_index <- which(z_snp$id %in% LDR_info$id)
#   z_snp[z_snp_index,c("chrom", "pos")] <- t(sapply(z_snp_index, function(x){unlist(LDR_info[match(z_snp$id[x], LDR_info$id),c("chrom", "pos")])}))
# }
#
# z_snp <- z_snp[,c("id", "z", "chrom","pos")]
# save(z_snp, file=paste0("z_snp_pos_", trait_id, ".RData"))
load(paste0("z_snp_pos_", trait_id, ".RData"))

####################
#identify genes within 500kb of genome-wide significant variant ("nearby")
G_list$nearby <- NA

window_size <- 500000

for (chr in 1:22){
  #index genes on chromosome
  G_list_index <- which(G_list$chromosome_name==chr)

  #subset z_snp to chromosome, then subset to significant genome-wide significant variants
  z_snp_chr <- z_snp[z_snp$chrom==chr,,drop=F]
  z_snp_chr <- z_snp_chr[abs(z_snp_chr$z)>qnorm(1-(5E-8/2), lower=T),,drop=F]

  #iterate over genes on chromsome and check if a genome-wide significant SNP is within the window
  for (i in G_list_index){
    window_start <- G_list$start_position[i] - window_size
    window_end <- G_list$end_position[i] + window_size
    G_list$nearby[i] <- any(z_snp_chr$pos>=window_start & z_snp_chr$pos<=window_end)
  }
}

####################
#identify genes that are nearest to lead genome-wide significant variant ("nearest")
G_list$nearest <- F
G_list$distance <- Inf
G_list$which_nearest <- NA

window_size <- 500000

n_peaks <- 0

for (chr in 1:22){
  #index genes on chromosome
  G_list_index <- which(G_list$chromosome_name==chr & G_list$gene_biotype=="protein_coding")

  #subset z_snp to chromosome, then subset to significant genome-wide significant variants
  z_snp_chr <- z_snp[z_snp$chrom==chr,,drop=F]
  z_snp_chr <- z_snp_chr[abs(z_snp_chr$z)>qnorm(1-(5E-8/2), lower=T),,drop=F]

  while (nrow(z_snp_chr)>0){
    n_peaks <- n_peaks + 1

    lead_index <- which.max(abs(z_snp_chr$z))
    lead_position <- z_snp_chr$pos[lead_index]

    distances <- sapply(G_list_index, function(i){
      if (lead_position >= G_list$start_position[i] & lead_position <= G_list$end_position[i]){
        distance <- 0
      } else {
        distance <- min(abs(G_list$start_position[i] - lead_position), abs(G_list$end_position[i] - lead_position))
      }
      distance
    })

    min_distance <- min(distances)

    G_list$nearest[G_list_index[distances==min_distance]] <- T

    nearest_genes <- paste0(G_list$hgnc_symbol[G_list_index[distances==min_distance]], collapse=", ")

    update_index <- which(G_list$distance[G_list_index] > distances)
    G_list$distance[G_list_index][update_index] <- distances[update_index]
    G_list$which_nearest[G_list_index][update_index] <- nearest_genes

    window_start <- lead_position - window_size
    window_end <- lead_position + window_size
    z_snp_chr <- z_snp_chr[!(z_snp_chr$pos>=window_start & z_snp_chr$pos<=window_end),,drop=F]
  }
}

G_list$distance[G_list$distance==Inf] <- NA

#report number of GWAS peaks
sum(n_peaks)
[1] 102Enrichment analysis using known IBD genes from ABC paper
known_genes <- data.table::fread("nasser_2021_ABC_IBD_genes.txt")
known_genes <- unique(known_genes$KnownGene)

# dbs <- c("GO_Biological_Process_2021")
# GO_enrichment <- enrichr(known_genes, dbs)
#
# for (db in dbs){
#   cat(paste0(db, "\n\n"))
#   enrich_results <- GO_enrichment[[db]]
#   enrich_results <- enrich_results[enrich_results$Adjusted.P.value<0.05,c("Term", "Overlap", "Adjusted.P.value", "Genes")]
#   print(enrich_results)
#   print(plotEnrich(GO_enrichment[[db]]))
# }
#
# save(enrich_results, file="ABC_IBD_genes_enrichment.RData")
# write.csv(enrich_results, file="ABC_IBD_genes_enrichment.csv")

enrich_results <- as.data.frame(data.table::fread("ABC_IBD_genes_enrichment.csv"))

#report number of known IBD genes in annotations
length(known_genes)
[1] 26Summary table for selected tissue groups
#mapping genename to ensembl
genename_mapping <- data.frame(genename=as.character(), ensembl_id=as.character(), weight=as.character())

for (i in 1:length(results_dirs)){
  results_dir <- results_dirs[i]
  weight <- rev(unlist(strsplit(results_dir, "/")))[1]
  analysis_id <- paste(trait_id, weight, sep="_")

  sqlite <- RSQLite::dbDriver("SQLite")
  db = RSQLite::dbConnect(sqlite, paste0("/project2/mstephens/wcrouse/predictdb_nolnc/mashr_", weight, ".db"))
  query <- function(...) RSQLite::dbGetQuery(db, ...)
  gene_info <- query("select gene, genename, gene_type from extra")
  RSQLite::dbDisconnect(db)

  genename_mapping <- rbind(genename_mapping, cbind(gene_info[,c("gene","genename")],weight))
}

genename_mapping <- genename_mapping[,c("gene","genename"),drop=F]
genename_mapping <- genename_mapping[!duplicated(genename_mapping),]
selected_groups <- c("Blood or Immune", "Digestive")
selected_genes <- unique(unlist(sapply(df_group[selected_groups], function(x){x$ctwas})))
weight_groups <- weight_groups[order(weight_groups$group),]
selected_weights <- weight_groups$weight[weight_groups$group %in% selected_groups]
gene_pips_by_weight <- gene_pips_by_weight_bkup
results_table <- as.data.frame(round(gene_pips_by_weight[selected_genes,selected_weights],3))
results_table$n_discovered <- apply(results_table>0.8,1,sum,na.rm=T)
results_table$n_imputed <- apply(results_table, 1, function(x){sum(!is.na(x))-1})
results_table$ensembl_gene_id <- genename_mapping$gene[sapply(rownames(results_table), match, table=genename_mapping$genename)]
results_table$ensembl_gene_id <- sapply(results_table$ensembl_gene_id, function(x){unlist(strsplit(x, "[.]"))[1]})
results_table <- cbind(results_table, G_list[sapply(results_table$ensembl_gene_id, match, table=G_list$ensembl_gene_id),c("chromosome_name","start_position","end_position","nearby","nearest","distance","which_nearest")])
results_table$known <- rownames(results_table) %in% known_genes
load("group_enrichment_results.RData")
group_enrichment_results$group <- as.character(group_enrichment_results$group)
group_enrichment_results$db <- as.character(group_enrichment_results$db)
group_enrichment_results <- group_enrichment_results[group_enrichment_results$group %in% selected_groups,,drop=F]
results_table$enriched_terms <- sapply(rownames(results_table), function(x){paste(group_enrichment_results$Term[grep(x, group_enrichment_results$Genes)],collapse="; ")})
write.csv(results_table, file=paste0("summary_table_crohns_nolnc.csv"))Overlap of enrichment analysis
#collect GO terms for selected genes
db <- "GO_Biological_Process_2021"
GO_enrichment <- enrichr(selected_genes, db)
Uploading data to Enrichr... Done.
Querying GO_Biological_Process_2021... Done.
Parsing results... Done.enrich_results_selected_genes <- GO_enrichment[[db]]
load("ABC_IBD_genes_enrichment.RData")
enrich_results_known_genes <- enrich_results
overlap_table <- as.data.frame(matrix(F, nrow(enrich_results_known_genes), length(selected_genes)))
overlap_table <- cbind(enrich_results_known_genes$Term, overlap_table)
colnames(overlap_table) <- c("Term", selected_genes)
for (i in 1:nrow(overlap_table)){
Term <- overlap_table$Term[i]
if (Term %in% enrich_results_selected_genes$Term){
Term_genes <- enrich_results_selected_genes$Genes[enrich_results_selected_genes$Term==Term]
overlap_table[i, unlist(strsplit(Term_genes, ";"))] <- T
}
}
write.csv(overlap_table, file="GO_overlap_crohns_nolnc.csv")Results and figures for the paper
Gene expression explains a small proportion of heritability
Note that the published MESC results in Yao et al. analyzed the same traits from Finucane 2015, which used ulcerative colitis summary statistics from Jostin’s 2012. We used more recent results from de Lange 2017. MESC also used prediction models from GTEx v7 while we used prediction models from GTEx v8.
Trend lines are fit with (red) and without (blue) an intercept.
library(ggrepel)

mesc_results <- as.data.frame(readxl::read_xlsx("MESC_published_results.xlsx", sheet="Table S4", skip=1))
mesc_results <- mesc_results[mesc_results$Trait %in% "Ulcerative Colitis",]
rownames(mesc_results) <- mesc_results$`Expression score tissue`
mesc_results <- mesc_results[sapply(selected_weights, function(x){paste(unlist(strsplit(x,"_")),collapse=" ")}),]


output$pve_med <- output$pve_g / (output$pve_g + output$pve_s)
rownames(output) <- output$weight
df_plot <- output[selected_weights,]

df_plot <- data.frame(tissue=as.character(mesc_results$`Expression score tissue`),  mesc=as.numeric(mesc_results$`h2med/h2g`), ctwas=(df_plot$pve_med))

p <- ggplot(df_plot, aes(mesc, ctwas, label = tissue)) + geom_point(color = "blue", size=3)
p <- p + geom_text_repel() + labs(title = "Heritability Explained by Gene Expression in Tissues") + ylab("(Gene PVE) / (Total PVE) using cTWAS") + xlab("(h2med) / (h2g) using MESC")
p <- p + geom_abline(slope=1, intercept=0, linetype=3)
p <- p + xlim(0,0.2) + ylim(0,0.2)

fit <- lm(ctwas~0+mesc, data=df_plot)
p <- p + geom_abline(slope=summary(fit)$coefficients["mesc","Estimate"], intercept=0, linetype=2, color="blue")

fit <- lm(ctwas~mesc, data=df_plot)
p <- p + geom_abline(slope=summary(fit)$coefficients["mesc","Estimate"], intercept=summary(fit)$coefficients["(Intercept)","Estimate"], linetype=3, color="red")

p <- p + theme_bw()

p

#report correlation between cTWAS and MESC
cor(df_plot$mesc, df_plot$ctwas)
cTWAS finds fewer genes than TWAS
Trend lines are fit with (red) and without (blue) an intercept.
library(ggrepel)

df_plot <- output
#df_plot <- df_plot[selected_weights,,drop=F]
df_plot$tissue <- sapply(df_plot$weight, function(x){paste(unlist(strsplit(x,"_")),collapse=" ")})

p <- ggplot(df_plot, aes(n_twas, n_ctwas, label = tissue)) + geom_point(color = "blue", size=3)
p <- p + geom_text_repel(size=3) + labs(title = "Number of Genes Discovered using cTWAS and TWAS by Tissue") + ylab("Number of cTWAS genes") + xlab("Number of TWAS genes")
p <- p + scale_y_continuous(breaks=seq(0,max(df_plot$n_ctwas),2))
p <- p + scale_x_continuous(breaks=seq(0,max(df_plot$n_twas),5))
p <- p + theme_bw()

fit <- lm(n_ctwas~0+n_twas, data=df_plot)
p <- p + geom_abline(slope=summary(fit)$coefficients["n_twas","Estimate"], intercept=0, linetype=2, color="blue")

p
Warning: ggrepel: 4 unlabeled data points (too many overlaps). Consider increasing max.overlaps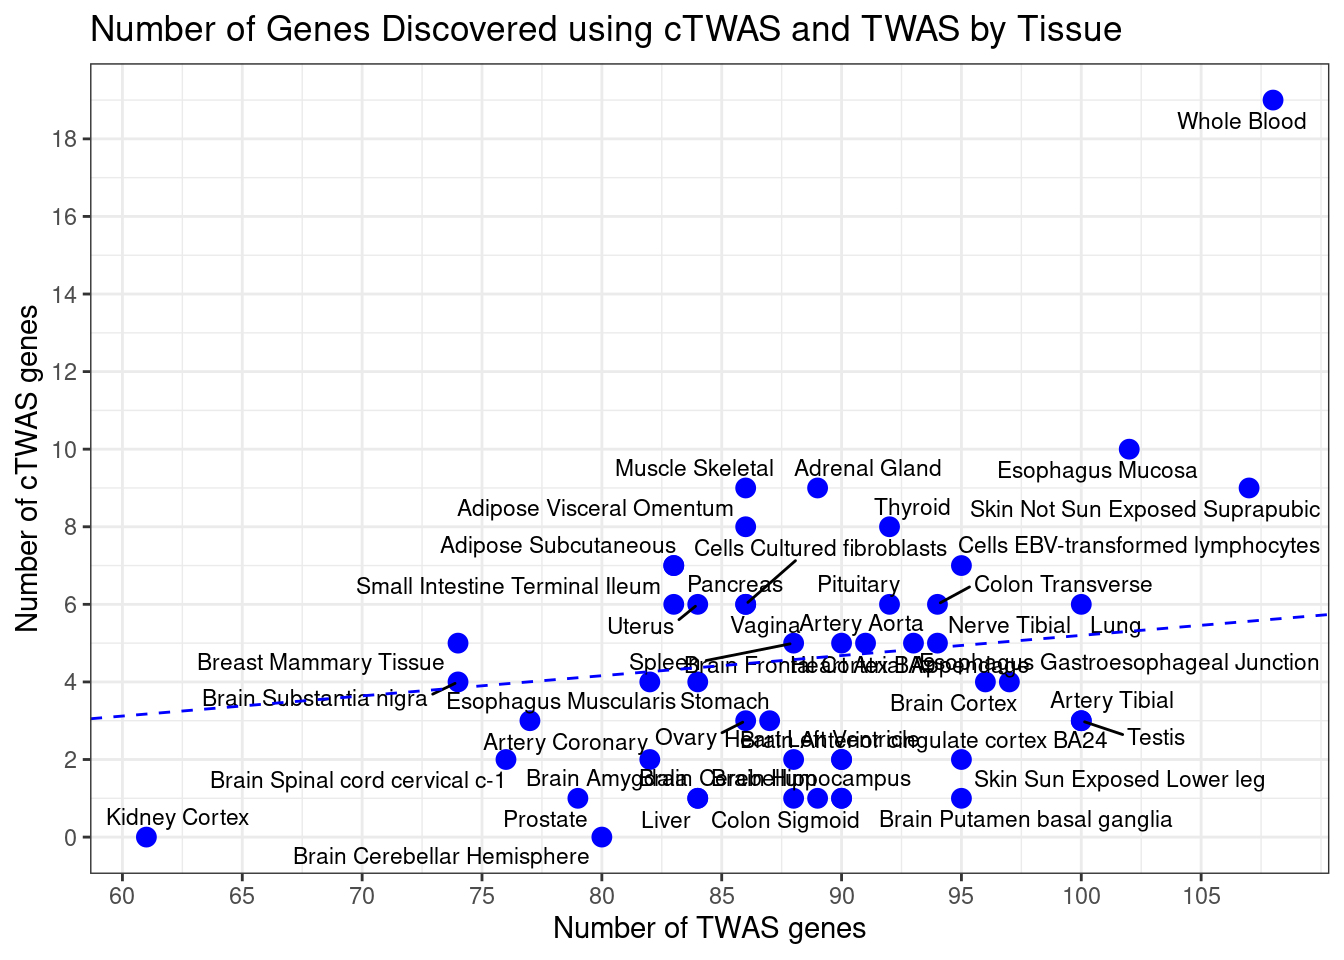
#report correlation between cTWAS and TWAS
cor(df_plot$n_ctwas, df_plot$n_twas)
[1] 0.4571549####################
#using cutpoint for number of ctwas and twas genes to determine which tissues to label
df_plot <- output
df_plot$tissue <- sapply(df_plot$weight, function(x){paste(unlist(strsplit(x,"_")),collapse=" ")})
df_plot$tissue[df_plot$n_ctwas < 7.5 & df_plot$n_twas < 115] <- ""
p <- ggplot(df_plot, aes(n_twas, n_ctwas, label = tissue)) + geom_point(color = "blue", size=3)
p <- p + geom_text_repel(size=3) + labs(title = "Number of Genes Discovered using cTWAS and TWAS by Tissue") + ylab("Number of cTWAS genes") + xlab("Number of TWAS genes")
p <- p + scale_y_continuous(breaks=seq(0,max(df_plot$n_ctwas),2))
p <- p + scale_x_continuous(breaks=seq(0,max(df_plot$n_twas),5))
p <- p + theme_bw()
fit <- lm(n_ctwas~0+n_twas, data=df_plot)
p <- p + geom_abline(slope=summary(fit)$coefficients["n_twas","Estimate"], intercept=0, linetype=2, color="blue")
p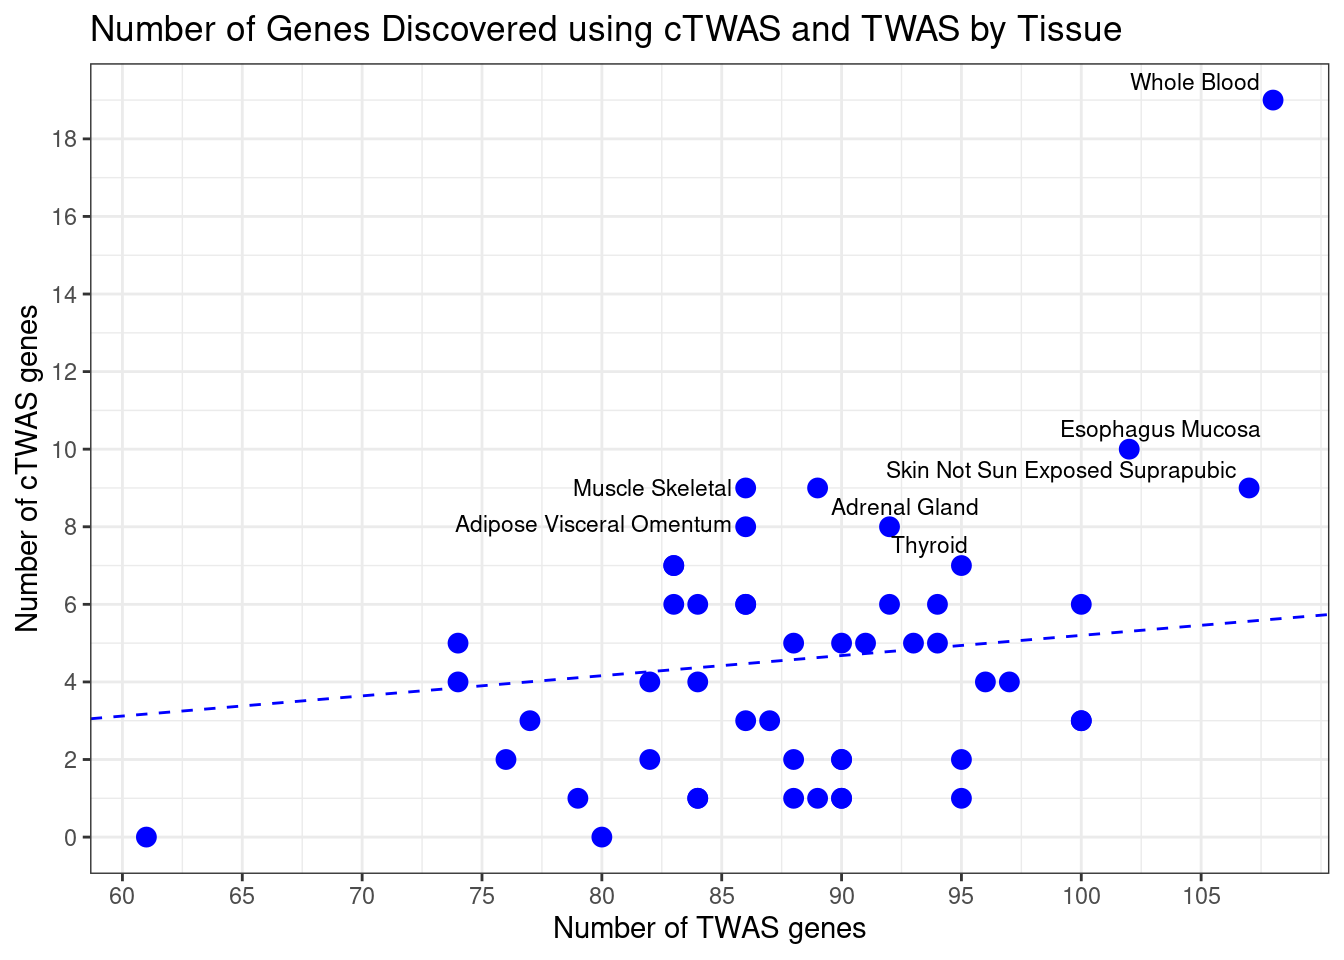
####################
#only labeling genes in "Blood or Immune" or "Digestive" groups

df_plot <- output
df_plot$tissue <- sapply(df_plot$weight, function(x){paste(unlist(strsplit(x,"_")),collapse=" ")})

df_plot[!(df_plot$weight %in% selected_weights),"tissue"] <- ""

p <- ggplot(df_plot, aes(n_twas, n_ctwas, label = tissue)) + geom_point(color = "blue", size=3)
p <- p + geom_text_repel(size=3) + labs(title = "Number of Genes Discovered using cTWAS and TWAS by Tissue") + ylab("Number of cTWAS genes") + xlab("Number of TWAS genes")
p <- p + scale_y_continuous(breaks=seq(0,max(df_plot$n_ctwas),2))
p <- p + scale_x_continuous(breaks=seq(0,max(df_plot$n_twas),5))
p <- p + theme_bw()

fit <- lm(n_ctwas~0+n_twas, data=df_plot)
p <- p + geom_abline(slope=summary(fit)$coefficients["n_twas","Estimate"], intercept=0, linetype=2, color="blue")

p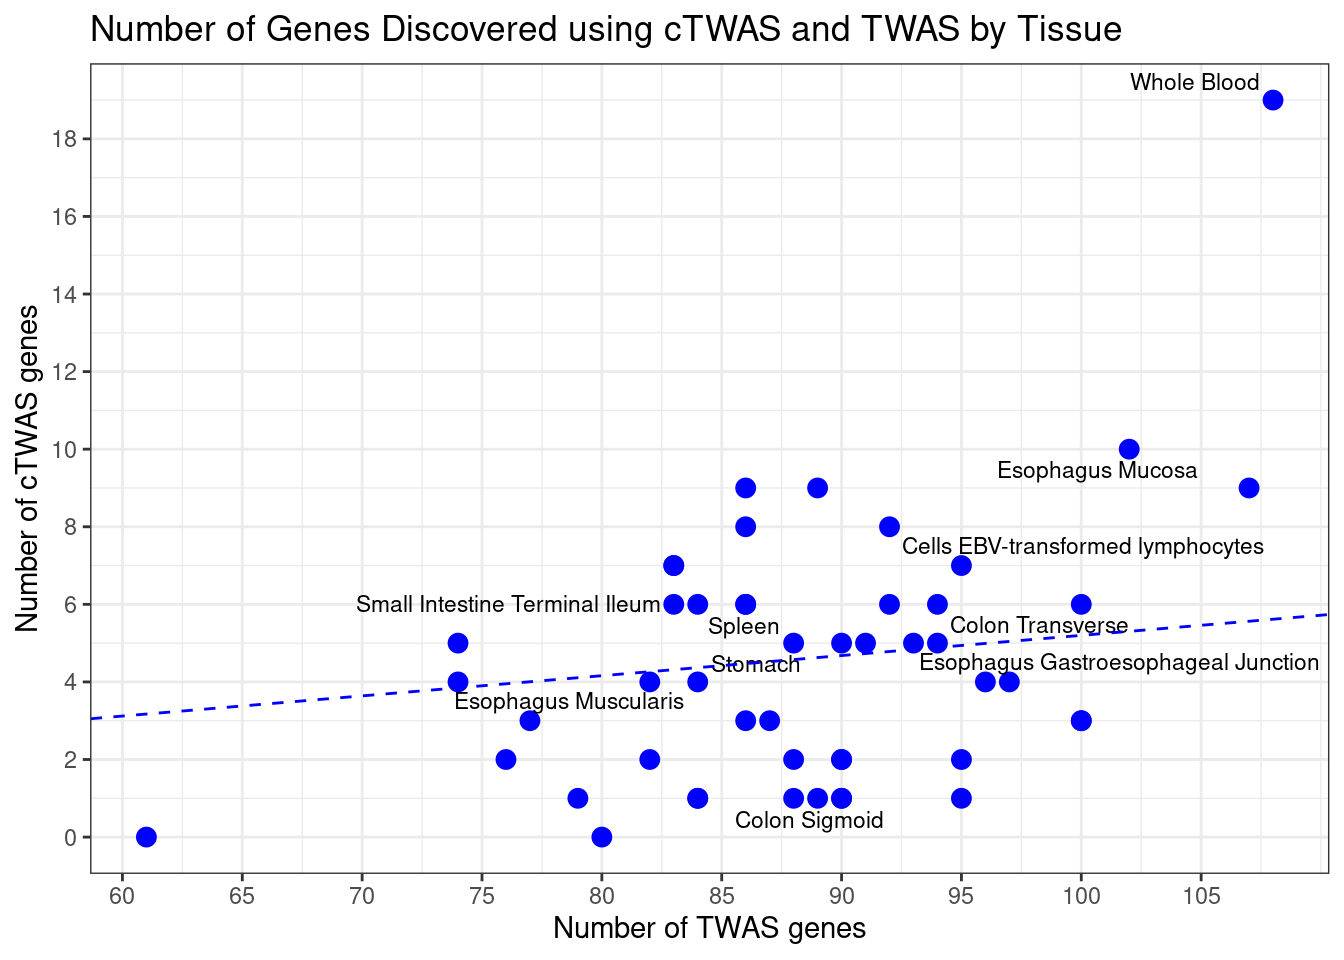
Most cTWAS genes were found in a small number of tissues
#number of tissues with PIP>0.5 for cTWAS genes
gene_pips_by_weight_bkup <- gene_pips_by_weight
gene_pips_by_weight[is.na(gene_pips_by_weight)] <- 0

#gene_pips_by_weight <- gene_pips_by_weight[,selected_weights,drop=F]

ctwas_frequency <- rowSums(gene_pips_by_weight>0.5)
hist(ctwas_frequency, col="grey", breaks=0:max(ctwas_frequency), xlim=c(0,ncol(gene_pips_by_weight)),
     xlab="Number of Tissues with PIP>0.5",
     ylab="Number of cTWAS Genes",
     main="Tissue Specificity for cTWAS Genes")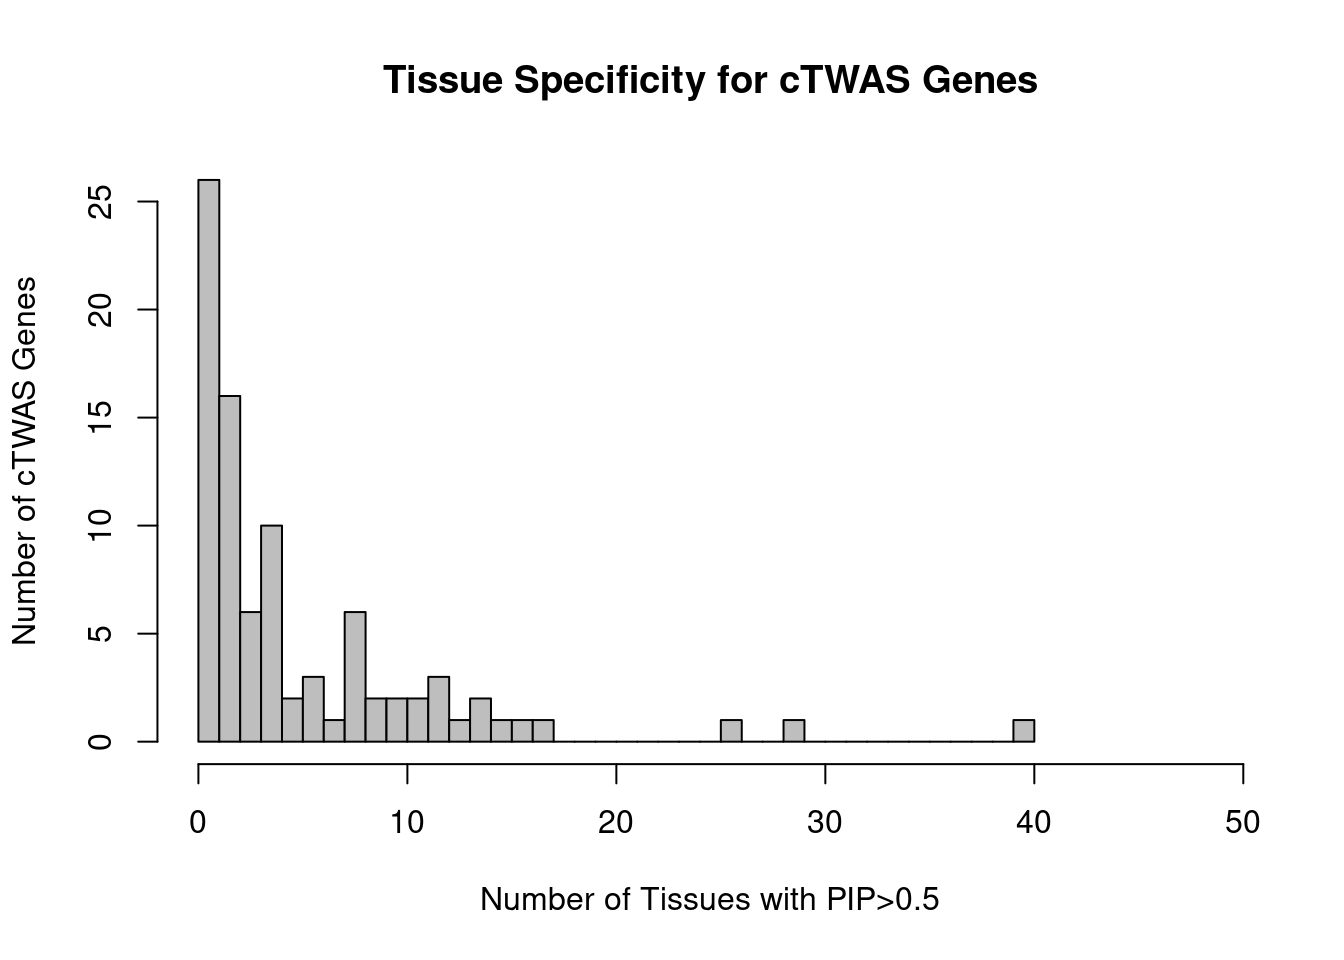
#report number of genes in each tissue bin
table(ctwas_frequency)
ctwas_frequency
1 2 3 4 5 6 7 8 9 10 11 12 13 14 15 16 17 26 29 40
26 16 6 10 2 3 1 6 2 2 2 3 1 2 1 1 1 1 1 1 Many cTWAS genes are novel
“Novel” is defined as 1) not in the silver standard, and 2) not the gene nearest to a genome-wide significant GWAS peak
#barplot of number of cTWAS genes in each tissue
output <- output[output$weight %in% selected_weights,,drop=F]
output <- output[order(-output$n_ctwas),,drop=F]

output$tissue <- sapply(output$weight, function(x){paste(unlist(strsplit(x,"_")),collapse=" ")})

par(mar=c(10.1, 4.1, 4.1, 2.1))
barplot(output$n_ctwas, names.arg=output$tissue, las=2, ylab="Number of cTWAS Genes", cex.names=0.6, main="Number of cTWAS Genes by Tissue")


results_table$novel <- !(results_table$nearest | results_table$known)
output$n_novel <- sapply(output$weight, function(x){sum(results_table[df[[x]]$ctwas,"novel"], na.rm=T)})

barplot(output$n_novel, names.arg=output$tissue, las=2, col="blue", add=T, xaxt='n', yaxt='n')

legend("topright",
       legend = c("Silver Standard or\nNearest to GWAS Peak", "Novel"),
       fill = c("grey", "blue"))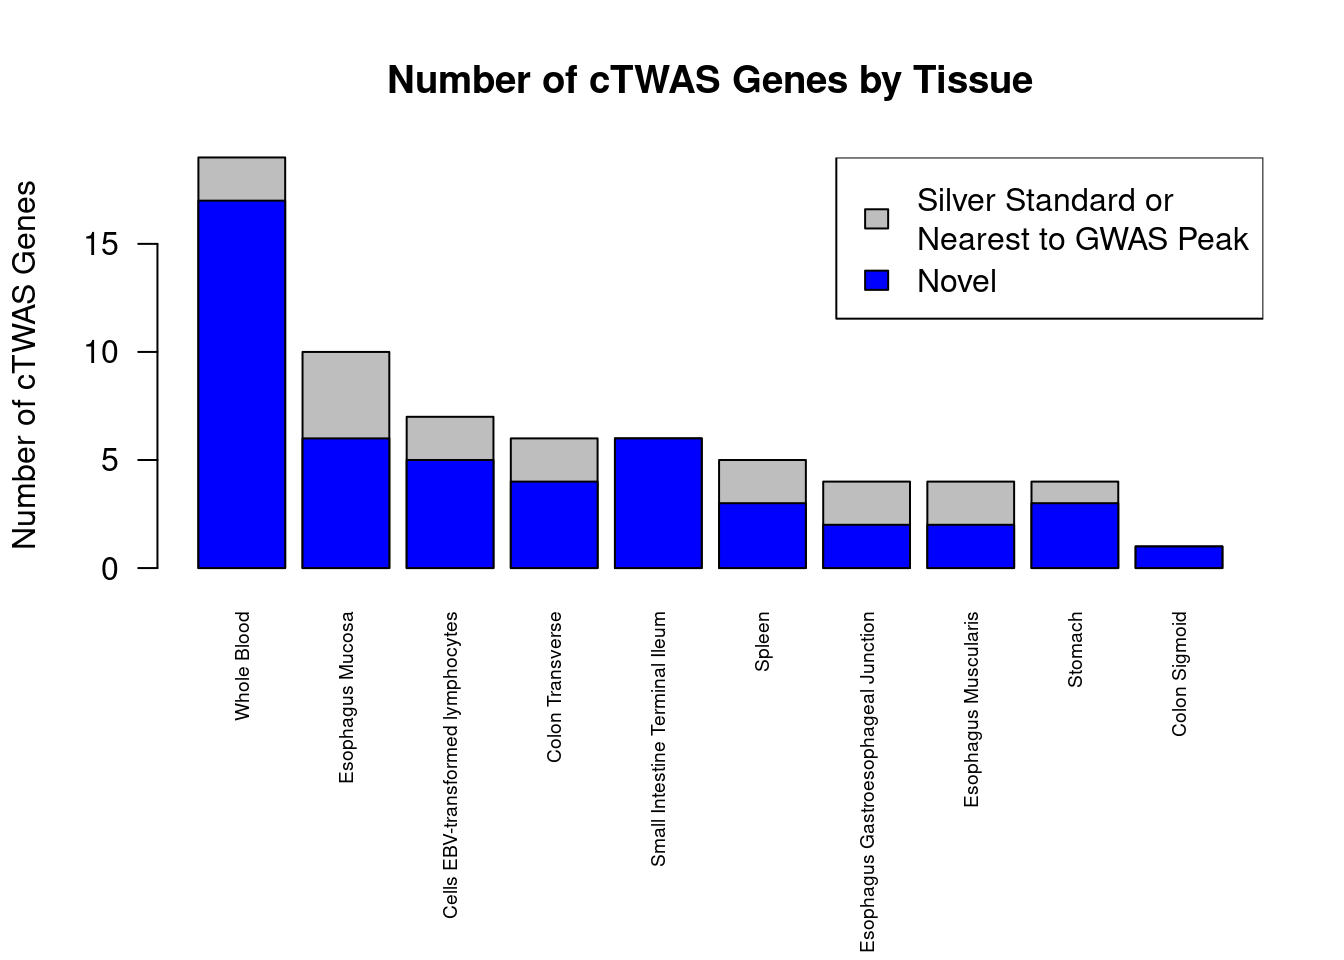
Summary table of results
selected_weights_whitespace <- sapply(selected_weights, function(x){paste(unlist(strsplit(x, "_")), collapse=" ")})

results_summary <- data.frame(genename=as.character(rownames(results_table)),
                              ensembl_gene_id=results_table$ensembl_gene_id,
                              gene_biotype=G_list$gene_biotype[sapply(results_table$ensembl_gene_id, match, table=G_list$ensembl_gene_id)],
                              chromosome=results_table$chromosome_name,
                              start_position=results_table$start_position,
                              max_pip_tissue=selected_weights_whitespace[apply(results_table[,selected_weights], 1, which.max)],
                              max_pip=apply(results_table[,selected_weights], 1, max, na.rm=T),
                              other_tissues_detected=apply(results_table[,selected_weights],1,function(x){paste(selected_weights_whitespace[which(x>0.8 & x!=max(x,na.rm=T))], collapse="; ")}),
                              nearby=results_table$nearby,
                              nearest=results_table$nearest,
                              distance=G_list$distance[sapply(results_table$ensembl_gene_id, match, table=G_list$ensembl_gene_id)],
                              known=results_table$known,
                              enriched_terms=results_table$enriched_terms)

results_summary <- results_summary[order(results_summary$chromosome, results_summary$start_position),]

write.csv(results_summary, file=paste0("results_summary_crohns_nolnc.csv"))
GO enrichment for genes in selected tissues
#enrichment for cTWAS genes using enrichR
library(enrichR)

dbs <- c("GO_Biological_Process_2021")

GO_enrichment <- enrichr(selected_genes, dbs)
Uploading data to Enrichr... Done.
Querying GO_Biological_Process_2021... Done.
Parsing results... Done.for (db in dbs){
cat(paste0(db, "\n\n"))
enrich_results <- GO_enrichment[[db]]
enrich_results <- enrich_results[enrich_results$Adjusted.P.value<0.05,c("Term", "Overlap", "Adjusted.P.value", "Genes")]
print(enrich_results)
print(plotEnrich(GO_enrichment[[db]]))
}GO_Biological_Process_2021
Term Overlap Adjusted.P.value Genes
1 positive regulation of I-kappaB kinase/NF-kappaB signaling (GO:0043123) 6/171 0.001012891 CD40;PPP5C;NDFIP1;CARD9;LTBR;RBCK1
2 regulation of I-kappaB kinase/NF-kappaB signaling (GO:0043122) 6/224 0.002396914 CD40;PPP5C;NDFIP1;CARD9;LTBR;RBCK1
3 tumor necrosis factor-mediated signaling pathway (GO:0033209) 4/116 0.017237481 CD40;TNFSF15;TNFSF4;LTBR
4 positive regulation of CD4-positive, alpha-beta T cell differentiation (GO:0043372) 2/8 0.017237481 SOCS1;TNFSF4
5 regulation of CD4-positive, alpha-beta T cell differentiation (GO:0043370) 2/12 0.022221554 SOCS1;TNFSF4
6 positive regulation of CD4-positive, alpha-beta T cell activation (GO:2000516) 2/13 0.022221554 SOCS1;TNFSF4
7 positive regulation of NF-kappaB transcription factor activity (GO:0051092) 4/155 0.022221554 CD40;IL18RAP;CARD9;RBCK1
8 cytokine-mediated signaling pathway (GO:0019221) 7/621 0.022221554 CD40;IL18RAP;SOCS1;TNFSF15;IFNGR2;TNFSF4;LTBR
9 positive regulation of alpha-beta T cell differentiation (GO:0046638) 2/14 0.022221554 SOCS1;TNFSF4
10 regulation of response to interferon-gamma (GO:0060330) 2/14 0.022221554 SOCS1;IFNGR2
11 regulation of cytokine-mediated signaling pathway (GO:0001959) 3/74 0.027560675 SOCS1;IFNGR2;RBCK1
12 cellular response to tumor necrosis factor (GO:0071356) 4/194 0.037635445 CD40;TNFSF15;TNFSF4;LTBR
13 regulation of interferon-gamma-mediated signaling pathway (GO:0060334) 2/23 0.044159144 SOCS1;IFNGR2
14 positive regulation of intracellular signal transduction (GO:1902533) 6/546 0.044159144 CD40;PPP5C;NDFIP1;CARD9;LTBR;RBCK1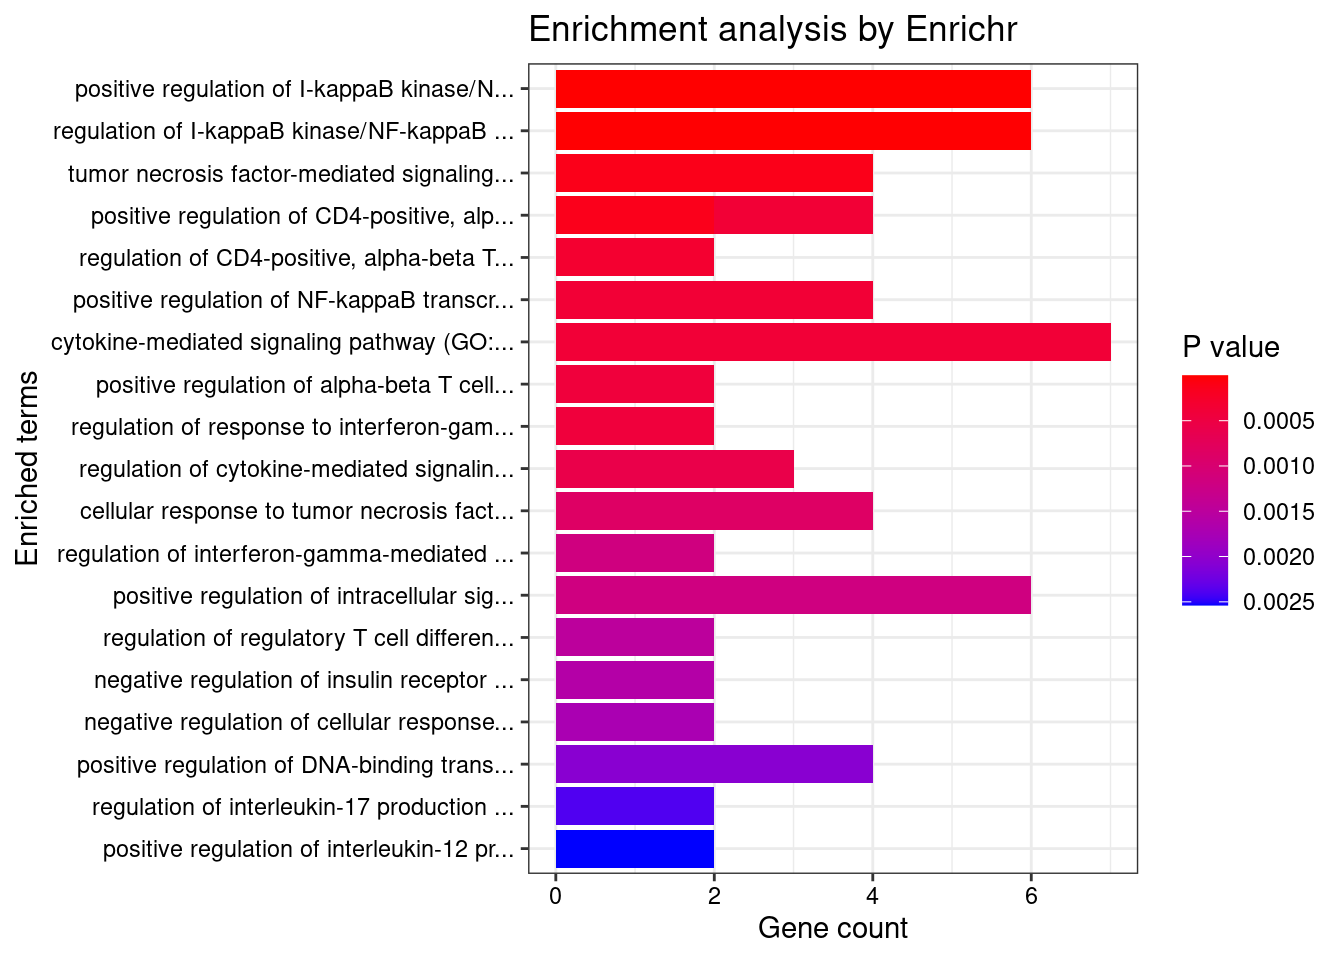
Locus plots for HSPA6
locus_plot <- function(genename, tissue, plot_eqtl = T, label="cTWAS", xlim=NULL){
  results_dir <- results_dirs[grep(tissue, results_dirs)]
  weight <- rev(unlist(strsplit(results_dir, "/")))[1]
  analysis_id <- paste(trait_id, weight, sep="_")

  #load ctwas results
  ctwas_res <- data.table::fread(paste0(results_dir, "/", analysis_id, "_ctwas.susieIrss.txt"))

  #make unique identifier for regions and effects
  ctwas_res$region_tag <- paste(ctwas_res$region_tag1, ctwas_res$region_tag2, sep="_")
  ctwas_res$region_cs_tag <- paste(ctwas_res$region_tag, ctwas_res$cs_index, sep="_")

  #load z scores for SNPs
  load(paste0(results_dir, "/", analysis_id, "_expr_z_snp.Rd"))

  #separate gene and SNP results
  ctwas_gene_res <- ctwas_res[ctwas_res$type == "gene", ]
  ctwas_gene_res <- data.frame(ctwas_gene_res)
  ctwas_snp_res <- ctwas_res[ctwas_res$type == "SNP", ]
  ctwas_snp_res <- data.frame(ctwas_snp_res)

  #add gene information to results
  sqlite <- RSQLite::dbDriver("SQLite")
  db = RSQLite::dbConnect(sqlite, paste0("/project2/mstephens/wcrouse/predictdb_nolnc/mashr_", weight, ".db"))
  query <- function(...) RSQLite::dbGetQuery(db, ...)
  gene_info <- query("select gene, genename, gene_type from extra")
  RSQLite::dbDisconnect(db)

  ctwas_gene_res <- cbind(ctwas_gene_res, gene_info[sapply(ctwas_gene_res$id, match, gene_info$gene), c("genename", "gene_type")])

  #add z scores to results
  load(paste0(results_dir, "/", analysis_id, "_expr_z_gene.Rd"))
  ctwas_gene_res$z <- z_gene[ctwas_gene_res$id,]$z

  z_snp <- z_snp[z_snp$id %in% ctwas_snp_res$id,]
  ctwas_snp_res$z <- z_snp$z[match(ctwas_snp_res$id, z_snp$id)]

  #merge gene and snp results with added information
  ctwas_snp_res$genename=NA
  ctwas_snp_res$gene_type=NA

  ctwas_res <- rbind(ctwas_gene_res, ctwas_snp_res[,colnames(ctwas_gene_res)])

  region_tag <- ctwas_res$region_tag[which(ctwas_res$genename==genename)]

  region_tag1 <- unlist(strsplit(region_tag, "_"))[1]
  region_tag2 <- unlist(strsplit(region_tag, "_"))[2]

  a <- ctwas_res[ctwas_res$region_tag==region_tag,]

  rm(ctwas_res)

  regionlist <- readRDS(paste0(results_dir, "/", analysis_id, "_ctwas.regionlist.RDS"))
  region <- regionlist[[as.numeric(region_tag1)]][[region_tag2]]

  R_snp_info <- do.call(rbind, lapply(region$regRDS, function(x){data.table::fread(paste0(tools::file_path_sans_ext(x), ".Rvar"))}))

  a$pos[a$type=="gene"] <- G_list$start_position[match(sapply(a$id[a$type=="gene"], function(x){unlist(strsplit(x, "[.]"))[1]}) ,G_list$ensembl_gene_id)]
  a$pos <- a$pos/1000000

  if (!is.null(xlim)){
    if (is.na(xlim[1])){
      xlim[1] <- min(a$pos)
    }
    if (is.na(xlim[2])){
      xlim[2] <- max(a$pos)
    }
    a <- a[a$pos>=xlim[1] & a$pos<=xlim[2],,drop=F]
  }

  focus <- a$id[which(a$genename==genename)]
  a$iffocus <- as.numeric(a$id==focus)

  a$PVALUE <- (-log(2) - pnorm(abs(a$z), lower.tail=F, log.p=T))/log(10)

  R_gene <- readRDS(region$R_g_file)
  R_snp_gene <- readRDS(region$R_sg_file)
  R_snp <- as.matrix(Matrix::bdiag(lapply(region$regRDS, readRDS)))

  rownames(R_gene) <- region$gid
  colnames(R_gene) <- region$gid
  rownames(R_snp_gene) <- R_snp_info$id
  colnames(R_snp_gene) <- region$gid
  rownames(R_snp) <- R_snp_info$id
  colnames(R_snp) <- R_snp_info$id

  a$r2max <- NA

  a$r2max[a$type=="gene"] <- R_gene[focus,a$id[a$type=="gene"]]
  a$r2max[a$type=="SNP"] <- R_snp_gene[a$id[a$type=="SNP"],focus]

  r2cut <- 0.4
  colorsall <- c("#7fc97f", "#beaed4", "#fdc086")

  layout(matrix(1:2, ncol = 1), widths = 1, heights = c(1.5,1.5), respect = FALSE)
  par(mar = c(0, 4.1, 4.1, 2.1))

  plot(a$pos[a$type=="SNP"], a$PVALUE[a$type == "SNP"], pch = 21, xlab=paste0("Chromosome ", region_tag1, " position (Mb)"), frame.plot=FALSE, bg = colorsall[1], ylab = "-log10(p value)", panel.first = grid(), ylim =c(-(1/6)*max(a$PVALUE), max(a$PVALUE)*1.2), xaxt = 'n')

  points(a$pos[a$type=="SNP" & a$r2max > r2cut], a$PVALUE[a$type == "SNP"  & a$r2max > r2cut], pch = 21, bg = "purple")
  points(a$pos[a$type=="SNP" & a$iffocus == 1], a$PVALUE[a$type == "SNP" & a$iffocus == 1], pch = 21, bg = "salmon")
  points(a$pos[a$type=="gene"], a$PVALUE[a$type == "gene"], pch = 22, bg = colorsall[1], cex = 2)
  points(a$pos[a$type=="gene" & a$r2max > r2cut], a$PVALUE[a$type == "gene"  & a$r2max > r2cut], pch = 22, bg = "purple", cex = 2)
  points(a$pos[a$type=="gene" & a$iffocus == 1], a$PVALUE[a$type == "gene" & a$iffocus == 1], pch = 22, bg = "salmon", cex = 2)

  alpha=0.05
  abline(h=-log10(alpha/nrow(ctwas_gene_res)), col ="red", lty = 2)

  if (isTRUE(plot_eqtl)){
    for (cgene in a[a$type=="gene" & a$iffocus == 1, ]$id){
      load(paste0(results_dir, "/",analysis_id, "_expr_chr", region_tag1, ".exprqc.Rd"))
      eqtls <- rownames(wgtlist[[cgene]])
      points(a[a$id %in% eqtls,]$pos, rep( -(1/6)*max(a$PVALUE), nrow(a[a$id %in% eqtls,])), pch = "|", col = "salmon", cex = 1.5)
    }
  }

  if (label=="TWAS"){
    text(a$pos[a$id==focus], a$PVALUE[a$id==focus], labels=ctwas_gene_res$genename[ctwas_gene_res$id==focus], pos=3, cex=0.6)
  }

  par(mar = c(4.1, 4.1, 0.5, 2.1))

  plot(a$pos[a$type=="SNP"], a$PVALUE[a$type == "SNP"], pch = 19, xlab=paste0("Chromosome ", region_tag1, " position (Mb)"),frame.plot=FALSE, col = "white", ylim= c(0,1.1), ylab = "cTWAS PIP")

  grid()
  points(a$pos[a$type=="SNP"], a$susie_pip[a$type == "SNP"], pch = 21, xlab="Genomic position", bg = colorsall[1])
  points(a$pos[a$type=="SNP" & a$r2max > r2cut], a$susie_pip[a$type == "SNP"  & a$r2max >r2cut], pch = 21, bg = "purple")
  points(a$pos[a$type=="SNP" & a$iffocus == 1], a$susie_pip[a$type == "SNP" & a$iffocus == 1], pch = 21, bg = "salmon")
  points(a$pos[a$type=="gene"], a$susie_pip[a$type == "gene"], pch = 22, bg = colorsall[1], cex = 2)
  points(a$pos[a$type=="gene" & a$r2max > r2cut], a$susie_pip[a$type == "gene"  & a$r2max > r2cut], pch = 22, bg = "purple", cex = 2)
  points(a$pos[a$type=="gene" & a$iffocus == 1], a$susie_pip[a$type == "gene" & a$iffocus == 1], pch = 22, bg = "salmon", cex = 2)

  legend(max(a$pos)-0.2*(max(a$pos)-min(a$pos)), y= 1 ,c("Gene", "SNP","Lead TWAS Gene", "R2 > 0.4", "R2 <= 0.4"), pch = c(22,21,19,19,19), col = c("black", "black", "salmon", "purple", colorsall[1]), cex=0.7, title.adj = 0)

  if (label=="cTWAS"){
    text(a$pos[a$id==focus], a$susie_pip[a$id==focus], labels=ctwas_gene_res$genename[ctwas_gene_res$id==focus], pos=3, cex=0.6)
  }

  return(a)
}
genename <- "HSPA6"
tissue <- "Esophagus_Muscularis"
a <- locus_plot(genename, tissue, xlim=c(161.25, 161.75))
#ctwas results
head(a[order(-a$susie_pip), c("chrom", "pos", "id", "genename", "type", "susie_pip", "PVALUE") ], 10)
#nearest gene to GWAS peak
G_list[G_list$chromosome_name==unique(a$chrom) & G_list$start_position > min(a$pos*1000000) & G_list$end_position < max(a$pos*1000000),]
####################
#checking additional tissue
a <- locus_plot(genename, "Esophagus_Mucosa", xlim=c(161.25, 161.75))
#ctwas results
head(a[order(-a$susie_pip), c("chrom", "pos", "id", "genename", "type", "susie_pip", "PVALUE") ], 10)Locus plots for IRF8
genename <- "IRF8"
tissue <- names(which.max(results_table[genename,selected_weights]))

print(tissue)

a <- locus_plot(genename, tissue, xlim=c(85.75, 86.25))

#ctwas results
head(a[order(-a$susie_pip), c("chrom", "pos", "id", "genename", "type", "susie_pip", "PVALUE") ], 10)

#nearest gene to GWAS peak
G_list[G_list$chromosome_name==unique(a$chrom) & G_list$start_position > min(a$pos*1000000) & G_list$end_position < max(a$pos*1000000),]
Locus plots for CERKL
genename <- "CERKL"

tissue <- "Colon_Transverse"

print(tissue)

a <- locus_plot(genename, tissue, xlim=c(NA, 181.75))

#ctwas results
head(a[order(-a$susie_pip), c("chrom", "pos", "id", "genename", "type", "susie_pip", "PVALUE") ], 10)

#nearest gene to GWAS peak
G_list[G_list$chromosome_name==unique(a$chrom) & G_list$start_position > min(a$pos*1000000) & G_list$end_position < max(a$pos*1000000),]
Summary table of results - version 2
save.image("workspace5.RData")
#load("workspace5.RData")

results_summary <- data.frame(genename=as.character(rownames(results_table)),
                              ensembl_gene_id=results_table$ensembl_gene_id,
                              chromosome=results_table$chromosome_name,
                              start_position=results_table$start_position,
                              max_pip_tissue=selected_weights_whitespace[apply(results_table[,selected_weights], 1, which.max)],
                              max_pip_tissue_nospace=selected_weights[apply(results_table[,selected_weights], 1, which.max)],
                              max_pip=apply(results_table[,selected_weights], 1, max, na.rm=T),
                              other_tissues_detected=apply(results_table[,selected_weights],1,function(x){paste(selected_weights_whitespace[which(x>0.8 & x!=max(x,na.rm=T))], collapse="; ")}),
                              region_tag_tissue=NA,
                              z_tissue=NA,
                              num_eqtl_tissue=NA,
                              twas_fp_tissue=NA,
                              gene_nearest_region_peak_tissue=NA,
                              nearby=results_table$nearby,
                              nearest=results_table$nearest,
                              distance=results_table$distance,
                              which_nearest=results_table$which_nearest,
                              known=results_table$known,
                              stringsAsFactors=F)

for (i in 1:nrow(results_summary)){
  tissue <- results_summary$max_pip_tissue_nospace[i]
  gene <- results_summary$genename[i]
  gene_pips <- df[[tissue]]$gene_pips
  results_summary[i,c("region_tag_tissue", "z_tissue", "num_eqtl_tissue")] <- gene_pips[gene_pips$genename==gene,c("region_tag", "z", "num_eqtl")]
  region_tag <- results_summary$region_tag_tissue[i]
  results_summary$twas_fp_tissue[i] <- any(gene_pips$genename[gene_pips$region_tag==region_tag & gene_pips$genename!=gene] %in% df[[tissue]]$twas)


  region_pips <- df[[tissue]]$region_pips
  lead_snp <- region_pips$which_snp_maxz[region_pips$region==region_tag]

  chromosome <- results_summary$chromosome[i]
  lead_position <- z_snp$pos[z_snp$id==lead_snp]

  G_list_index <- which(G_list$chromosome_name==chromosome)

  distances <- sapply(G_list_index, function(i){
    if (lead_position >= G_list$start_position[i] & lead_position <= G_list$end_position[i]){
      distance <- 0
    } else {
      distance <- min(abs(G_list$start_position[i] - lead_position), abs(G_list$end_position[i] - lead_position))
    }
    distance
  })

  results_summary$gene_nearest_region_peak_tissue[i] <- paste0(G_list$hgnc_symbol[G_list_index[which(distances==min(distances))]], collapse="; ")

}

####################
#GO enrichment of cTWAS genes
genes <- results_summary$genename

dbs <- c("GO_Biological_Process_2021", "GO_Cellular_Component_2021", "GO_Molecular_Function_2021")
GO_enrichment <- enrichr(genes, dbs)
Uploading data to Enrichr... Done.
Querying GO_Biological_Process_2021... Done.
Querying GO_Cellular_Component_2021... Done.
Querying GO_Molecular_Function_2021... Done.
Parsing results... Done.save(GO_enrichment, file=paste0(trait_id, "_enrichment_results.RData"))
####################
#enrichment of silver standard genes
genes <- known_genes
dbs <- c("GO_Biological_Process_2021", "GO_Cellular_Component_2021", "GO_Molecular_Function_2021")
GO_enrichment_silver_standard <- enrichr(genes, dbs)Uploading data to Enrichr... Done.
Querying GO_Biological_Process_2021... Done.
Querying GO_Cellular_Component_2021... Done.
Querying GO_Molecular_Function_2021... Done.
Parsing results... Done.save(GO_enrichment_silver_standard, file=paste0(trait_id, "silver_standard_enrichment_results.RData"))
####################
#report GO cTWAS
load(paste0(trait_id, "_enrichment_results.RData"))
GO_enrichment <- do.call(rbind, GO_enrichment)
GO_enrichment$db <- sapply(rownames(GO_enrichment), function(x){unlist(strsplit(x, split="[.]"))[1]})
rownames(GO_enrichment) <- NULL
GO_enrichment <- GO_enrichment[GO_enrichment$Adjusted.P.value < 0.05,]
GO_enrichment <- GO_enrichment[order(-GO_enrichment$Odds.Ratio),]
results_summary$GO <- sapply(results_summary$genename, function(x){terms <- GO_enrichment$Term[grep(x, GO_enrichment$Genes)];
if (length(terms)>0){terms <- terms[1:min(length(terms),5)]};
paste0(terms, collapse="; ")})
####################
#report GO silver standard
load(paste0(trait_id, "silver_standard_enrichment_results.RData"))
GO_enrichment_silver_standard <- do.call(rbind, GO_enrichment_silver_standard)
GO_enrichment_silver_standard$db <- sapply(rownames(GO_enrichment_silver_standard), function(x){unlist(strsplit(x, split="[.]"))[1]})
rownames(GO_enrichment_silver_standard) <- NULL
GO_enrichment_silver_standard <- GO_enrichment_silver_standard[GO_enrichment_silver_standard$Adjusted.P.value < 0.05,]
GO_enrichment_silver_standard <- GO_enrichment_silver_standard[order(-GO_enrichment_silver_standard$Odds.Ratio),]
#reload GO cTWAS for GO crosswalk
load(paste0(trait_id, "_enrichment_results.RData"))
GO_enrichment <- do.call(rbind, GO_enrichment)
GO_enrichment$db <- sapply(rownames(GO_enrichment), function(x){unlist(strsplit(x, split="[.]"))[1]})
rownames(GO_enrichment) <- NULL
#overlap between sets
GO_enrichment <- GO_enrichment[GO_enrichment$Term %in% GO_enrichment_silver_standard$Term,,drop=F]
GO_enrichment_silver_standard <- GO_enrichment_silver_standard[GO_enrichment_silver_standard$Term %in% GO_enrichment$Term,,drop=F]
GO_enrichment <- GO_enrichment[match(GO_enrichment_silver_standard$Term, GO_enrichment$Term),]
results_summary$GO_silver <- sapply(results_summary$genename, function(x){terms <- GO_enrichment$Term[grep(x, GO_enrichment$Genes)];
if (length(terms)>0){terms <- terms[1:min(length(terms),5)]};
paste0(terms, collapse="; ")})
####################
#report FUMA
FUMA <- data.table::fread(paste0("/project2/xinhe/shengqian/cTWAS/cTWAS_analysis/data/FUMA_output/", trait_id, "/GS.txt"))
FUMA <- FUMA[FUMA$Category %in% c("GO_bp", "GO_cc", "GO_mf"),,drop=F]
FUMA <- FUMA[order(FUMA$p),]
#reload GO cTWAS for GO crosswalk
load(paste0(trait_id, "_enrichment_results.RData"))
GO_enrichment <- do.call(rbind, GO_enrichment)
GO_enrichment$db <- sapply(rownames(GO_enrichment), function(x){unlist(strsplit(x, split="[.]"))[1]})
rownames(GO_enrichment) <- NULL
GO_enrichment$Term_FUMA <- sapply(GO_enrichment$Term, function(x){rev(rev(unlist(strsplit(x, split=" [(]GO")))[-1])})
GO_enrichment$Term_FUMA <- paste0("GO_", toupper(gsub(" ", "_", GO_enrichment$Term_FUMA)))
#overlap between sets
GO_enrichment <- GO_enrichment[GO_enrichment$Term_FUMA %in% FUMA$GeneSet,,drop=F]
FUMA <- FUMA[FUMA$GeneSet %in% GO_enrichment$Term_FUMA]
GO_enrichment <- GO_enrichment[match(FUMA$GeneSet, GO_enrichment$Term_FUMA),]
results_summary$GO_MAGMA <- sapply(results_summary$genename, function(x){terms <- GO_enrichment$Term[grep(x, GO_enrichment$Genes)];
if (length(terms)>0){terms <- terms[1:min(length(terms),5)]};
paste0(terms, collapse="; ")})
####################
#report FUMA + susieGO
gsesusie <- as.data.frame(readxl::read_xlsx("gsesusie_enrichment.xlsx", sheet=trait_id))
gsesusie$GeneSet <- paste0("(", gsesusie$GeneSet, ")")
#reload GO cTWAS for GO crosswalk
load(paste0(trait_id, "_enrichment_results.RData"))
GO_enrichment <- do.call(rbind, GO_enrichment)
GO_enrichment$db <- sapply(rownames(GO_enrichment), function(x){unlist(strsplit(x, split="[.]"))[1]})
rownames(GO_enrichment) <- NULL
GO_enrichment$GeneSet <- sapply(GO_enrichment$Term, function(x){rev(unlist(strsplit(x, " ")))[1]})
#overlap between sets
GO_enrichment <- GO_enrichment[GO_enrichment$GeneSet %in% gsesusie$GeneSet,,drop=F]
gsesusie <- gsesusie[gsesusie$GeneSet %in% GO_enrichment$GeneSet,,drop=F]
GO_enrichment <- GO_enrichment[match(gsesusie$GeneSet, GO_enrichment$GeneSet),]
results_summary$GO_MAGMA_SuSiE <- sapply(results_summary$genename, function(x){terms <- GO_enrichment$Term[grep(x, GO_enrichment$Genes)];
if (length(terms)>0){terms <- terms[1:min(length(terms),5)]};
paste0(terms, collapse="; ")})
results_summary <- results_summary[order(results_summary$chromosome, results_summary$start_position),]
results_summary <- results_summary[,!(colnames(results_summary) %in% c("max_pip_tissue_nospace"))]
write.csv(results_summary, file=paste0("results_summary_crohns_nolnc_v2.csv"))
sessionInfo()R version 3.6.1 (2019-07-05)
Platform: x86_64-pc-linux-gnu (64-bit)
Running under: Scientific Linux 7.4 (Nitrogen)
Matrix products: default
BLAS/LAPACK: /software/openblas-0.2.19-el7-x86_64/lib/libopenblas_haswellp-r0.2.19.so
locale:
[1] LC_CTYPE=en_US.UTF-8 LC_NUMERIC=C LC_TIME=en_US.UTF-8 LC_COLLATE=en_US.UTF-8 LC_MONETARY=en_US.UTF-8 LC_MESSAGES=en_US.UTF-8 LC_PAPER=en_US.UTF-8 LC_NAME=C LC_ADDRESS=C LC_TELEPHONE=C LC_MEASUREMENT=en_US.UTF-8 LC_IDENTIFICATION=C
attached base packages:
[1] stats graphics grDevices utils datasets methods base
other attached packages:
[1] ggrepel_0.9.1 biomaRt_2.40.1 ggplot2_3.3.5 disgenet2r_0.99.2 WebGestaltR_0.4.4 enrichR_3.0
loaded via a namespace (and not attached):
[1] bitops_1.0-6 fs_1.5.2 bit64_4.0.5 doParallel_1.0.16 progress_1.2.2 httr_1.4.1 rprojroot_2.0.2 tools_3.6.1 doRNG_1.8.2 utf8_1.2.1 R6_2.5.0 DBI_1.1.1 BiocGenerics_0.30.0 colorspace_1.4-1 withr_2.4.1 tidyselect_1.1.2 prettyunits_1.0.2 bit_4.0.4 curl_3.3 compiler_3.6.1 git2r_0.26.1 cli_3.3.0 Biobase_2.44.0 labeling_0.3 scales_1.2.0 readr_1.4.0 stringr_1.4.0 apcluster_1.4.8 digest_0.6.20 rmarkdown_1.13 svglite_1.2.2 pkgconfig_2.0.3 htmltools_0.5.2 fastmap_1.1.0 rlang_1.0.2 readxl_1.3.1 RSQLite_2.2.7 farver_2.1.0 generics_0.0.2 jsonlite_1.6 dplyr_1.0.9 RCurl_1.98-1.1 magrittr_2.0.3 Matrix_1.2-18 Rcpp_1.0.6 munsell_0.5.0 S4Vectors_0.22.1
[48] fansi_0.5.0 gdtools_0.1.9 lifecycle_1.0.1 stringi_1.4.3 whisker_0.3-2 yaml_2.2.0 plyr_1.8.4 grid_3.6.1 blob_1.2.1 parallel_3.6.1 promises_1.0.1 crayon_1.4.1 lattice_0.20-38 hms_1.1.0 knitr_1.23 pillar_1.7.0 igraph_1.2.4.1 rjson_0.2.20 rngtools_1.5 reshape2_1.4.3 codetools_0.2-16 stats4_3.6.1 XML_3.98-1.20 glue_1.6.2 evaluate_0.14 data.table_1.14.0 vctrs_0.4.1 httpuv_1.5.1 foreach_1.5.1 cellranger_1.1.0 gtable_0.3.0 purrr_0.3.4 assertthat_0.2.1 cachem_1.0.5 xfun_0.8 later_0.8.0 tibble_3.1.7 iterators_1.0.13 AnnotationDbi_1.46.0 memoise_2.0.0 IRanges_2.18.1 workflowr_1.6.2 ellipsis_0.3.2