Inflammatory bowel disease - all weights (no lncRNA) - corrected
wesleycrouse
2022-06-09
Last updated: 2022-09-26
Checks: 6 1
Knit directory: ctwas_applied/
This reproducible R Markdown analysis was created with workflowr (version 1.6.2). The Checks tab describes the reproducibility checks that were applied when the results were created. The Past versions tab lists the development history.
The R Markdown file has unstaged changes. To know which version of the R Markdown file created these results, you’ll want to first commit it to the Git repo. If you’re still working on the analysis, you can ignore this warning. When you’re finished, you can run wflow_publish to commit the R Markdown file and build the HTML.
Great job! The global environment was empty. Objects defined in the global environment can affect the analysis in your R Markdown file in unknown ways. For reproduciblity it’s best to always run the code in an empty environment.
The command set.seed(20210726) was run prior to running the code in the R Markdown file. Setting a seed ensures that any results that rely on randomness, e.g. subsampling or permutations, are reproducible.
Great job! Recording the operating system, R version, and package versions is critical for reproducibility.
Nice! There were no cached chunks for this analysis, so you can be confident that you successfully produced the results during this run.
Great job! Using relative paths to the files within your workflowr project makes it easier to run your code on other machines.
Great! You are using Git for version control. Tracking code development and connecting the code version to the results is critical for reproducibility.
The results in this page were generated with repository version 3349d12. See the Past versions tab to see a history of the changes made to the R Markdown and HTML files.
Note that you need to be careful to ensure that all relevant files for the analysis have been committed to Git prior to generating the results (you can use wflow_publish or wflow_git_commit). workflowr only checks the R Markdown file, but you know if there are other scripts or data files that it depends on. Below is the status of the Git repository when the results were generated:
Untracked files:
    Untracked:  workspace1.RData
    Untracked:  workspace2.RData
    Untracked:  workspace3.RData
    Untracked:  z_snp_pos_ebi-a-GCST004131.RData
    Untracked:  z_snp_pos_ebi-a-GCST004132.RData
    Untracked:  z_snp_pos_ebi-a-GCST004133.RData
    Untracked:  z_snp_pos_scz-2018.RData
    Untracked:  z_snp_pos_ukb-a-360.RData
    Untracked:  z_snp_pos_ukb-d-30780_irnt.RData

Unstaged changes:
    Modified:   analysis/ebi-a-GCST004131_allweights_nolnc_corrected.Rmd
    Modified:   analysis/scz-2018_allweights_nolnc_corrected.Rmd
    Modified:   analysis/ukb-a-360_allweights_nolnc_corrected.Rmd
    Modified:   analysis/ukb-d-30780_irnt_Liver_nolnc_corrected_known.Rmd
    Modified:   code/automate_Rmd.R
    Modified:   output/LDL_results_all_genes.csv
    Modified:   output/LDL_results_silver_bystander.csv
    Modified:   output/full_gene_results/IBD_Adipose_Subcutaneous.csv
    Modified:   output/full_gene_results/IBD_Adipose_Visceral_Omentum.csv
    Modified:   output/full_gene_results/IBD_Adrenal_Gland.csv
    Modified:   output/full_gene_results/IBD_Artery_Aorta.csv
    Deleted:    output/full_gene_results/IBD_Artery_Coronary.csv
    Deleted:    output/full_gene_results/IBD_Artery_Tibial.csv
    Deleted:    output/full_gene_results/IBD_Brain_Amygdala.csv
    Deleted:    output/full_gene_results/IBD_Brain_Anterior_cingulate_cortex_BA24.csv
    Deleted:    output/full_gene_results/IBD_Brain_Caudate_basal_ganglia.csv
    Deleted:    output/full_gene_results/IBD_Brain_Cerebellar_Hemisphere.csv
    Deleted:    output/full_gene_results/IBD_Brain_Cerebellum.csv
    Deleted:    output/full_gene_results/IBD_Brain_Cortex.csv
    Deleted:    output/full_gene_results/IBD_Brain_Frontal_Cortex_BA9.csv
    Deleted:    output/full_gene_results/IBD_Brain_Hippocampus.csv
    Deleted:    output/full_gene_results/IBD_Brain_Hypothalamus.csv
    Deleted:    output/full_gene_results/IBD_Brain_Nucleus_accumbens_basal_ganglia.csv
    Deleted:    output/full_gene_results/IBD_Brain_Putamen_basal_ganglia.csv
    Deleted:    output/full_gene_results/IBD_Brain_Spinal_cord_cervical_c-1.csv
    Deleted:    output/full_gene_results/IBD_Brain_Substantia_nigra.csv
    Deleted:    output/full_gene_results/IBD_Breast_Mammary_Tissue.csv
    Deleted:    output/full_gene_results/IBD_Cells_Cultured_fibroblasts.csv
    Deleted:    output/full_gene_results/IBD_Cells_EBV-transformed_lymphocytes.csv
    Deleted:    output/full_gene_results/IBD_Colon_Sigmoid.csv
    Deleted:    output/full_gene_results/IBD_Colon_Transverse.csv
    Deleted:    output/full_gene_results/IBD_Esophagus_Gastroesophageal_Junction.csv
    Deleted:    output/full_gene_results/IBD_Esophagus_Mucosa.csv
    Deleted:    output/full_gene_results/IBD_Esophagus_Muscularis.csv
    Deleted:    output/full_gene_results/IBD_Heart_Atrial_Appendage.csv
    Deleted:    output/full_gene_results/IBD_Heart_Left_Ventricle.csv
    Deleted:    output/full_gene_results/IBD_Kidney_Cortex.csv
    Deleted:    output/full_gene_results/IBD_Liver.csv
    Deleted:    output/full_gene_results/IBD_Lung.csv
    Deleted:    output/full_gene_results/IBD_Minor_Salivary_Gland.csv
    Deleted:    output/full_gene_results/IBD_Muscle_Skeletal.csv
    Deleted:    output/full_gene_results/IBD_Nerve_Tibial.csv
    Deleted:    output/full_gene_results/IBD_Ovary.csv
    Deleted:    output/full_gene_results/IBD_Pancreas.csv
    Deleted:    output/full_gene_results/IBD_Pituitary.csv
    Deleted:    output/full_gene_results/IBD_Prostate.csv
    Deleted:    output/full_gene_results/IBD_Skin_Not_Sun_Exposed_Suprapubic.csv
    Deleted:    output/full_gene_results/IBD_Skin_Sun_Exposed_Lower_leg.csv
    Deleted:    output/full_gene_results/IBD_Small_Intestine_Terminal_Ileum.csv
    Deleted:    output/full_gene_results/IBD_Spleen.csv
    Deleted:    output/full_gene_results/IBD_Stomach.csv
    Deleted:    output/full_gene_results/IBD_Testis.csv
    Deleted:    output/full_gene_results/IBD_Thyroid.csv
    Deleted:    output/full_gene_results/IBD_Uterus.csv
    Deleted:    output/full_gene_results/IBD_Vagina.csv
    Deleted:    output/full_gene_results/IBD_Whole_Blood.csv
    Deleted:    output/full_gene_results/SBP_Adipose_Subcutaneous.csv
    Deleted:    output/full_gene_results/SBP_Adipose_Visceral_Omentum.csv
    Deleted:    output/full_gene_results/SBP_Adrenal_Gland.csv
    Deleted:    output/full_gene_results/SBP_Artery_Aorta.csv
    Deleted:    output/full_gene_results/SBP_Artery_Coronary.csv
    Deleted:    output/full_gene_results/SBP_Artery_Tibial.csv
    Deleted:    output/full_gene_results/SBP_Brain_Amygdala.csv
    Deleted:    output/full_gene_results/SBP_Brain_Anterior_cingulate_cortex_BA24.csv
    Deleted:    output/full_gene_results/SBP_Brain_Caudate_basal_ganglia.csv
    Deleted:    output/full_gene_results/SBP_Brain_Cerebellar_Hemisphere.csv
    Deleted:    output/full_gene_results/SBP_Brain_Cerebellum.csv
    Deleted:    output/full_gene_results/SBP_Brain_Cortex.csv
    Deleted:    output/full_gene_results/SBP_Brain_Frontal_Cortex_BA9.csv
    Deleted:    output/full_gene_results/SBP_Brain_Hippocampus.csv
    Deleted:    output/full_gene_results/SBP_Brain_Hypothalamus.csv
    Deleted:    output/full_gene_results/SBP_Brain_Nucleus_accumbens_basal_ganglia.csv
    Deleted:    output/full_gene_results/SBP_Brain_Putamen_basal_ganglia.csv
    Deleted:    output/full_gene_results/SBP_Brain_Spinal_cord_cervical_c-1.csv
    Deleted:    output/full_gene_results/SBP_Brain_Substantia_nigra.csv
    Deleted:    output/full_gene_results/SBP_Breast_Mammary_Tissue.csv
    Deleted:    output/full_gene_results/SBP_Cells_Cultured_fibroblasts.csv
    Deleted:    output/full_gene_results/SBP_Cells_EBV-transformed_lymphocytes.csv
    Deleted:    output/full_gene_results/SBP_Colon_Sigmoid.csv
    Deleted:    output/full_gene_results/SBP_Colon_Transverse.csv
    Deleted:    output/full_gene_results/SBP_Esophagus_Gastroesophageal_Junction.csv
    Deleted:    output/full_gene_results/SBP_Esophagus_Mucosa.csv
    Deleted:    output/full_gene_results/SBP_Esophagus_Muscularis.csv
    Deleted:    output/full_gene_results/SBP_Heart_Atrial_Appendage.csv
    Deleted:    output/full_gene_results/SBP_Heart_Left_Ventricle.csv
    Deleted:    output/full_gene_results/SBP_Kidney_Cortex.csv
    Deleted:    output/full_gene_results/SBP_Liver.csv
    Deleted:    output/full_gene_results/SBP_Lung.csv
    Deleted:    output/full_gene_results/SBP_Minor_Salivary_Gland.csv
    Deleted:    output/full_gene_results/SBP_Muscle_Skeletal.csv
    Deleted:    output/full_gene_results/SBP_Nerve_Tibial.csv
    Deleted:    output/full_gene_results/SBP_Ovary.csv
    Deleted:    output/full_gene_results/SBP_Pancreas.csv
    Deleted:    output/full_gene_results/SBP_Pituitary.csv
    Deleted:    output/full_gene_results/SBP_Prostate.csv
    Deleted:    output/full_gene_results/SBP_Skin_Not_Sun_Exposed_Suprapubic.csv
    Deleted:    output/full_gene_results/SBP_Skin_Sun_Exposed_Lower_leg.csv
    Deleted:    output/full_gene_results/SBP_Small_Intestine_Terminal_Ileum.csv
    Deleted:    output/full_gene_results/SBP_Spleen.csv
    Deleted:    output/full_gene_results/SBP_Stomach.csv
    Deleted:    output/full_gene_results/SBP_Testis.csv
    Deleted:    output/full_gene_results/SBP_Thyroid.csv
    Deleted:    output/full_gene_results/SBP_Uterus.csv
    Deleted:    output/full_gene_results/SBP_Vagina.csv
    Deleted:    output/full_gene_results/SBP_Whole_Blood.csv
    Deleted:    output/full_gene_results/SCZ_Adipose_Subcutaneous.csv
    Deleted:    output/full_gene_results/SCZ_Adipose_Visceral_Omentum.csv
    Deleted:    output/full_gene_results/SCZ_Adrenal_Gland.csv
    Deleted:    output/full_gene_results/SCZ_Artery_Aorta.csv
    Deleted:    output/full_gene_results/SCZ_Artery_Coronary.csv
    Deleted:    output/full_gene_results/SCZ_Artery_Tibial.csv
    Deleted:    output/full_gene_results/SCZ_Brain_Amygdala.csv
    Deleted:    output/full_gene_results/SCZ_Brain_Anterior_cingulate_cortex_BA24.csv
    Deleted:    output/full_gene_results/SCZ_Brain_Caudate_basal_ganglia.csv
    Deleted:    output/full_gene_results/SCZ_Brain_Cerebellar_Hemisphere.csv
    Deleted:    output/full_gene_results/SCZ_Brain_Cerebellum.csv
    Deleted:    output/full_gene_results/SCZ_Brain_Cortex.csv
    Deleted:    output/full_gene_results/SCZ_Brain_Frontal_Cortex_BA9.csv
    Deleted:    output/full_gene_results/SCZ_Brain_Hippocampus.csv
    Deleted:    output/full_gene_results/SCZ_Brain_Hypothalamus.csv
    Deleted:    output/full_gene_results/SCZ_Brain_Nucleus_accumbens_basal_ganglia.csv
    Deleted:    output/full_gene_results/SCZ_Brain_Putamen_basal_ganglia.csv
    Deleted:    output/full_gene_results/SCZ_Brain_Spinal_cord_cervical_c-1.csv
    Deleted:    output/full_gene_results/SCZ_Brain_Substantia_nigra.csv
    Deleted:    output/full_gene_results/SCZ_Breast_Mammary_Tissue.csv
    Deleted:    output/full_gene_results/SCZ_Cells_Cultured_fibroblasts.csv
    Deleted:    output/full_gene_results/SCZ_Cells_EBV-transformed_lymphocytes.csv
    Deleted:    output/full_gene_results/SCZ_Colon_Sigmoid.csv
    Deleted:    output/full_gene_results/SCZ_Colon_Transverse.csv
    Deleted:    output/full_gene_results/SCZ_Esophagus_Gastroesophageal_Junction.csv
    Deleted:    output/full_gene_results/SCZ_Esophagus_Mucosa.csv
    Deleted:    output/full_gene_results/SCZ_Esophagus_Muscularis.csv
    Deleted:    output/full_gene_results/SCZ_Heart_Atrial_Appendage.csv
    Deleted:    output/full_gene_results/SCZ_Heart_Left_Ventricle.csv
    Deleted:    output/full_gene_results/SCZ_Kidney_Cortex.csv
    Deleted:    output/full_gene_results/SCZ_Liver.csv
    Deleted:    output/full_gene_results/SCZ_Lung.csv
    Deleted:    output/full_gene_results/SCZ_Minor_Salivary_Gland.csv
    Deleted:    output/full_gene_results/SCZ_Muscle_Skeletal.csv
    Deleted:    output/full_gene_results/SCZ_Nerve_Tibial.csv
    Deleted:    output/full_gene_results/SCZ_Ovary.csv
    Deleted:    output/full_gene_results/SCZ_Pancreas.csv
    Deleted:    output/full_gene_results/SCZ_Pituitary.csv
    Deleted:    output/full_gene_results/SCZ_Prostate.csv
    Deleted:    output/full_gene_results/SCZ_Skin_Not_Sun_Exposed_Suprapubic.csv
    Deleted:    output/full_gene_results/SCZ_Skin_Sun_Exposed_Lower_leg.csv
    Deleted:    output/full_gene_results/SCZ_Small_Intestine_Terminal_Ileum.csv
    Deleted:    output/full_gene_results/SCZ_Spleen.csv
    Deleted:    output/full_gene_results/SCZ_Stomach.csv
    Deleted:    output/full_gene_results/SCZ_Testis.csv
    Deleted:    output/full_gene_results/SCZ_Thyroid.csv
    Deleted:    output/full_gene_results/SCZ_Uterus.csv
    Deleted:    output/full_gene_results/SCZ_Vagina.csv
    Deleted:    output/full_gene_results/SCZ_Whole_Blood.csv
Note that any generated files, e.g. HTML, png, CSS, etc., are not included in this status report because it is ok for generated content to have uncommitted changes.
These are the previous versions of the repository in which changes were made to the R Markdown (analysis/ebi-a-GCST004131_allweights_nolnc_corrected.Rmd) and HTML (docs/ebi-a-GCST004131_allweights_nolnc_corrected.html) files. If you’ve configured a remote Git repository (see ?wflow_git_remote), click on the hyperlinks in the table below to view the files as they were in that past version.
| File | Version | Author | Date | Message |
|---|---|---|---|---|
| Rmd | 3349d12 | wesleycrouse | 2022-09-16 | maybe final tables |
| html | 3349d12 | wesleycrouse | 2022-09-16 | maybe final tables |
| Rmd | 6a57156 | wesleycrouse | 2022-09-14 | regenerating tables |
| html | 6a57156 | wesleycrouse | 2022-09-14 | regenerating tables |
| Rmd | 6d10cf7 | wesleycrouse | 2022-09-09 | additional results tables |
| html | 6d10cf7 | wesleycrouse | 2022-09-09 | additional results tables |
| Rmd | 220ba1d | wesleycrouse | 2022-09-09 | figure revisions |
| html | 220ba1d | wesleycrouse | 2022-09-09 | figure revisions |
| Rmd | 2af4567 | wesleycrouse | 2022-09-02 | working on supplemental figures |
| html | 2af4567 | wesleycrouse | 2022-09-02 | working on supplemental figures |
| html | 7593421 | wesleycrouse | 2022-08-29 | regenerating table |
| Rmd | 437d453 | wesleycrouse | 2022-08-29 | updating compact results summmary |
| html | 437d453 | wesleycrouse | 2022-08-29 | updating compact results summmary |
| Rmd | 691375a | wesleycrouse | 2022-08-24 | Updates for multi-panel figures |
| html | 691375a | wesleycrouse | 2022-08-24 | Updates for multi-panel figures |
| Rmd | f26dabe | wesleycrouse | 2022-07-29 | LDL compact results table |
| Rmd | 755127a | wesleycrouse | 2022-07-28 | venn and updated false negatives |
| html | 755127a | wesleycrouse | 2022-07-28 | venn and updated false negatives |
| Rmd | 96e4b26 | wesleycrouse | 2022-07-28 | GO visualization for IBD |
| html | 96e4b26 | wesleycrouse | 2022-07-28 | GO visualization for IBD |
| Rmd | ee8de49 | wesleycrouse | 2022-07-27 | multitrait plots |
| html | cb3f976 | wesleycrouse | 2022-07-27 | SCZ and SBP magma results |
| Rmd | dd9f346 | wesleycrouse | 2022-07-27 | regenerate plots |
| html | dd9f346 | wesleycrouse | 2022-07-27 | regenerate plots |
| Rmd | 0803b64 | wesleycrouse | 2022-07-27 | testing figure titles |
| html | 0803b64 | wesleycrouse | 2022-07-27 | testing figure titles |
| Rmd | 7474fef | wesleycrouse | 2022-07-26 | SCZ testing |
| Rmd | 4c153a7 | wesleycrouse | 2022-07-25 | IBD cleanup |
| html | 4c153a7 | wesleycrouse | 2022-07-25 | IBD cleanup |
| Rmd | 3be2b06 | wesleycrouse | 2022-07-25 | SBP silver standard |
| Rmd | 30511bd | wesleycrouse | 2022-07-14 | IBD plot |
| html | 30511bd | wesleycrouse | 2022-07-14 | IBD plot |
| Rmd | 714a734 | wesleycrouse | 2022-07-14 | IBD novel genes by tissue |
| html | 714a734 | wesleycrouse | 2022-07-14 | IBD novel genes by tissue |
| Rmd | 772879d | wesleycrouse | 2022-07-14 | final IBD plot prep |
| html | 772879d | wesleycrouse | 2022-07-14 | final IBD plot prep |
| Rmd | 3bd4709 | wesleycrouse | 2022-07-13 | adjusting locus plots for IBD |
| html | 3bd4709 | wesleycrouse | 2022-07-13 | adjusting locus plots for IBD |
| Rmd | f29fd71 | wesleycrouse | 2022-07-12 | IBD locus plots |
| html | f29fd71 | wesleycrouse | 2022-07-12 | IBD locus plots |
| Rmd | bb25d5b | wesleycrouse | 2022-07-12 | IBD locus plots |
| html | bb25d5b | wesleycrouse | 2022-07-12 | IBD locus plots |
| Rmd | 7ad4535 | wesleycrouse | 2022-07-12 | IBD regeneration |
| html | 7ad4535 | wesleycrouse | 2022-07-12 | IBD regeneration |
| Rmd | 6d451ae | wesleycrouse | 2022-07-11 | tagging novel genes |
| html | 6d451ae | wesleycrouse | 2022-07-11 | tagging novel genes |
| Rmd | c866437 | wesleycrouse | 2022-07-11 | IBD histogram |
| html | c866437 | wesleycrouse | 2022-07-11 | IBD histogram |
| Rmd | f975189 | wesleycrouse | 2022-07-11 | more IBD plots |
| html | f975189 | wesleycrouse | 2022-07-11 | more IBD plots |
| Rmd | d0e05a0 | wesleycrouse | 2022-07-07 | mesc figure |
| html | d0e05a0 | wesleycrouse | 2022-07-07 | mesc figure |
| Rmd | e74100e | wesleycrouse | 2022-07-07 | IBD MESC plot |
| html | e74100e | wesleycrouse | 2022-07-07 | IBD MESC plot |
| html | 76418ae | wesleycrouse | 2022-07-07 | updating IBD plots |
| Rmd | 81aa4a9 | wesleycrouse | 2022-07-06 | tinkering with ldl plots |
| html | 81aa4a9 | wesleycrouse | 2022-07-06 | tinkering with ldl plots |
| Rmd | 75f3e4a | wesleycrouse | 2022-07-06 | IBD heritability |
| html | 75f3e4a | wesleycrouse | 2022-07-06 | IBD heritability |
| Rmd | 65634fd | wesleycrouse | 2022-06-30 | Corrected IBD results |
| html | 65634fd | wesleycrouse | 2022-06-30 | Corrected IBD results |
| Rmd | 1436530 | wesleycrouse | 2022-06-30 | plot labels |
options(width=1000)trait_id <- "ebi-a-GCST004131"
trait_name <- "Inflammatory bowel disease"
source("/project2/mstephens/wcrouse/UKB_analysis_allweights_corrected/ctwas_config.R")
trait_dir <- paste0("/project2/mstephens/wcrouse/UKB_analysis_allweights_corrected/", trait_id)
results_dirs <- list.dirs(trait_dir, recursive=F)
results_dirs <- results_dirs[grep("nolnc", results_dirs)]Load cTWAS results for all weights
df <- list()

for (i in 1:length(results_dirs)){
  print(i)

  results_dir <- results_dirs[i]
  weight <- rev(unlist(strsplit(results_dir, "/")))[1]
  weight <- unlist(strsplit(weight, split="_nolnc"))
  analysis_id <- paste(trait_id, weight, sep="_")

  #load ctwas results
  ctwas_res <- data.table::fread(paste0(results_dir, "/", analysis_id, "_ctwas.susieIrss.txt"))

  #make unique identifier for regions and effects
  ctwas_res$region_tag <- paste(ctwas_res$region_tag1, ctwas_res$region_tag2, sep="_")
  ctwas_res$region_cs_tag <- paste(ctwas_res$region_tag, ctwas_res$cs_index, sep="_")

  #load z scores for SNPs and collect sample size
  load(paste0(results_dir, "/", analysis_id, "_expr_z_snp.Rd"))

  sample_size <- z_snp$ss
  sample_size <- as.numeric(names(which.max(table(sample_size))))

  #compute PVE for each gene/SNP
  ctwas_res$PVE = ctwas_res$susie_pip*ctwas_res$mu2/sample_size

  #separate gene and SNP results
  ctwas_gene_res <- ctwas_res[ctwas_res$type == "gene", ]
  ctwas_gene_res <- data.frame(ctwas_gene_res)
  ctwas_snp_res <- ctwas_res[ctwas_res$type == "SNP", ]
  ctwas_snp_res <- data.frame(ctwas_snp_res)

  #add gene information to results
  sqlite <- RSQLite::dbDriver("SQLite")
  db = RSQLite::dbConnect(sqlite, paste0("/project2/mstephens/wcrouse/predictdb_nolnc/mashr_", weight, "_nolnc.db"))
  query <- function(...) RSQLite::dbGetQuery(db, ...)
  gene_info <- query("select gene, genename, gene_type from extra")
  RSQLite::dbDisconnect(db)

  ctwas_gene_res <- cbind(ctwas_gene_res, gene_info[sapply(ctwas_gene_res$id, match, gene_info$gene), c("genename", "gene_type")])

  #add z scores to results
  load(paste0(results_dir, "/", analysis_id, "_expr_z_gene.Rd"))
  ctwas_gene_res$z <- z_gene[ctwas_gene_res$id,]$z

  z_snp <- z_snp[z_snp$id %in% ctwas_snp_res$id,]
  ctwas_snp_res$z <- z_snp$z[match(ctwas_snp_res$id, z_snp$id)]

  #merge gene and snp results with added information
  ctwas_snp_res$genename=NA
  ctwas_snp_res$gene_type=NA

  ctwas_res <- rbind(ctwas_gene_res, ctwas_snp_res[,colnames(ctwas_gene_res)])

  #get number of eQTL for genes
  num_eqtl <- c()
  for (i in 1:22){
    load(paste0(results_dir, "/", analysis_id, "_expr_chr", i, ".exprqc.Rd"))
    num_eqtl <- c(num_eqtl, unlist(lapply(wgtlist, nrow)))
  }
  ctwas_gene_res$num_eqtl <- num_eqtl[ctwas_gene_res$id]

  #get number of SNPs from s1 results; adjust for thin argument
  ctwas_res_s1 <- data.table::fread(paste0(results_dir, "/", analysis_id, "_ctwas.s1.susieIrss.txt"))
  n_snps <- sum(ctwas_res_s1$type=="SNP")/thin
  rm(ctwas_res_s1)

  #load estimated parameters
  load(paste0(results_dir, "/", analysis_id, "_ctwas.s2.susieIrssres.Rd"))

  #estimated group prior
  estimated_group_prior <- group_prior_rec[,ncol(group_prior_rec)]
  names(estimated_group_prior) <- c("gene", "snp")
  estimated_group_prior["snp"] <- estimated_group_prior["snp"]*thin #adjust parameter to account for thin argument

  #estimated group prior variance
  estimated_group_prior_var <- group_prior_var_rec[,ncol(group_prior_var_rec)]
  names(estimated_group_prior_var) <- c("gene", "snp")

  #report group size
  group_size <- c(nrow(ctwas_gene_res), n_snps)

  #estimated group PVE
  estimated_group_pve <- estimated_group_prior_var*estimated_group_prior*group_size/sample_size
  names(estimated_group_pve) <- c("gene", "snp")

  #ctwas genes using PIP>0.8
  ctwas_genes_index <- ctwas_gene_res$susie_pip>0.8
  ctwas_genes <- ctwas_gene_res$genename[ctwas_genes_index]

  #twas genes using bonferroni threshold
  alpha <- 0.05
  sig_thresh <- qnorm(1-(alpha/nrow(ctwas_gene_res)/2), lower=T)

  twas_genes_index <- abs(ctwas_gene_res$z) > sig_thresh
  twas_genes <- ctwas_gene_res$genename[twas_genes_index]

  #gene PIPs and z scores
  gene_pips <- ctwas_gene_res[,c("genename", "region_tag", "susie_pip", "z", "region_cs_tag", "num_eqtl")]

  #total PIPs by region
  regions <- unique(ctwas_gene_res$region_tag)
  region_pips <- data.frame(region=regions, stringsAsFactors=F)
  region_pips$gene_pip <- sapply(regions, function(x){sum(ctwas_gene_res$susie_pip[ctwas_gene_res$region_tag==x])})
  region_pips$snp_pip <- sapply(regions, function(x){sum(ctwas_snp_res$susie_pip[ctwas_snp_res$region_tag==x])})
  region_pips$snp_maxz <- sapply(regions, function(x){max(abs(ctwas_snp_res$z[ctwas_snp_res$region_tag==x]))})
  region_pips$which_snp_maxz <- sapply(regions, function(x){ctwas_snp_res_index <- ctwas_snp_res$region_tag==x; ctwas_snp_res$id[ctwas_snp_res_index][which.max(abs(ctwas_snp_res$z[ctwas_snp_res_index]))]})

  #total PIPs by causal set
  regions_cs <- unique(ctwas_gene_res$region_cs_tag)
  region_cs_pips <- data.frame(region_cs=regions_cs, stringsAsFactors=F)
  region_cs_pips$gene_pip <- sapply(regions_cs, function(x){sum(ctwas_gene_res$susie_pip[ctwas_gene_res$region_cs_tag==x])})
  region_cs_pips$snp_pip <- sapply(regions_cs, function(x){sum(ctwas_snp_res$susie_pip[ctwas_snp_res$region_cs_tag==x])})

  df[[weight]] <- list(prior=estimated_group_prior,
                     prior_var=estimated_group_prior_var,
                     pve=estimated_group_pve,
                     ctwas=ctwas_genes,
                     twas=twas_genes,
                     gene_pips=gene_pips,
                     region_pips=region_pips,
                     sig_thresh=sig_thresh,
                     region_cs_pips=region_cs_pips)

  ##########

  ctwas_gene_res_out <- ctwas_gene_res[,c("id", "genename", "chrom", "pos", "region_tag", "cs_index", "susie_pip", "mu2", "PVE", "z", "num_eqtl")]
  ctwas_gene_res_out <- dplyr::rename(ctwas_gene_res_out, PIP="susie_pip", tau2="mu2")

  write.csv(ctwas_gene_res_out, file=paste0("output/full_gene_results/IBD_", weight,".csv"), row.names=F)
}
[1] 1
[1] 2
[1] 3
[1] 4
[1] 5
[1] 6
[1] 7
[1] 8
[1] 9
[1] 10
[1] 11
[1] 12
[1] 13
[1] 14
[1] 15
[1] 16
[1] 17
[1] 18
[1] 19
[1] 20
[1] 21
[1] 22
[1] 23
[1] 24
[1] 25
[1] 26
[1] 27
[1] 28
[1] 29
[1] 30
[1] 31
[1] 32
[1] 33
[1] 34
[1] 35
[1] 36
[1] 37
[1] 38
[1] 39
[1] 40
[1] 41
[1] 42
[1] 43
[1] 44
[1] 45
[1] 46
[1] 47
[1] 48
[1] 49# save(df, file=paste(trait_dir, "results_df_nolnc.RData", sep="/"))
load(paste(trait_dir, "results_df_nolnc.RData", sep="/"))
output <- data.frame(weight=names(df),
prior_g=unlist(lapply(df, function(x){x$prior["gene"]})),
prior_s=unlist(lapply(df, function(x){x$prior["snp"]})),
prior_var_g=unlist(lapply(df, function(x){x$prior_var["gene"]})),
prior_var_s=unlist(lapply(df, function(x){x$prior_var["snp"]})),
pve_g=unlist(lapply(df, function(x){x$pve["gene"]})),
pve_s=unlist(lapply(df, function(x){x$pve["snp"]})),
n_ctwas=unlist(lapply(df, function(x){length(x$ctwas)})),
n_twas=unlist(lapply(df, function(x){length(x$twas)})),
row.names=NULL,
stringsAsFactors=F)Plot estimated prior parameters and PVE
#plot estimated group prior

output <- output[order(-output$prior_g),]

par(mar=c(10.1, 4.1, 4.1, 2.1))

plot(output$prior_g, type="l", ylim=c(0, max(output$prior_g, output$prior_s)*1.1),
     xlab="", ylab="Estimated Group Prior", xaxt = "n", col="blue")
lines(output$prior_s)

axis(1, at = 1:nrow(output),
     labels = output$weight,
     las=2,
     cex.axis=0.6)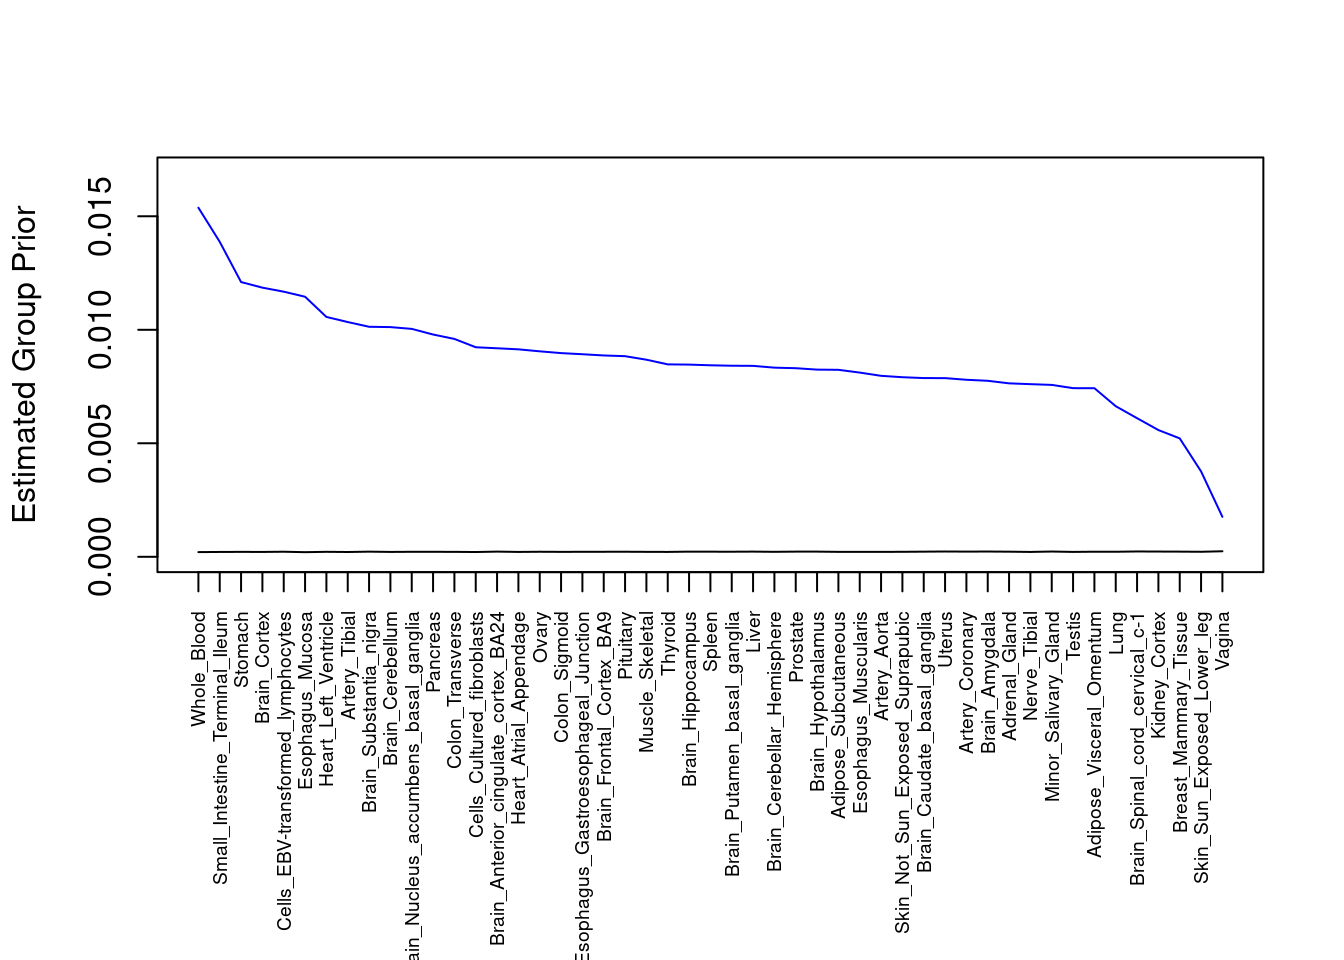
| Version | Author | Date |
|---|---|---|
| 65634fd | wesleycrouse | 2022-06-30 |
####################
#plot estimated group prior variance

par(mar=c(10.1, 4.1, 4.1, 2.1))

plot(output$prior_var_g, type="l", ylim=c(0, max(output$prior_var_g, output$prior_var_s)*1.1),
     xlab="", ylab="Estimated Group Prior Variance", xaxt = "n", col="blue")
lines(output$prior_var_s)

axis(1, at = 1:nrow(output),
     labels = output$weight,
     las=2,
     cex.axis=0.6)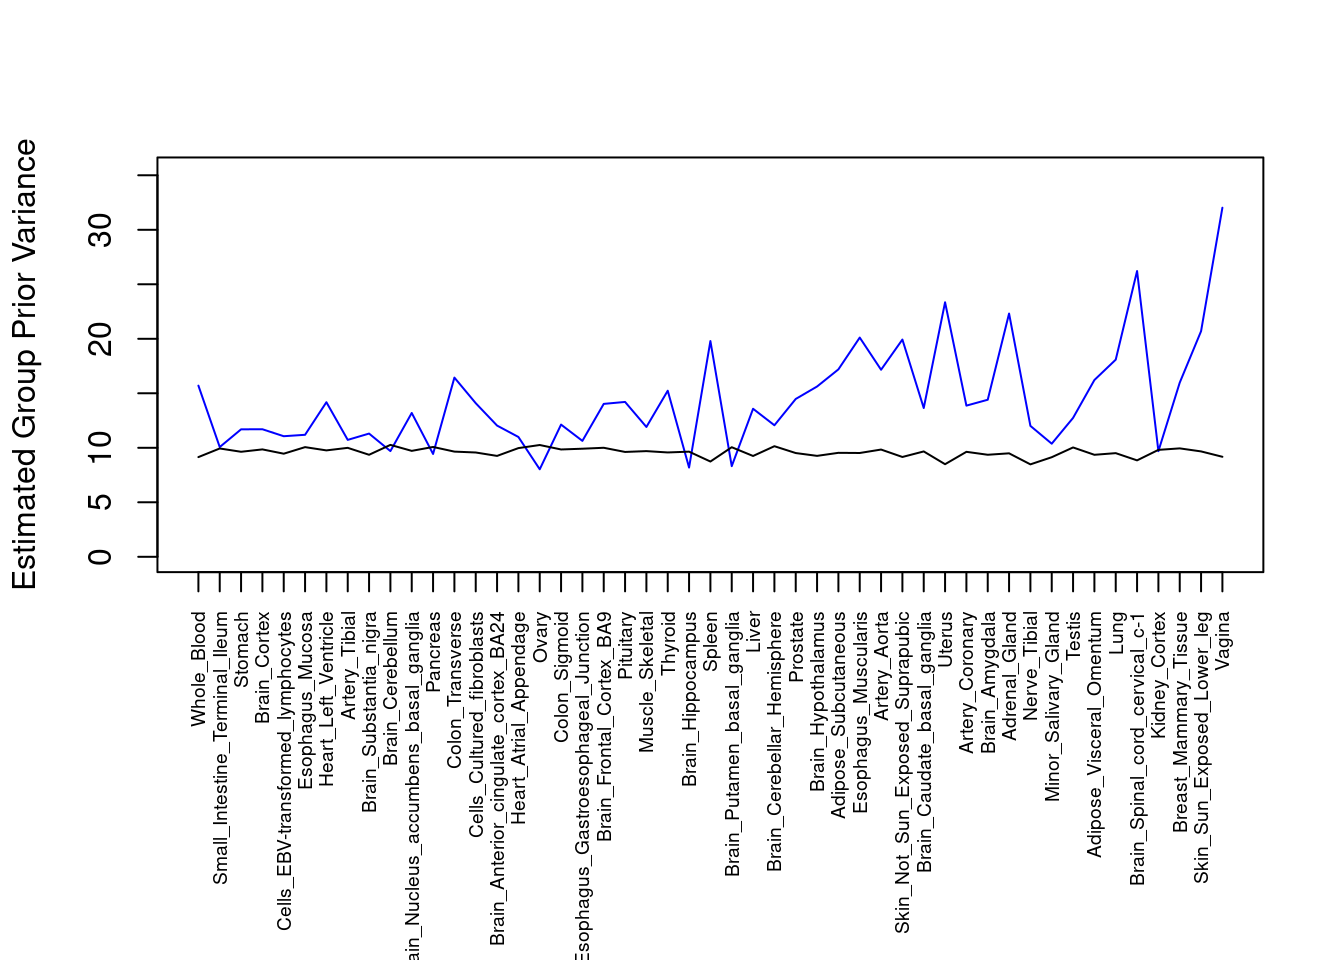
| Version | Author | Date |
|---|---|---|
| 65634fd | wesleycrouse | 2022-06-30 |
####################
#plot PVE

output <- output[order(-output$pve_g),]

par(mar=c(10.1, 4.1, 4.1, 2.1))

plot(output$pve_g, type="l", ylim=c(0, max(output$pve_g+output$pve_s)*1.1),
     xlab="", ylab="Estimated PVE", xaxt = "n", col="blue")
lines(output$pve_s)
lines(output$pve_g+output$pve_s, lty=2)

axis(1, at = 1:nrow(output),
     labels = output$weight,
     las=2,
     cex.axis=0.6)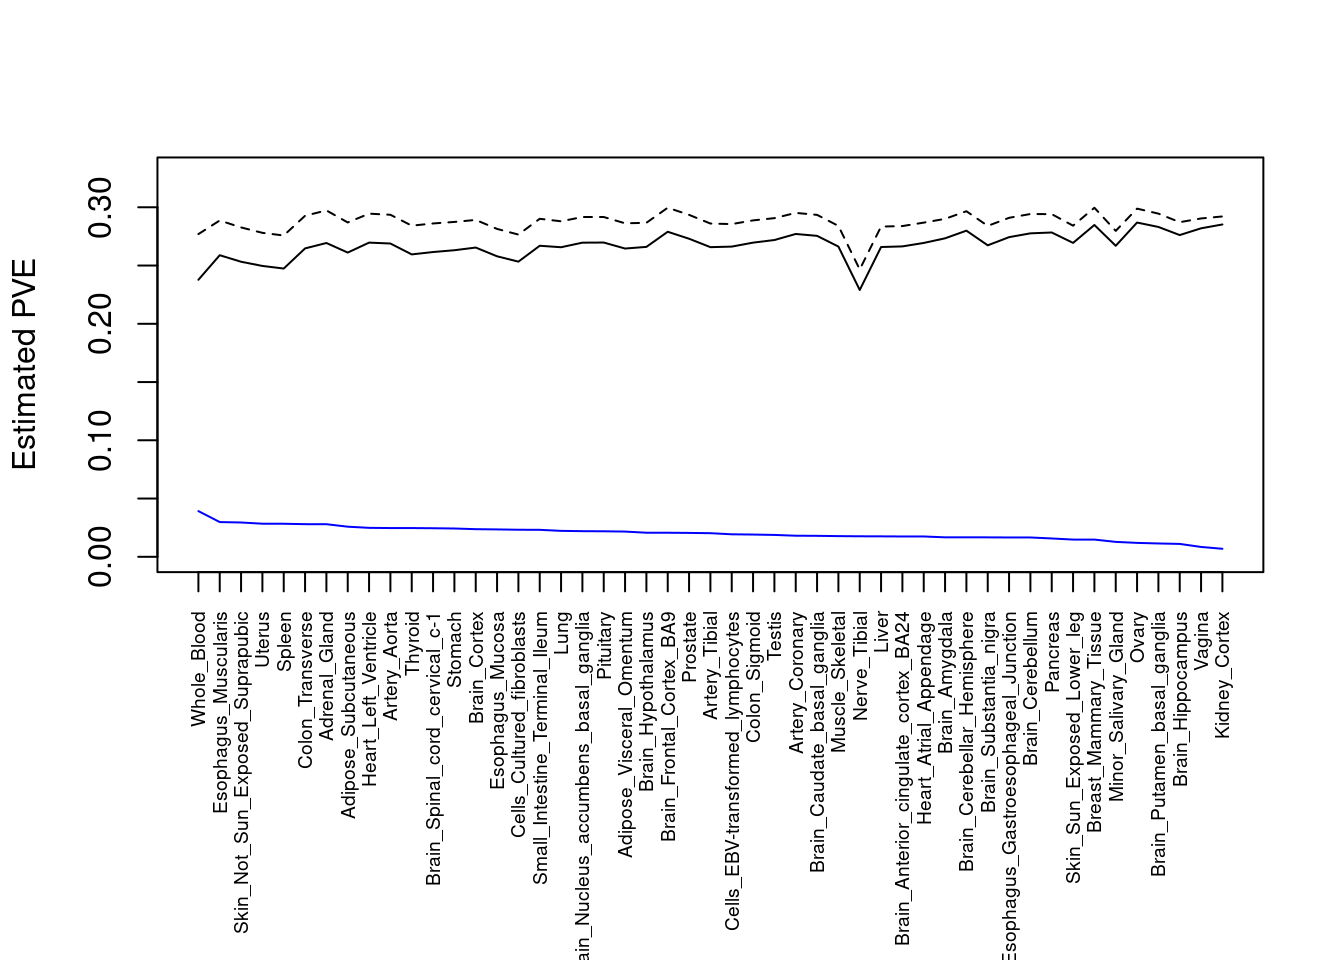
| Version | Author | Date |
|---|---|---|
| 65634fd | wesleycrouse | 2022-06-30 |
Number of cTWAS and TWAS genes
cTWAS genes are the set of genes with PIP>0.8 in any tissue. TWAS genes are the set of genes with significant z score (Bonferroni within tissue) in any tissue.
#plot number of significant cTWAS and TWAS genes in each tissue
plot(output$n_ctwas, output$n_twas, xlab="Number of cTWAS Genes", ylab="Number of TWAS Genes")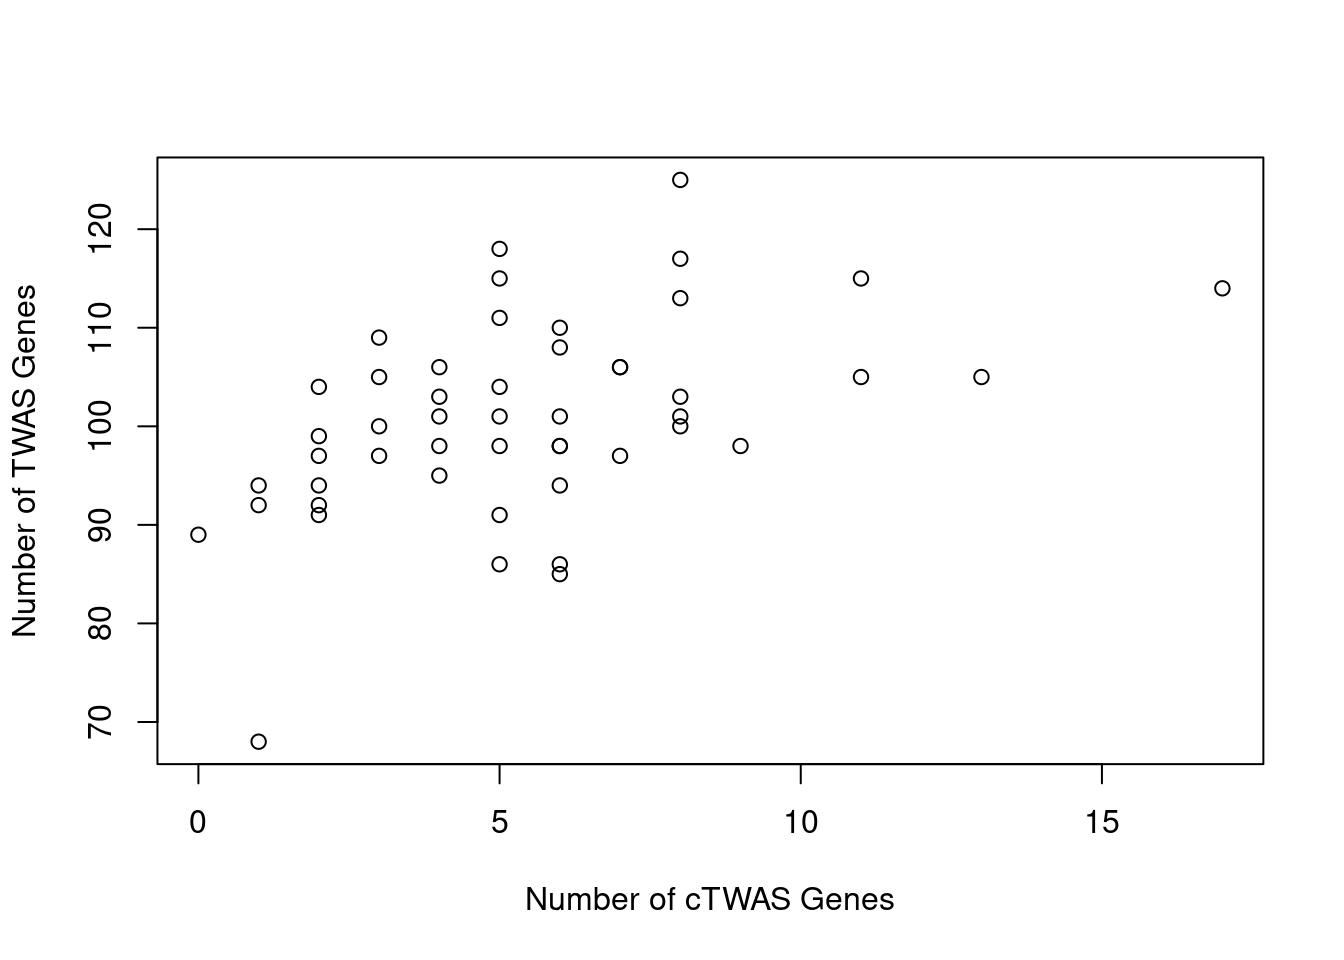
| Version | Author | Date |
|---|---|---|
| 65634fd | wesleycrouse | 2022-06-30 |
#number of ctwas_genes
ctwas_genes <- unique(unlist(lapply(df, function(x){x$ctwas})))
length(ctwas_genes)
[1] 110#number of twas_genes
twas_genes <- unique(unlist(lapply(df, function(x){x$twas})))
length(twas_genes)[1] 490Enrichment analysis for cTWAS genes
GO
#enrichment for cTWAS genes using enrichR
library(enrichR)
Welcome to enrichR
Checking connection ... Enrichr ... Connection is Live!
FlyEnrichr ... Connection is available!
WormEnrichr ... Connection is available!
YeastEnrichr ... Connection is available!
FishEnrichr ... Connection is available!dbs <- c("GO_Biological_Process_2021", "GO_Cellular_Component_2021", "GO_Molecular_Function_2021")
GO_enrichment <- enrichr(ctwas_genes, dbs)Uploading data to Enrichr... Done.
Querying GO_Biological_Process_2021... Done.
Querying GO_Cellular_Component_2021... Done.
Querying GO_Molecular_Function_2021... Done.
Parsing results... Done.for (db in dbs){
cat(paste0(db, "\n\n"))
enrich_results <- GO_enrichment[[db]]
enrich_results <- enrich_results[enrich_results$Adjusted.P.value<0.05,c("Term", "Overlap", "Adjusted.P.value", "Genes")]
print(enrich_results)
print(plotEnrich(GO_enrichment[[db]]))
}GO_Biological_Process_2021
Term Overlap Adjusted.P.value Genes
1 cytokine-mediated signaling pathway (GO:0019221) 20/621 2.122735e-07 CIITA;TNFRSF6B;FCER1G;TNFSF15;CCL20;IL1R2;IFNGR2;STAT3;MMP9;MUC1;SOCS1;IRF3;IRF8;TNFRSF14;IRF6;CCR5;CRK;HLA-DQA1;IL18R1;IP6K2
2 cellular response to cytokine stimulus (GO:0071345) 15/482 4.002120e-05 SMAD3;CCL20;IL1R2;IFNGR2;STAT3;MMP9;ZFP36L2;SBNO2;MUC1;SOCS1;IRF8;CCR5;CRK;IL18R1;PTPN2
3 interferon-gamma-mediated signaling pathway (GO:0060333) 6/68 8.552586e-04 CIITA;IRF3;IFNGR2;IRF8;IRF6;HLA-DQA1
4 cellular response to interferon-gamma (GO:0071346) 7/121 1.517747e-03 CIITA;IRF3;CCL20;IFNGR2;IRF8;IRF6;HLA-DQA1
5 positive regulation of cytokine production (GO:0001819) 10/335 4.035479e-03 LACC1;FCER1G;IRF3;CD6;CARD9;STAT3;PRKD2;TNFRSF14;IL18R1;CD244
6 regulation of receptor binding (GO:1900120) 3/10 4.035479e-03 ADAM15;HFE;MMP9
7 positive regulation of transcription by RNA polymerase II (GO:0045944) 16/908 6.655501e-03 CIITA;CRTC3;SMAD3;STAT3;MED16;FOSL2;SBNO2;MUC1;NR5A2;PAX8;IRF3;ZGLP1;IRF8;PRKD2;IRF6;ZNF300
8 regulation of response to interferon-gamma (GO:0060330) 3/14 9.034608e-03 SOCS1;IFNGR2;PTPN2
9 positive regulation of transcription, DNA-templated (GO:0045893) 18/1183 1.098815e-02 CIITA;CRTC3;SMAD3;STAT3;MED16;FOSL2;SBNO2;NR5A2;DDX39B;PAX8;IRF3;ZGLP1;TFAM;IRF8;PRKD2;IRF6;BRD7;ZNF300
10 positive regulation of cytokine production involved in inflammatory response (GO:1900017) 3/17 1.334088e-02 CD6;CARD9;STAT3
11 regulation of T cell migration (GO:2000404) 3/20 2.008948e-02 CD200R1;CCL20;TNFRSF14
12 positive regulation of antigen receptor-mediated signaling pathway (GO:0050857) 3/21 2.139873e-02 PRKCB;RAB29;PRKD2
13 regulation of interferon-gamma-mediated signaling pathway (GO:0060334) 3/23 2.609251e-02 SOCS1;IFNGR2;PTPN2
14 neutrophil mediated immunity (GO:0002446) 10/488 2.765620e-02 SYNGR1;TSPAN14;FCER1G;FCGR2A;CARD9;SLC2A3;ITGAV;APEH;ITGAL;MMP9
15 transmembrane receptor protein tyrosine kinase signaling pathway (GO:0007169) 9/404 2.765620e-02 EFNA1;CNKSR1;RGS14;STAT3;PRKD2;ITGAV;MMP9;CRK;PTPN2
16 positive regulation of DNA-binding transcription factor activity (GO:0051091) 7/246 2.765620e-02 CRTC3;SMAD3;PRKCB;CARD9;STAT3;PRKD2;IL18R1
17 negative regulation of insulin receptor signaling pathway (GO:0046627) 3/27 2.765620e-02 SOCS1;PRKCB;PTPN2
18 negative regulation of CD8-positive, alpha-beta T cell activation (GO:2001186) 2/6 2.765620e-02 SOCS1;HFE
19 positive regulation of receptor binding (GO:1900122) 2/6 2.765620e-02 HFE;MMP9
20 cellular response to type I interferon (GO:0071357) 4/65 2.765620e-02 IRF3;IRF8;IRF6;IP6K2
21 type I interferon signaling pathway (GO:0060337) 4/65 2.765620e-02 IRF3;IRF8;IRF6;IP6K2
22 negative regulation of cellular response to insulin stimulus (GO:1900077) 3/28 2.795610e-02 SOCS1;PRKCB;PTPN2
23 cellular response to organic substance (GO:0071310) 5/123 3.304858e-02 SMAD3;LRRK2;STAT3;IL18R1;PTPN2
24 Fc-gamma receptor signaling pathway (GO:0038094) 4/72 3.570360e-02 FCER1G;FCGR2A;WIPF2;CRK
25 Fc receptor mediated stimulatory signaling pathway (GO:0002431) 4/74 3.631027e-02 FCER1G;FCGR2A;WIPF2;CRK
26 regulation of transcription by RNA polymerase II (GO:0006357) 24/2206 3.631027e-02 CIITA;CRTC3;SMAD3;PRKCB;HOXD1;STAT3;MED16;FOSL2;EFNA1;SBNO2;MUC1;NR5A2;PAX8;IRF3;SIX5;ZGLP1;SUFU;IRF8;PRKD2;IRF6;BRD7;CRK;NKX2-3;ZNF300
27 establishment of protein localization to organelle (GO:0072594) 4/76 3.631027e-02 IPO8;POM121C;STAT3;FAM53B
28 protein import into nucleus (GO:0006606) 4/76 3.631027e-02 IPO8;POM121C;STAT3;FAM53B
29 elastic fiber assembly (GO:0048251) 2/8 3.631027e-02 EFEMP2;LTBP3
30 import into nucleus (GO:0051170) 4/77 3.678968e-02 IPO8;POM121C;STAT3;FAM53B
31 regulation of T cell receptor signaling pathway (GO:0050856) 3/35 3.854269e-02 RAB29;PRKD2;PTPN2
32 positive regulation of protein phosphorylation (GO:0001934) 8/371 3.854269e-02 EFNA1;SH2D3A;HFE;LRRK2;ITLN1;PRKD2;TNFRSF14;MMP9
33 negative regulation of lipid localization (GO:1905953) 2/9 3.854269e-02 ITGAV;PTPN2
34 regulation of DNA-templated transcription in response to stress (GO:0043620) 2/9 3.854269e-02 MUC1;RGS14
35 negative regulation of alpha-beta T cell activation (GO:0046636) 2/9 3.854269e-02 HFE;TNFRSF14
36 positive regulation of production of molecular mediator of immune response (GO:0002702) 3/38 4.000456e-02 LACC1;TNFRSF14;CD244
37 nuclear export (GO:0051168) 4/84 4.000456e-02 DDX39B;POM121C;CASC3;CCHCR1
38 negative regulation of receptor binding (GO:1900121) 2/10 4.000456e-02 ADAM15;HFE
39 negative regulation of transmembrane transport (GO:0034763) 2/10 4.000456e-02 PRKCB;OAZ3
40 negative regulation of tyrosine phosphorylation of STAT protein (GO:0042532) 2/10 4.000456e-02 SOCS1;PTPN2
41 immunoglobulin mediated immune response (GO:0016064) 2/10 4.000456e-02 FCER1G;CARD9
42 positive regulation of vascular endothelial growth factor receptor signaling pathway (GO:0030949) 2/10 4.000456e-02 PRKCB;PRKD2
43 neutrophil degranulation (GO:0043312) 9/481 4.042773e-02 SYNGR1;TSPAN14;FCER1G;FCGR2A;SLC2A3;ITGAV;APEH;ITGAL;MMP9
44 neutrophil activation involved in immune response (GO:0002283) 9/485 4.042773e-02 SYNGR1;TSPAN14;FCER1G;FCGR2A;SLC2A3;ITGAV;APEH;ITGAL;MMP9
45 response to cytokine (GO:0034097) 5/150 4.042773e-02 CIITA;SMAD3;STAT3;IL18R1;PTPN2
46 protein import (GO:0017038) 4/89 4.042773e-02 IPO8;POM121C;STAT3;FAM53B
47 T cell differentiation (GO:0030217) 3/41 4.042773e-02 FCER1G;ZFP36L2;PTPN2
48 B cell mediated immunity (GO:0019724) 2/11 4.262918e-02 FCER1G;CARD9
49 positive regulation of NF-kappaB transcription factor activity (GO:0051092) 5/155 4.364551e-02 PRKCB;CARD9;STAT3;PRKD2;IL18R1
50 regulation of cytokine production involved in inflammatory response (GO:1900015) 3/43 4.364551e-02 CD6;CARD9;STAT3
51 regulation of insulin receptor signaling pathway (GO:0046626) 3/45 4.881038e-02 SOCS1;PRKCB;PTPN2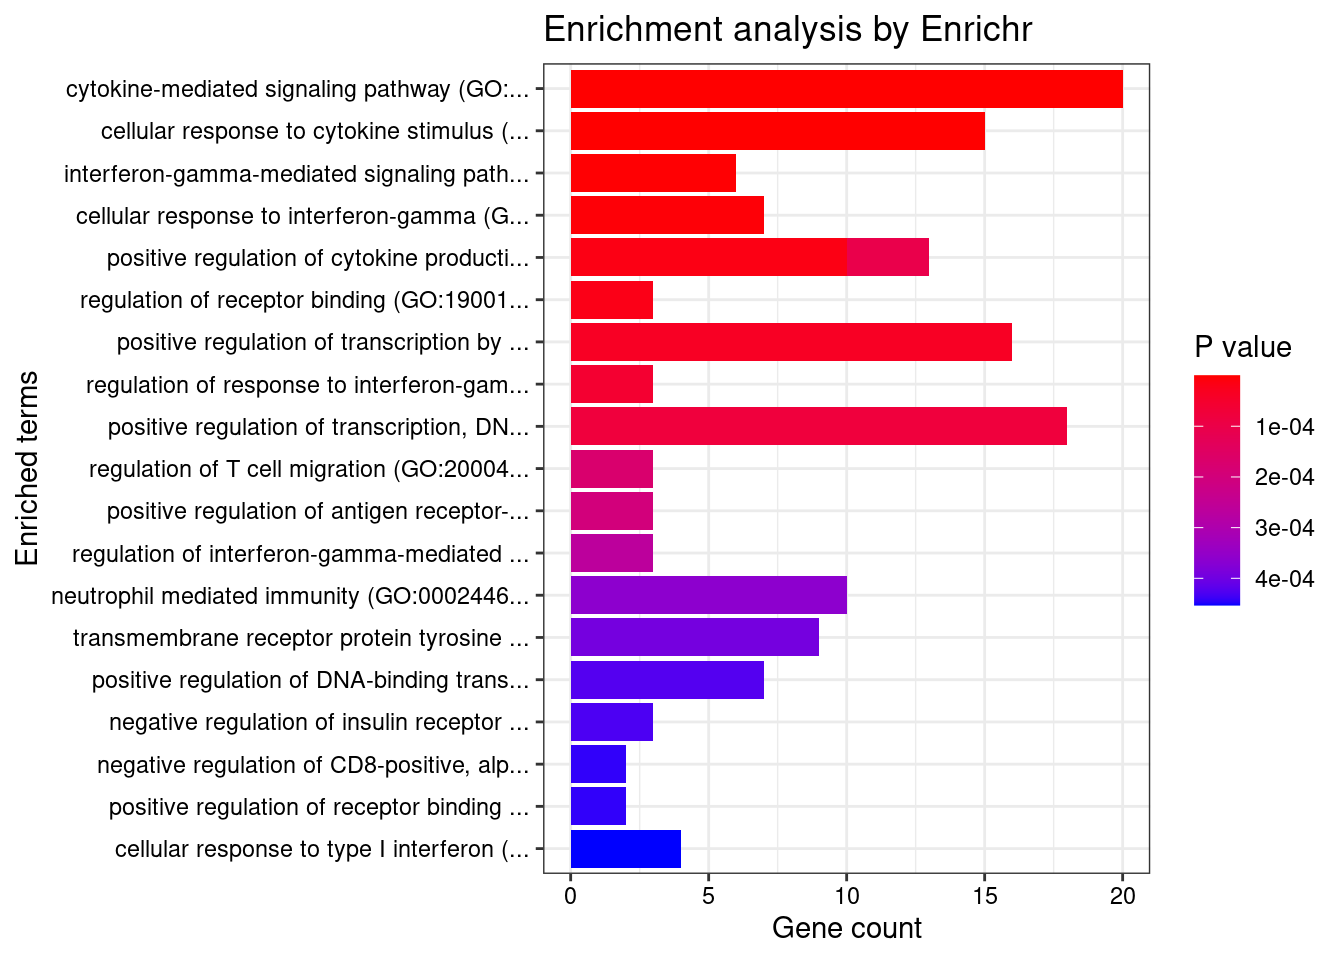
| Version | Author | Date |
|---|---|---|
| 65634fd | wesleycrouse | 2022-06-30 |
GO_Cellular_Component_2021

                                     Term Overlap Adjusted.P.value                                           Genes
1        MHC protein complex (GO:0042611)    3/20       0.02034021                            HFE;HLA-DOB;HLA-DQA1
2 secretory granule membrane (GO:0030667)   7/274       0.04742336 SYNGR1;TSPAN14;FCER1G;FCGR2A;SLC2A3;ITGAV;ITGAL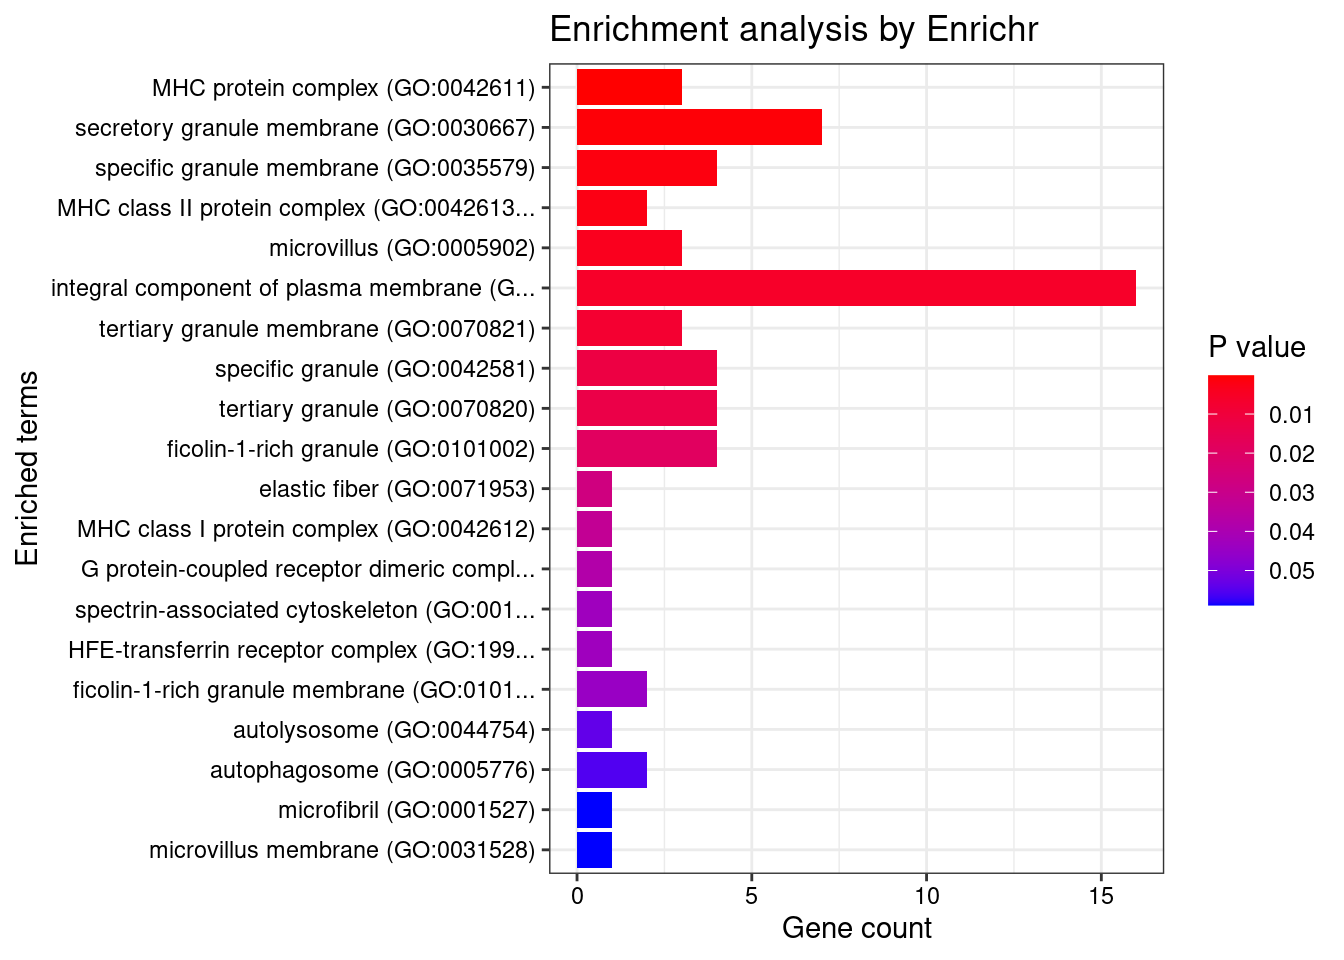
| Version | Author | Date |
|---|---|---|
| 65634fd | wesleycrouse | 2022-06-30 |
GO_Molecular_Function_2021

                                                               Term Overlap Adjusted.P.value                                                              Genes
1 transcription regulatory region nucleic acid binding (GO:0001067)   7/212       0.03167718                             CIITA;SMAD3;NR5A2;PAX8;STAT3;TFAM;BRD7
2                               protein kinase binding (GO:0019901)  10/506       0.03359886          ERRFI1;SOCS1;SMAD3;PRKCB;SUFU;STAT3;PRKD2;ITGAV;CRK;PTPN2
3        sequence-specific double-stranded DNA binding (GO:1990837)  12/712       0.03359886 CIITA;SMAD3;NR5A2;PAX8;IRF3;HOXD1;STAT3;TFAM;IRF8;IRF6;BRD7;NKX2-3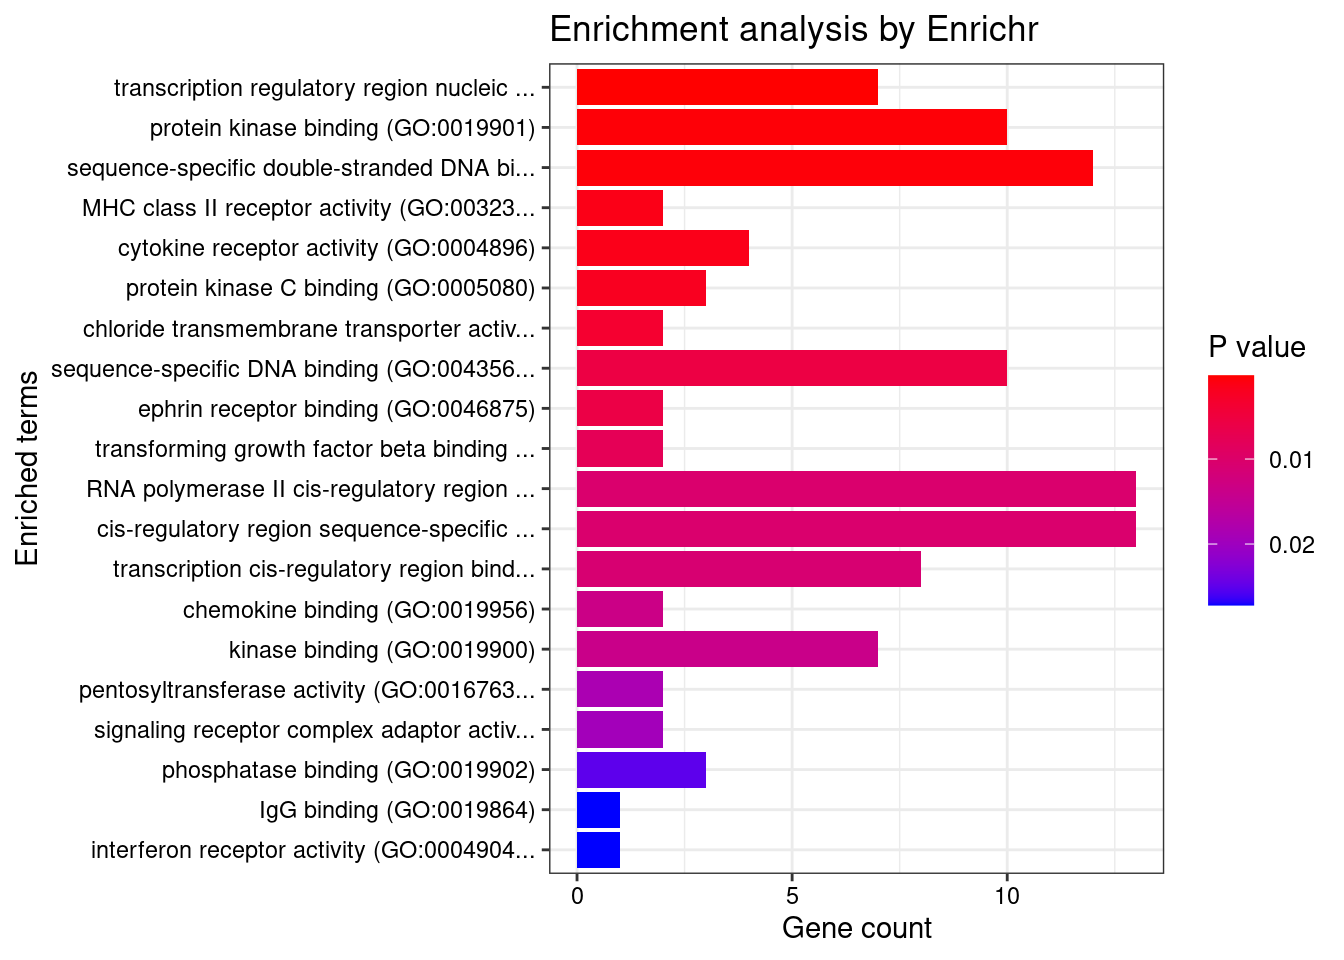
| Version | Author | Date |
|---|---|---|
| 65634fd | wesleycrouse | 2022-06-30 |
KEGG
#enrichment for cTWAS genes using KEGG

library(WebGestaltR)******************************************* ** Welcome to WebGestaltR ! ** *******************************************background <- unique(unlist(lapply(df, function(x){x$gene_pips$genename})))
#listGeneSet()
databases <- c("pathway_KEGG")
enrichResult <- WebGestaltR(enrichMethod="ORA", organism="hsapiens",
interestGene=ctwas_genes, referenceGene=background,
enrichDatabase=databases, interestGeneType="genesymbol",
referenceGeneType="genesymbol", isOutput=F)Loading the functional categories...
Loading the ID list...
Loading the reference list...
Performing the enrichment analysis...enrichResult[,c("description", "size", "overlap", "FDR", "userId")] description size overlap FDR userId
1 Inflammatory bowel disease (IBD) 57 6 0.005493655 HLA-DQA1;IL18R1;STAT3;IFNGR2;HLA-DOB;SMAD3
2 Toxoplasmosis 104 7 0.010029739 HLA-DQA1;CIITA;STAT3;IFNGR2;HLA-DOB;CCR5;SOCS1
3 Tuberculosis 157 8 0.014090336 HLA-DQA1;CARD9;LSP1;CIITA;FCGR2A;FCER1G;IFNGR2;HLA-DOB
4 Leishmaniasis 64 5 0.030162455 HLA-DQA1;FCGR2A;PRKCB;IFNGR2;HLA-DOB
5 Influenza A 150 7 0.039017653 HLA-DQA1;CIITA;PRKCB;IFNGR2;DDX39B;HLA-DOB;IRF3DisGeNET
#enrichment for cTWAS genes using DisGeNET
# devtools::install_bitbucket("ibi_group/disgenet2r")
library(disgenet2r)
disgenet_api_key <- get_disgenet_api_key(
email = "wesleycrouse@gmail.com",
password = "uchicago1" )
Sys.setenv(DISGENET_API_KEY= disgenet_api_key)
res_enrich <- disease_enrichment(entities=ctwas_genes, vocabulary = "HGNC", database = "CURATED")
if (any(res_enrich@qresult$FDR < 0.05)){
print(res_enrich@qresult[res_enrich@qresult$FDR < 0.05, c("Description", "FDR", "Ratio", "BgRatio")])
}Gene sets curated by Macarthur Lab
gene_set_dir <- "/project2/mstephens/wcrouse/gene_sets/"
gene_set_files <- c("gwascatalog.tsv",
"mgi_essential.tsv",
"core_essentials_hart.tsv",
"clinvar_path_likelypath.tsv",
"fda_approved_drug_targets.tsv")
gene_sets <- lapply(gene_set_files, function(x){as.character(read.table(paste0(gene_set_dir, x))[,1])})
names(gene_sets) <- sapply(gene_set_files, function(x){unlist(strsplit(x, "[.]"))[1]})
gene_lists <- list(ctwas_genes=ctwas_genes)
#background is union of genes analyzed in all tissue
background <- unique(unlist(lapply(df, function(x){x$gene_pips$genename})))
#genes in gene_sets filtered to ensure inclusion in background
gene_sets <- lapply(gene_sets, function(x){x[x %in% background]})
####################
hyp_score <- data.frame()
size <- c()
ngenes <- c()
for (i in 1:length(gene_sets)) {
for (j in 1:length(gene_lists)){
group1 <- length(gene_sets[[i]])
group2 <- length(as.vector(gene_lists[[j]]))
size <- c(size, group1)
Overlap <- length(intersect(gene_sets[[i]],as.vector(gene_lists[[j]])))
ngenes <- c(ngenes, Overlap)
Total <- length(background)
hyp_score[i,j] <- phyper(Overlap-1, group2, Total-group2, group1,lower.tail=F)
}
}
rownames(hyp_score) <- names(gene_sets)
colnames(hyp_score) <- names(gene_lists)
hyp_score_padj <- apply(hyp_score,2, p.adjust, method="BH", n=(nrow(hyp_score)*ncol(hyp_score)))
hyp_score_padj <- as.data.frame(hyp_score_padj)
hyp_score_padj$gene_set <- rownames(hyp_score_padj)
hyp_score_padj$nset <- size
hyp_score_padj$ngenes <- ngenes
hyp_score_padj$percent <- ngenes/size
hyp_score_padj <- hyp_score_padj[order(hyp_score_padj$ctwas_genes),]
colnames(hyp_score_padj)[1] <- "padj"
hyp_score_padj <- hyp_score_padj[,c(2:5,1)]
rownames(hyp_score_padj)<- NULL
hyp_score_padj gene_set nset ngenes percent padj
1 gwascatalog 5967 72 0.012066365 3.243586e-10
2 mgi_essential 2304 26 0.011284722 6.775692e-03
3 fda_approved_drug_targets 352 6 0.017045455 4.402784e-02
4 clinvar_path_likelypath 2771 22 0.007939372 2.143611e-01
5 core_essentials_hart 265 0 0.000000000 1.000000e+00Enrichment analysis for TWAS genes
#enrichment for TWAS genes
dbs <- c("GO_Biological_Process_2021", "GO_Cellular_Component_2021", "GO_Molecular_Function_2021")
GO_enrichment <- enrichr(twas_genes, dbs)Uploading data to Enrichr... Done.
Querying GO_Biological_Process_2021... Done.
Querying GO_Cellular_Component_2021... Done.
Querying GO_Molecular_Function_2021... Done.
Parsing results... Done.for (db in dbs){
cat(paste0(db, "\n\n"))
enrich_results <- GO_enrichment[[db]]
enrich_results <- enrich_results[enrich_results$Adjusted.P.value<0.05,c("Term", "Overlap", "Adjusted.P.value", "Genes")]
print(enrich_results)
print(plotEnrich(GO_enrichment[[db]]))
}GO_Biological_Process_2021
Term Overlap Adjusted.P.value Genes
1 cytokine-mediated signaling pathway (GO:0019221) 62/621 8.234234e-18 CSF3;CIITA;CD40;TNFRSF6B;IL23R;RORC;IL27;IL18RAP;PSMD3;MAP3K8;JAK2;FCER1G;GPR35;IL1R1;IFNGR2;IL1R2;IL13;HLA-B;HLA-C;TYK2;MMP9;PSMA6;IRF1;LTA;IRF8;IRF6;HLA-DQB2;HLA-DQB1;CCL13;NUMBL;CAMK2A;PDGFB;CUL1;NOD2;IL1RL1;MUC1;BCL2L11;SOCS1;CXCR2;TNFRSF14;HLA-DQA2;CAMK2G;HLA-DQA1;IL12RB2;IP6K2;STAT5A;STAT5B;HLA-DRB5;CCL20;TNFSF15;STAT3;LIF;PSMB9;IL4;POMC;IL2RA;HLA-DPB1;HLA-DRA;TNFSF8;TRIM31;HLA-DRB1;IL18R1
2 interferon-gamma-mediated signaling pathway (GO:0060333) 19/68 2.668896e-12 CIITA;HLA-DRB5;IFNGR2;CAMK2A;HLA-B;HLA-C;IRF1;HLA-DPB1;IRF8;HLA-DRA;IRF6;JAK2;TRIM31;HLA-DQA2;CAMK2G;HLA-DQB2;HLA-DQA1;HLA-DRB1;HLA-DQB1
3 cellular response to interferon-gamma (GO:0071346) 23/121 1.769135e-11 CCL13;HLA-DRB5;CIITA;CCL20;IFNGR2;CAMK2A;HLA-B;HLA-C;AIF1;IRF1;HLA-DPB1;HLA-DRA;IRF8;IRF6;JAK2;TRIM31;HLA-DQA2;CAMK2G;HLA-DQA1;HLA-DRB1;SLC26A6;HLA-DQB2;HLA-DQB1
4 cellular response to cytokine stimulus (GO:0071345) 38/482 1.805535e-07 CCL13;CSF3;NUMBL;CD40;IL23R;GBA;RORC;AIF1;ZFP36L2;ZFP36L1;MUC1;BCL2L11;SOCS1;HYAL1;JAK2;IL12RB2;STAT5A;STAT5B;SMAD3;CCL20;IL1R1;IFNGR2;IL1R2;STAT3;IL13;LIF;TYK2;MMP9;IRGM;RHOA;IL4;POMC;IL2RA;IRF1;IRF8;SLC26A6;PTPN2;IL18R1
5 antigen processing and presentation of exogenous peptide antigen via MHC class II (GO:0019886) 16/98 1.087611e-06 HLA-DRB5;FCER1G;KIF11;HLA-DMA;HLA-DMB;HLA-DPB1;HLA-DRA;HLA-DOA;FCGR2B;HLA-DOB;HLA-DQA2;AP1M2;HLA-DQA1;HLA-DRB1;HLA-DQB2;HLA-DQB1
6 antigen processing and presentation of peptide antigen via MHC class II (GO:0002495) 16/100 1.230353e-06 HLA-DRB5;FCER1G;KIF11;HLA-DMA;HLA-DMB;HLA-DPB1;HLA-DRA;HLA-DOA;FCGR2B;HLA-DOB;HLA-DQA2;AP1M2;HLA-DQA1;HLA-DRB1;HLA-DQB2;HLA-DQB1
7 antigen processing and presentation of exogenous peptide antigen (GO:0002478) 16/103 1.644742e-06 HLA-DRB5;FCER1G;KIF11;HLA-DMA;HLA-DMB;HLA-DPB1;HLA-DRA;HLA-DOA;FCGR2B;HLA-DOB;HLA-DQA2;AP1M2;HLA-DQA1;HLA-DRB1;HLA-DQB2;HLA-DQB1
8 antigen receptor-mediated signaling pathway (GO:0050851) 18/185 2.520140e-04 DENND1B;HLA-DRB5;PRKCB;CUL1;BTNL2;LIME1;PSMB9;PSMA6;PSMD3;HLA-DPB1;HLA-DRA;HLA-DQA2;ICOSLG;HLA-DQA1;HLA-DRB1;LAT;HLA-DQB2;HLA-DQB1
9 T cell receptor signaling pathway (GO:0050852) 16/158 5.443705e-04 DENND1B;HLA-DRB5;CUL1;BTNL2;PSMB9;PSMA6;PSMD3;HLA-DPB1;HLA-DRA;HLA-DQA2;ICOSLG;HLA-DQA1;HLA-DRB1;LAT;HLA-DQB2;HLA-DQB1
10 positive regulation of cytokine production (GO:0001819) 24/335 8.286992e-04 PTGER4;CD40;FCER1G;IL1R1;IL23R;IL13;CARD9;STAT3;IL27;PARK7;NOD2;AGPAT1;LY9;AIF1;IL4;LACC1;CD6;IRF1;HLA-DPB1;POLR2E;TNFRSF14;IL18R1;CD244;IL12RB2
11 peptide antigen assembly with MHC protein complex (GO:0002501) 4/6 1.284959e-03 HLA-DMA;HLA-DMB;HLA-DRA;HLA-DRB1
12 regulation of immune response (GO:0050776) 16/179 2.065489e-03 DENND1B;CD40;ITGA4;HLA-B;HLA-C;ICAM5;ADCY7;IL4;FCGR3A;NCR3;FCGR2A;IRF1;HLA-DRA;FCGR2B;HLA-DRB1;MICB
13 antigen processing and presentation of endogenous peptide antigen (GO:0002483) 5/14 2.725626e-03 ERAP2;TAP2;TAP1;HLA-DRA;HLA-DRB1
14 regulation of response to interferon-gamma (GO:0060330) 5/14 2.725626e-03 SOCS1;IFNGR2;CDC37;JAK2;PTPN2
15 regulation of interferon-gamma-mediated signaling pathway (GO:0060334) 6/23 2.725626e-03 SOCS1;IFNGR2;CDC37;JAK2;IRGM;PTPN2
16 antigen processing and presentation of exogenous peptide antigen via MHC class I (GO:0042590) 10/78 3.463859e-03 PSMA6;FCER1G;PSMD3;TAP2;HLA-B;TAP1;HLA-C;ITGAV;LNPEP;PSMB9
17 cellular response to tumor necrosis factor (GO:0071356) 16/194 3.890772e-03 CCL13;CD40;TNFRSF6B;TNFSF15;CCL20;GBA;ZFP36L2;PSMB9;ZFP36L1;PSMA6;HYAL1;PSMD3;LTA;TNFSF8;TNFRSF14;JAK2
18 regulation of MAP kinase activity (GO:0043405) 11/97 3.890772e-03 CD40;EDN3;RGS14;LRRK2;GBA;ERBB2;PDGFB;MST1R;NOD2;TRIB1;LIME1
19 interleukin-23-mediated signaling pathway (GO:0038155) 4/9 5.678774e-03 IL23R;STAT3;TYK2;JAK2
20 regulation of immune effector process (GO:0002697) 8/53 5.678774e-03 C4B;C4A;C7;HLA-DRA;FCGR2B;CFB;HLA-DRB1;C2
21 regulation of B cell activation (GO:0050864) 6/28 6.548234e-03 IL4;NOD2;FCGR2B;IKZF3;ZFP36L2;ZFP36L1
22 inflammatory response (GO:0006954) 17/230 7.019847e-03 PTGER4;CCL13;CD40;CIITA;PTGIR;CCL20;STAT3;LYZ;AIF1;IL4;NCR3;HYAL1;IL2RA;CXCR2;REL;FCGR2B;LAT
23 response to cytokine (GO:0034097) 13/150 1.014533e-02 CSF3;CD40;CIITA;SMAD3;IL1R1;IL23R;STAT3;RHOA;SELP;REL;JAK2;PTPN2;IL18R1
24 regulation of T cell proliferation (GO:0042129) 9/76 1.044365e-02 IL4;HLA-DMB;CD6;IL23R;HLA-DPB1;IL27;TNFSF8;AIF1;HLA-DRB1
25 regulation of T cell migration (GO:2000404) 5/20 1.044365e-02 CCL20;TNFRSF14;CCR6;AIF1;RHOA
26 inositol phosphate biosynthetic process (GO:0032958) 4/11 1.044365e-02 ITPKC;IPMK;IP6K1;IP6K2
27 positive regulation of cellular respiration (GO:1901857) 4/11 1.044365e-02 IL4;PRELID1;NUPR1;PARK7
28 positive regulation of transcription, DNA-templated (GO:0045893) 50/1183 1.180052e-02 CSF3;CIITA;CD40;CRTC3;ELL;THRA;RORC;PARK7;LITAF;ETS2;HHEX;NFATC2IP;MLX;RFPL1;TET2;RUNX3;POU5F1;MED24;NR5A2;DDX39B;TFR2;IRF1;IRF8;IRF6;ATF6B;NOTCH4;SATB2;PDGFB;NOD2;NFIL3;NSD1;HSF1;ERBB2;TNNI2;BRD7;ZNF300;STAT5B;DR1;EGR2;SMAD3;STAT3;LIF;PBX2;FOSL2;IL4;POMC;ZGLP1;REL;QRICH1;HLA-DRB1
29 positive regulation of DNA-binding transcription factor activity (GO:0051091) 17/246 1.180052e-02 CD40;CSF3;CRTC3;SMAD3;PRKCB;CARD9;STAT3;CAMK2A;ARID5B;PARK7;NOD2;PSMA6;IL18RAP;HSF1;PLPP3;TRIM31;IL18R1
30 antigen processing and presentation of peptide antigen via MHC class I (GO:0002474) 6/33 1.180052e-02 FCER1G;ERAP2;TAP2;HLA-B;HLA-C;TAP1
31 negative regulation of inflammatory response to antigenic stimulus (GO:0002862) 12/136 1.180052e-02 PTGER4;POMC;GPR25;FCGR3A;PTGIR;FCGR2A;PRKAR2A;GPBAR1;ADCY3;FCGR2B;ADCY7;HLA-DRB1
32 regulation of CD4-positive, alpha-beta T cell differentiation (GO:0043370) 4/12 1.296222e-02 SOCS1;HLA-DRA;RUNX3;HLA-DRB1
33 regulation of interleukin-10 production (GO:0032653) 7/48 1.306924e-02 IL4;IL23R;STAT3;IL13;NOD2;FCGR2B;HLA-DRB1
34 regulation of defense response (GO:0031347) 9/83 1.577081e-02 PSMA6;CYLD;LACC1;IL1R1;IRF1;PARK7;NOD2;JAK2;FCGR2B
35 cellular response to organic substance (GO:0071310) 11/123 1.754087e-02 STAT5B;CSF3;SMAD3;LRRK2;ERBB2;STAT3;PDGFB;PARK7;RHOA;PTPN2;IL18R1
36 negative regulation of inflammatory response (GO:0050728) 15/212 1.792709e-02 PTGER4;GPR25;PTGIR;IL13;GBA;GPBAR1;ADCY3;ADCY7;IL4;POMC;FCGR3A;FCGR2A;PRKAR2A;HLA-DRB1;PTPN2
37 regulation of tyrosine phosphorylation of STAT protein (GO:0042509) 8/68 1.792709e-02 IL4;CD40;SOCS1;IL23R;STAT3;LIF;JAK2;PTPN2
38 regulation of intracellular pH (GO:0051453) 6/37 1.792709e-02 CLN3;SLC9A4;LRRK2;SLC26A3;TM9SF4;SLC26A6
39 regulation of T-helper cell differentiation (GO:0045622) 3/6 1.792709e-02 HLA-DRA;IL27;HLA-DRB1
40 intracellular pH elevation (GO:0051454) 3/6 1.792709e-02 CLN3;SLC26A3;SLC26A6
41 positive regulation of protein serine/threonine kinase activity (GO:0071902) 10/106 1.792709e-02 CD40;CCNY;EDN3;LRRK2;ERBB2;PDGFB;MST1R;NOD2;IRGM;RHOA
42 growth hormone receptor signaling pathway via JAK-STAT (GO:0060397) 4/14 1.792709e-02 STAT5A;STAT5B;STAT3;JAK2
43 immune response-regulating cell surface receptor signaling pathway (GO:0002768) 4/14 1.792709e-02 BAG6;CD40;NCR3;MICB
44 T-helper cell differentiation (GO:0042093) 4/14 1.792709e-02 PTGER4;IL4;GPR183;RORC
45 positive regulation of lymphocyte migration (GO:2000403) 4/14 1.792709e-02 CCL20;TNFRSF14;AIF1;RHOA
46 interleukin-27-mediated signaling pathway (GO:0070106) 4/15 2.345338e-02 STAT3;IL27;TYK2;JAK2
47 antigen processing and presentation of exogenous peptide antigen via MHC class I, TAP-dependent (GO:0002479) 8/73 2.351257e-02 PSMA6;PSMD3;TAP2;HLA-B;TAP1;HLA-C;ITGAV;PSMB9
48 negative regulation of mitotic cell cycle phase transition (GO:1901991) 9/92 2.351257e-02 PSMA6;GPR132;RFPL1;PSMD3;CUL1;BRD7;ZFP36L2;ZFP36L1;PSMB9
49 response to glucocorticoid (GO:0051384) 5/27 2.351257e-02 BCL2L11;GOT1;ZFP36L2;ZFP36L1;UBE2L3
50 cellular response to interleukin-1 (GO:0071347) 12/155 2.351257e-02 PSMA6;CCL13;CD40;IL1R1;HYAL1;CCL20;IL1R2;PSMD3;CUL1;MAP3K8;NOD2;PSMB9
51 positive regulation of interferon-gamma production (GO:0032729) 7/57 2.351257e-02 IL1R1;IL23R;HLA-DPB1;IL27;IL18R1;CD244;IL12RB2
52 cellular response to interleukin-18 (GO:0071351) 3/7 2.351257e-02 IL18RAP;PDGFB;IL18R1
53 interleukin-18-mediated signaling pathway (GO:0035655) 3/7 2.351257e-02 IL18RAP;PDGFB;IL18R1
54 T-helper 17 cell differentiation (GO:0072539) 3/7 2.351257e-02 STAT3;RORC;LY9
55 nucleotide-binding oligomerization domain containing 2 signaling pathway (GO:0070431) 3/7 2.351257e-02 LACC1;NOD2;IRGM
56 positive regulation of lymphocyte proliferation (GO:0050671) 8/75 2.351257e-02 IL4;CD40;HLA-DMB;CD6;IL23R;GPR183;HLA-DPB1;AIF1
57 positive regulation of transcription by RNA polymerase II (GO:0045944) 39/908 2.351257e-02 CSF3;CIITA;CD40;CRTC3;ELL;THRA;ATF6B;NOTCH4;SATB2;PDGFB;PARK7;NOD2;LITAF;HHEX;MUC1;HSF1;NFATC2IP;MLX;ZNF300;STAT5B;DR1;EGR2;SMAD3;STAT3;TET2;LIF;PBX2;POU5F1;FOSL2;IL4;POMC;MED24;NR5A2;TFR2;ZGLP1;IRF1;REL;IRF8;IRF6
58 cellular response to corticosteroid stimulus (GO:0071384) 4/16 2.351257e-02 BCL2L11;ZFP36L2;ZFP36L1;UBE2L3
59 dendritic cell chemotaxis (GO:0002407) 4/16 2.351257e-02 CXCR1;GPR183;CXCR2;CCR6
60 polyol biosynthetic process (GO:0046173) 4/16 2.351257e-02 ITPKC;IPMK;IP6K1;IP6K2
61 nucleotide-binding oligomerization domain containing signaling pathway (GO:0070423) 5/28 2.406527e-02 CYLD;LACC1;NOD2;AAMP;IRGM
62 regulation of inflammatory response to antigenic stimulus (GO:0002861) 11/137 2.496266e-02 PTGER4;POMC;GPR25;FCGR3A;PTGIR;FCGR2A;PRKAR2A;GPBAR1;ADCY3;ADCY7;HLA-DRB1
63 tumor necrosis factor-mediated signaling pathway (GO:0033209) 10/116 2.496266e-02 PSMA6;CD40;TNFRSF6B;TNFSF15;PSMD3;LTA;TNFRSF14;TNFSF8;JAK2;PSMB9
64 positive regulation of cytokine production involved in inflammatory response (GO:1900017) 4/17 2.827049e-02 CD6;CARD9;STAT3;NOD2
65 antigen processing and presentation of endogenous peptide antigen via MHC class I (GO:0019885) 3/8 2.936657e-02 ERAP2;TAP2;TAP1
66 antigen processing and presentation of exogenous peptide antigen via MHC class I, TAP-independent (GO:0002480) 3/8 2.936657e-02 HLA-B;HLA-C;LNPEP
67 regulation of apoptotic cell clearance (GO:2000425) 3/8 2.936657e-02 C4B;C4A;C2
68 positive regulation of apoptotic cell clearance (GO:2000427) 3/8 2.936657e-02 C4B;C4A;C2
69 positive regulation of CD4-positive, alpha-beta T cell differentiation (GO:0043372) 3/8 2.936657e-02 SOCS1;HLA-DRA;HLA-DRB1
70 positive regulation of MHC class II biosynthetic process (GO:0045348) 3/8 2.936657e-02 IL4;CIITA;JAK2
71 response to interferon-gamma (GO:0034341) 8/80 2.941105e-02 CCL13;CD40;CIITA;CCL20;IL23R;IRF8;AIF1;SLC26A6
72 cellular response to glucocorticoid stimulus (GO:0071385) 4/18 3.083113e-02 BCL2L11;ZFP36L2;ZFP36L1;UBE2L3
73 dendritic cell migration (GO:0036336) 4/18 3.083113e-02 CXCR1;GPR183;CXCR2;CCR6
74 positive regulation of response to endoplasmic reticulum stress (GO:1905898) 4/18 3.083113e-02 BAG6;BCL2L11;FCGR2B;BOK
75 regulation of cellular pH (GO:0030641) 5/31 3.185544e-02 CLN3;LACC1;SLC9A4;TM9SF4;SLC26A6
76 cellular response to interleukin-7 (GO:0098761) 4/19 3.524756e-02 STAT5A;STAT5B;SOCS1;STAT3
77 regulation of lymphocyte proliferation (GO:0050670) 4/19 3.524756e-02 LST1;IL27;TNFSF8;IKZF3
78 interleukin-7-mediated signaling pathway (GO:0038111) 4/19 3.524756e-02 STAT5A;STAT5B;SOCS1;STAT3
79 cellular response to type I interferon (GO:0071357) 7/65 3.524756e-02 IRF1;HLA-B;HLA-C;IRF8;TYK2;IRF6;IP6K2
80 type I interferon signaling pathway (GO:0060337) 7/65 3.524756e-02 IRF1;HLA-B;HLA-C;IRF8;TYK2;IRF6;IP6K2
81 neutrophil mediated immunity (GO:0002446) 24/488 3.524756e-02 RAB5C;FCER1G;RNASET2;CARD9;HSPA6;HLA-B;HLA-C;NBEAL2;LYZ;APEH;MMP9;RHOA;TSPAN14;SYNGR1;FCGR2A;CXCR1;PLAU;PSMD3;TMBIM1;NEU1;ORMDL3;CXCR2;ITGAV;ATP6V0A1
82 cellular response to interleukin-9 (GO:0071355) 3/9 3.604187e-02 STAT5A;STAT5B;STAT3
83 interleukin-9-mediated signaling pathway (GO:0038113) 3/9 3.604187e-02 STAT5A;STAT5B;STAT3
84 positive regulation of memory T cell differentiation (GO:0043382) 3/9 3.604187e-02 IL23R;HLA-DRA;HLA-DRB1
85 positive regulation of T cell proliferation (GO:0042102) 7/66 3.676979e-02 IL4;HLA-DMB;CD6;IL23R;HLA-DPB1;AIF1;ICOSLG
86 regulation of interferon-gamma production (GO:0032649) 8/86 3.913161e-02 IL1R1;IL23R;HLA-DPB1;IL27;IL18R1;CD244;HLA-DRB1;IL12RB2
87 regulation of lymphocyte differentiation (GO:0045619) 4/20 3.948745e-02 PRELID1;IKZF3;ZFP36L2;ZFP36L1
88 growth hormone receptor signaling pathway (GO:0060396) 4/20 3.948745e-02 STAT5A;STAT5B;STAT3;JAK2
89 regulation of response to external stimulus (GO:0032101) 10/130 4.233738e-02 LACC1;CYLD;PSMA6;IL1R1;IRF1;SAG;PARK7;NOD2;JAK2;FCGR2B
90 MAPK cascade (GO:0000165) 17/303 4.233738e-02 PTGER4;LRRK2;CAMK2A;PDGFB;CUL1;ZFP36L2;PSMB9;ZFP36L1;PSMA6;IL2RA;PSMD3;HSF1;ERBB2;MAP3K8;ITGAV;JAK2;LAT
91 positive regulation of MAP kinase activity (GO:0043406) 7/69 4.333277e-02 CD40;EDN3;LRRK2;ERBB2;PDGFB;NOD2;MST1R
92 negative regulation of immune response (GO:0050777) 12/178 4.333277e-02 PTGER4;POMC;GPR25;FCGR3A;PTGIR;FCGR2A;PRKAR2A;GPBAR1;ADCY3;FCGR2B;ADCY7;HLA-DRB1
93 second-messenger-mediated signaling (GO:0019932) 8/89 4.333277e-02 DGKD;EDN3;CXCR1;DDAH2;LRRK2;CXCR2;CCR6;LAT
94 positive regulation of T cell cytokine production (GO:0002726) 4/21 4.333277e-02 IL4;DENND1B;IL1R1;IL18R1
95 response to endoplasmic reticulum stress (GO:0034976) 9/110 4.333277e-02 BAG6;BCL2L11;ATF6B;SEC16A;ATP2A1;QRICH1;RNF186;RNF5;USP19
96 regulation of epithelial cell apoptotic process (GO:1904035) 3/10 4.333277e-02 NUPR1;ZFP36L1;BOK
97 regulation of memory T cell differentiation (GO:0043380) 3/10 4.333277e-02 IL23R;HLA-DRA;HLA-DRB1
98 immunoglobulin mediated immune response (GO:0016064) 3/10 4.333277e-02 FCER1G;CARD9;FCGR2B
99 protein stabilization (GO:0050821) 12/179 4.399010e-02 BAG6;EFNA1;PER3;FKBPL;CDC37;SEC16A;DNLZ;PARK7;PLPP3;IRGM;USP19;OTUD3
100 positive regulation of peptidyl-tyrosine phosphorylation (GO:0050731) 10/134 4.700511e-02 EFNA1;IL4;CSF3;CD40;IL23R;STAT3;PDGFB;LIF;TNFRSF14;JAK2
101 macrophage activation (GO:0042116) 5/36 4.700511e-02 IL4;CRTC3;IL13;JAK2;AIF1
102 positive regulation of myeloid leukocyte differentiation (GO:0002763) 5/36 4.700511e-02 IL23R;HSF1;LIF;HLA-DRB1;ZFP36L1
103 regulation of inflammatory response (GO:0050727) 13/206 4.732418e-02 PTGER4;IL1R1;IL13;GBA;PARK7;NOD2;MMP9;IL4;LACC1;CYLD;PSMA6;JAK2;PTPN2
104 positive regulation of phagocytosis (GO:0050766) 6/53 4.806734e-02 C4B;C4A;FCER1G;LMAN2;FCGR2B;C2
105 regulation of endoplasmic reticulum stress-induced intrinsic apoptotic signaling pathway (GO:1902235) 4/22 4.806734e-02 BCL2L11;LRRK2;PARK7;BOK
106 neutrophil degranulation (GO:0043312) 23/481 4.886346e-02 RAB5C;FCER1G;RNASET2;HSPA6;HLA-B;HLA-C;NBEAL2;LYZ;APEH;MMP9;RHOA;TSPAN14;SYNGR1;FCGR2A;CXCR1;PLAU;PSMD3;TMBIM1;NEU1;ORMDL3;CXCR2;ITGAV;ATP6V0A1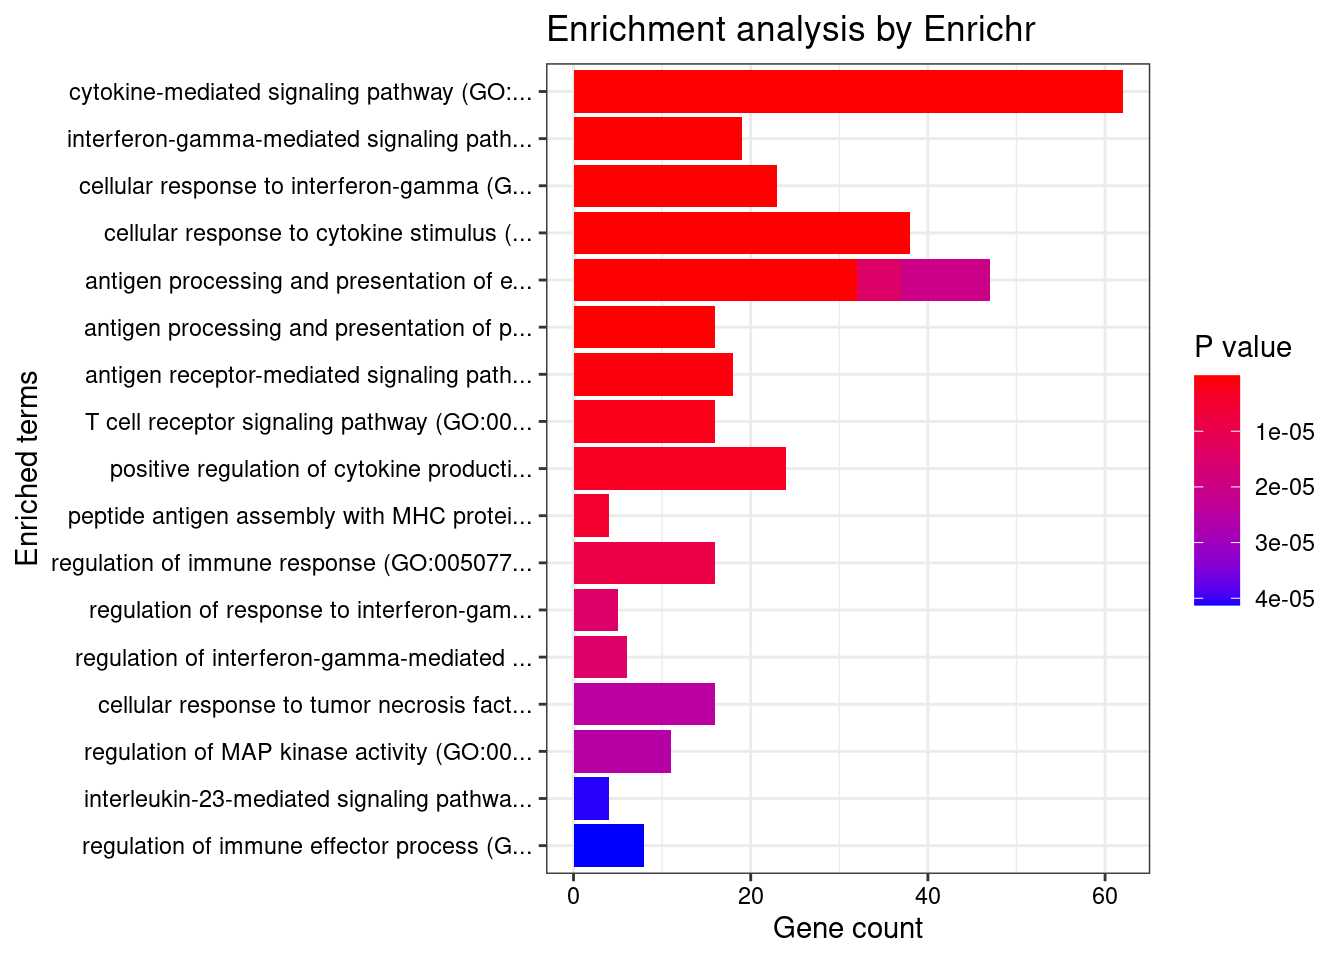
| Version | Author | Date |
|---|---|---|
| 65634fd | wesleycrouse | 2022-06-30 |
GO_Cellular_Component_2021
Term Overlap Adjusted.P.value Genes
1 MHC protein complex (GO:0042611) 13/20 1.555276e-14 HLA-DRB5;HLA-B;HLA-C;HLA-DMA;HLA-DMB;HLA-DPB1;HLA-DRA;HLA-DOA;HLA-DOB;HLA-DQA1;HLA-DQB2;HLA-DRB1;HLA-DQB1
2 MHC class II protein complex (GO:0042613) 11/13 1.555276e-14 HLA-DRB5;HLA-DMA;HLA-DMB;HLA-DPB1;HLA-DRA;HLA-DOA;HLA-DOB;HLA-DQA1;HLA-DQB2;HLA-DRB1;HLA-DQB1
3 integral component of lumenal side of endoplasmic reticulum membrane (GO:0071556) 10/28 3.832162e-08 HLA-DRB5;HLA-B;HLA-DPB1;HLA-C;HLA-DRA;HLA-DQA2;HLA-DQA1;HLA-DQB2;HLA-DRB1;HLA-DQB1
4 lumenal side of endoplasmic reticulum membrane (GO:0098553) 10/28 3.832162e-08 HLA-DRB5;HLA-B;HLA-DPB1;HLA-C;HLA-DRA;HLA-DQA2;HLA-DQA1;HLA-DQB2;HLA-DRB1;HLA-DQB1
5 coated vesicle membrane (GO:0030662) 12/55 3.364960e-07 HLA-DRB5;SEC16A;HLA-B;HLA-DPB1;HLA-C;HLA-DRA;KDELR2;HLA-DQA2;HLA-DQB2;HLA-DQA1;HLA-DRB1;HLA-DQB1
6 COPII-coated ER to Golgi transport vesicle (GO:0030134) 13/79 2.200010e-06 HLA-DRB5;SEC16A;HLA-B;HLA-C;LMAN2;HLA-DPB1;HLA-DRA;HLA-DQA2;TMED5;HLA-DQB2;HLA-DQA1;HLA-DRB1;HLA-DQB1
7 ER to Golgi transport vesicle membrane (GO:0012507) 11/54 2.200010e-06 HLA-DRB5;SEC16A;HLA-B;HLA-DPB1;HLA-C;HLA-DRA;HLA-DQA2;HLA-DQB2;HLA-DQA1;HLA-DRB1;HLA-DQB1
8 lysosome (GO:0005764) 33/477 2.914932e-06 RAB5C;LRRK2;GBA;LITAF;CLN3;HLA-DMA;HLA-DMB;NAGLU;HYAL1;NEU1;CXCR2;HLA-DOA;HLA-DQA2;HLA-DOB;HLA-DQA1;AP1M2;ATP6V0A1;STARD3;HLA-DRB5;USP4;RNASET2;LNPEP;GALC;SYT11;TMBIM1;HLA-DPB1;SPNS1;CSPG5;HLA-DRA;PPT2;HLA-DRB1;HLA-DQB2;HLA-DQB1
9 transport vesicle membrane (GO:0030658) 11/60 5.365817e-06 HLA-DRB5;SEC16A;HLA-B;HLA-DPB1;HLA-C;HLA-DRA;HLA-DQA2;HLA-DQB2;HLA-DQA1;HLA-DRB1;HLA-DQB1
10 lytic vacuole membrane (GO:0098852) 22/267 1.915149e-05 STARD3;HLA-DRB5;RAB5C;GBA;LNPEP;LITAF;CLN3;HLA-DMA;HLA-DMB;TMBIM1;HLA-DPB1;SPNS1;HLA-DRA;HLA-DOA;HLA-DQA2;HLA-DOB;HLA-DQA1;HLA-DRB1;HLA-DQB2;AP1M2;ATP6V0A1;HLA-DQB1
11 trans-Golgi network membrane (GO:0032588) 12/99 1.214913e-04 ARFRP1;HLA-DRB5;HLA-DPB1;HLA-DRA;HLA-DQA2;SCAMP3;AP1M2;HLA-DQA1;HLA-DRB1;HLA-DQB2;BOK;HLA-DQB1
12 lysosomal membrane (GO:0005765) 23/330 1.544946e-04 STARD3;HLA-DRB5;RAB5C;GBA;LNPEP;LITAF;CLN3;SYNGR1;HLA-DMA;HLA-DMB;TMBIM1;HLA-DPB1;SPNS1;HLA-DRA;HLA-DOA;HLA-DQA2;HLA-DOB;HLA-DQA1;HLA-DRB1;HLA-DQB2;AP1M2;ATP6V0A1;HLA-DQB1
13 endocytic vesicle membrane (GO:0030666) 15/158 1.551269e-04 HLA-DRB5;CAMK2A;TAP2;HLA-B;TAP1;HLA-C;HLA-DPB1;HLA-DRA;HLA-DQA2;CAMK2G;HLA-DQA1;HLA-DRB1;HLA-DQB2;ATP6V0A1;HLA-DQB1
14 integral component of endoplasmic reticulum membrane (GO:0030176) 14/142 1.861905e-04 HLA-DRB5;ATF6B;TAP2;HLA-B;TAP1;HLA-C;CLN3;HLA-DPB1;HLA-DRA;HLA-DQA2;HLA-DQA1;HLA-DRB1;HLA-DQB2;HLA-DQB1
15 trans-Golgi network (GO:0005802) 17/239 1.466610e-03 HLA-DRB5;GBA;SCAMP3;ARFRP1;CLN3;SYT11;HLA-DPB1;RAB29;HLA-DRA;PLPP3;HLA-DQA2;HLA-DQA1;HLA-DRB1;HLA-DQB2;AP1M2;HLA-DQB1;BOK
16 secretory granule membrane (GO:0030667) 18/274 2.230005e-03 FCER1G;RAB5C;HLA-B;HLA-C;NBEAL2;RHOA;SELP;SYNGR1;TSPAN14;FCGR2A;CXCR1;PLAU;ORMDL3;CXCR2;TMBIM1;ITGAV;LY6G6F;ATP6V0A1
17 bounding membrane of organelle (GO:0098588) 36/767 2.230005e-03 GPSM1;NOTCH4;CAMK2A;PDGFB;ATP2A1;FUT2;CLN3;CXCR1;LMAN2;ORMDL3;CXCR2;ERBB2;HLA-DQA2;CAMK2G;HLA-DQA1;AP1M2;BOK;ATP6V0A1;HLA-DRB5;TAP2;HLA-B;TAP1;HLA-C;B3GALT6;IRGM;RHOA;FCGR2A;TMBIM1;HLA-DPB1;HLA-DRA;CSPG5;KDELR2;PLPP3;HLA-DRB1;HLA-DQB2;HLA-DQB1
18 integral component of plasma membrane (GO:0005887) 58/1454 2.230005e-03 DDR1;GPR25;CNTNAP1;CD40;GPR65;IL23R;ICAM5;SLC7A10;FCRLA;FCGR3A;IL18RAP;ITGAV;CCR6;PTGIR;FCER1G;GPR35;IL1R1;IFNGR2;HLA-B;HLA-C;NCR3;TFR2;CDHR4;PLPP3;SLC22A4;NOTCH4;ADCY3;SEMA3F;MST1R;ADCY7;MUC1;C7;LMAN2;CXCR2;ERBB2;SLC38A3;HLA-DQA2;HLA-DQA1;IL12RB2;GABBR1;KCNJ11;TNFSF15;LNPEP;SELP;SLC6A7;TSPAN14;FCGR2A;CD6;GPR183;IL2RA;HLA-DRA;CSPG5;TNFSF8;FCGR2B;SLC26A3;HLA-DRB1;SLC26A6;IL18R1
19 cytoplasmic vesicle membrane (GO:0030659) 22/380 2.425088e-03 HLA-DRB5;CAMK2A;HLA-B;HLA-C;RHOA;FCGR2A;CXCR1;ORMDL3;CXCR2;TMBIM1;ERBB2;HLA-DPB1;CSPG5;HLA-DRA;HLA-DQA2;CAMK2G;HLA-DQA1;HLA-DRB1;HLA-DQB2;AP1M2;ATP6V0A1;HLA-DQB1
20 endocytic vesicle (GO:0030139) 14/189 2.975289e-03 HLA-DRB5;RAB5C;CAMK2A;NOD2;SYT11;HLA-DPB1;HLA-DRA;ITGAV;HLA-DQA2;CAMK2G;HLA-DQA1;HLA-DRB1;HLA-DQB2;HLA-DQB1
21 clathrin-coated endocytic vesicle membrane (GO:0030669) 8/69 3.212657e-03 HLA-DRB5;HLA-DPB1;HLA-DRA;HLA-DQA2;HLA-DQB2;HLA-DQA1;HLA-DRB1;HLA-DQB1
22 clathrin-coated endocytic vesicle (GO:0045334) 8/85 1.256009e-02 HLA-DRB5;HLA-DPB1;HLA-DRA;HLA-DQA2;HLA-DQB2;HLA-DQA1;HLA-DRB1;HLA-DQB1
23 late endosome membrane (GO:0031902) 7/68 1.437778e-02 STARD3;HLA-DMA;HLA-DRB5;HLA-DMB;HLA-DRA;LITAF;HLA-DRB1
24 Golgi membrane (GO:0000139) 23/472 1.500776e-02 GPSM1;HLA-DRB5;NOTCH4;PDGFB;HLA-B;HLA-C;B3GALT6;FUT2;IRGM;SCAMP3;ARFRP1;CLN3;LMAN2;HLA-DPB1;HLA-DRA;KDELR2;HLA-DQA2;HLA-DQA1;HLA-DRB1;HLA-DQB2;AP1M2;HLA-DQB1;BOK
25 clathrin-coated vesicle membrane (GO:0030665) 8/90 1.601331e-02 HLA-DRB5;HLA-DPB1;HLA-DRA;HLA-DQA2;HLA-DQB2;HLA-DQA1;HLA-DRB1;HLA-DQB1
26 lytic vacuole (GO:0000323) 13/219 2.834703e-02 USP4;LRRK2;RNASET2;GBA;GALC;CLN3;NAGLU;HYAL1;SYT11;NEU1;HLA-DRA;PPT2;HLA-DOB
27 phagocytic vesicle (GO:0045335) 8/100 2.881292e-02 SYT11;TAP2;HLA-B;TAP1;HLA-C;ITGAV;NOD2;ATP6V0A1
28 phagocytic vesicle membrane (GO:0030670) 5/45 4.108475e-02 TAP2;HLA-B;HLA-C;TAP1;ATP6V0A1
29 lysosomal lumen (GO:0043202) 7/86 4.343227e-02 GALC;NAGLU;HYAL1;GBA;NEU1;CSPG5;PPT2
30 early endosome lumen (GO:0031905) 2/5 4.638774e-02 LNPEP;PDLIM4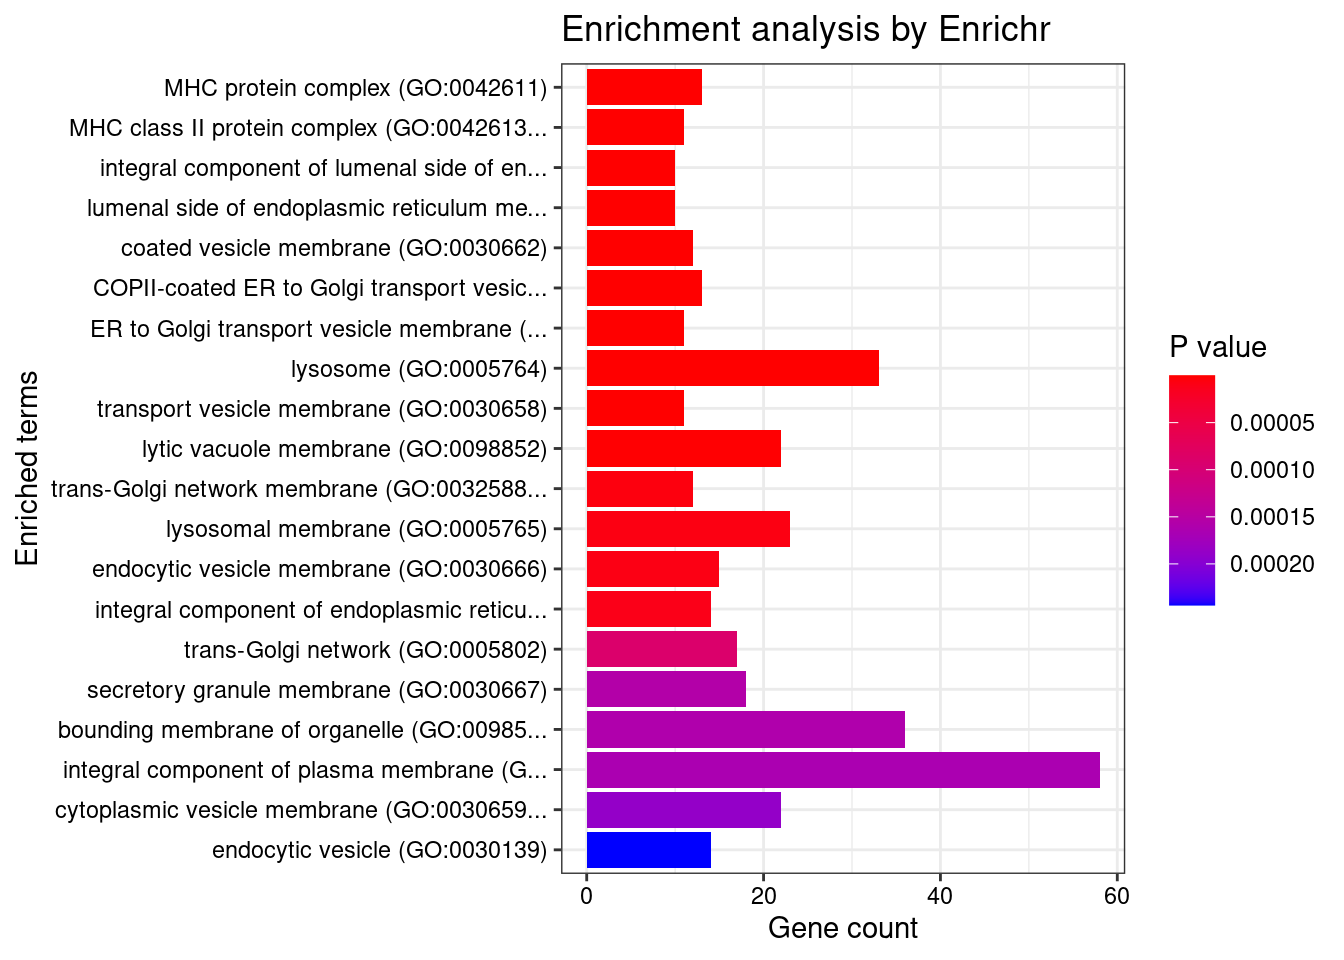
| Version | Author | Date |
|---|---|---|
| 65634fd | wesleycrouse | 2022-06-30 |
GO_Molecular_Function_2021
Term Overlap Adjusted.P.value Genes
1 MHC class II receptor activity (GO:0032395) 8/10 2.374086e-09 HLA-DRA;HLA-DOA;HLA-DOB;HLA-DQA2;HLA-DQA1;HLA-DQB2;HLA-DRB1;HLA-DQB1
2 MHC class II protein complex binding (GO:0023026) 6/17 4.632076e-04 HLA-DMA;HLA-DMB;HLA-DRA;HLA-DOA;HLA-DOB;HLA-DRB1
3 cytokine receptor activity (GO:0004896) 11/88 1.492931e-03 IL1RL1;IL18RAP;CXCR1;IL1R1;IL23R;IL1R2;IFNGR2;IL2RA;CCR6;IL18R1;IL12RB2
4 kinase activity (GO:0016301) 11/112 1.084307e-02 CERKL;ITPKC;DGKD;LRRK2;IPMK;CAMK2A;COQ8B;IP6K1;NADK;COASY;IP6K2
5 C-X-C chemokine receptor activity (GO:0016494) 3/5 1.265196e-02 CXCR1;GPR35;CXCR2
6 inositol hexakisphosphate kinase activity (GO:0000828) 3/8 4.959376e-02 ITPKC;IP6K1;IP6K2
7 transcription regulatory region nucleic acid binding (GO:0001067) 14/212 4.959376e-02 EGR2;CIITA;SMAD3;THRA;ATF6B;STAT3;ARID5B;POU5F1;HHEX;NR5A2;PER3;IRF1;HSF1;BRD7
8 ubiquitin protein ligase binding (GO:0031625) 16/265 4.967081e-02 EGR2;CD40;SMAD3;HSPA1L;CUL2;HSPA6;CUL1;CASC3;SCAMP3;POU5F1;UBE2L3;BAG6;SYT11;PRKAR2A;TNFRSF14;TRIB1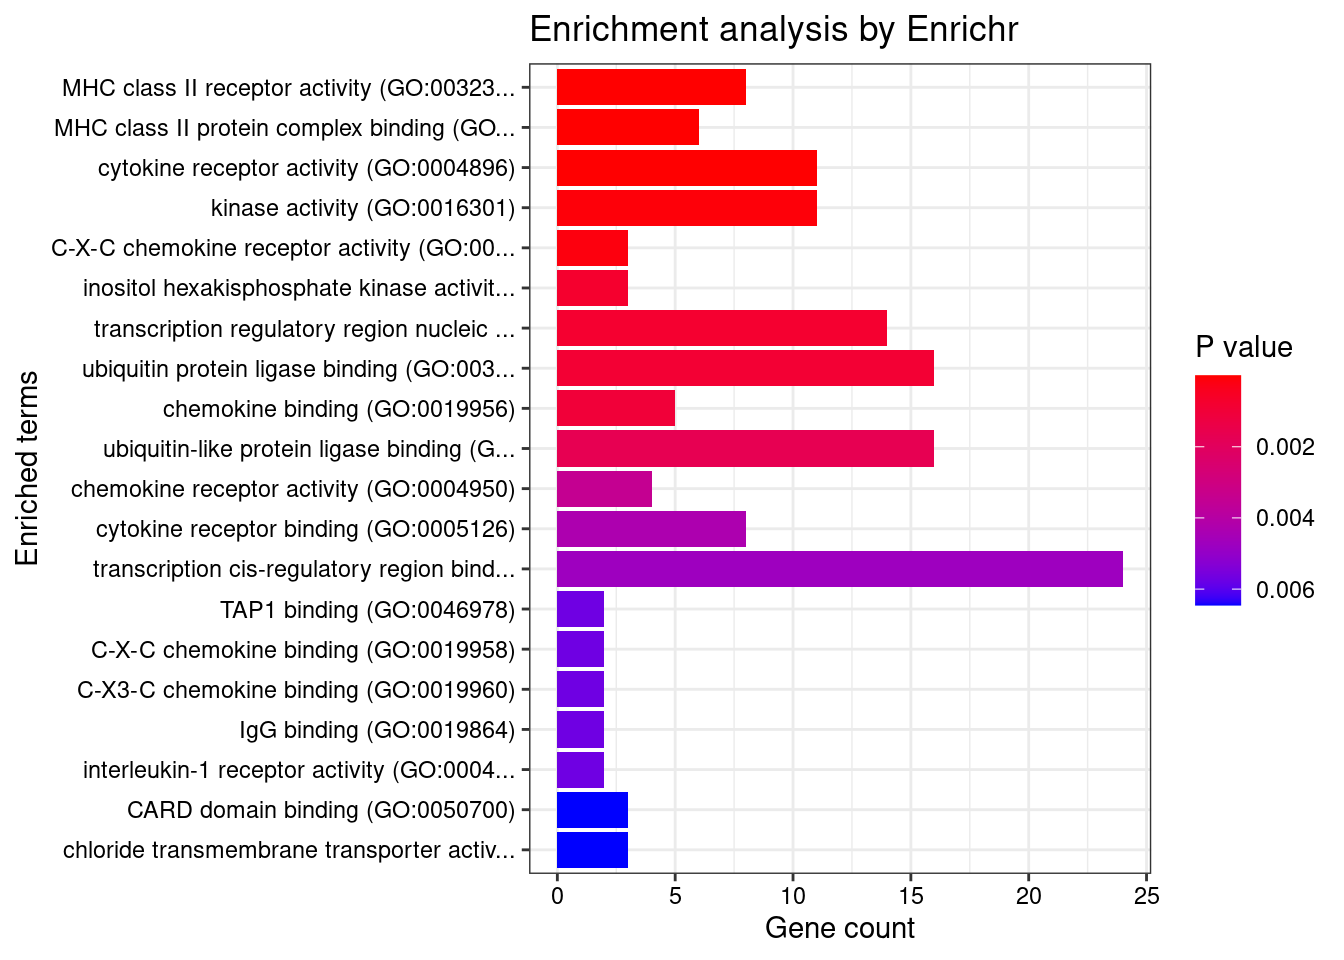
| Version | Author | Date |
|---|---|---|
| 65634fd | wesleycrouse | 2022-06-30 |
Enrichment analysis for cTWAS genes in top tissues separately
GO
output <- output[order(-output$pve_g),]
top_tissues <- output$weight[1:5]
for (tissue in top_tissues){
cat(paste0(tissue, "\n\n"))
ctwas_genes_tissue <- df[[tissue]]$ctwas
cat(paste0("Number of cTWAS Genes in Tissue: ", length(ctwas_genes_tissue), "\n\n"))
dbs <- c("GO_Biological_Process_2021")
GO_enrichment <- enrichr(ctwas_genes_tissue, dbs)
for (db in dbs){
cat(paste0("\n", db, "\n\n"))
enrich_results <- GO_enrichment[[db]]
enrich_results <- enrich_results[enrich_results$Adjusted.P.value<0.05,c("Term", "Overlap", "Adjusted.P.value", "Genes")]
print(enrich_results)
print(plotEnrich(GO_enrichment[[db]]))
}
}Whole_Blood
Number of cTWAS Genes in Tissue: 17
Uploading data to Enrichr... Done.
Querying GO_Biological_Process_2021... Done.
Parsing results... Done.
GO_Biological_Process_2021
Term Overlap Adjusted.P.value Genes
1 positive regulation of cytokine production involved in inflammatory response (GO:1900017) 2/17 0.008877859 CARD9;STAT3
2 regulation of interleukin-6 production (GO:0032675) 3/110 0.008877859 CD200R1;CARD9;STAT3
3 cellular response to interleukin-7 (GO:0098761) 2/19 0.008877859 SOCS1;STAT3
4 interleukin-7-mediated signaling pathway (GO:0038111) 2/19 0.008877859 SOCS1;STAT3
5 regulation of cytokine production involved in inflammatory response (GO:1900015) 2/43 0.037058328 CARD9;STAT3
6 regulation of tyrosine phosphorylation of STAT protein (GO:0042509) 2/68 0.045014347 SOCS1;STAT3
7 cytokine-mediated signaling pathway (GO:0019221) 4/621 0.045014347 SOCS1;TNFSF15;STAT3;CCR5
8 establishment of protein localization to organelle (GO:0072594) 2/76 0.045014347 STAT3;FAM53B
9 positive regulation of interleukin-6 production (GO:0032755) 2/76 0.045014347 CARD9;STAT3
10 protein import into nucleus (GO:0006606) 2/76 0.045014347 STAT3;FAM53B
11 import into nucleus (GO:0051170) 2/77 0.045014347 STAT3;FAM53B
12 protein import (GO:0017038) 2/89 0.045014347 STAT3;FAM53B
13 protein localization to nucleus (GO:0034504) 2/106 0.045014347 STAT3;FAM53B
14 negative regulation of T cell migration (GO:2000405) 1/5 0.045014347 CD200R1
15 positive regulation of metallopeptidase activity (GO:1905050) 1/5 0.045014347 STAT3
16 positive regulation of cysteine-type endopeptidase activity involved in apoptotic process (GO:0043280) 2/119 0.045014347 TNFSF15;CARD9
17 negative regulation of CD8-positive, alpha-beta T cell activation (GO:2001186) 1/6 0.045014347 SOCS1
18 radial glial cell differentiation (GO:0060019) 1/6 0.045014347 STAT3
19 T-helper 17 cell lineage commitment (GO:0072540) 1/6 0.045014347 STAT3
20 release of sequestered calcium ion into cytosol by sarcoplasmic reticulum (GO:0014808) 1/6 0.045014347 CCR5
21 skin morphogenesis (GO:0043589) 1/7 0.045014347 ERRFI1
22 T-helper 17 cell differentiation (GO:0072539) 1/7 0.045014347 STAT3
23 astrocyte differentiation (GO:0048708) 1/7 0.045014347 STAT3
24 release of sequestered calcium ion into cytosol by endoplasmic reticulum (GO:1903514) 1/7 0.045014347 CCR5
25 regulation of miRNA mediated inhibition of translation (GO:1905616) 1/7 0.045014347 STAT3
26 regulation of CD8-positive, alpha-beta T cell differentiation (GO:0043376) 1/7 0.045014347 SOCS1
27 photoreceptor cell differentiation (GO:0046530) 1/7 0.045014347 STAT3
28 positive regulation of miRNA mediated inhibition of translation (GO:1905618) 1/7 0.045014347 STAT3
29 cellular response to interleukin-21 (GO:0098757) 1/8 0.045014347 STAT3
30 positive regulation of CD4-positive, alpha-beta T cell differentiation (GO:0043372) 1/8 0.045014347 SOCS1
31 fusion of virus membrane with host plasma membrane (GO:0019064) 1/8 0.045014347 CCR5
32 T-helper cell lineage commitment (GO:0002295) 1/8 0.045014347 STAT3
33 membrane fusion involved in viral entry into host cell (GO:0039663) 1/8 0.045014347 CCR5
34 negative regulation of macrophage migration (GO:1905522) 1/8 0.045014347 CD200R1
35 myeloid leukocyte mediated immunity (GO:0002444) 1/8 0.045014347 CARD9
36 interleukin-21-mediated signaling pathway (GO:0038114) 1/8 0.045014347 STAT3
37 negative regulation of alpha-beta T cell differentiation (GO:0046639) 1/8 0.045014347 SOCS1
38 cellular response to cytokine stimulus (GO:0071345) 3/482 0.045014347 SOCS1;STAT3;CCR5
39 positive regulation of NF-kappaB transcription factor activity (GO:0051092) 2/155 0.045014347 CARD9;STAT3
40 cellular response to interleukin-9 (GO:0071355) 1/9 0.045014347 STAT3
41 cellular response to leptin stimulus (GO:0044320) 1/9 0.045014347 STAT3
42 response to leptin (GO:0044321) 1/9 0.045014347 STAT3
43 interleukin-23-mediated signaling pathway (GO:0038155) 1/9 0.045014347 STAT3
44 interleukin-9-mediated signaling pathway (GO:0038113) 1/9 0.045014347 STAT3
45 regulation of receptor binding (GO:1900120) 1/10 0.045014347 ADAM15
46 leptin-mediated signaling pathway (GO:0033210) 1/10 0.045014347 STAT3
47 negative regulation of tyrosine phosphorylation of STAT protein (GO:0042532) 1/10 0.045014347 SOCS1
48 lung epithelium development (GO:0060428) 1/10 0.045014347 ERRFI1
49 regulation of T-helper 17 type immune response (GO:2000316) 1/10 0.045014347 CARD9
50 regulation of macrophage migration (GO:1905521) 1/10 0.045014347 CD200R1
51 negative regulation of leukocyte migration (GO:0002686) 1/10 0.045014347 CD200R1
52 immunoglobulin mediated immune response (GO:0016064) 1/10 0.045014347 CARD9
53 negative regulation of protein autophosphorylation (GO:0031953) 1/10 0.045014347 ERRFI1
54 sarcoplasmic reticulum calcium ion transport (GO:0070296) 1/10 0.045014347 CCR5
55 negative regulation of receptor binding (GO:1900121) 1/10 0.045014347 ADAM15
56 positive regulation of posttranscriptional gene silencing (GO:0060148) 1/11 0.045014347 STAT3
57 B cell mediated immunity (GO:0019724) 1/11 0.045014347 CARD9
58 negative regulation of lymphocyte migration (GO:2000402) 1/11 0.045014347 CD200R1
59 response to sterol (GO:0036314) 1/11 0.045014347 CCR5
60 interleukin-35-mediated signaling pathway (GO:0070757) 1/11 0.045014347 STAT3
61 negative regulation of receptor signaling pathway via STAT (GO:1904893) 1/11 0.045014347 SOCS1
62 cellular response to growth hormone stimulus (GO:0071378) 1/12 0.045014347 STAT3
63 regulation of feeding behavior (GO:0060259) 1/12 0.045014347 STAT3
64 eye photoreceptor cell differentiation (GO:0001754) 1/12 0.045014347 STAT3
65 positive regulation of T-helper 17 type immune response (GO:2000318) 1/12 0.045014347 CARD9
66 regulation of CD4-positive, alpha-beta T cell differentiation (GO:0043370) 1/12 0.045014347 SOCS1
67 negative regulation of production of miRNAs involved in gene silencing by miRNA (GO:1903799) 1/12 0.045014347 STAT3
68 positive regulation of adaptive immune response based on somatic recombination of immune receptors built from immunoglobulin superfamily domains (GO:0002824) 1/13 0.045014347 CARD9
69 cellular response to interleukin-15 (GO:0071350) 1/13 0.045014347 STAT3
70 positive regulation of CD4-positive, alpha-beta T cell activation (GO:2000516) 1/13 0.045014347 SOCS1
71 antifungal innate immune response (GO:0061760) 1/13 0.045014347 CARD9
72 negative regulation of epidermal growth factor-activated receptor activity (GO:0007175) 1/13 0.045014347 ERRFI1
73 homeostasis of number of cells (GO:0048872) 1/13 0.045014347 CARD9
74 interleukin-15-mediated signaling pathway (GO:0035723) 1/13 0.045014347 STAT3
75 entry into host (GO:0044409) 1/13 0.045014347 CCR5
76 positive regulation of alpha-beta T cell differentiation (GO:0046638) 1/14 0.045014347 SOCS1
77 regulation of response to interferon-gamma (GO:0060330) 1/14 0.045014347 SOCS1
78 positive regulation of regulatory T cell differentiation (GO:0045591) 1/14 0.045014347 SOCS1
79 growth hormone receptor signaling pathway via JAK-STAT (GO:0060397) 1/14 0.045014347 STAT3
80 positive regulation of granulocyte macrophage colony-stimulating factor production (GO:0032725) 1/14 0.045014347 CARD9
81 negative regulation of neuroinflammatory response (GO:0150079) 1/14 0.045014347 CD200R1
82 interleukin-27-mediated signaling pathway (GO:0070106) 1/15 0.047622471 STAT3
83 activation of NF-kappaB-inducing kinase activity (GO:0007250) 1/16 0.048415302 TNFSF15
84 regulation of granulocyte macrophage colony-stimulating factor production (GO:0032645) 1/16 0.048415302 CARD9
85 dendritic cell chemotaxis (GO:0002407) 1/16 0.048415302 CCR5
86 negative regulation of receptor signaling pathway via JAK-STAT (GO:0046426) 1/16 0.048415302 SOCS1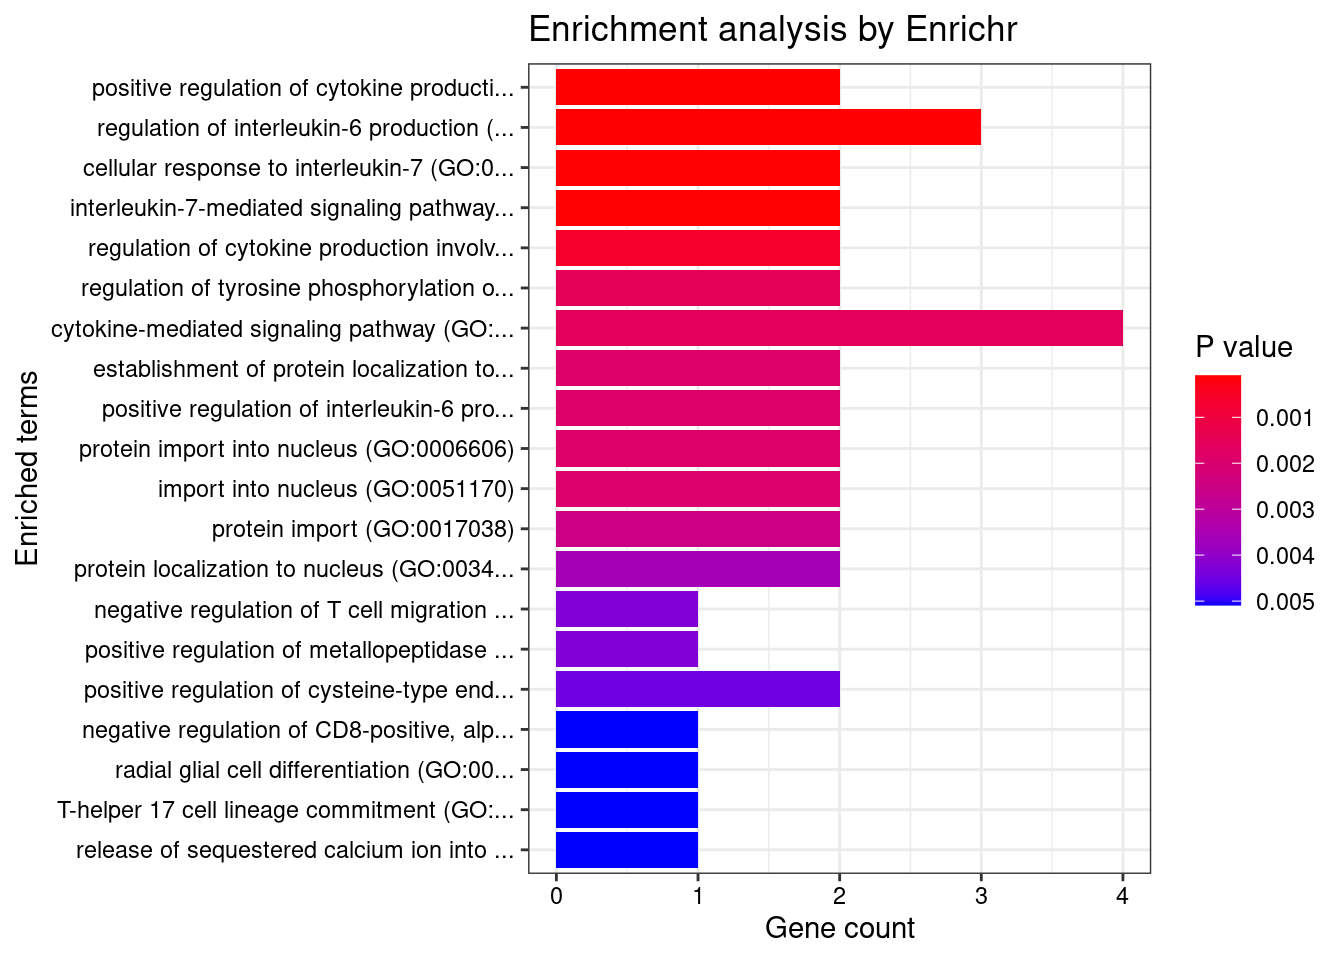
| Version | Author | Date |
|---|---|---|
| 65634fd | wesleycrouse | 2022-06-30 |
Esophagus_Muscularis
Number of cTWAS Genes in Tissue: 8
Uploading data to Enrichr... Done.
Querying GO_Biological_Process_2021... Done.
Parsing results... Done.
GO_Biological_Process_2021
Term Overlap Adjusted.P.value Genes
1 cell-matrix adhesion (GO:0007160) 2/100 0.02183193 ADAM15;ITGAL
2 positive regulation of cysteine-type endopeptidase activity involved in apoptotic process (GO:0043280) 2/119 0.02183193 TNFSF15;CARD9
3 metanephric distal tubule development (GO:0072235) 1/5 0.02183193 PAX8
4 metanephric epithelium development (GO:0072207) 1/5 0.02183193 PAX8
5 metanephric nephron tubule morphogenesis (GO:0072282) 1/5 0.02183193 PAX8
6 metanephric renal vesicle morphogenesis (GO:0072283) 1/5 0.02183193 PAX8
7 nephron tubule formation (GO:0072079) 1/5 0.02183193 PAX8
8 T cell extravasation (GO:0072683) 1/5 0.02183193 ITGAL
9 response to gonadotropin (GO:0034698) 1/6 0.02183193 PAX8
10 pronephros development (GO:0048793) 1/6 0.02183193 PAX8
11 mesenchymal to epithelial transition involved in metanephros morphogenesis (GO:0003337) 1/6 0.02183193 PAX8
12 positive regulation of epithelial cell differentiation involved in kidney development (GO:2000698) 1/6 0.02183193 PAX8
13 metanephric nephron tubule development (GO:0072234) 1/7 0.02183193 PAX8
14 epithelial cell differentiation involved in kidney development (GO:0035850) 1/7 0.02183193 PAX8
15 cellular response to gonadotropin stimulus (GO:0071371) 1/7 0.02183193 PAX8
16 positive regulation of hormone metabolic process (GO:0032352) 1/7 0.02183193 PAX8
17 extracellular structure organization (GO:0043062) 2/216 0.02183193 ADAM15;ITGAL
18 external encapsulating structure organization (GO:0045229) 2/217 0.02183193 ADAM15;ITGAL
19 kidney epithelium development (GO:0072073) 1/8 0.02183193 PAX8
20 myeloid leukocyte mediated immunity (GO:0002444) 1/8 0.02183193 CARD9
21 thyroid gland development (GO:0030878) 1/8 0.02183193 PAX8
22 regulation of nephron tubule epithelial cell differentiation (GO:0072182) 1/9 0.02183193 PAX8
23 regulation of DNA-templated transcription in response to stress (GO:0043620) 1/9 0.02183193 RGS14
24 regulation of ERK1 and ERK2 cascade (GO:0070372) 2/238 0.02183193 RGS14;CARD9
25 regulation of receptor binding (GO:1900120) 1/10 0.02183193 ADAM15
26 cell differentiation involved in metanephros development (GO:0072202) 1/10 0.02183193 PAX8
27 regulation of T-helper 17 type immune response (GO:2000316) 1/10 0.02183193 CARD9
28 immunoglobulin mediated immune response (GO:0016064) 1/10 0.02183193 CARD9
29 mesenchymal to epithelial transition (GO:0060231) 1/10 0.02183193 PAX8
30 negative regulation of receptor binding (GO:1900121) 1/10 0.02183193 ADAM15
31 mesonephros development (GO:0001823) 1/11 0.02239473 PAX8
32 B cell mediated immunity (GO:0019724) 1/11 0.02239473 CARD9
33 positive regulation of T-helper 17 type immune response (GO:2000318) 1/12 0.02239473 CARD9
34 positive regulation of branching involved in ureteric bud morphogenesis (GO:0090190) 1/12 0.02239473 PAX8
35 urogenital system development (GO:0001655) 1/12 0.02239473 PAX8
36 positive regulation of adaptive immune response based on somatic recombination of immune receptors built from immunoglobulin superfamily domains (GO:0002824) 1/13 0.02239473 CARD9
37 homeostasis of number of cells (GO:0048872) 1/13 0.02239473 CARD9
38 antifungal innate immune response (GO:0061760) 1/13 0.02239473 CARD9
39 positive regulation of granulocyte macrophage colony-stimulating factor production (GO:0032725) 1/14 0.02275730 CARD9
40 extracellular matrix organization (GO:0030198) 2/300 0.02275730 ADAM15;ITGAL
41 regulation of branching involved in ureteric bud morphogenesis (GO:0090189) 1/15 0.02275730 PAX8
42 innate immune response (GO:0045087) 2/302 0.02275730 ADAM15;CARD9
43 activation of NF-kappaB-inducing kinase activity (GO:0007250) 1/16 0.02275730 TNFSF15
44 regulation of granulocyte macrophage colony-stimulating factor production (GO:0032645) 1/16 0.02275730 CARD9
45 platelet-derived growth factor receptor signaling pathway (GO:0048008) 1/16 0.02275730 RGS14
46 nuclear transport (GO:0051169) 1/16 0.02275730 RGS14
47 positive regulation of cytokine production involved in inflammatory response (GO:1900017) 1/17 0.02366103 CARD9
48 positive regulation of stress-activated protein kinase signaling cascade (GO:0070304) 1/18 0.02436208 CARD9
49 branching involved in ureteric bud morphogenesis (GO:0001658) 1/19 0.02436208 PAX8
50 ureteric bud morphogenesis (GO:0060675) 1/19 0.02436208 PAX8
51 long-term memory (GO:0007616) 1/19 0.02436208 RGS14
52 positive regulation of multicellular organismal process (GO:0051240) 2/345 0.02446086 PAX8;CARD9
53 positive regulation of nitrogen compound metabolic process (GO:0051173) 1/20 0.02467227 PAX8
54 long-term synaptic potentiation (GO:0060291) 1/21 0.02542171 RGS14
55 positive regulation of interleukin-17 production (GO:0032740) 1/23 0.02570591 CARD9
56 ear morphogenesis (GO:0042471) 1/23 0.02570591 PAX8
57 negative regulation of G protein-coupled receptor signaling pathway (GO:0045744) 1/23 0.02570591 RGS14
58 positive regulation of morphogenesis of an epithelium (GO:1905332) 1/23 0.02570591 PAX8
59 defense response to fungus (GO:0050832) 1/24 0.02570591 CARD9
60 inner ear morphogenesis (GO:0042472) 1/24 0.02570591 PAX8
61 endocrine system development (GO:0035270) 1/24 0.02570591 PAX8
62 metanephros development (GO:0001656) 1/26 0.02738933 PAX8
63 leukocyte cell-cell adhesion (GO:0007159) 1/28 0.02812500 ITGAL
64 receptor clustering (GO:0043113) 1/28 0.02812500 ITGAL
65 T cell activation involved in immune response (GO:0002286) 1/28 0.02812500 ITGAL
66 negative regulation of cell-matrix adhesion (GO:0001953) 1/32 0.03116158 ADAM15
67 modulation by host of symbiont process (GO:0051851) 1/32 0.03116158 CARD9
68 regulation of interleukin-17 production (GO:0032660) 1/33 0.03165727 CARD9
69 neutrophil mediated immunity (GO:0002446) 2/488 0.03538136 CARD9;ITGAL
70 positive regulation of cell development (GO:0010720) 1/38 0.03538136 RGS14
71 cellular response to ketone (GO:1901655) 1/39 0.03570050 ADAM15
72 negative regulation of cell-substrate adhesion (GO:0010812) 1/40 0.03570050 ADAM15
73 nucleocytoplasmic transport (GO:0006913) 1/40 0.03570050 RGS14
74 heterophilic cell-cell adhesion via plasma membrane cell adhesion molecules (GO:0007157) 1/42 0.03647316 ITGAL
75 nucleic acid-templated transcription (GO:0097659) 1/42 0.03647316 PAX8
76 regulation of cytokine production involved in inflammatory response (GO:1900015) 1/43 0.03684379 CARD9
77 branching morphogenesis of an epithelial tube (GO:0048754) 1/44 0.03720450 PAX8
78 positive regulation of nervous system development (GO:0051962) 1/45 0.03755567 RGS14
79 negative regulation of MAP kinase activity (GO:0043407) 1/48 0.03887195 RGS14
80 cellular response to alcohol (GO:0097306) 1/48 0.03887195 ADAM15
81 regulation of stress-activated MAPK cascade (GO:0032872) 1/49 0.03887195 CARD9
82 cellular defense response (GO:0006968) 1/49 0.03887195 LSP1
83 negative regulation of ERK1 and ERK2 cascade (GO:0070373) 1/50 0.03918051 RGS14
84 sensory organ development (GO:0007423) 1/56 0.04331433 PAX8
85 renal system development (GO:0072001) 1/57 0.04356151 PAX8
86 regulation of neurogenesis (GO:0050767) 1/62 0.04625302 RGS14
87 positive regulation of cysteine-type endopeptidase activity (GO:2001056) 1/62 0.04625302 CARD9
88 regulation of cell-matrix adhesion (GO:0001952) 1/65 0.04756260 ADAM15
89 extracellular matrix disassembly (GO:0022617) 1/66 0.04756260 ADAM15
90 cellular component disassembly (GO:0022411) 1/66 0.04756260 ADAM15
91 kidney development (GO:0001822) 1/70 0.04871893 PAX8
92 gland development (GO:0048732) 1/71 0.04871893 PAX8
93 positive regulation of neurogenesis (GO:0050769) 1/72 0.04871893 RGS14
94 positive regulation of JNK cascade (GO:0046330) 1/73 0.04871893 CARD9
95 positive regulation of synaptic transmission (GO:0050806) 1/73 0.04871893 RGS14
96 regulation of peptide hormone secretion (GO:0090276) 1/74 0.04871893 PAX8
97 NIK/NF-kappaB signaling (GO:0038061) 1/74 0.04871893 TNFSF15
98 negative regulation of protein binding (GO:0032091) 1/74 0.04871893 ADAM15
99 integrin-mediated signaling pathway (GO:0007229) 1/75 0.04871893 ADAM15
100 cellular response to hormone stimulus (GO:0032870) 1/76 0.04871893 PAX8
101 positive regulation of interleukin-6 production (GO:0032755) 1/76 0.04871893 CARD9
102 negative regulation of protein serine/threonine kinase activity (GO:0071901) 1/78 0.04949351 RGS14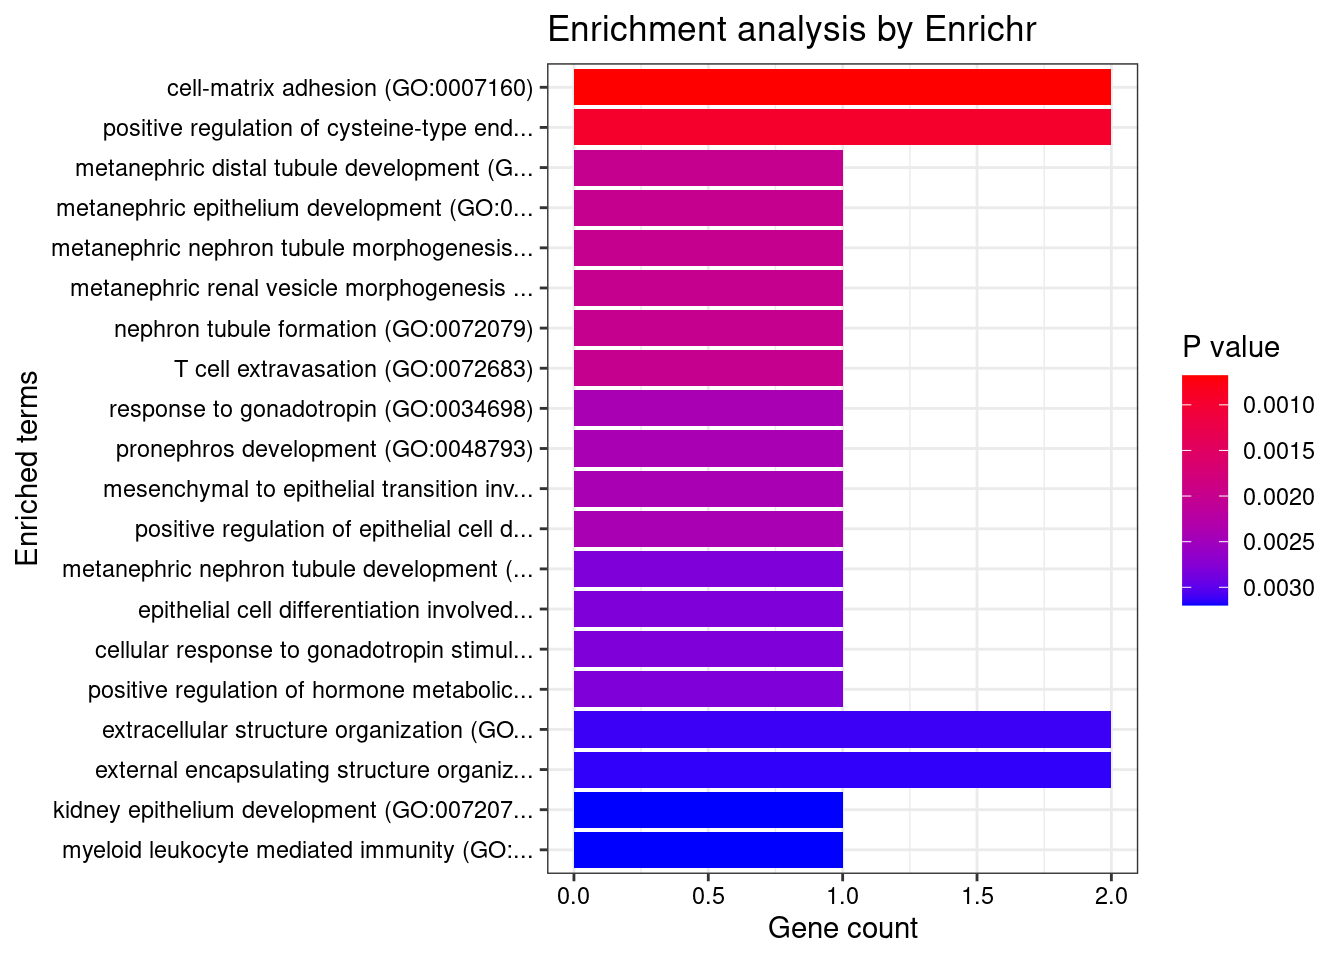
| Version | Author | Date |
|---|---|---|
| 65634fd | wesleycrouse | 2022-06-30 |
Skin_Not_Sun_Exposed_Suprapubic
Number of cTWAS Genes in Tissue: 3
Uploading data to Enrichr... Done.
Querying GO_Biological_Process_2021... Done.
Parsing results... Done.
GO_Biological_Process_2021
Term Overlap Adjusted.P.value Genes
1 regulation of collagen fibril organization (GO:1904026) 1/6 0.004969581 EFEMP2
2 supramolecular fiber organization (GO:0097435) 2/351 0.004969581 EFEMP2;P4HA2
3 positive regulation of vascular associated smooth muscle cell differentiation (GO:1905065) 1/7 0.004969581 EFEMP2
4 vascular associated smooth muscle cell development (GO:0097084) 1/7 0.004969581 EFEMP2
5 vascular associated smooth muscle cell differentiation (GO:0035886) 1/8 0.004969581 EFEMP2
6 elastic fiber assembly (GO:0048251) 1/8 0.004969581 EFEMP2
7 peptidyl-proline hydroxylation to 4-hydroxy-L-proline (GO:0018401) 1/8 0.004969581 P4HA2
8 smooth muscle tissue development (GO:0048745) 1/10 0.005215477 EFEMP2
9 peptidyl-proline hydroxylation (GO:0019511) 1/11 0.005215477 P4HA2
10 aorta development (GO:0035904) 1/14 0.005215477 EFEMP2
11 regulation of extracellular matrix organization (GO:1903053) 1/15 0.005215477 EFEMP2
12 aorta morphogenesis (GO:0035909) 1/17 0.005215477 EFEMP2
13 negative regulation of vascular associated smooth muscle cell proliferation (GO:1904706) 1/17 0.005215477 EFEMP2
14 muscle tissue morphogenesis (GO:0060415) 1/17 0.005215477 EFEMP2
15 positive regulation of extracellular matrix organization (GO:1903055) 1/18 0.005215477 EFEMP2
16 artery development (GO:0060840) 1/23 0.005793244 EFEMP2
17 regulation of supramolecular fiber organization (GO:1902903) 1/23 0.005793244 EFEMP2
18 extracellular matrix assembly (GO:0085029) 1/24 0.005793244 EFEMP2
19 negative regulation of smooth muscle cell proliferation (GO:0048662) 1/33 0.007165924 EFEMP2
20 muscle cell development (GO:0055001) 1/33 0.007165924 EFEMP2
21 regulation of vascular associated smooth muscle cell proliferation (GO:1904705) 1/37 0.007650398 EFEMP2
22 positive regulation of cell-matrix adhesion (GO:0001954) 1/44 0.008681202 EFEMP2
23 collagen fibril organization (GO:0030199) 1/89 0.016419487 P4HA2
24 positive regulation of supramolecular fiber organization (GO:1902905) 1/91 0.016419487 EFEMP2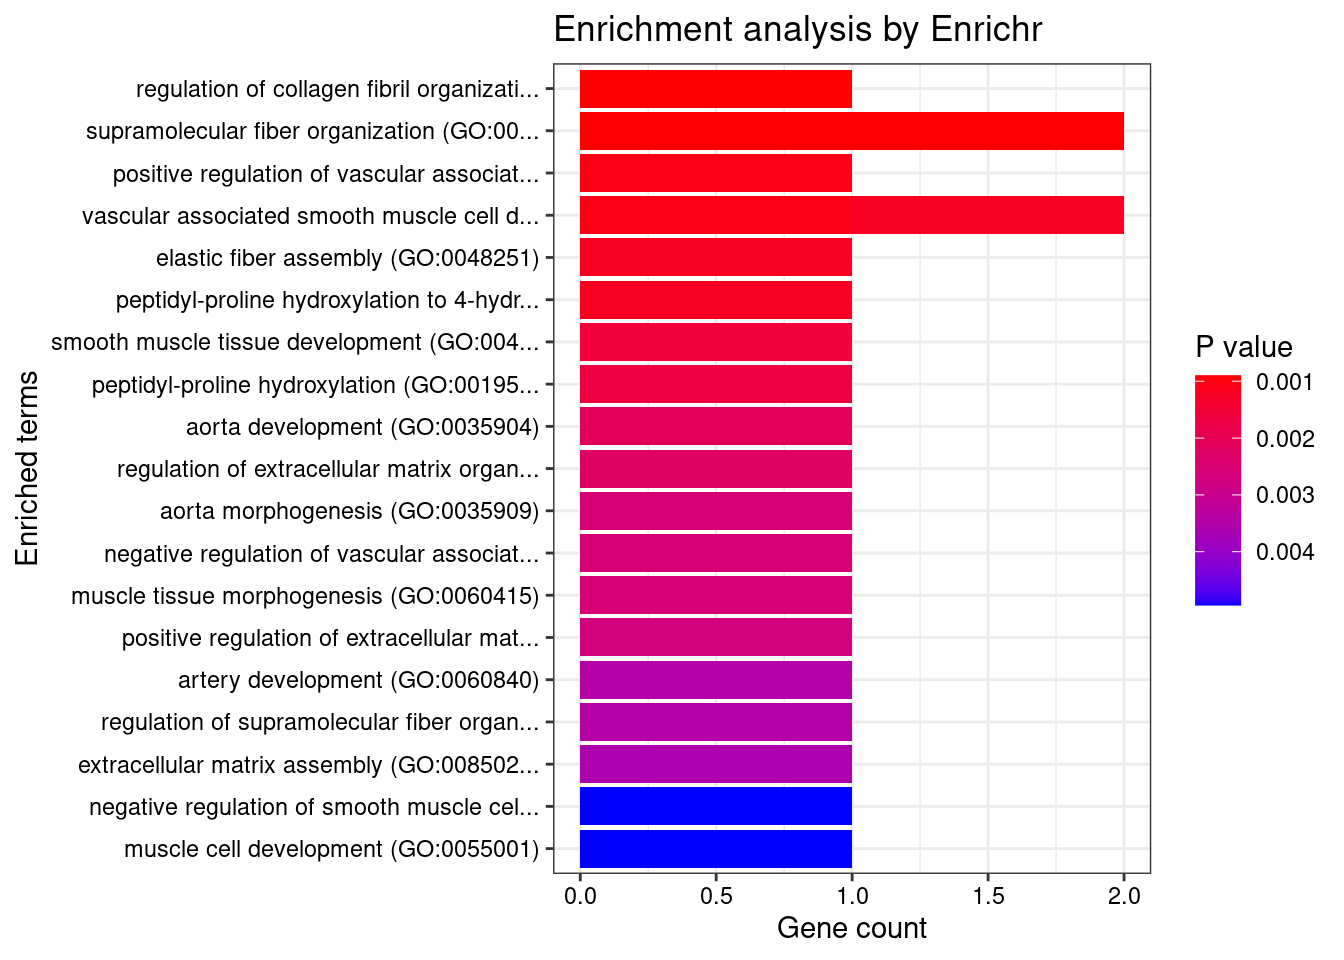
| Version | Author | Date |
|---|---|---|
| 65634fd | wesleycrouse | 2022-06-30 |
Uterus
Number of cTWAS Genes in Tissue: 7
Uploading data to Enrichr... Done.
Querying GO_Biological_Process_2021... Done.
Parsing results... Done.
GO_Biological_Process_2021
Term Overlap Adjusted.P.value Genes
1 positive regulation of cytokine production involved in inflammatory response (GO:1900017) 2/17 0.002791863 CARD9;STAT3
2 regulation of cytokine production involved in inflammatory response (GO:1900015) 2/43 0.009228640 CARD9;STAT3
3 positive regulation of interleukin-6 production (GO:0032755) 2/76 0.018940079 CARD9;STAT3
4 regulation of interleukin-6 production (GO:0032675) 2/110 0.018940079 CARD9;STAT3
5 tumor necrosis factor-mediated signaling pathway (GO:0033209) 2/116 0.018940079 TNFRSF6B;TNFSF15
6 positive regulation of cysteine-type endopeptidase activity involved in apoptotic process (GO:0043280) 2/119 0.018940079 TNFSF15;CARD9
7 cytokine-mediated signaling pathway (GO:0019221) 3/621 0.018940079 TNFRSF6B;TNFSF15;STAT3
8 positive regulation of NF-kappaB transcription factor activity (GO:0051092) 2/155 0.018940079 CARD9;STAT3
9 positive regulation of metallopeptidase activity (GO:1905050) 1/5 0.018940079 STAT3
10 cellular response to tumor necrosis factor (GO:0071356) 2/194 0.018940079 TNFRSF6B;TNFSF15
11 radial glial cell differentiation (GO:0060019) 1/6 0.018940079 STAT3
12 T-helper 17 cell lineage commitment (GO:0072540) 1/6 0.018940079 STAT3
13 T-helper 17 cell differentiation (GO:0072539) 1/7 0.018940079 STAT3
14 astrocyte differentiation (GO:0048708) 1/7 0.018940079 STAT3
15 regulation of miRNA mediated inhibition of translation (GO:1905616) 1/7 0.018940079 STAT3
16 photoreceptor cell differentiation (GO:0046530) 1/7 0.018940079 STAT3
17 positive regulation of miRNA mediated inhibition of translation (GO:1905618) 1/7 0.018940079 STAT3
18 cellular response to interleukin-21 (GO:0098757) 1/8 0.018940079 STAT3
19 T-helper cell lineage commitment (GO:0002295) 1/8 0.018940079 STAT3
20 peptidyl-proline hydroxylation to 4-hydroxy-L-proline (GO:0018401) 1/8 0.018940079 P4HA2
21 myeloid leukocyte mediated immunity (GO:0002444) 1/8 0.018940079 CARD9
22 interleukin-21-mediated signaling pathway (GO:0038114) 1/8 0.018940079 STAT3
23 regulation of ERK1 and ERK2 cascade (GO:0070372) 2/238 0.018940079 RGS14;CARD9
24 positive regulation of DNA-binding transcription factor activity (GO:0051091) 2/246 0.018940079 CARD9;STAT3
25 cellular response to interleukin-9 (GO:0071355) 1/9 0.018940079 STAT3
26 cellular response to leptin stimulus (GO:0044320) 1/9 0.018940079 STAT3
27 response to leptin (GO:0044321) 1/9 0.018940079 STAT3
28 regulation of DNA-templated transcription in response to stress (GO:0043620) 1/9 0.018940079 RGS14
29 interleukin-23-mediated signaling pathway (GO:0038155) 1/9 0.018940079 STAT3
30 interleukin-9-mediated signaling pathway (GO:0038113) 1/9 0.018940079 STAT3
31 leptin-mediated signaling pathway (GO:0033210) 1/10 0.018940079 STAT3
32 regulation of T-helper 17 type immune response (GO:2000316) 1/10 0.018940079 CARD9
33 immunoglobulin mediated immune response (GO:0016064) 1/10 0.018940079 CARD9
34 positive regulation of posttranscriptional gene silencing (GO:0060148) 1/11 0.018940079 STAT3
35 B cell mediated immunity (GO:0019724) 1/11 0.018940079 CARD9
36 peptidyl-proline hydroxylation (GO:0019511) 1/11 0.018940079 P4HA2
37 interleukin-35-mediated signaling pathway (GO:0070757) 1/11 0.018940079 STAT3
38 cellular response to growth hormone stimulus (GO:0071378) 1/12 0.018940079 STAT3
39 regulation of feeding behavior (GO:0060259) 1/12 0.018940079 STAT3
40 eye photoreceptor cell differentiation (GO:0001754) 1/12 0.018940079 STAT3
41 positive regulation of T-helper 17 type immune response (GO:2000318) 1/12 0.018940079 CARD9
42 negative regulation of production of miRNAs involved in gene silencing by miRNA (GO:1903799) 1/12 0.018940079 STAT3
43 positive regulation of adaptive immune response based on somatic recombination of immune receptors built from immunoglobulin superfamily domains (GO:0002824) 1/13 0.018940079 CARD9
44 cellular response to interleukin-15 (GO:0071350) 1/13 0.018940079 STAT3
45 antifungal innate immune response (GO:0061760) 1/13 0.018940079 CARD9
46 homeostasis of number of cells (GO:0048872) 1/13 0.018940079 CARD9
47 interleukin-15-mediated signaling pathway (GO:0035723) 1/13 0.018940079 STAT3
48 growth hormone receptor signaling pathway via JAK-STAT (GO:0060397) 1/14 0.019561550 STAT3
49 positive regulation of granulocyte macrophage colony-stimulating factor production (GO:0032725) 1/14 0.019561550 CARD9
50 interleukin-27-mediated signaling pathway (GO:0070106) 1/15 0.019911254 STAT3
51 positive regulation of cytokine production (GO:0001819) 2/335 0.019911254 CARD9;STAT3
52 activation of NF-kappaB-inducing kinase activity (GO:0007250) 1/16 0.019911254 TNFSF15
53 regulation of granulocyte macrophage colony-stimulating factor production (GO:0032645) 1/16 0.019911254 CARD9
54 nuclear transport (GO:0051169) 1/16 0.019911254 RGS14
55 platelet-derived growth factor receptor signaling pathway (GO:0048008) 1/16 0.019911254 RGS14
56 positive regulation of stress-activated protein kinase signaling cascade (GO:0070304) 1/18 0.021607720 CARD9
57 interleukin-6-mediated signaling pathway (GO:0070102) 1/18 0.021607720 STAT3
58 cellular response to interleukin-7 (GO:0098761) 1/19 0.021664498 STAT3
59 long-term memory (GO:0007616) 1/19 0.021664498 RGS14
60 interleukin-7-mediated signaling pathway (GO:0038111) 1/19 0.021664498 STAT3
61 adaptive immune response based on somatic recombination of immune receptors built from immunoglobulin superfamily domains (GO:0002460) 1/20 0.021715543 STAT3
62 eye morphogenesis (GO:0048592) 1/20 0.021715543 STAT3
63 growth hormone receptor signaling pathway (GO:0060396) 1/20 0.021715543 STAT3
64 long-term synaptic potentiation (GO:0060291) 1/21 0.022441688 RGS14
65 transmembrane receptor protein tyrosine kinase signaling pathway (GO:0007169) 2/404 0.023471409 RGS14;STAT3
66 negative regulation of G protein-coupled receptor signaling pathway (GO:0045744) 1/23 0.023471409 RGS14
67 positive regulation of interleukin-17 production (GO:0032740) 1/23 0.023471409 CARD9
68 defense response to fungus (GO:0050832) 1/24 0.024128116 CARD9
69 receptor signaling pathway via STAT (GO:0097696) 1/25 0.024411699 STAT3
70 peptide catabolic process (GO:0043171) 1/25 0.024411699 NPEPPS
71 positive regulation of erythrocyte differentiation (GO:0045648) 1/27 0.025624606 STAT3
72 positive regulation of gene silencing by miRNA (GO:2000637) 1/27 0.025624606 STAT3
73 cellular response to interleukin-6 (GO:0071354) 1/28 0.026205717 STAT3
74 glial cell differentiation (GO:0010001) 1/29 0.026770846 STAT3
75 positive regulation of endopeptidase activity (GO:0010950) 1/30 0.027320632 STAT3
76 receptor signaling pathway via JAK-STAT (GO:0007259) 1/31 0.027493920 STAT3
77 positive regulation of protein targeting to mitochondrion (GO:1903955) 1/31 0.027493920 NPEPPS
78 positive regulation of interleukin-10 production (GO:0032733) 1/32 0.027519972 STAT3
79 modulation by host of symbiont process (GO:0051851) 1/32 0.027519972 CARD9
80 positive regulation of gene expression (GO:0010628) 2/482 0.027519972 CARD9;STAT3
81 regulation of interleukin-17 production (GO:0032660) 1/33 0.027814066 CARD9
82 positive regulation of pri-miRNA transcription by RNA polymerase II (GO:1902895) 1/34 0.028303202 STAT3
83 positive regulation of myeloid cell differentiation (GO:0045639) 1/37 0.030053686 STAT3
84 regulation of erythrocyte differentiation (GO:0045646) 1/37 0.030053686 STAT3
85 positive regulation of cell development (GO:0010720) 1/38 0.030143618 RGS14
86 response to estradiol (GO:0032355) 1/38 0.030143618 STAT3
87 regulation of protein targeting to mitochondrion (GO:1903214) 1/39 0.030229231 NPEPPS
88 response to peptide (GO:1901652) 1/39 0.030229231 STAT3
89 nucleocytoplasmic transport (GO:0006913) 1/40 0.030651384 RGS14
90 positive regulation of nervous system development (GO:0051962) 1/45 0.033333387 RGS14
91 positive regulation of Notch signaling pathway (GO:0045747) 1/45 0.033333387 STAT3
92 regulation of pri-miRNA transcription by RNA polymerase II (GO:1902893) 1/45 0.033333387 STAT3
93 regulation of interleukin-10 production (GO:0032653) 1/48 0.034783473 STAT3
94 negative regulation of MAP kinase activity (GO:0043407) 1/48 0.034783473 RGS14
95 regulation of stress-activated MAPK cascade (GO:0032872) 1/49 0.035129095 CARD9
96 negative regulation of ERK1 and ERK2 cascade (GO:0070373) 1/50 0.035467305 RGS14
97 response to peptide hormone (GO:0043434) 1/52 0.036494793 STAT3
98 positive regulation of establishment of protein localization to mitochondrion (GO:1903749) 1/56 0.038485033 NPEPPS
99 positive regulation of interleukin-1 beta production (GO:0032731) 1/56 0.038485033 STAT3
100 negative regulation of autophagy (GO:0010507) 1/59 0.039725966 STAT3
101 positive regulation of tyrosine phosphorylation of STAT protein (GO:0042531) 1/59 0.039725966 STAT3
102 response to organic cyclic compound (GO:0014070) 1/60 0.039758910 STAT3
103 positive regulation of interleukin-8 production (GO:0032757) 1/61 0.039758910 STAT3
104 positive regulation of cysteine-type endopeptidase activity (GO:2001056) 1/62 0.039758910 CARD9
105 regulation of neurogenesis (GO:0050767) 1/62 0.039758910 RGS14
106 positive regulation of interleukin-1 production (GO:0032732) 1/62 0.039758910 STAT3
107 organonitrogen compound catabolic process (GO:1901565) 1/63 0.040016616 NPEPPS
108 regulation of gene silencing by miRNA (GO:0060964) 1/67 0.042138046 STAT3
109 regulation of tyrosine phosphorylation of STAT protein (GO:0042509) 1/68 0.042210388 STAT3
110 negative regulation of cellular catabolic process (GO:0031330) 1/69 0.042210388 STAT3
111 cellular response to decreased oxygen levels (GO:0036294) 1/69 0.042210388 NPEPPS
112 carbohydrate homeostasis (GO:0033500) 1/70 0.042433435 STAT3
113 positive regulation of neurogenesis (GO:0050769) 1/72 0.043078247 RGS14
114 positive regulation of synaptic transmission (GO:0050806) 1/73 0.043078247 RGS14
115 positive regulation of JNK cascade (GO:0046330) 1/73 0.043078247 CARD9
116 NIK/NF-kappaB signaling (GO:0038061) 1/74 0.043159673 TNFSF15
117 cellular response to hormone stimulus (GO:0032870) 1/76 0.043159673 STAT3
118 establishment of protein localization to organelle (GO:0072594) 1/76 0.043159673 STAT3
119 protein import into nucleus (GO:0006606) 1/76 0.043159673 STAT3
120 positive regulation of tumor necrosis factor production (GO:0032760) 1/77 0.043159673 STAT3
121 import into nucleus (GO:0051170) 1/77 0.043159673 STAT3
122 negative regulation of protein serine/threonine kinase activity (GO:0071901) 1/78 0.043355332 RGS14
123 activation of cysteine-type endopeptidase activity involved in apoptotic process (GO:0006919) 1/81 0.043598434 TNFSF15
124 regulation of interleukin-8 production (GO:0032677) 1/81 0.043598434 STAT3
125 positive regulation of tumor necrosis factor superfamily cytokine production (GO:1903557) 1/81 0.043598434 STAT3
126 regulation of G protein-coupled receptor signaling pathway (GO:0008277) 1/82 0.043598434 RGS14
127 regulation of interleukin-1 beta production (GO:0032651) 1/83 0.043598434 STAT3
128 peptide metabolic process (GO:0006518) 1/83 0.043598434 NPEPPS
129 regulation of Notch signaling pathway (GO:0008593) 1/83 0.043598434 STAT3
130 glucose homeostasis (GO:0042593) 1/86 0.044806649 STAT3
131 collagen fibril organization (GO:0030199) 1/89 0.045303380 P4HA2
132 regulation of cysteine-type endopeptidase activity involved in apoptotic process (GO:0043281) 1/89 0.045303380 CARD9
133 protein import (GO:0017038) 1/89 0.045303380 STAT3
134 protein complex oligomerization (GO:0051259) 1/90 0.045463714 CARD9
135 negative regulation of MAPK cascade (GO:0043409) 1/94 0.047104363 RGS14
136 regulation of MAP kinase activity (GO:0043405) 1/97 0.048228613 RGS14
137 positive regulation of stress-activated MAPK cascade (GO:0032874) 1/99 0.048849093 CARD9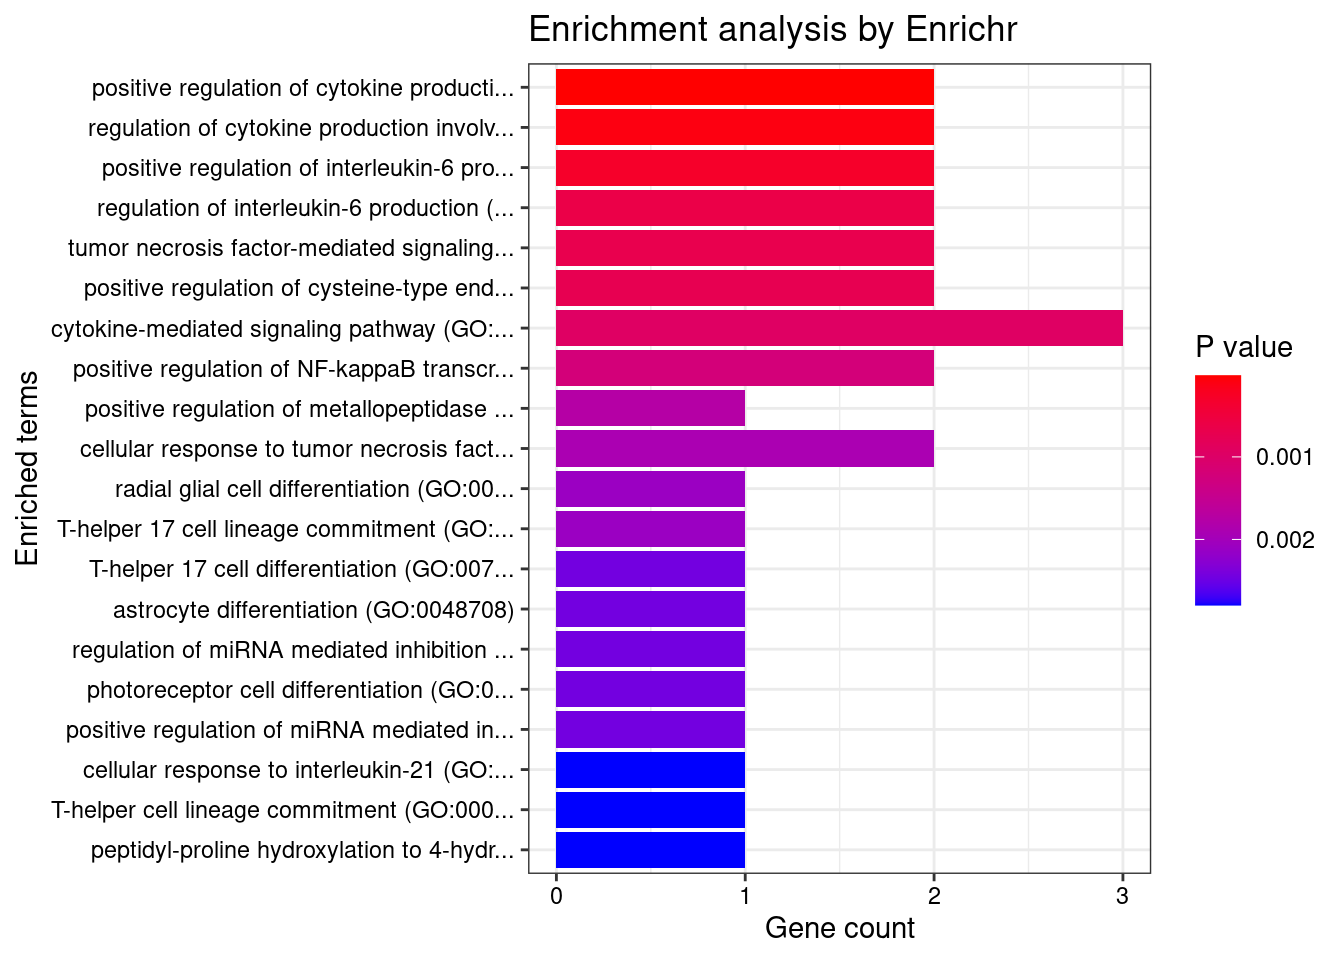
| Version | Author | Date |
|---|---|---|
| 65634fd | wesleycrouse | 2022-06-30 |
Spleen
Number of cTWAS Genes in Tissue: 8
Uploading data to Enrichr... Done.
Querying GO_Biological_Process_2021... Done.
Parsing results... Done.
GO_Biological_Process_2021
Term Overlap Adjusted.P.value Genes
1 cellular response to lectin (GO:1990858) 2/115 0.02470749 MUC1;CARD9
2 stimulatory C-type lectin receptor signaling pathway (GO:0002223) 2/115 0.02470749 MUC1;CARD9
3 positive regulation of cysteine-type endopeptidase activity involved in apoptotic process (GO:0043280) 2/119 0.02470749 TNFSF15;CARD9
4 innate immune response activating cell surface receptor signaling pathway (GO:0002220) 2/119 0.02470749 MUC1;CARD9
5 cellular response to granulocyte macrophage colony-stimulating factor stimulus (GO:0097011) 1/6 0.02470749 ZFP36L2
6 response to granulocyte macrophage colony-stimulating factor (GO:0097012) 1/6 0.02470749 ZFP36L2
7 cellular response to tumor necrosis factor (GO:0071356) 2/194 0.02470749 TNFSF15;ZFP36L2
8 definitive hemopoiesis (GO:0060216) 1/7 0.02470749 ZFP36L2
9 negative regulation of cell cycle phase transition (GO:1901988) 1/7 0.02470749 ZFP36L2
10 positive regulation of histone H4 acetylation (GO:0090240) 1/7 0.02470749 MUC1
11 myeloid leukocyte mediated immunity (GO:0002444) 1/8 0.02470749 CARD9
12 regulation of histone H4 acetylation (GO:0090239) 1/9 0.02470749 MUC1
13 regulation of DNA-templated transcription in response to stress (GO:0043620) 1/9 0.02470749 MUC1
14 regulation of receptor binding (GO:1900120) 1/10 0.02470749 ADAM15
15 negative regulation of cell adhesion mediated by integrin (GO:0033629) 1/10 0.02470749 MUC1
16 negative regulation of transcription by competitive promoter binding (GO:0010944) 1/10 0.02470749 MUC1
17 DNA damage response, signal transduction by p53 class mediator resulting in transcription of p21 class mediator (GO:0006978) 1/10 0.02470749 MUC1
18 regulation of T-helper 17 type immune response (GO:2000316) 1/10 0.02470749 CARD9
19 immunoglobulin mediated immune response (GO:0016064) 1/10 0.02470749 CARD9
20 negative regulation of receptor binding (GO:1900121) 1/10 0.02470749 ADAM15
21 DNA damage response, signal transduction resulting in transcription (GO:0042772) 1/11 0.02470749 MUC1
22 B cell mediated immunity (GO:0019724) 1/11 0.02470749 CARD9
23 positive regulation of T-helper 17 type immune response (GO:2000318) 1/12 0.02470749 CARD9
24 positive regulation of adaptive immune response based on somatic recombination of immune receptors built from immunoglobulin superfamily domains (GO:0002824) 1/13 0.02470749 CARD9
25 negative regulation of intrinsic apoptotic signaling pathway in response to DNA damage by p53 class mediator (GO:1902166) 1/13 0.02470749 MUC1
26 negative regulation of stem cell differentiation (GO:2000737) 1/13 0.02470749 ZFP36L2
27 homeostasis of number of cells (GO:0048872) 1/13 0.02470749 CARD9
28 antifungal innate immune response (GO:0061760) 1/13 0.02470749 CARD9
29 positive regulation of granulocyte macrophage colony-stimulating factor production (GO:0032725) 1/14 0.02470749 CARD9
30 regulation of intrinsic apoptotic signaling pathway in response to DNA damage by p53 class mediator (GO:1902165) 1/14 0.02470749 MUC1
31 T cell differentiation in thymus (GO:0033077) 1/14 0.02470749 ZFP36L2
32 positive regulation of nuclear-transcribed mRNA catabolic process, deadenylation-dependent decay (GO:1900153) 1/15 0.02470749 ZFP36L2
33 regulation of nuclear-transcribed mRNA catabolic process, deadenylation-dependent decay (GO:1900151) 1/15 0.02470749 ZFP36L2
34 innate immune response (GO:0045087) 2/302 0.02470749 ADAM15;CARD9
35 3'-UTR-mediated mRNA destabilization (GO:0061158) 1/16 0.02470749 ZFP36L2
36 activation of NF-kappaB-inducing kinase activity (GO:0007250) 1/16 0.02470749 TNFSF15
37 regulation of granulocyte macrophage colony-stimulating factor production (GO:0032645) 1/16 0.02470749 CARD9
38 cellular response to corticosteroid stimulus (GO:0071384) 1/16 0.02470749 ZFP36L2
39 negative regulation of intrinsic apoptotic signaling pathway by p53 class mediator (GO:1902254) 1/17 0.02470749 MUC1
40 positive regulation of cytokine production involved in inflammatory response (GO:1900017) 1/17 0.02470749 CARD9
41 cellular response to glucocorticoid stimulus (GO:0071385) 1/18 0.02470749 ZFP36L2
42 regulation of B cell differentiation (GO:0045577) 1/18 0.02470749 ZFP36L2
43 positive regulation of stress-activated protein kinase signaling cascade (GO:0070304) 1/18 0.02470749 CARD9
44 regulation of lymphocyte proliferation (GO:0050670) 1/19 0.02548295 LST1
45 regulation of lymphocyte differentiation (GO:0045619) 1/20 0.02622348 ZFP36L2
46 negative regulation of lymphocyte activation (GO:0051250) 1/22 0.02768070 LST1
47 ERK1 and ERK2 cascade (GO:0070371) 1/23 0.02768070 ZFP36L2
48 positive regulation of histone acetylation (GO:0035066) 1/23 0.02768070 MUC1
49 positive regulation of interleukin-17 production (GO:0032740) 1/23 0.02768070 CARD9
50 defense response to fungus (GO:0050832) 1/24 0.02774664 CARD9
51 positive regulation of transcription from RNA polymerase II promoter in response to stress (GO:0036003) 1/24 0.02774664 MUC1
52 negative regulation of intrinsic apoptotic signaling pathway in response to DNA damage (GO:1902230) 1/26 0.02947050 MUC1
53 response to glucocorticoid (GO:0051384) 1/27 0.02999585 ZFP36L2
54 regulation of B cell activation (GO:0050864) 1/28 0.02999585 ZFP36L2
55 cellular response to epidermal growth factor stimulus (GO:0071364) 1/28 0.02999585 ZFP36L2
56 negative regulation of cell-matrix adhesion (GO:0001953) 1/32 0.03305501 ADAM15
57 modulation by host of symbiont process (GO:0051851) 1/32 0.03305501 CARD9
58 regulation of interleukin-17 production (GO:0032660) 1/33 0.03349440 CARD9
59 regulation of cell adhesion mediated by integrin (GO:0033628) 1/34 0.03391855 MUC1
60 cellular response to hydrogen peroxide (GO:0070301) 1/35 0.03432822 OSER1
61 negative regulation of fat cell differentiation (GO:0045599) 1/36 0.03472412 ZFP36L2
62 cellular response to cytokine stimulus (GO:0071345) 2/482 0.03518491 MUC1;ZFP36L2
63 mRNA destabilization (GO:0061157) 1/38 0.03528435 ZFP36L2
64 cellular response to ketone (GO:1901655) 1/39 0.03528435 ADAM15
65 negative regulation of lymphocyte proliferation (GO:0050672) 1/39 0.03528435 LST1
66 negative regulation of cell-substrate adhesion (GO:0010812) 1/40 0.03563453 ADAM15
67 T cell differentiation (GO:0030217) 1/41 0.03597395 ZFP36L2
68 regulation of cytokine production involved in inflammatory response (GO:1900015) 1/43 0.03693227 CARD9
69 mRNA catabolic process (GO:0006402) 1/44 0.03693227 ZFP36L2
70 positive regulation of mRNA catabolic process (GO:0061014) 1/44 0.03693227 ZFP36L2
71 negative regulation of mitotic cell cycle (GO:0045930) 1/48 0.03784900 ZFP36L2
72 cellular response to alcohol (GO:0097306) 1/48 0.03784900 ADAM15
73 response to hydrogen peroxide (GO:0042542) 1/49 0.03784900 OSER1
74 regulation of stress-activated MAPK cascade (GO:0032872) 1/49 0.03784900 CARD9
75 RNA catabolic process (GO:0006401) 1/49 0.03784900 ZFP36L2
76 cellular defense response (GO:0006968) 1/49 0.03784900 LSP1
77 DNA damage response, signal transduction by p53 class mediator resulting in cell cycle arrest (GO:0006977) 1/56 0.04264205 MUC1
78 cytokine-mediated signaling pathway (GO:0019221) 2/621 0.04516392 MUC1;TNFSF15
79 O-glycan processing (GO:0016266) 1/61 0.04523391 MUC1
80 positive regulation of cysteine-type endopeptidase activity (GO:2001056) 1/62 0.04539282 CARD9
81 cellular response to reactive oxygen species (GO:0034614) 1/63 0.04544719 OSER1
82 regulation of cell-matrix adhesion (GO:0001952) 1/65 0.04544719 ADAM15
83 mitotic G1 DNA damage checkpoint signaling (GO:0031571) 1/65 0.04544719 MUC1
84 extracellular matrix disassembly (GO:0022617) 1/66 0.04544719 ADAM15
85 cellular component disassembly (GO:0022411) 1/66 0.04544719 ADAM15
86 negative regulation of cell adhesion (GO:0007162) 1/73 0.04805785 MUC1
87 positive regulation of JNK cascade (GO:0046330) 1/73 0.04805785 CARD9
88 DNA damage response, signal transduction by p53 class mediator (GO:0030330) 1/74 0.04805785 MUC1
89 NIK/NF-kappaB signaling (GO:0038061) 1/74 0.04805785 TNFSF15
90 negative regulation of protein binding (GO:0032091) 1/74 0.04805785 ADAM15
91 integrin-mediated signaling pathway (GO:0007229) 1/75 0.04816362 ADAM15
92 positive regulation of interleukin-6 production (GO:0032755) 1/76 0.04826687 CARD9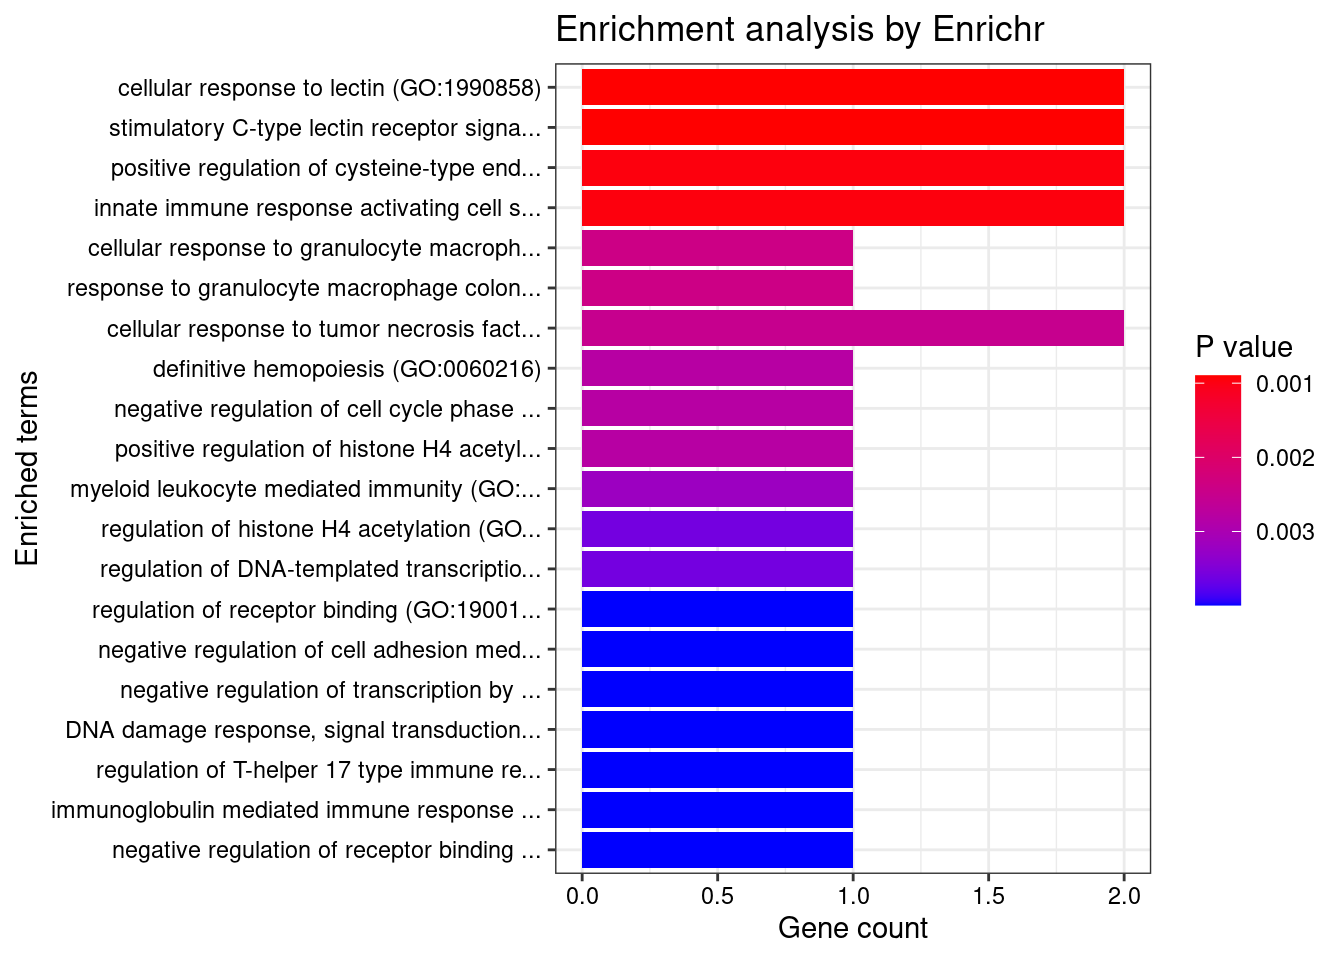
| Version | Author | Date |
|---|---|---|
| 65634fd | wesleycrouse | 2022-06-30 |
KEGG
output <- output[order(-output$pve_g),]
top_tissues <- output$weight[1:5]
for (tissue in top_tissues){
cat(paste0(tissue, "\n\n"))
ctwas_genes_tissue <- df[[tissue]]$ctwas
background_tissue <- df[[tissue]]$gene_pips$genename
cat(paste0("Number of cTWAS Genes in Tissue: ", length(ctwas_genes_tissue), "\n\n"))
databases <- c("pathway_KEGG")
enrichResult <- NULL
try(enrichResult <- WebGestaltR(enrichMethod="ORA", organism="hsapiens",
interestGene=ctwas_genes_tissue, referenceGene=background_tissue,
enrichDatabase=databases, interestGeneType="genesymbol",
referenceGeneType="genesymbol", isOutput=F))
if (!is.null(enrichResult)){
print(enrichResult[,c("description", "size", "overlap", "FDR", "userId")])
}
cat("\n")
} Whole_Blood
Number of cTWAS Genes in Tissue: 17
Loading the functional categories...
Loading the ID list...
Loading the reference list...
Performing the enrichment analysis...Warning in oraEnrichment(interestGeneList, referenceGeneList, geneSet, minNum = minNum, : No significant gene set is identified based on FDR 0.05!
Esophagus_Muscularis

Number of cTWAS Genes in Tissue: 8

Loading the functional categories...
Loading the ID list...
Loading the reference list...
Performing the enrichment analysis...
Warning in oraEnrichment(interestGeneList, referenceGeneList, geneSet, minNum = minNum, : No significant gene set is identified based on FDR 0.05!
Skin_Not_Sun_Exposed_Suprapubic

Number of cTWAS Genes in Tissue: 3

Loading the functional categories...
Loading the ID list...
Loading the reference list...
Performing the enrichment analysis...
Warning in oraEnrichment(interestGeneList, referenceGeneList, geneSet, minNum = minNum, : No significant gene set is identified based on FDR 0.05!
Uterus

Number of cTWAS Genes in Tissue: 7

Loading the functional categories...
Loading the ID list...
Loading the reference list...
Performing the enrichment analysis...
Warning in oraEnrichment(interestGeneList, referenceGeneList, geneSet, minNum = minNum, : No significant gene set is identified based on FDR 0.05!
Spleen

Number of cTWAS Genes in Tissue: 8

Loading the functional categories...
Loading the ID list...
Loading the reference list...
Performing the enrichment analysis...
Warning in oraEnrichment(interestGeneList, referenceGeneList, geneSet, minNum = minNum, : No significant gene set is identified based on FDR 0.05!DisGeNET
output <- output[order(-output$pve_g),]
top_tissues <- output$weight[1:5]

for (tissue in top_tissues){
  cat(paste0(tissue, "\n\n"))

  ctwas_genes_tissue <- df[[tissue]]$ctwas

  cat(paste0("Number of cTWAS Genes in Tissue: ", length(ctwas_genes_tissue), "\n\n"))

  res_enrich <- disease_enrichment(entities=ctwas_genes_tissue, vocabulary = "HGNC", database = "CURATED")

  if (any(res_enrich@qresult$FDR < 0.05)){
    print(res_enrich@qresult[res_enrich@qresult$FDR < 0.05, c("Description", "FDR", "Ratio",  "BgRatio")])
  }

  cat("\n")
}
Gene sets curated by Macarthur Lab
output <- output[order(-output$pve_g),]
top_tissues <- output$weight[1:5]

gene_set_dir <- "/project2/mstephens/wcrouse/gene_sets/"
gene_set_files <- c("gwascatalog.tsv",
                    "mgi_essential.tsv",
                    "core_essentials_hart.tsv",
                    "clinvar_path_likelypath.tsv",
                    "fda_approved_drug_targets.tsv")

for (tissue in top_tissues){
  cat(paste0(tissue, "\n\n"))

  ctwas_genes_tissue <- df[[tissue]]$ctwas
  background_tissue <- df[[tissue]]$gene_pips$genename

  cat(paste0("Number of cTWAS Genes in Tissue: ", length(ctwas_genes_tissue), "\n\n"))

  gene_sets <- lapply(gene_set_files, function(x){as.character(read.table(paste0(gene_set_dir, x))[,1])})
  names(gene_sets) <- sapply(gene_set_files, function(x){unlist(strsplit(x, "[.]"))[1]})

  gene_lists <- list(ctwas_genes_tissue=ctwas_genes_tissue)

  #genes in gene_sets filtered to ensure inclusion in background
  gene_sets <- lapply(gene_sets, function(x){x[x %in% background_tissue]})

  ##########
  hyp_score <- data.frame()
  size <- c()
  ngenes <- c()

  for (i in 1:length(gene_sets)) {
    for (j in 1:length(gene_lists)){
      group1 <- length(gene_sets[[i]])
      group2 <- length(as.vector(gene_lists[[j]]))
      size <- c(size, group1)
      Overlap <- length(intersect(gene_sets[[i]],as.vector(gene_lists[[j]])))
      ngenes <- c(ngenes, Overlap)
      Total <- length(background_tissue)
      hyp_score[i,j] <- phyper(Overlap-1, group2, Total-group2, group1,lower.tail=F)
    }
  }
  rownames(hyp_score) <- names(gene_sets)
  colnames(hyp_score) <- names(gene_lists)

  hyp_score_padj <- apply(hyp_score,2, p.adjust, method="BH", n=(nrow(hyp_score)*ncol(hyp_score)))
  hyp_score_padj <- as.data.frame(hyp_score_padj)
  hyp_score_padj$gene_set <- rownames(hyp_score_padj)
  hyp_score_padj$nset <- size
  hyp_score_padj$ngenes <- ngenes
  hyp_score_padj$percent <- ngenes/size

  hyp_score_padj <- hyp_score_padj[order(hyp_score_padj$ctwas_genes),]
  colnames(hyp_score_padj)[1] <- "padj"
  hyp_score_padj <- hyp_score_padj[,c(2:5,1)]
  rownames(hyp_score_padj)<- NULL

  print(hyp_score_padj)

  cat("\n")
}
Whole_Blood
Number of cTWAS Genes in Tissue: 17
gene_set nset ngenes percent padj
1 gwascatalog 3492 6 0.001718213 0.76222
2 mgi_essential 1255 3 0.002390438 0.76222
3 clinvar_path_likelypath 1605 3 0.001869159 0.76222
4 fda_approved_drug_targets 177 1 0.005649718 0.76222
5 core_essentials_hart 154 0 0.000000000 1.00000
Esophagus_Muscularis
Number of cTWAS Genes in Tissue: 8
gene_set nset ngenes percent padj
1 gwascatalog 3890 7 0.0017994859 0.01959118
2 fda_approved_drug_targets 194 1 0.0051546392 0.33314156
3 mgi_essential 1413 2 0.0014154282 0.46048666
4 clinvar_path_likelypath 1778 1 0.0005624297 0.94711439
5 core_essentials_hart 175 0 0.0000000000 1.00000000
Skin_Not_Sun_Exposed_Suprapubic
Number of cTWAS Genes in Tissue: 3
gene_set nset ngenes percent padj
1 mgi_essential 1462 2 0.0013679891 0.2332385
2 gwascatalog 3930 2 0.0005089059 0.6907994
3 clinvar_path_likelypath 1830 1 0.0005464481 0.6907994
4 core_essentials_hart 172 0 0.0000000000 1.0000000
5 fda_approved_drug_targets 207 0 0.0000000000 1.0000000
Uterus
Number of cTWAS Genes in Tissue: 7
gene_set nset ngenes percent padj
1 gwascatalog 3209 5 0.001558118 0.1325796
2 mgi_essential 1146 3 0.002617801 0.1325796
3 clinvar_path_likelypath 1523 2 0.001313198 0.5392098
4 core_essentials_hart 157 0 0.000000000 1.0000000
5 fda_approved_drug_targets 169 0 0.000000000 1.0000000
Spleen
Number of cTWAS Genes in Tissue: 8
gene_set nset ngenes percent padj
1 gwascatalog 3580 7 0.0019553073 0.01832511
2 clinvar_path_likelypath 1666 2 0.0012004802 0.96440453
3 mgi_essential 1269 1 0.0007880221 1.00000000
4 core_essentials_hart 171 0 0.0000000000 1.00000000
5 fda_approved_drug_targets 181 0 0.0000000000 1.00000000Summary of results across tissues
weight_groups <- as.data.frame(matrix(c("Adipose_Subcutaneous", "Adipose",
                                        "Adipose_Visceral_Omentum", "Adipose",
                                        "Adrenal_Gland", "Endocrine",
                                        "Artery_Aorta", "Cardiovascular",
                                        "Artery_Coronary", "Cardiovascular",
                                        "Artery_Tibial", "Cardiovascular",
                                        "Brain_Amygdala", "CNS",
                                        "Brain_Anterior_cingulate_cortex_BA24", "CNS",
                                        "Brain_Caudate_basal_ganglia", "CNS",
                                        "Brain_Cerebellar_Hemisphere", "CNS",
                                        "Brain_Cerebellum", "CNS",
                                        "Brain_Cortex", "CNS",
                                        "Brain_Frontal_Cortex_BA9", "CNS",
                                        "Brain_Hippocampus", "CNS",
                                        "Brain_Hypothalamus", "CNS",
                                        "Brain_Nucleus_accumbens_basal_ganglia", "CNS",
                                        "Brain_Putamen_basal_ganglia", "CNS",
                                        "Brain_Spinal_cord_cervical_c-1", "CNS",
                                        "Brain_Substantia_nigra", "CNS",
                                        "Breast_Mammary_Tissue", "None",
                                        "Cells_Cultured_fibroblasts", "Skin",
                                        "Cells_EBV-transformed_lymphocytes", "Blood or Immune",
                                        "Colon_Sigmoid", "Digestive",
                                        "Colon_Transverse", "Digestive",
                                        "Esophagus_Gastroesophageal_Junction", "Digestive",
                                        "Esophagus_Mucosa", "Digestive",
                                        "Esophagus_Muscularis", "Digestive",
                                        "Heart_Atrial_Appendage", "Cardiovascular",
                                        "Heart_Left_Ventricle", "Cardiovascular",
                                        "Kidney_Cortex", "None",
                                        "Liver", "None",
                                        "Lung", "None",
                                        "Minor_Salivary_Gland", "None",
                                        "Muscle_Skeletal", "None",
                                        "Nerve_Tibial", "None",
                                        "Ovary", "None",
                                        "Pancreas", "None",
                                        "Pituitary", "Endocrine",
                                        "Prostate", "None",
                                        "Skin_Not_Sun_Exposed_Suprapubic", "Skin",
                                        "Skin_Sun_Exposed_Lower_leg", "Skin",
                                        "Small_Intestine_Terminal_Ileum", "Digestive",
                                        "Spleen", "Blood or Immune",
                                        "Stomach", "Digestive",
                                        "Testis", "Endocrine",
                                        "Thyroid", "Endocrine",
                                        "Uterus", "None",
                                        "Vagina", "None",
                                        "Whole_Blood", "Blood or Immune"),
                                      nrow=49, ncol=2, byrow=T), stringsAsFactors=F)
colnames(weight_groups) <- c("weight", "group")

#display tissue groups
print(weight_groups)
weight group
1 Adipose_Subcutaneous Adipose
2 Adipose_Visceral_Omentum Adipose
3 Adrenal_Gland Endocrine
4 Artery_Aorta Cardiovascular
5 Artery_Coronary Cardiovascular
6 Artery_Tibial Cardiovascular
7 Brain_Amygdala CNS
8 Brain_Anterior_cingulate_cortex_BA24 CNS
9 Brain_Caudate_basal_ganglia CNS
10 Brain_Cerebellar_Hemisphere CNS
11 Brain_Cerebellum CNS
12 Brain_Cortex CNS
13 Brain_Frontal_Cortex_BA9 CNS
14 Brain_Hippocampus CNS
15 Brain_Hypothalamus CNS
16 Brain_Nucleus_accumbens_basal_ganglia CNS
17 Brain_Putamen_basal_ganglia CNS
18 Brain_Spinal_cord_cervical_c-1 CNS
19 Brain_Substantia_nigra CNS
20 Breast_Mammary_Tissue None
21 Cells_Cultured_fibroblasts Skin
22 Cells_EBV-transformed_lymphocytes Blood or Immune
23 Colon_Sigmoid Digestive
24 Colon_Transverse Digestive
25 Esophagus_Gastroesophageal_Junction Digestive
26 Esophagus_Mucosa Digestive
27 Esophagus_Muscularis Digestive
28 Heart_Atrial_Appendage Cardiovascular
29 Heart_Left_Ventricle Cardiovascular
30 Kidney_Cortex None
31 Liver None
32 Lung None
33 Minor_Salivary_Gland None
34 Muscle_Skeletal None
35 Nerve_Tibial None
36 Ovary None
37 Pancreas None
38 Pituitary Endocrine
39 Prostate None
40 Skin_Not_Sun_Exposed_Suprapubic Skin
41 Skin_Sun_Exposed_Lower_leg Skin
42 Small_Intestine_Terminal_Ileum Digestive
43 Spleen Blood or Immune
44 Stomach Digestive
45 Testis Endocrine
46 Thyroid Endocrine
47 Uterus None
48 Vagina None
49 Whole_Blood Blood or Immunegroups <- unique(weight_groups$group)
df_group <- list()
for (i in 1:length(groups)){
group <- groups[i]
weights <- weight_groups$weight[weight_groups$group==group]
df_group[[group]] <- list(ctwas=unique(unlist(lapply(df[weights], function(x){x$ctwas}))),
background=unique(unlist(lapply(df[weights], function(x){x$gene_pips$genename}))))
}
output <- output[sapply(weight_groups$weight, match, output$weight),,drop=F]
output$group <- weight_groups$group
output$n_ctwas_group <- sapply(output$group, function(x){length(df_group[[x]][["ctwas"]])})
output$n_ctwas_group[output$group=="None"] <- 0
#barplot of number of cTWAS genes in each tissue
output <- output[order(-output$n_ctwas),,drop=F]
par(mar=c(10.1, 4.1, 4.1, 2.1))
barplot(output$n_ctwas, names.arg=output$weight, las=2, ylab="Number of cTWAS Genes", cex.names=0.6, main="")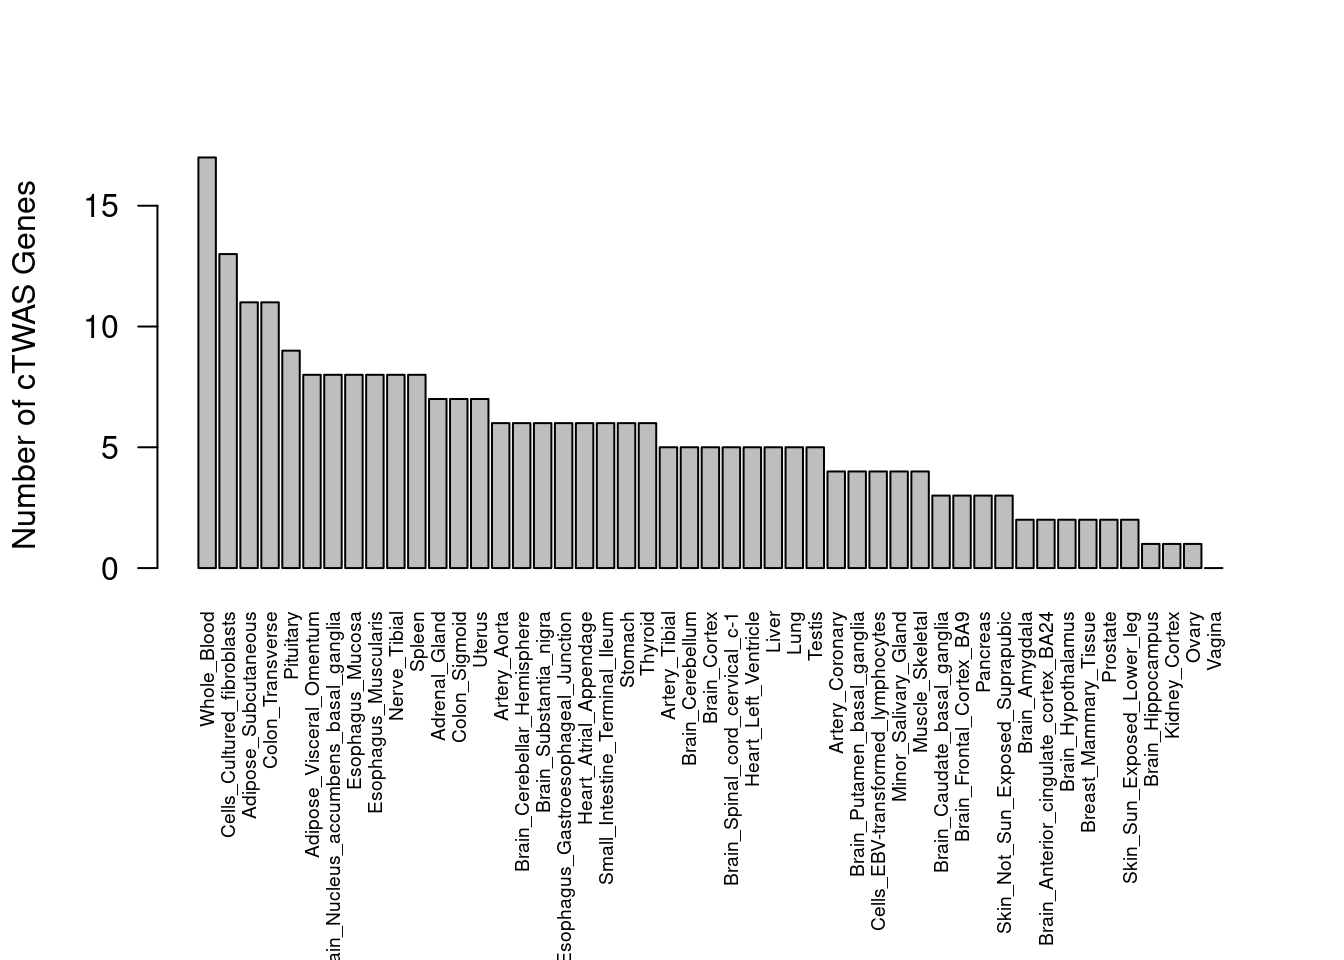
#barplot of number of cTWAS genes in each tissue
df_plot <- -sort(-sapply(groups[groups!="None"], function(x){length(df_group[[x]][["ctwas"]])}))

par(mar=c(10.1, 4.1, 4.1, 2.1))
barplot(df_plot, las=2, ylab="Number of cTWAS Genes", main="Number of cTWAS Genes by Tissue Group")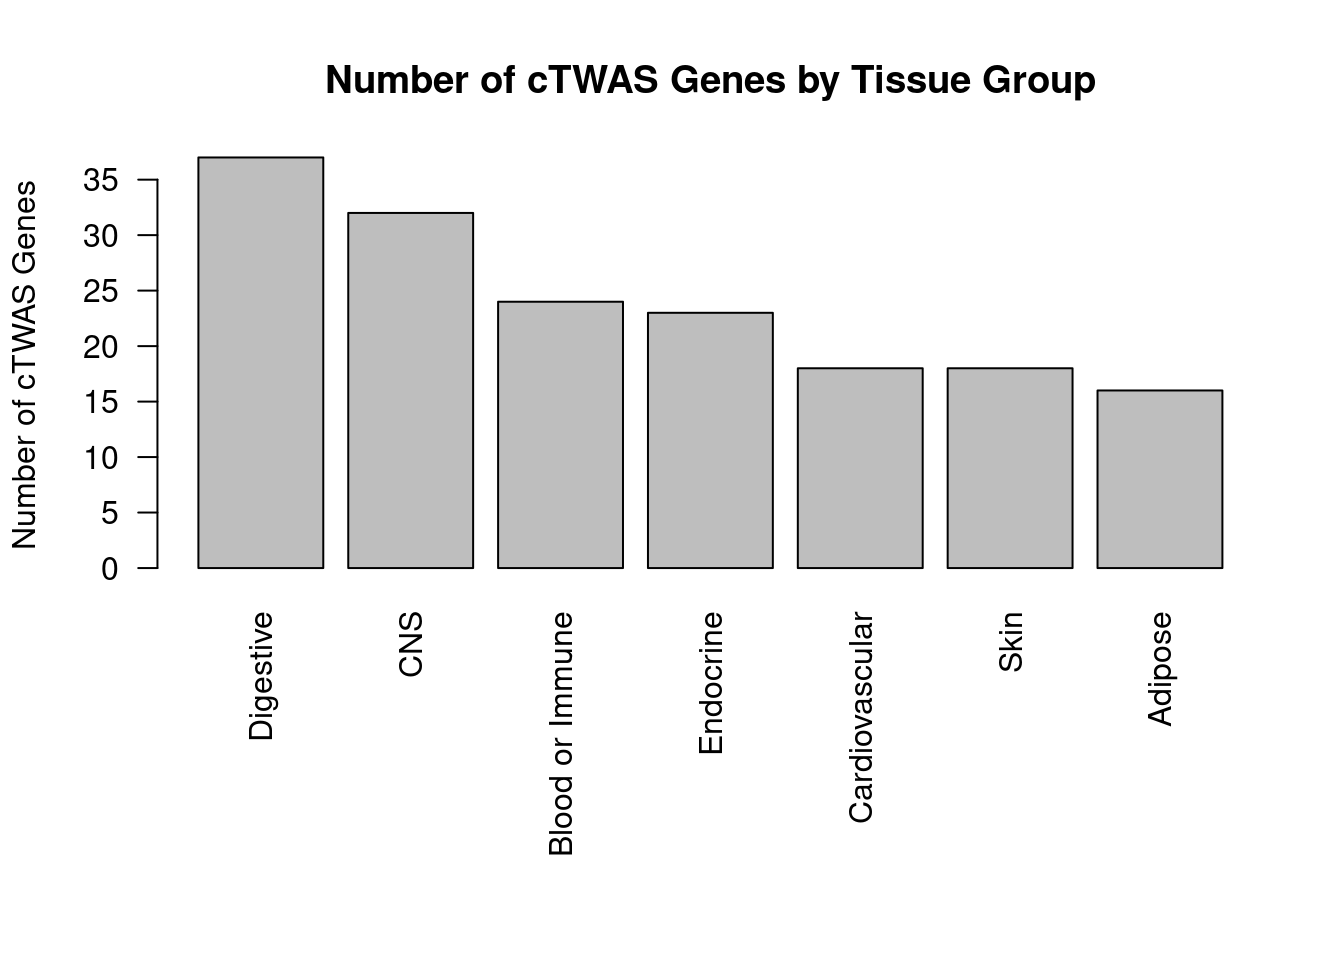
| Version | Author | Date |
|---|---|---|
| 65634fd | wesleycrouse | 2022-06-30 |
Enrichment analysis for cTWAS genes in each tissue group
GO
suppressWarnings(rm(group_enrichment_results))

for (group in names(df_group)){
  cat(paste0(group, "\n\n"))

  ctwas_genes_group <- df_group[[group]]$ctwas

  cat(paste0("Number of cTWAS Genes in Tissue Group: ", length(ctwas_genes_group), "\n\n"))

  dbs <- c("GO_Biological_Process_2021")
  GO_enrichment <- enrichr(ctwas_genes_group, dbs)

  for (db in dbs){
    cat(paste0("\n", db, "\n\n"))
    enrich_results <- GO_enrichment[[db]]
    enrich_results <- enrich_results[enrich_results$Adjusted.P.value<0.05,c("Term", "Overlap", "Adjusted.P.value", "Genes")]
    print(enrich_results)
    print(plotEnrich(GO_enrichment[[db]]))

    if (nrow(enrich_results)>0){
      if (!exists("group_enrichment_results")){
        group_enrichment_results <- cbind(group, db, enrich_results)
      } else {
        group_enrichment_results <- rbind(group_enrichment_results, cbind(group, db, enrich_results))
      }
    }
  }

}
Adipose
Number of cTWAS Genes in Tissue Group: 16
Uploading data to Enrichr... Done.
Querying GO_Biological_Process_2021... Done.
Parsing results... Done.
GO_Biological_Process_2021
Term Overlap Adjusted.P.value Genes
1 regulation of DNA-templated transcription in response to stress (GO:0043620) 2/9 0.004973297 MUC1;RGS14
2 cytokine-mediated signaling pathway (GO:0019221) 5/621 0.010778716 CIITA;MUC1;TNFSF15;TNFRSF14;HLA-DQA1
3 cellular response to tumor necrosis factor (GO:0071356) 3/194 0.035303691 TNFSF15;TNFRSF14;ZFP36L2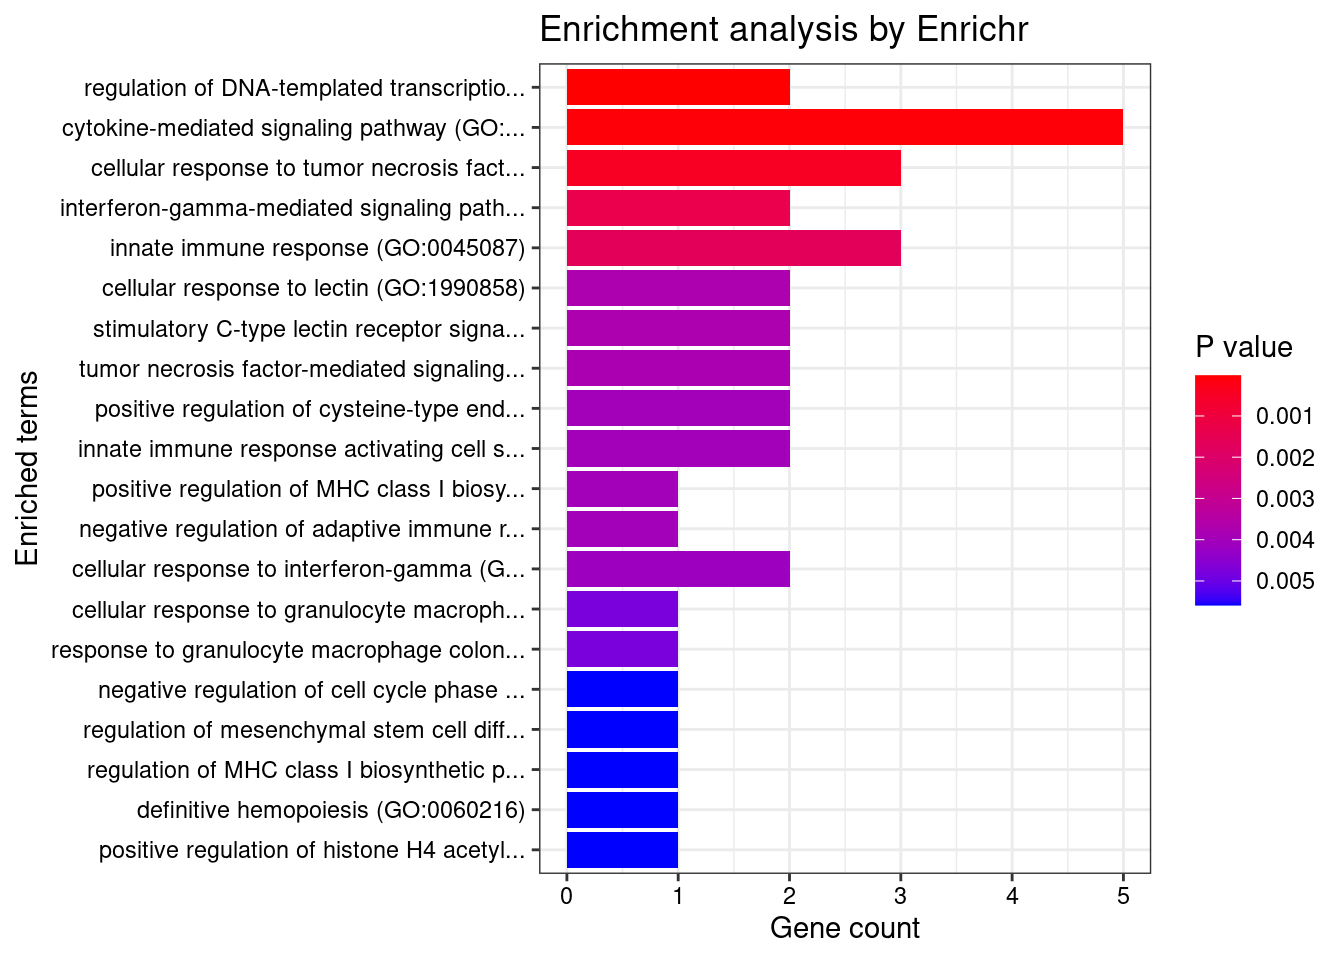
| Version | Author | Date |
|---|---|---|
| 65634fd | wesleycrouse | 2022-06-30 |
Endocrine

Number of cTWAS Genes in Tissue Group: 23

Uploading data to Enrichr... Done.
  Querying GO_Biological_Process_2021... Done.
Parsing results... Done.

GO_Biological_Process_2021

                                                                                                     Term Overlap Adjusted.P.value                                Genes
1                            regulation of DNA-templated transcription in response to stress (GO:0043620)     2/9       0.01188907                           MUC1;RGS14
2                                                        cytokine-mediated signaling pathway (GO:0019221)   6/621       0.01188907 MUC1;IRF3;TNFSF15;CCL20;IFNGR2;STAT3
3                           positive regulation of DNA-binding transcription factor activity (GO:0051091)   4/246       0.01582553              SMAD3;PRKCB;CARD9;STAT3
4               positive regulation of cytokine production involved in inflammatory response (GO:1900017)    2/17       0.01582553                          CARD9;STAT3
5                                                     cellular response to cytokine stimulus (GO:0071345)   5/482       0.01582553        MUC1;SMAD3;CCL20;IFNGR2;STAT3
6  positive regulation of cysteine-type endopeptidase activity involved in apoptotic process (GO:0043280)   3/119       0.02115946                  SMAD3;TNFSF15;CARD9
7                                                      cellular response to interferon-gamma (GO:0071346)   3/121       0.02115946                    IRF3;CCL20;IFNGR2
8                        positive regulation of pri-miRNA transcription by RNA polymerase II (GO:1902895)    2/34       0.03391008                          SMAD3;STAT3
9                             positive regulation of NF-kappaB transcription factor activity (GO:0051092)   3/155       0.03391008                    PRKCB;CARD9;STAT3
10                       regulation of cytokine production involved in inflammatory response (GO:1900015)    2/43       0.04673274                          CARD9;STAT3
11                                regulation of pri-miRNA transcription by RNA polymerase II (GO:1902893)    2/45       0.04673274                          SMAD3;STAT3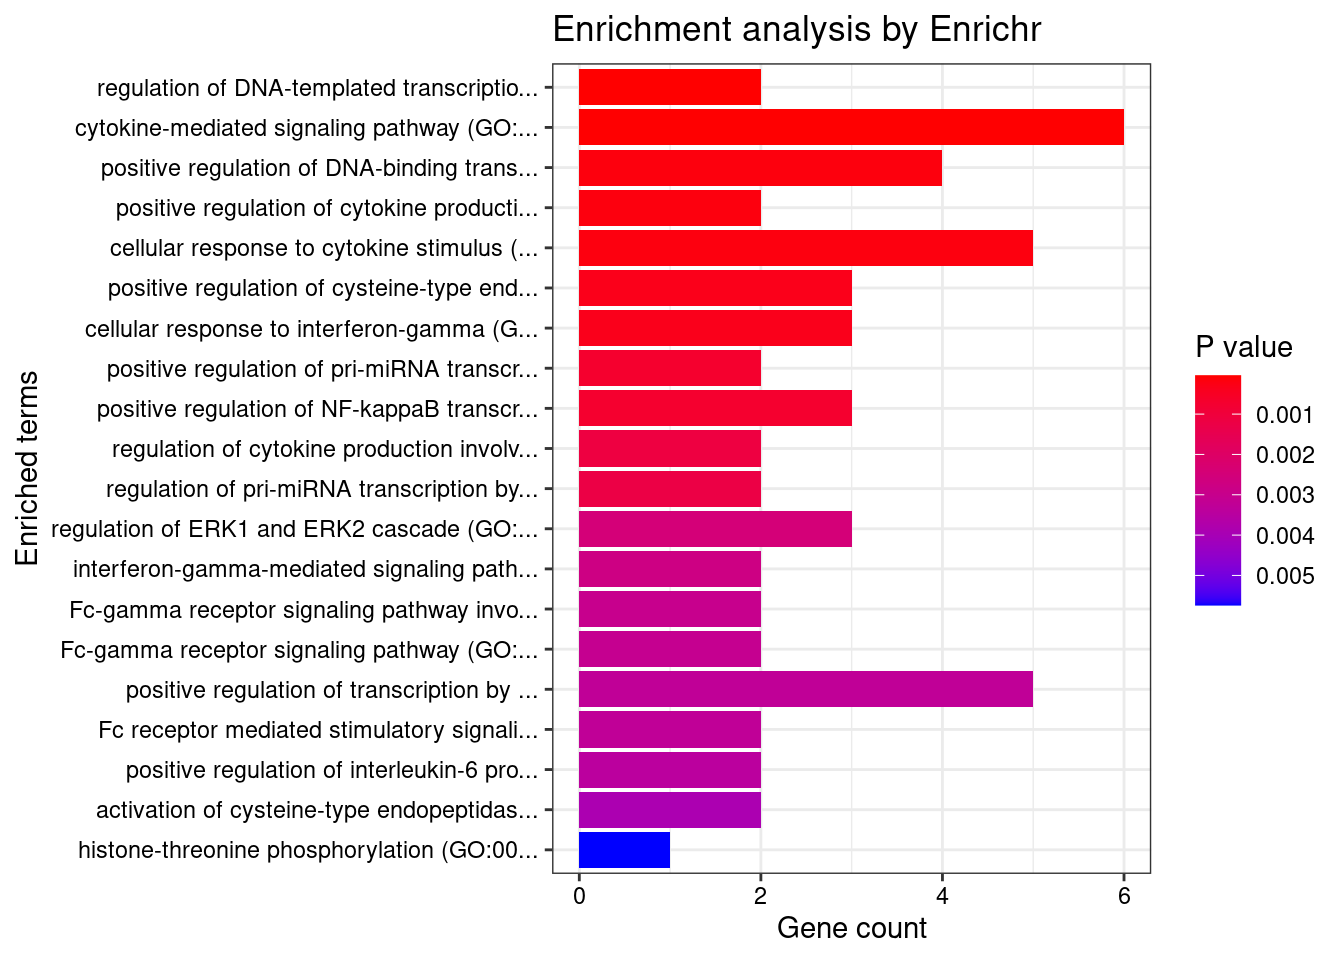
| Version | Author | Date |
|---|---|---|
| 65634fd | wesleycrouse | 2022-06-30 |
Cardiovascular

Number of cTWAS Genes in Tissue Group: 18

Uploading data to Enrichr... Done.
  Querying GO_Biological_Process_2021... Done.
Parsing results... Done.

GO_Biological_Process_2021

                                                            Term Overlap Adjusted.P.value                     Genes
1                              cell-matrix adhesion (GO:0007160)   3/100       0.02980071        ADAM15;ITGAV;ITGAL
2                          neutrophil degranulation (GO:0043312)   4/481       0.04830270 SYNGR1;SLC2A3;ITGAV;ITGAL
3 neutrophil activation involved in immune response (GO:0002283)   4/485       0.04830270 SYNGR1;SLC2A3;ITGAV;ITGAL
4                      neutrophil mediated immunity (GO:0002446)   4/488       0.04830270 SYNGR1;SLC2A3;ITGAV;ITGAL
5              extracellular structure organization (GO:0043062)   3/216       0.04830270        ADAM15;ITGAV;ITGAL
6     external encapsulating structure organization (GO:0045229)   3/217       0.04830270        ADAM15;ITGAV;ITGAL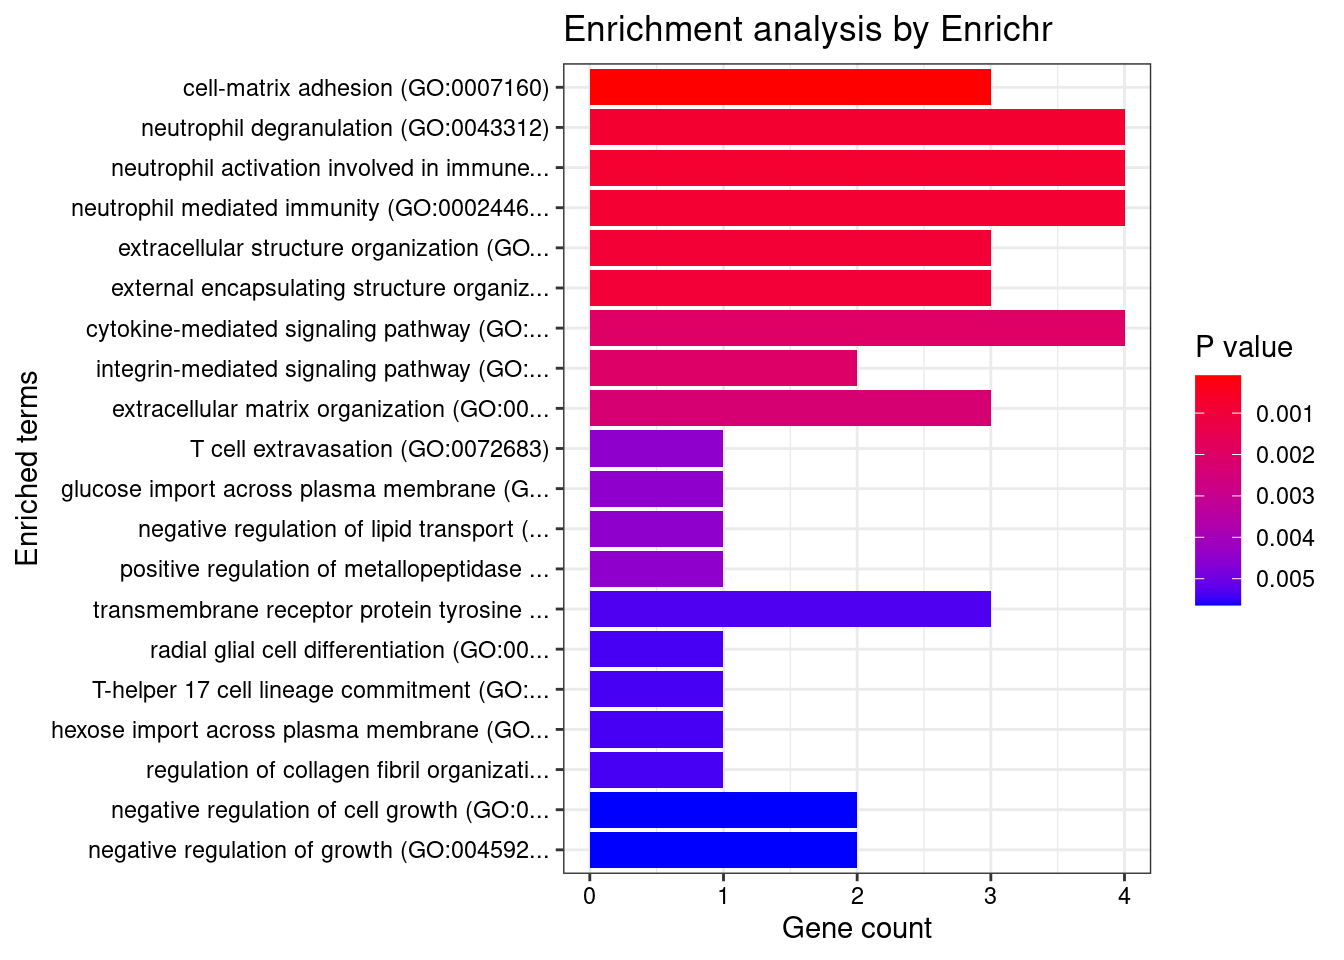
| Version | Author | Date |
|---|---|---|
| 65634fd | wesleycrouse | 2022-06-30 |
CNS

Number of cTWAS Genes in Tissue Group: 32

Uploading data to Enrichr... Done.
  Querying GO_Biological_Process_2021... Done.
Parsing results... Done.

GO_Biological_Process_2021

                                                                                                Term Overlap Adjusted.P.value                                          Genes
1                    positive regulation of antigen receptor-mediated signaling pathway (GO:0050857)    3/21      0.002251343                              PRKCB;RAB29;PRKD2
2                                                   cytokine-mediated signaling pathway (GO:0019221)   7/621      0.008561699 MUC1;FCER1G;CCL20;TNFSF15;IRF6;HLA-DQA1;IL18R1
3                                                                elastic fiber assembly (GO:0048251)     2/8      0.008561699                                   EFEMP2;LTBP3
4                       regulation of DNA-templated transcription in response to stress (GO:0043620)     2/9      0.008561699                                     MUC1;RGS14
5                                        negative regulation of transmembrane transport (GO:0034763)    2/10      0.008561699                                     PRKCB;OAZ3
6  positive regulation of vascular endothelial growth factor receptor signaling pathway (GO:0030949)    2/10      0.008561699                                    PRKCB;PRKD2
7                                            positive regulation of cytokine production (GO:0001819)   5/335      0.011777847                  LACC1;FCER1G;CD6;PRKD2;IL18R1
8                              positive regulation of T cell receptor signaling pathway (GO:0050862)    2/14      0.012933493                                    RAB29;PRKD2
9                                                         extracellular matrix assembly (GO:0085029)    2/24      0.031069752                                   EFEMP2;LTBP3
10          regulation of vascular endothelial growth factor receptor signaling pathway (GO:0030947)    2/24      0.031069752                                    PRKCB;PRKD2
11                                                cellular response to interferon-gamma (GO:0071346)   3/121      0.039758094                            CCL20;IRF6;HLA-DQA1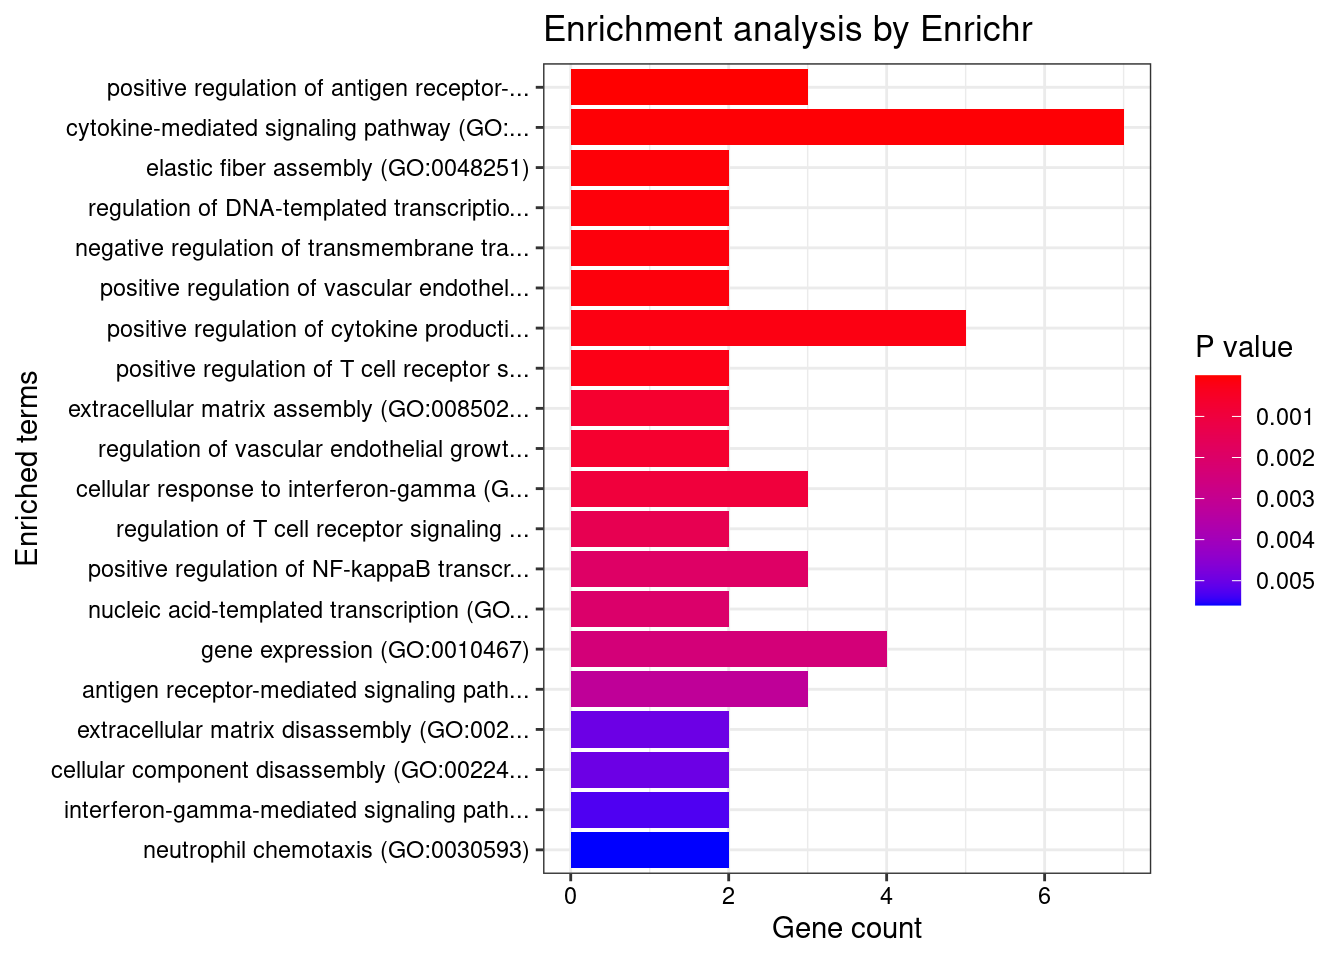
| Version | Author | Date |
|---|---|---|
| 65634fd | wesleycrouse | 2022-06-30 |
None

Number of cTWAS Genes in Tissue Group: 28

Uploading data to Enrichr... Done.
  Querying GO_Biological_Process_2021... Done.
Parsing results... Done.

GO_Biological_Process_2021

                                                                                       Term Overlap Adjusted.P.value                                             Genes
1                                          cytokine-mediated signaling pathway (GO:0019221)   8/621     0.0008916602 MUC1;TNFRSF6B;TNFSF15;CCL20;IFNGR2;STAT3;IRF8;CRK
2                                       cellular response to cytokine stimulus (GO:0071345)   7/482     0.0010386186          MUC1;CCL20;IFNGR2;STAT3;IRF8;CRK;ZFP36L2
3              regulation of DNA-templated transcription in response to stress (GO:0043620)     2/9     0.0135708327                                        MUC1;RGS14
4                                   cellular response to tumor necrosis factor (GO:0071356)   4/194     0.0220380106                    TNFRSF6B;TNFSF15;CCL20;ZFP36L2
5 positive regulation of cytokine production involved in inflammatory response (GO:1900017)    2/17     0.0305484037                                       CARD9;STAT3
6                                            regulation of MAP kinase activity (GO:0043405)    3/97     0.0332860746                                  RGS14;EDN3;LRRK2
7                                          positive regulation of MAPK cascade (GO:0043410)   4/274     0.0468295106                            EDN3;CCL20;LRRK2;CARD9
8                                        cellular response to interferon-gamma (GO:0071346)   3/121     0.0476781823                                 CCL20;IFNGR2;IRF8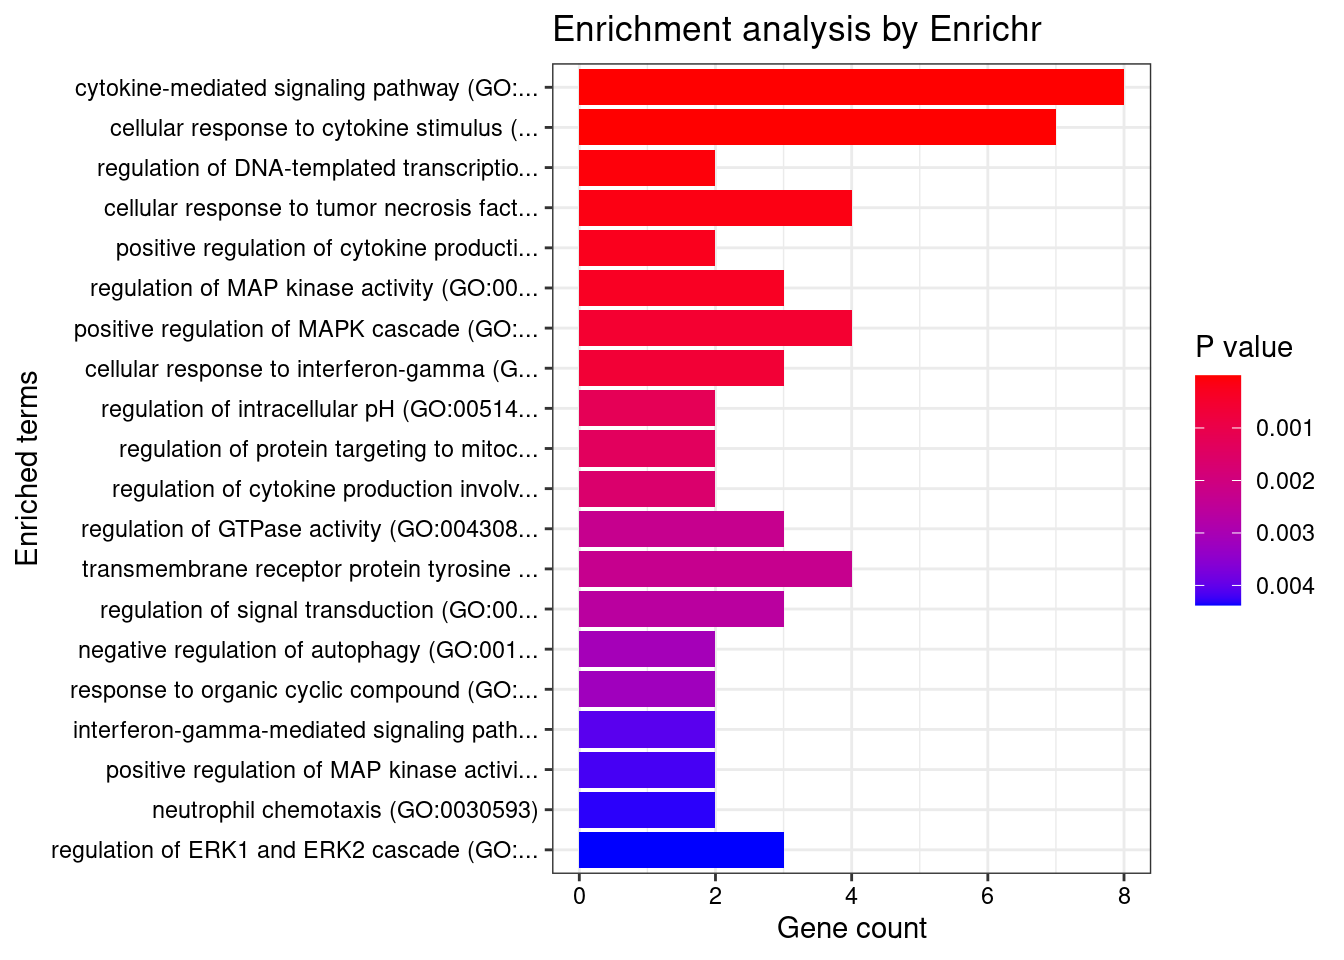
| Version | Author | Date |
|---|---|---|
| 65634fd | wesleycrouse | 2022-06-30 |
Skin
Number of cTWAS Genes in Tissue Group: 18
Uploading data to Enrichr... Done.
Querying GO_Biological_Process_2021... Done.
Parsing results... Done.
GO_Biological_Process_2021
Term Overlap Adjusted.P.value Genes
1 regulation of receptor binding (GO:1900120) 2/10 0.01282011 ADAM15;MMP9
2 extracellular matrix organization (GO:0030198) 4/300 0.02404960 ADAM15;P4HA2;ITGAL;MMP9
3 transmembrane receptor protein tyrosine kinase signaling pathway (GO:0007169) 4/404 0.03795977 RGS14;STAT3;MMP9;PTPN2
4 regulation of vascular associated smooth muscle cell proliferation (GO:1904705) 2/37 0.03795977 EFEMP2;MMP9
5 response to peptide (GO:1901652) 2/39 0.03795977 STAT3;MMP9
6 positive regulation of Notch signaling pathway (GO:0045747) 2/45 0.03795977 TSPAN14;STAT3
7 extracellular structure organization (GO:0043062) 3/216 0.03795977 ADAM15;ITGAL;MMP9
8 external encapsulating structure organization (GO:0045229) 3/217 0.03795977 ADAM15;ITGAL;MMP9
9 negative regulation of ERK1 and ERK2 cascade (GO:0070373) 2/50 0.03795977 RGS14;PTPN2
10 extracellular matrix disassembly (GO:0022617) 2/66 0.04187839 ADAM15;MMP9
11 cellular component disassembly (GO:0022411) 2/66 0.04187839 ADAM15;MMP9
12 regulation of gene silencing by miRNA (GO:0060964) 2/67 0.04187839 IPO8;STAT3
13 regulation of epidermal growth factor receptor signaling pathway (GO:0042058) 2/67 0.04187839 MMP9;PTPN2
14 regulation of tyrosine phosphorylation of STAT protein (GO:0042509) 2/68 0.04187839 STAT3;PTPN2
15 carbohydrate homeostasis (GO:0033500) 2/70 0.04187839 STAT3;PTPN2
16 cytokine-mediated signaling pathway (GO:0019221) 4/621 0.04187839 TNFRSF6B;TNFSF15;STAT3;MMP9
17 establishment of protein localization to organelle (GO:0072594) 2/76 0.04187839 IPO8;STAT3
18 protein import into nucleus (GO:0006606) 2/76 0.04187839 IPO8;STAT3
19 import into nucleus (GO:0051170) 2/77 0.04187839 IPO8;STAT3
20 regulation of Notch signaling pathway (GO:0008593) 2/83 0.04187839 TSPAN14;STAT3
21 glucose homeostasis (GO:0042593) 2/86 0.04187839 STAT3;PTPN2
22 protein import (GO:0017038) 2/89 0.04187839 IPO8;STAT3
23 negative regulation of MAPK cascade (GO:0043409) 2/94 0.04187839 RGS14;PTPN2
24 cell-matrix adhesion (GO:0007160) 2/100 0.04187839 ADAM15;ITGAL
25 supramolecular fiber organization (GO:0097435) 3/351 0.04187839 TSPAN14;EFEMP2;P4HA2
26 protein localization to nucleus (GO:0034504) 2/106 0.04187839 IPO8;STAT3
27 negative regulation of cysteine-type endopeptidase activity involved in apoptotic signaling pathway (GO:2001268) 1/5 0.04187839 MMP9
28 T cell extravasation (GO:0072683) 1/5 0.04187839 ITGAL
29 negative regulation of macrophage differentiation (GO:0045650) 1/5 0.04187839 PTPN2
30 regulation of platelet-derived growth factor receptor-beta signaling pathway (GO:2000586) 1/5 0.04187839 PTPN2
31 positive regulation of metallopeptidase activity (GO:1905050) 1/5 0.04187839 STAT3
32 tumor necrosis factor-mediated signaling pathway (GO:0033209) 2/116 0.04187839 TNFRSF6B;TNFSF15
33 cellular response to organic substance (GO:0071310) 2/123 0.04187839 STAT3;PTPN2
34 negative regulation of T cell differentiation in thymus (GO:0033085) 1/6 0.04187839 PTPN2
35 negative regulation of transporter activity (GO:0032410) 1/6 0.04187839 NDFIP1
36 radial glial cell differentiation (GO:0060019) 1/6 0.04187839 STAT3
37 positive regulation of receptor binding (GO:1900122) 1/6 0.04187839 MMP9
38 T-helper 17 cell lineage commitment (GO:0072540) 1/6 0.04187839 STAT3
39 regulation of transmission of nerve impulse (GO:0051969) 1/6 0.04187839 TYMP
40 positive regulation of gluconeogenesis (GO:0045722) 1/6 0.04187839 PTPN2
41 regulation of collagen fibril organization (GO:1904026) 1/6 0.04187839 EFEMP2
42 regulation of digestive system process (GO:0044058) 1/6 0.04187839 TYMP
43 regulation of cell migration (GO:0030334) 3/408 0.04187839 ADAM15;STAT3;MMP9
44 negative regulation of response to interferon-gamma (GO:0060331) 1/7 0.04187839 PTPN2
45 T-helper 17 cell differentiation (GO:0072539) 1/7 0.04187839 STAT3
46 astrocyte differentiation (GO:0048708) 1/7 0.04187839 STAT3
47 regulation of miRNA mediated inhibition of translation (GO:1905616) 1/7 0.04187839 STAT3
48 negative regulation of interferon-gamma-mediated signaling pathway (GO:0060336) 1/7 0.04187839 PTPN2
49 positive regulation of vascular associated smooth muscle cell differentiation (GO:1905065) 1/7 0.04187839 EFEMP2
50 vascular associated smooth muscle cell development (GO:0097084) 1/7 0.04187839 EFEMP2
51 photoreceptor cell differentiation (GO:0046530) 1/7 0.04187839 STAT3
52 positive regulation of miRNA mediated inhibition of translation (GO:1905618) 1/7 0.04187839 STAT3
53 cellular response to interleukin-21 (GO:0098757) 1/8 0.04187839 STAT3
54 T-helper cell lineage commitment (GO:0002295) 1/8 0.04187839 STAT3
55 vascular associated smooth muscle cell differentiation (GO:0035886) 1/8 0.04187839 EFEMP2
56 peptidyl-proline hydroxylation to 4-hydroxy-L-proline (GO:0018401) 1/8 0.04187839 P4HA2
57 elastic fiber assembly (GO:0048251) 1/8 0.04187839 EFEMP2
58 interleukin-21-mediated signaling pathway (GO:0038114) 1/8 0.04187839 STAT3
59 response to cytokine (GO:0034097) 2/150 0.04187839 STAT3;PTPN2
60 cellular response to interleukin-9 (GO:0071355) 1/9 0.04187839 STAT3
61 cellular response to leptin stimulus (GO:0044320) 1/9 0.04187839 STAT3
62 negative regulation of lipid localization (GO:1905953) 1/9 0.04187839 PTPN2
63 response to leptin (GO:0044321) 1/9 0.04187839 STAT3
64 regulation of DNA-templated transcription in response to stress (GO:0043620) 1/9 0.04187839 RGS14
65 interleukin-23-mediated signaling pathway (GO:0038155) 1/9 0.04187839 STAT3
66 interleukin-9-mediated signaling pathway (GO:0038113) 1/9 0.04187839 STAT3
67 neutrophil degranulation (GO:0043312) 3/481 0.04187839 TSPAN14;ITGAL;MMP9
68 cellular response to cytokine stimulus (GO:0071345) 3/482 0.04187839 STAT3;MMP9;PTPN2
69 neutrophil activation involved in immune response (GO:0002283) 3/485 0.04187839 TSPAN14;ITGAL;MMP9
70 smooth muscle tissue development (GO:0048745) 1/10 0.04187839 EFEMP2
71 leptin-mediated signaling pathway (GO:0033210) 1/10 0.04187839 STAT3
72 negative regulation of transmembrane transport (GO:0034763) 1/10 0.04187839 OAZ3
73 negative regulation of tyrosine phosphorylation of STAT protein (GO:0042532) 1/10 0.04187839 PTPN2
74 negative regulation of establishment of protein localization (GO:1904950) 1/10 0.04187839 NDFIP1
75 nucleoside metabolic process (GO:0009116) 1/10 0.04187839 TYMP
76 positive regulation of keratinocyte migration (GO:0051549) 1/10 0.04187839 MMP9
77 negative regulation of receptor binding (GO:1900121) 1/10 0.04187839 ADAM15
78 neutrophil mediated immunity (GO:0002446) 3/488 0.04187839 TSPAN14;ITGAL;MMP9
79 positive regulation of posttranscriptional gene silencing (GO:0060148) 1/11 0.04187839 STAT3
80 cellular response to UV-A (GO:0071492) 1/11 0.04187839 MMP9
81 pyrimidine nucleoside catabolic process (GO:0046135) 1/11 0.04187839 TYMP
82 pyrimidine nucleoside salvage (GO:0043097) 1/11 0.04187839 TYMP
83 pyrimidine-containing compound salvage (GO:0008655) 1/11 0.04187839 TYMP
84 peptidyl-proline hydroxylation (GO:0019511) 1/11 0.04187839 P4HA2
85 regulation of cysteine-type endopeptidase activity involved in apoptotic signaling pathway (GO:2001267) 1/11 0.04187839 MMP9
86 negative regulation of platelet-derived growth factor receptor signaling pathway (GO:0010642) 1/11 0.04187839 PTPN2
87 interleukin-35-mediated signaling pathway (GO:0070757) 1/11 0.04187839 STAT3
88 cellular response to growth hormone stimulus (GO:0071378) 1/12 0.04187839 STAT3
89 regulation of feeding behavior (GO:0060259) 1/12 0.04187839 STAT3
90 eye photoreceptor cell differentiation (GO:0001754) 1/12 0.04187839 STAT3
91 pyrimidine-containing compound metabolic process (GO:0072527) 1/12 0.04187839 TYMP
92 regulation of keratinocyte migration (GO:0051547) 1/12 0.04187839 MMP9
93 nucleoside catabolic process (GO:0009164) 1/12 0.04187839 TYMP
94 nucleoside salvage (GO:0043174) 1/12 0.04187839 TYMP
95 mitochondrial genome maintenance (GO:0000002) 1/12 0.04187839 TYMP
96 negative regulation of production of miRNAs involved in gene silencing by miRNA (GO:1903799) 1/12 0.04187839 STAT3
97 cellular response to interleukin-15 (GO:0071350) 1/13 0.04397480 STAT3
98 negative regulation of locomotion (GO:0040013) 1/13 0.04397480 PTPN2
99 interleukin-15-mediated signaling pathway (GO:0035723) 1/13 0.04397480 STAT3
100 regulation of response to interferon-gamma (GO:0060330) 1/14 0.04449309 PTPN2
101 pyrimidine nucleoside biosynthetic process (GO:0046134) 1/14 0.04449309 TYMP
102 aorta development (GO:0035904) 1/14 0.04449309 EFEMP2
103 growth hormone receptor signaling pathway via JAK-STAT (GO:0060397) 1/14 0.04449309 STAT3
104 positive regulation of glucose metabolic process (GO:0010907) 1/14 0.04449309 PTPN2
105 response to UV-A (GO:0070141) 1/14 0.04449309 MMP9
106 cellular response to tumor necrosis factor (GO:0071356) 2/194 0.04449309 TNFRSF6B;TNFSF15
107 protein localization to membrane (GO:0072657) 2/195 0.04449309 TSPAN14;ITGAL
108 regulation of extracellular matrix organization (GO:1903053) 1/15 0.04449309 EFEMP2
109 pyrimidine nucleoside metabolic process (GO:0006213) 1/15 0.04449309 TYMP
110 macrophage differentiation (GO:0030225) 1/15 0.04449309 MMP9
111 regulation of macrophage differentiation (GO:0045649) 1/15 0.04449309 PTPN2
112 interleukin-27-mediated signaling pathway (GO:0070106) 1/15 0.04449309 STAT3
113 regulation of signal transduction (GO:0009966) 2/198 0.04449309 RGS14;PTPN2
114 activation of NF-kappaB-inducing kinase activity (GO:0007250) 1/16 0.04496929 TNFSF15
115 negative regulation of type I interferon-mediated signaling pathway (GO:0060339) 1/16 0.04496929 PTPN2
116 negative regulation of epithelial cell differentiation (GO:0030857) 1/16 0.04496929 MMP9
117 nuclear transport (GO:0051169) 1/16 0.04496929 RGS14
118 platelet-derived growth factor receptor signaling pathway (GO:0048008) 1/16 0.04496929 RGS14
119 negative regulation of receptor signaling pathway via JAK-STAT (GO:0046426) 1/16 0.04496929 PTPN2
120 regulation of inflammatory response (GO:0050727) 2/206 0.04516866 MMP9;PTPN2
121 negative regulation of vascular associated smooth muscle cell proliferation (GO:1904706) 1/17 0.04546715 EFEMP2
122 pyrimidine-containing compound catabolic process (GO:0072529) 1/17 0.04546715 TYMP
123 aorta morphogenesis (GO:0035909) 1/17 0.04546715 EFEMP2
124 positive regulation of cytokine production involved in inflammatory response (GO:1900017) 1/17 0.04546715 STAT3
125 muscle tissue morphogenesis (GO:0060415) 1/17 0.04546715 EFEMP2
126 negative regulation of cation transmembrane transport (GO:1904063) 1/18 0.04662914 MMP9
127 negative regulation of tumor necrosis factor-mediated signaling pathway (GO:0010804) 1/18 0.04662914 PTPN2
128 positive regulation of extracellular matrix organization (GO:1903055) 1/18 0.04662914 EFEMP2
129 interleukin-6-mediated signaling pathway (GO:0070102) 1/18 0.04662914 STAT3
130 positive regulation of cell motility (GO:2000147) 2/221 0.04666648 STAT3;MMP9
131 cellular response to interleukin-7 (GO:0098761) 1/19 0.04666648 STAT3
132 negative regulation of T cell receptor signaling pathway (GO:0050860) 1/19 0.04666648 PTPN2
133 long-term memory (GO:0007616) 1/19 0.04666648 RGS14
134 regulation of nervous system process (GO:0031644) 1/19 0.04666648 TYMP
135 regulation of neuroinflammatory response (GO:0150077) 1/19 0.04666648 MMP9
136 interleukin-7-mediated signaling pathway (GO:0038111) 1/19 0.04666648 STAT3
137 inflammatory response (GO:0006954) 2/230 0.04736059 STAT3;ITGAL
138 adaptive immune response based on somatic recombination of immune receptors built from immunoglobulin superfamily domains (GO:0002460) 1/20 0.04736059 STAT3
139 eye morphogenesis (GO:0048592) 1/20 0.04736059 STAT3
140 growth hormone receptor signaling pathway (GO:0060396) 1/20 0.04736059 STAT3
141 negative regulation of lipid storage (GO:0010888) 1/20 0.04736059 PTPN2
142 long-term synaptic potentiation (GO:0060291) 1/21 0.04867196 RGS14
143 negative regulation of ion transmembrane transporter activity (GO:0032413) 1/21 0.04867196 MMP9
144 positive regulation of vascular associated smooth muscle cell proliferation (GO:1904707) 1/21 0.04867196 MMP9
145 regulation of ERK1 and ERK2 cascade (GO:0070372) 2/238 0.04908976 RGS14;PTPN2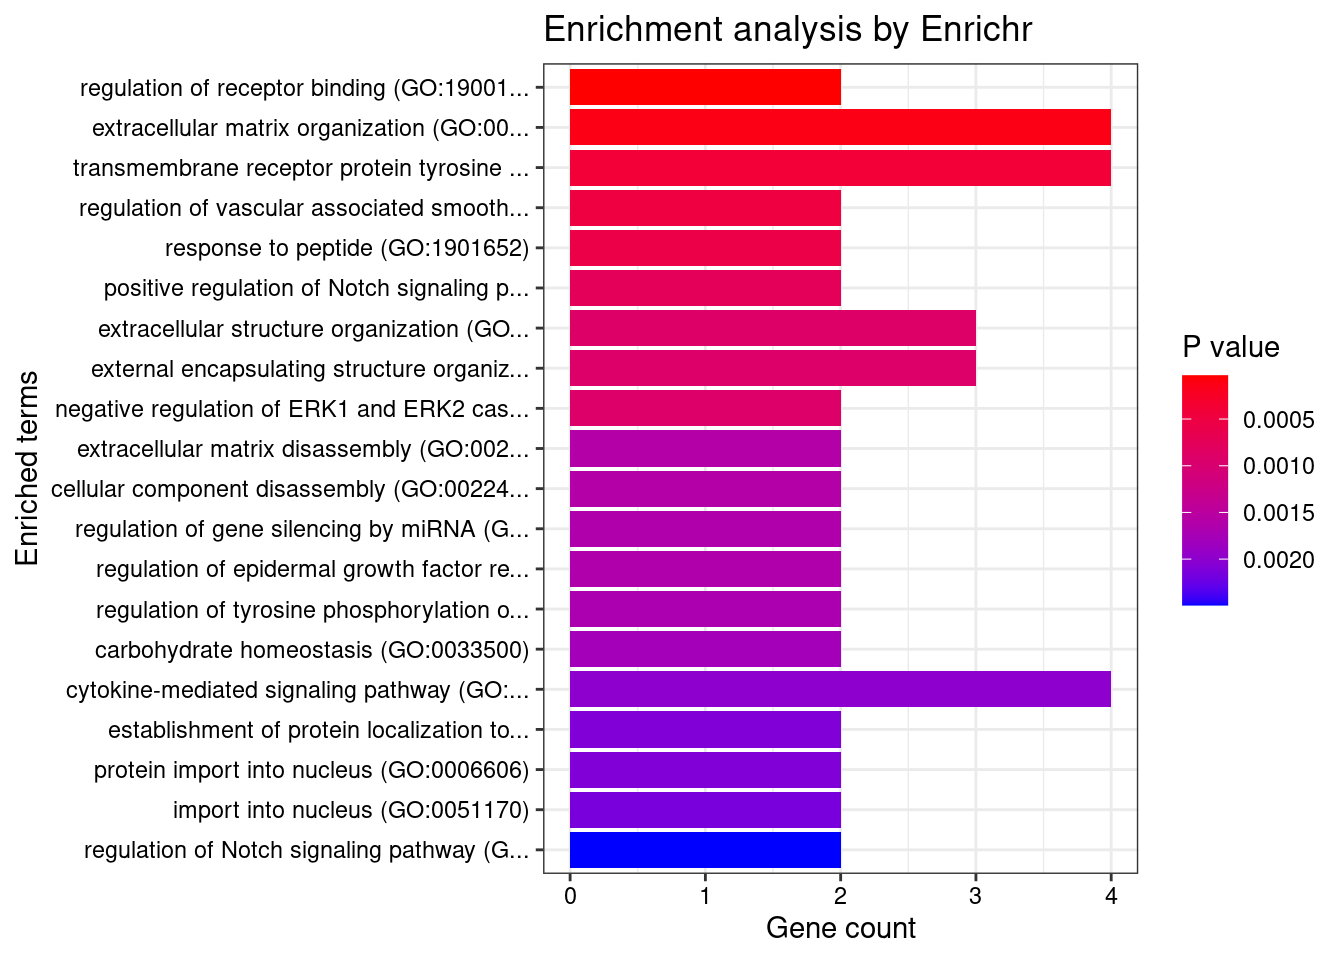
| Version | Author | Date |
|---|---|---|
| 65634fd | wesleycrouse | 2022-06-30 |
Blood or Immune

Number of cTWAS Genes in Tissue Group: 24

Uploading data to Enrichr... Done.
  Querying GO_Biological_Process_2021... Done.
Parsing results... Done.

GO_Biological_Process_2021

                                                                                       Term Overlap Adjusted.P.value                         Genes
1 positive regulation of cytokine production involved in inflammatory response (GO:1900017)    2/17       0.02240505                   CARD9;STAT3
2                                       cellular response to cytokine stimulus (GO:0071345)   5/482       0.02240505 MUC1;SOCS1;STAT3;CCR5;ZFP36L2
3                                     interleukin-7-mediated signaling pathway (GO:0038111)    2/19       0.02240505                   SOCS1;STAT3
4                                           cellular response to interleukin-7 (GO:0098761)    2/19       0.02240505                   SOCS1;STAT3
5                                       regulation of interleukin-6 production (GO:0032675)   3/110       0.02240505           CD200R1;CARD9;STAT3
6                                   positive regulation of histone acetylation (GO:0035066)    2/23       0.02240505                     MUC1;BRD7
7                                          cytokine-mediated signaling pathway (GO:0019221)   5/621       0.04128921 MUC1;SOCS1;TNFSF15;STAT3;CCR5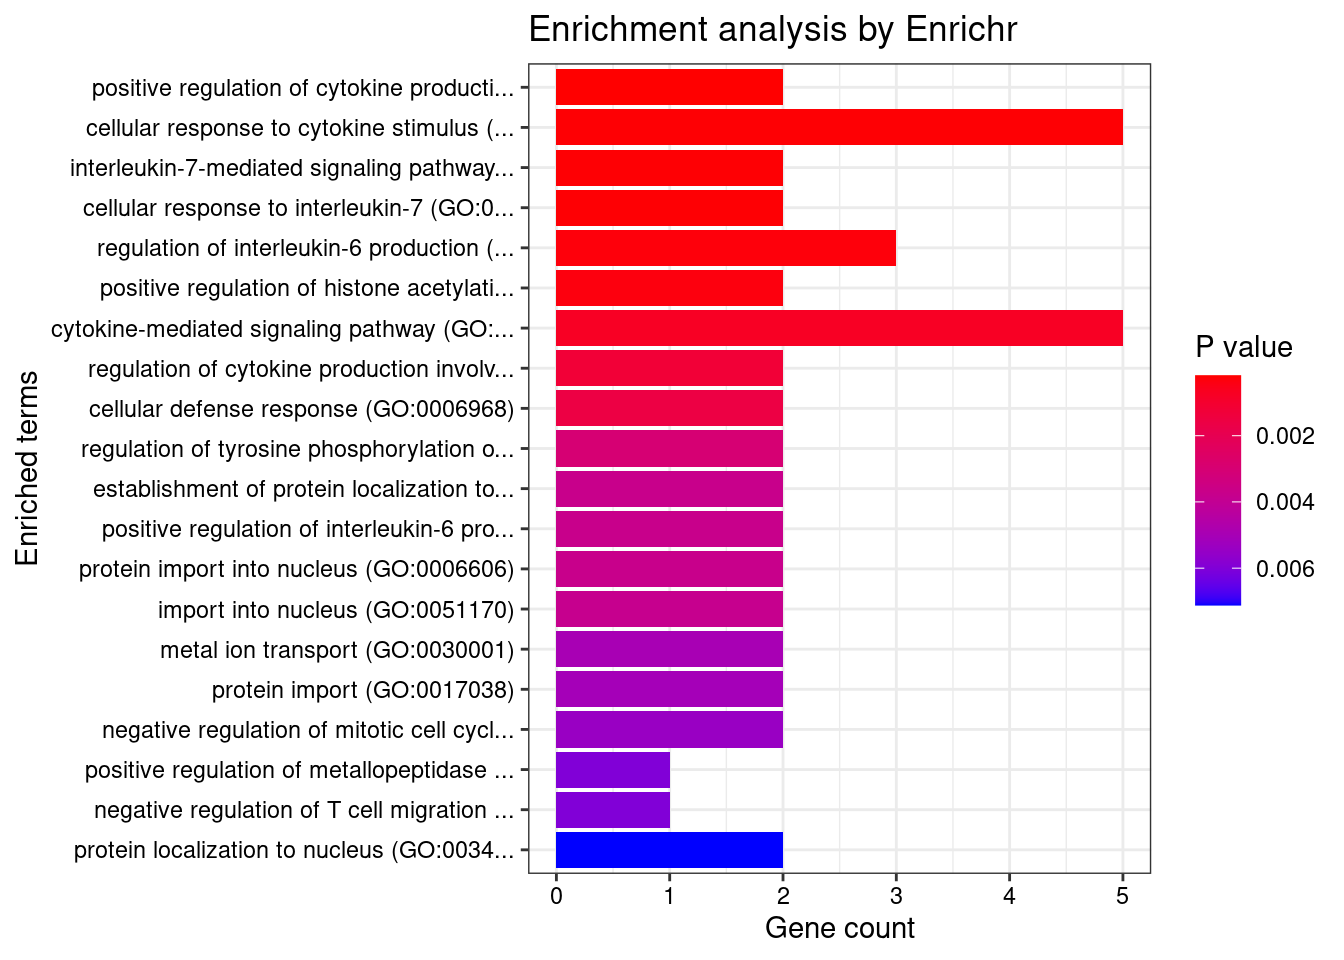
| Version | Author | Date |
|---|---|---|
| 65634fd | wesleycrouse | 2022-06-30 |
Digestive

Number of cTWAS Genes in Tissue Group: 37

Uploading data to Enrichr... Done.
  Querying GO_Biological_Process_2021... Done.
Parsing results... Done.

GO_Biological_Process_2021

                                                  Term Overlap Adjusted.P.value                             Genes
1                  elastic fiber assembly (GO:0048251)     2/8       0.02687114                      EFEMP2;LTBP3
2          regulation of receptor binding (GO:1900120)    2/10       0.02687114                        ADAM15;HFE
3 negative regulation of receptor binding (GO:1900121)    2/10       0.02687114                        ADAM15;HFE
4  cellular response to cytokine stimulus (GO:0071345)   6/482       0.03177688 SBNO2;CCL20;IL1R2;IFNGR2;IRF8;CRK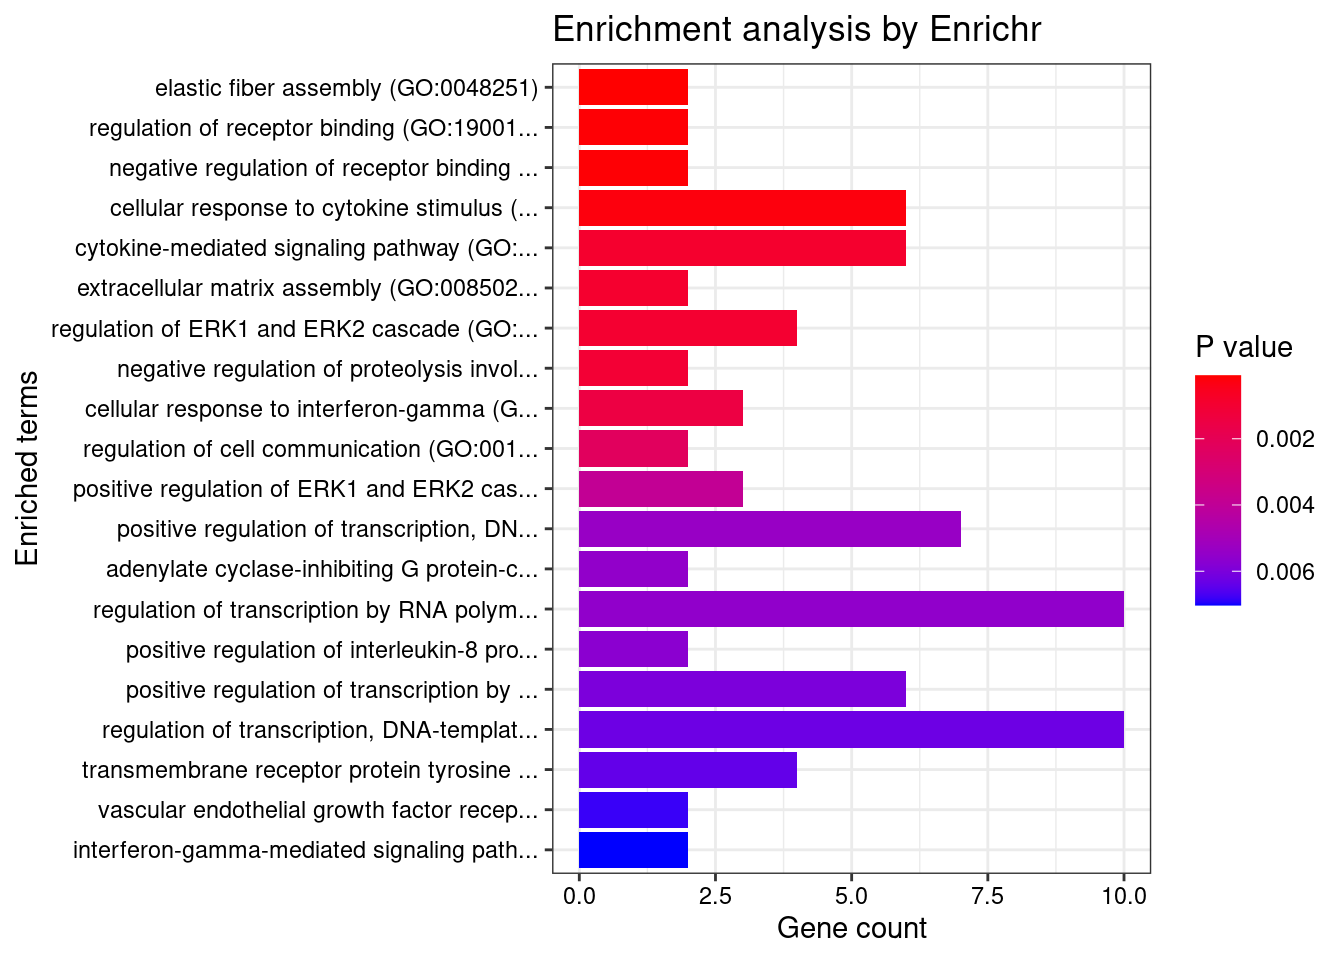
| Version | Author | Date |
|---|---|---|
| 65634fd | wesleycrouse | 2022-06-30 |
if (exists("group_enrichment_results")){
  save(group_enrichment_results, file=paste0("group_enrichment_results_", trait_id, ".RData"))
}
KEGG
for (group in names(df_group)){
  cat(paste0(group, "\n\n"))

  ctwas_genes_group <- df_group[[group]]$ctwas
  background_group <- df_group[[group]]$background

  cat(paste0("Number of cTWAS Genes in Tissue Group: ", length(ctwas_genes_group), "\n\n"))

  databases <- c("pathway_KEGG")

  enrichResult <- WebGestaltR(enrichMethod="ORA", organism="hsapiens",
                              interestGene=ctwas_genes_group, referenceGene=background_group,
                              enrichDatabase=databases, interestGeneType="genesymbol",
                              referenceGeneType="genesymbol", isOutput=F)

  if (!is.null(enrichResult)){
    print(enrichResult[,c("description", "size", "overlap", "FDR", "userId")])
  }

  cat("\n")
}
Adipose
Number of cTWAS Genes in Tissue Group: 16
Loading the functional categories...
Loading the ID list...
Loading the reference list...
Performing the enrichment analysis...
description size overlap FDR userId
1 Tuberculosis 122 4 0.01401752 HLA-DQA1;CARD9;LSP1;CIITA
Endocrine
Number of cTWAS Genes in Tissue Group: 23
Loading the functional categories...
Loading the ID list...
Loading the reference list...
Performing the enrichment analysis...
description size overlap FDR userId
1 Hepatitis B 110 4 0.02758021 PRKCB;STAT3;SMAD3;IRF3
2 Inflammatory bowel disease (IBD) 46 3 0.02758021 STAT3;IFNGR2;SMAD3
3 Leishmaniasis 53 3 0.02758021 PRKCB;IFNGR2;FCGR2A
4 Tuberculosis 135 4 0.02758021 CARD9;LSP1;IFNGR2;FCGR2A
Cardiovascular
Number of cTWAS Genes in Tissue Group: 18
Loading the functional categories...
Loading the ID list...
Loading the reference list...
Performing the enrichment analysis...Warning in oraEnrichment(interestGeneList, referenceGeneList, geneSet, minNum = minNum, : No significant gene set is identified based on FDR 0.05!
CNS

Number of cTWAS Genes in Tissue Group: 32

Loading the functional categories...
Loading the ID list...
Loading the reference list...
Performing the enrichment analysis...
Warning in oraEnrichment(interestGeneList, referenceGeneList, geneSet, minNum = minNum, : No significant gene set is identified based on FDR 0.05!
None

Number of cTWAS Genes in Tissue Group: 28

Loading the functional categories...
Loading the ID list...
Loading the reference list...
Performing the enrichment analysis...
Warning in oraEnrichment(interestGeneList, referenceGeneList, geneSet, minNum = minNum, : No significant gene set is identified based on FDR 0.05!
Skin

Number of cTWAS Genes in Tissue Group: 18

Loading the functional categories...
Loading the ID list...
Loading the reference list...
Performing the enrichment analysis...
Warning in oraEnrichment(interestGeneList, referenceGeneList, geneSet, minNum = minNum, : No significant gene set is identified based on FDR 0.05!
Blood or Immune

Number of cTWAS Genes in Tissue Group: 24

Loading the functional categories...
Loading the ID list...
Loading the reference list...
Performing the enrichment analysis...
Warning in oraEnrichment(interestGeneList, referenceGeneList, geneSet, minNum = minNum, : No significant gene set is identified based on FDR 0.05!
Digestive

Number of cTWAS Genes in Tissue Group: 37

Loading the functional categories...
Loading the ID list...
Loading the reference list...
Performing the enrichment analysis...
             description size overlap       FDR                            userId
1 Rap1 signaling pathway  176       6 0.0286068 RGS14;CRK;PRKD2;EFNA1;ADCY9;ITGAL
DisGeNET
for (group in names(df_group)){
  cat(paste0(group, "\n\n"))

  ctwas_genes_group <- df_group[[group]]$ctwas

  cat(paste0("Number of cTWAS Genes in Tissue Group: ", length(ctwas_genes_group), "\n\n"))

  res_enrich <- disease_enrichment(entities=ctwas_genes_group, vocabulary = "HGNC", database = "CURATED")

  if (any(res_enrich@qresult$FDR < 0.05)){
    print(res_enrich@qresult[res_enrich@qresult$FDR < 0.05, c("Description", "FDR", "Ratio",  "BgRatio")])
  }

  cat("\n")
}
Gene sets curated by Macarthur Lab
gene_set_dir <- "/project2/mstephens/wcrouse/gene_sets/"
gene_set_files <- c("gwascatalog.tsv",
                    "mgi_essential.tsv",
                    "core_essentials_hart.tsv",
                    "clinvar_path_likelypath.tsv",
                    "fda_approved_drug_targets.tsv")

for (group in names(df_group)){
  cat(paste0(group, "\n\n"))

  ctwas_genes_group <- df_group[[group]]$ctwas
  background_group <- df_group[[group]]$background

  cat(paste0("Number of cTWAS Genes in Tissue Group: ", length(ctwas_genes_group), "\n\n"))

  gene_sets <- lapply(gene_set_files, function(x){as.character(read.table(paste0(gene_set_dir, x))[,1])})
  names(gene_sets) <- sapply(gene_set_files, function(x){unlist(strsplit(x, "[.]"))[1]})

  gene_lists <- list(ctwas_genes_group=ctwas_genes_group)

  #genes in gene_sets filtered to ensure inclusion in background
  gene_sets <- lapply(gene_sets, function(x){x[x %in% background_group]})

  #hypergeometric test
  hyp_score <- data.frame()
  size <- c()
  ngenes <- c()

  for (i in 1:length(gene_sets)) {
    for (j in 1:length(gene_lists)){
      group1 <- length(gene_sets[[i]])
      group2 <- length(as.vector(gene_lists[[j]]))
      size <- c(size, group1)
      Overlap <- length(intersect(gene_sets[[i]],as.vector(gene_lists[[j]])))
      ngenes <- c(ngenes, Overlap)
      Total <- length(background_group)
      hyp_score[i,j] <- phyper(Overlap-1, group2, Total-group2, group1,lower.tail=F)
    }
  }
  rownames(hyp_score) <- names(gene_sets)
  colnames(hyp_score) <- names(gene_lists)

  #multiple testing correction
  hyp_score_padj <- apply(hyp_score,2, p.adjust, method="BH", n=(nrow(hyp_score)*ncol(hyp_score)))
  hyp_score_padj <- as.data.frame(hyp_score_padj)
  hyp_score_padj$gene_set <- rownames(hyp_score_padj)
  hyp_score_padj$nset <- size
  hyp_score_padj$ngenes <- ngenes
  hyp_score_padj$percent <- ngenes/size

  hyp_score_padj <- hyp_score_padj[order(hyp_score_padj$ctwas_genes),]
  colnames(hyp_score_padj)[1] <- "padj"
  hyp_score_padj <- hyp_score_padj[,c(2:5,1)]
  rownames(hyp_score_padj)<- NULL

  print(hyp_score_padj)

  cat("\n")
}
Adipose
Number of cTWAS Genes in Tissue Group: 16
gene_set nset ngenes percent padj
1 gwascatalog 4575 13 0.002841530 0.001169026
2 mgi_essential 1715 5 0.002915452 0.127265550
3 clinvar_path_likelypath 2136 4 0.001872659 0.443657054
4 core_essentials_hart 207 0 0.000000000 1.000000000
5 fda_approved_drug_targets 258 0 0.000000000 1.000000000
Endocrine
Number of cTWAS Genes in Tissue Group: 23
gene_set nset ngenes percent padj
1 gwascatalog 5392 16 0.002967359 0.004079393
2 mgi_essential 2020 7 0.003465347 0.061494997
3 clinvar_path_likelypath 2486 7 0.002815768 0.110289031
4 core_essentials_hart 234 0 0.000000000 1.000000000
5 fda_approved_drug_targets 304 0 0.000000000 1.000000000
Cardiovascular
Number of cTWAS Genes in Tissue Group: 18
gene_set nset ngenes percent padj
1 mgi_essential 1971 6 0.003044140 0.1364839
2 gwascatalog 5192 10 0.001926040 0.1741350
3 clinvar_path_likelypath 2404 4 0.001663894 0.4368486
4 fda_approved_drug_targets 287 1 0.003484321 0.4368486
5 core_essentials_hart 242 0 0.000000000 1.0000000
CNS
Number of cTWAS Genes in Tissue Group: 32
gene_set nset ngenes percent padj
1 gwascatalog 5426 22 0.004054552 0.0006335703
2 mgi_essential 2090 7 0.003349282 0.3422368442
3 clinvar_path_likelypath 2530 6 0.002371542 0.6090209398
4 fda_approved_drug_targets 316 1 0.003164557 0.6090209398
5 core_essentials_hart 244 0 0.000000000 1.0000000000
None
Number of cTWAS Genes in Tissue Group: 28
gene_set nset ngenes percent padj
1 gwascatalog 5631 19 0.003374179 0.002479767
2 mgi_essential 2145 9 0.004195804 0.022948577
3 clinvar_path_likelypath 2608 9 0.003450920 0.051165313
4 core_essentials_hart 255 0 0.000000000 1.000000000
5 fda_approved_drug_targets 323 0 0.000000000 1.000000000
Skin
Number of cTWAS Genes in Tissue Group: 18
gene_set nset ngenes percent padj
1 gwascatalog 5102 13 0.002548020 0.008533568
2 fda_approved_drug_targets 276 3 0.010869565 0.011625033
3 mgi_essential 1923 5 0.002600104 0.137844723
4 clinvar_path_likelypath 2341 4 0.001708672 0.421645524
5 core_essentials_hart 227 0 0.000000000 1.000000000
Blood or Immune
Number of cTWAS Genes in Tissue Group: 24
gene_set nset ngenes percent padj
1 gwascatalog 4760 12 0.002521008 0.5359646
2 mgi_essential 1774 4 0.002254791 0.6648995
3 fda_approved_drug_targets 255 1 0.003921569 0.6648995
4 clinvar_path_likelypath 2188 4 0.001828154 0.7143923
5 core_essentials_hart 217 0 0.000000000 1.0000000
Digestive
Number of cTWAS Genes in Tissue Group: 37
gene_set nset ngenes percent padj
1 gwascatalog 5396 29 0.005374351 5.905948e-07
2 mgi_essential 2053 10 0.004870921 5.444547e-02
3 fda_approved_drug_targets 307 3 0.009771987 6.376203e-02
4 clinvar_path_likelypath 2489 9 0.003615910 1.745697e-01
5 core_essentials_hart 243 0 0.000000000 1.000000e+00Analysis of TWAS False Positives by Region
library(ggplot2)

pip_threshold <- 0.5

df_plot <- data.frame(Outcome=c("SNPs", "Genes", "Both", "Neither"), Frequency=rep(0,4))

for (i in 1:length(df)){
  gene_pips <- df[[i]]$gene_pips[df[[i]]$gene_pips$genename %in% df[[i]]$twas,,drop=F]
  gene_pips <- gene_pips[gene_pips$susie_pip < pip_threshold,,drop=F]

  region_pips <- df[[i]]$region_pips
  rownames(region_pips) <- region_pips$region

  gene_pips <- cbind(gene_pips, t(sapply(gene_pips$region_tag, function(x){unlist(region_pips[x,c("gene_pip", "snp_pip")])})))
  gene_pips$gene_pip <- gene_pips$gene_pip - gene_pips$susie_pip #subtract gene pip from region total to get combined pip for other genes in region

  df_plot$Frequency[df_plot$Outcome=="Neither"] <- df_plot$Frequency[df_plot$Outcome=="Neither"] + sum(gene_pips$gene_pip < 0.5 & gene_pips$snp_pip < 0.5)
  df_plot$Frequency[df_plot$Outcome=="Both"] <- df_plot$Frequency[df_plot$Outcome=="Both"] + sum(gene_pips$gene_pip > 0.5 & gene_pips$snp_pip > 0.5)
  df_plot$Frequency[df_plot$Outcome=="SNPs"] <- df_plot$Frequency[df_plot$Outcome=="SNPs"] + sum(gene_pips$gene_pip < 0.5 & gene_pips$snp_pip > 0.5)
  df_plot$Frequency[df_plot$Outcome=="Genes"] <- df_plot$Frequency[df_plot$Outcome=="Genes"] + sum(gene_pips$gene_pip > 0.5 & gene_pips$snp_pip < 0.5)
}

pie <- ggplot(df_plot, aes(x="", y=Frequency, fill=Outcome)) + geom_bar(width = 1, stat = "identity")
pie <- pie + coord_polar("y", start=0) + theme_minimal() + theme(axis.title.y=element_blank())
pie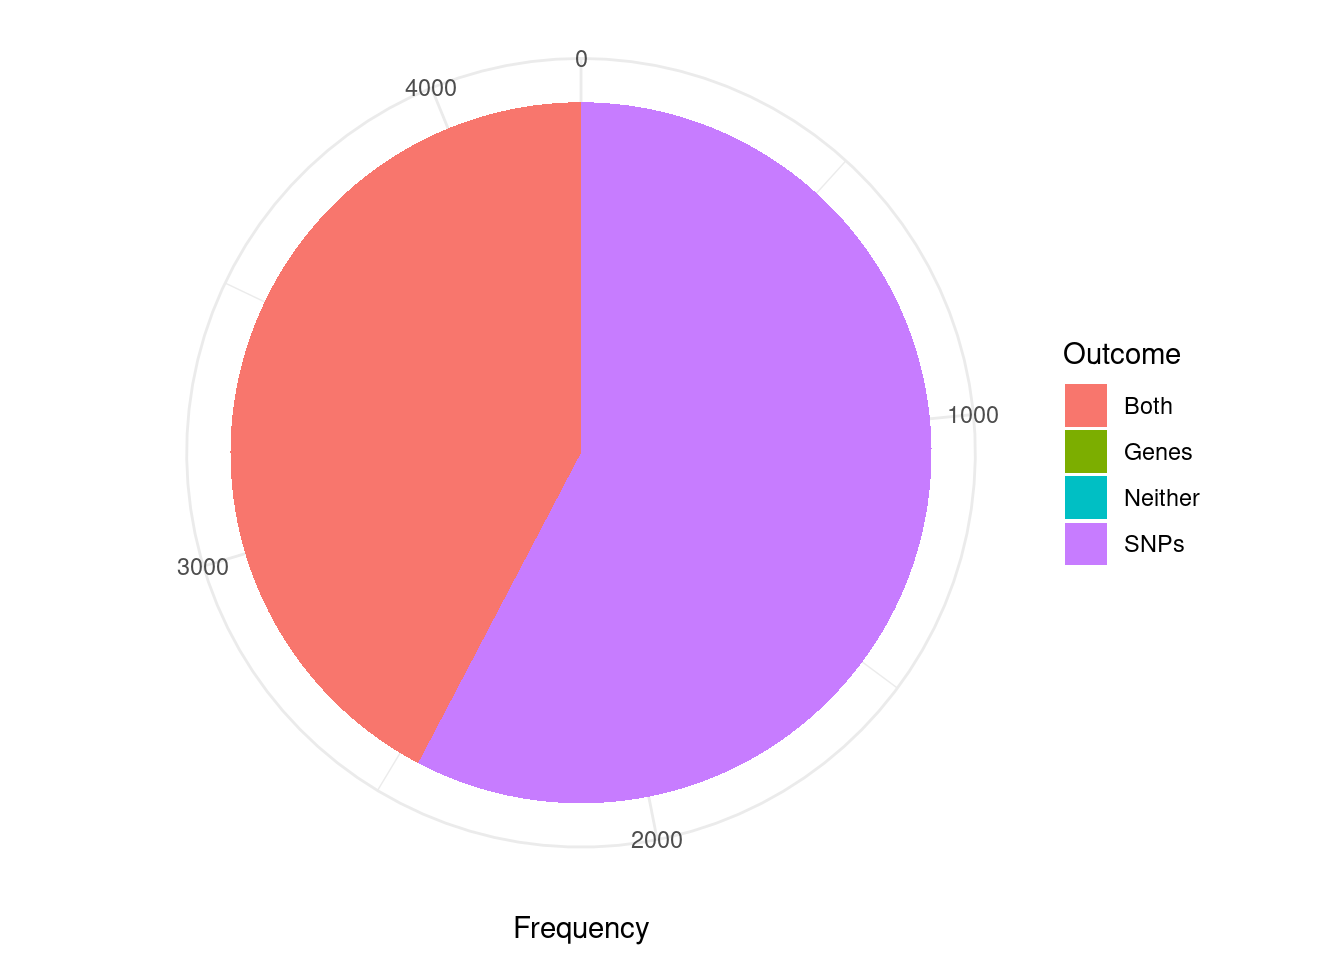
| Version | Author | Date |
|---|---|---|
| 65634fd | wesleycrouse | 2022-06-30 |
Analysis of TWAS False Positives by Credible Set
cTWAS is using susie settings that mask credible sets consisting of variables with minimum pairwise correlations below a specified threshold. The default threshold is 0.5. I think this is intended to mask credible sets with “diffuse” support. As a consequence, many of the genes considered here (TWAS false positives; significant z score but low PIP) are not assigned to a credible set (have cs_index=0). For this reason, the first figure is not really appropriate for answering the question “are TWAS false positives due to SNPs or genes”.
The second figure includes only TWAS genes that are assigned to a reported causal set (i.e. they are in a “pure” causal set with high pairwise correlations). I think that this figure is closer to the intended analysis. However, it may be biased in some way because we have excluded many TWAS false positive genes that are in “impure” credible sets.
Some alternatives to these figures include the region-based analysis in the previous section; or re-analysis with lower/no minimum pairwise correlation threshold (“min_abs_corr” option in susie_get_cs) for reporting credible sets.
library(ggplot2)

####################
#using only genes assigned to a credible set

pip_threshold <- 0.5

df_plot <- data.frame(Outcome=c("SNPs", "Genes", "Both", "Neither"), Frequency=rep(0,4))

for (i in 1:length(df)){
  gene_pips <- df[[i]]$gene_pips[df[[i]]$gene_pips$genename %in% df[[i]]$twas,,drop=F]
  gene_pips <- gene_pips[gene_pips$susie_pip < pip_threshold,,drop=F]

  #exclude genes that are not assigned to a credible set, cs_index==0
  gene_pips <- gene_pips[as.numeric(sapply(gene_pips$region_cs_tag, function(x){rev(unlist(strsplit(x, "_")))[1]}))!=0,]

  region_cs_pips <- df[[i]]$region_cs_pips
  rownames(region_cs_pips) <- region_cs_pips$region_cs

  gene_pips <- cbind(gene_pips, t(sapply(gene_pips$region_cs_tag, function(x){unlist(region_cs_pips[x,c("gene_pip", "snp_pip")])})))
  gene_pips$gene_pip <- gene_pips$gene_pip - gene_pips$susie_pip #subtract gene pip from causal set total to get combined pip for other genes in causal set

  plot_cutoff <- 0.5

  df_plot$Frequency[df_plot$Outcome=="Neither"] <- df_plot$Frequency[df_plot$Outcome=="Neither"] + sum(gene_pips$gene_pip < plot_cutoff & gene_pips$snp_pip < plot_cutoff)
  df_plot$Frequency[df_plot$Outcome=="Both"] <- df_plot$Frequency[df_plot$Outcome=="Both"] + sum(gene_pips$gene_pip > plot_cutoff & gene_pips$snp_pip > plot_cutoff)
  df_plot$Frequency[df_plot$Outcome=="SNPs"] <- df_plot$Frequency[df_plot$Outcome=="SNPs"] + sum(gene_pips$gene_pip < plot_cutoff & gene_pips$snp_pip > plot_cutoff)
  df_plot$Frequency[df_plot$Outcome=="Genes"] <- df_plot$Frequency[df_plot$Outcome=="Genes"] + sum(gene_pips$gene_pip > plot_cutoff & gene_pips$snp_pip < plot_cutoff)
}

pie <- ggplot(df_plot, aes(x="", y=Frequency, fill=Outcome)) + geom_bar(width = 1, stat = "identity")
pie <- pie + coord_polar("y", start=0) + theme_minimal() + theme(axis.title.y=element_blank())
pie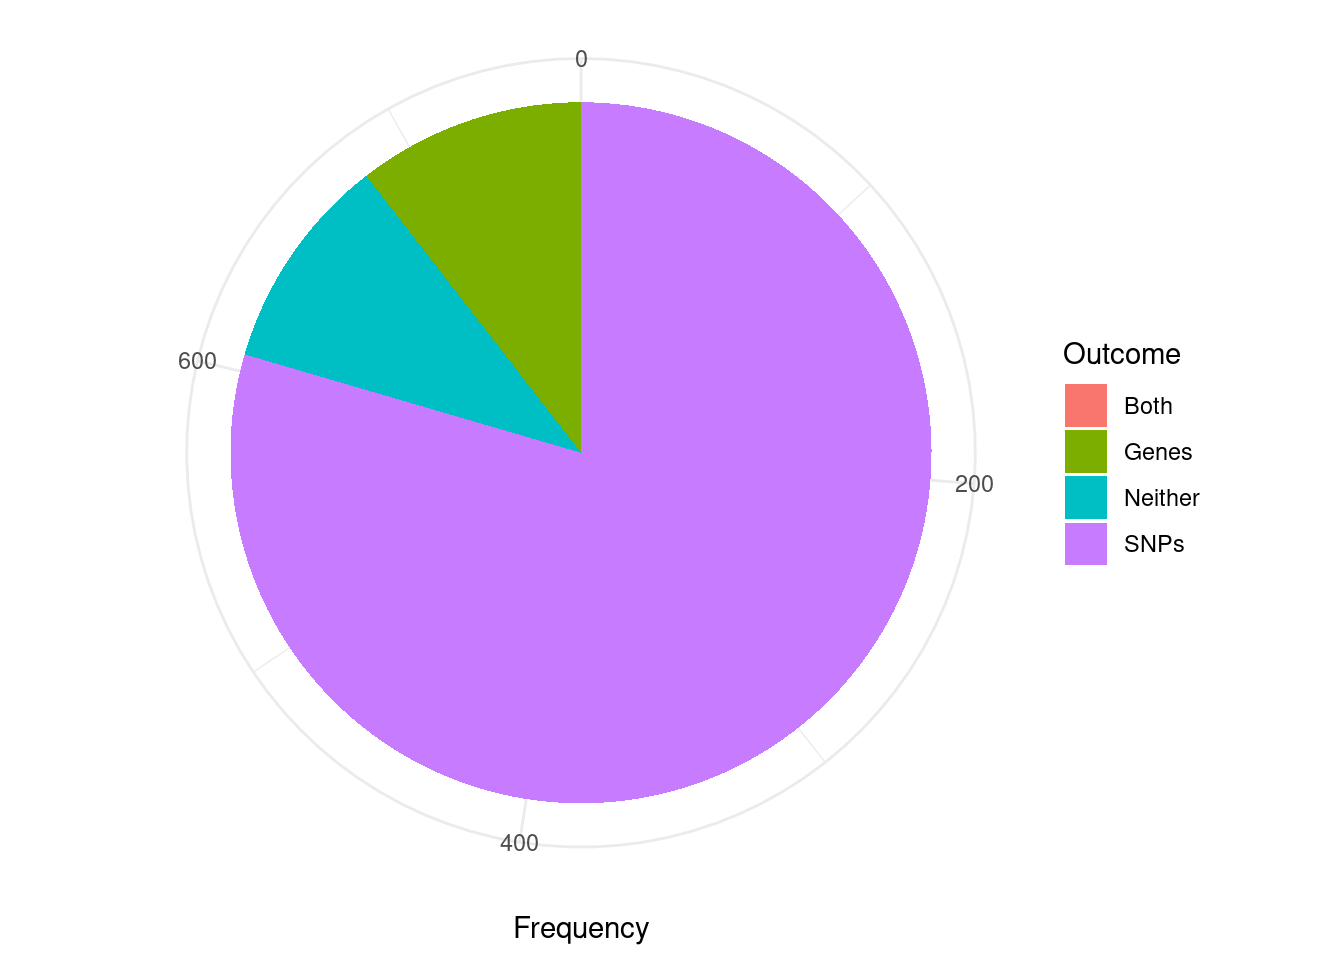
| Version | Author | Date |
|---|---|---|
| 65634fd | wesleycrouse | 2022-06-30 |
cTWAS genes without genome-wide significant SNP nearby
novel_genes <- data.frame(genename=as.character(), weight=as.character(), susie_pip=as.numeric(), snp_maxz=as.numeric())

for (i in 1:length(df)){
  gene_pips <- df[[i]]$gene_pips[df[[i]]$gene_pips$genename %in% df[[i]]$ctwas,,drop=F]

  region_pips <- df[[i]]$region_pips
  rownames(region_pips) <- region_pips$region

  gene_pips <- cbind(gene_pips, sapply(gene_pips$region_tag, function(x){region_pips[x,"snp_maxz"]}))
  names(gene_pips)[ncol(gene_pips)] <- "snp_maxz"

  if (nrow(gene_pips)>0){
    gene_pips$weight <- names(df)[i]
    gene_pips <- gene_pips[gene_pips$snp_maxz < qnorm(1-(5E-8/2), lower=T),c("genename", "weight", "susie_pip", "snp_maxz")]

    novel_genes <- rbind(novel_genes, gene_pips)
  }
}

novel_genes_summary <- data.frame(genename=unique(novel_genes$genename))
novel_genes_summary$nweights <- sapply(novel_genes_summary$genename, function(x){length(novel_genes$weight[novel_genes$genename==x])})
novel_genes_summary$weights <- sapply(novel_genes_summary$genename, function(x){paste(novel_genes$weight[novel_genes$genename==x],collapse=", ")})

novel_genes_summary <- novel_genes_summary[order(-novel_genes_summary$nweights),]
novel_genes_summary[,c("genename","nweights")]
genename nweights
1 LSP1 18
8 CCL20 9
6 EFEMP2 8
2 LTBP3 4
5 ITGAL 3
17 NPEPPS 3
25 RASA2 3
3 CDH24 2
11 PRKD2 2
14 CPT1C 2
15 PAX8 2
18 TYMP 2
23 CRK 2
27 TMEM151B 2
4 ANK1 1
7 SUFU 1
9 RAB29 1
10 PPP5C 1
12 MMP11 1
13 CD6 1
16 IPO8 1
19 SH2D3A 1
20 HFE 1
21 POM121C 1
22 UBE2W 1
24 HOXD1 1
26 ADCY9 1
28 SLC2A3 1
29 CRTC3 1
30 CNKSR1 1
31 ANKRD55 1
32 TFAM 1
33 SIX5 1
34 GPR132 1
35 IRF3 1
36 ACBD3 1
37 CCR5 1
38 CD200R1 1
39 C10orf105 1
40 STARD10 1
41 NPIPB3 1
42 BIK 1Tissue-specificity for cTWAS genes
#Tissue specificty for all cTWAS genes
gene_pips_by_weight <- data.frame(genename=as.character(ctwas_genes))

for (i in 1:length(df)){
  gene_pips <- df[[i]]$gene_pips
  gene_pips <- gene_pips[match(ctwas_genes, gene_pips$genename),,drop=F]

  gene_pips_by_weight <- cbind(gene_pips_by_weight, gene_pips$susie_pip)
  names(gene_pips_by_weight)[ncol(gene_pips_by_weight)] <- names(df)[i]
}

gene_pips_by_weight <- as.matrix(gene_pips_by_weight[,-1])
rownames(gene_pips_by_weight) <- ctwas_genes

#handing missing values
gene_pips_by_weight_bkup <- gene_pips_by_weight
gene_pips_by_weight[is.na(gene_pips_by_weight)] <- 0

#number of tissues with PIP>0.5 for cTWAS genes
ctwas_frequency <- rowSums(gene_pips_by_weight>0.5)

pdf(file = "output/IBD_tissue_specificity.pdf", width = 3.5, height = 2.5)

par(mar=c(4.6, 3.6, 1.1, 0.6))

hist(ctwas_frequency, col="grey", breaks=0:max(ctwas_frequency),
     #xlim=c(0,ncol(gene_pips_by_weight)),
     xlab="Number of Tissues\nwith PIP>0.5",
     ylab="Number of cTWAS Genes",
     main="IBD")

dev.off()
png
2 #heatmap of gene PIPs
cluster_ctwas_genes <- hclust(dist(gene_pips_by_weight))
cluster_ctwas_weights <- hclust(dist(t(gene_pips_by_weight)))
plot(cluster_ctwas_weights, cex=0.6)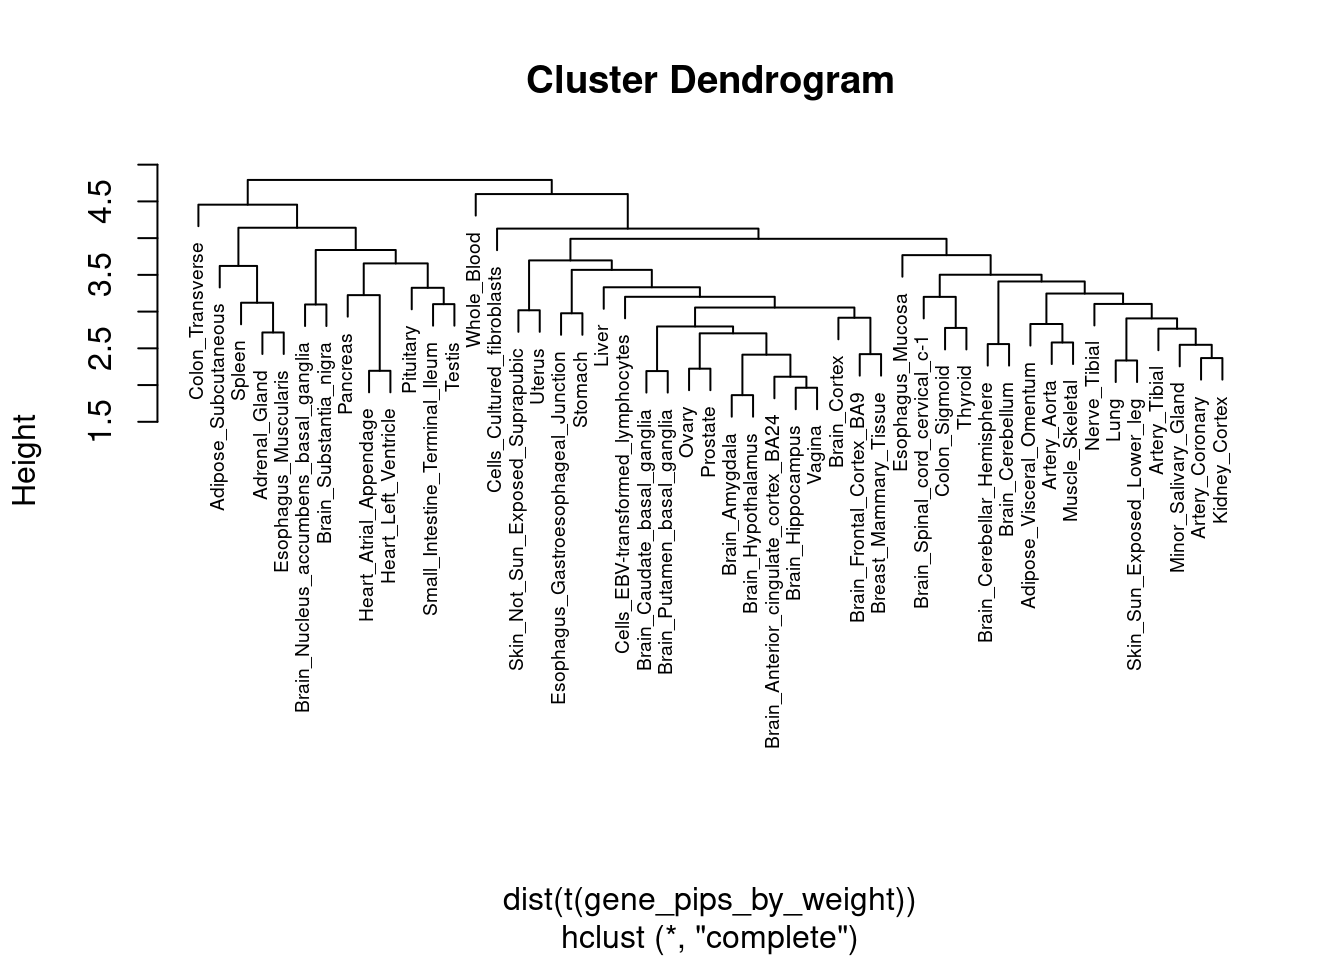
plot(cluster_ctwas_genes, cex=0.6, labels=F)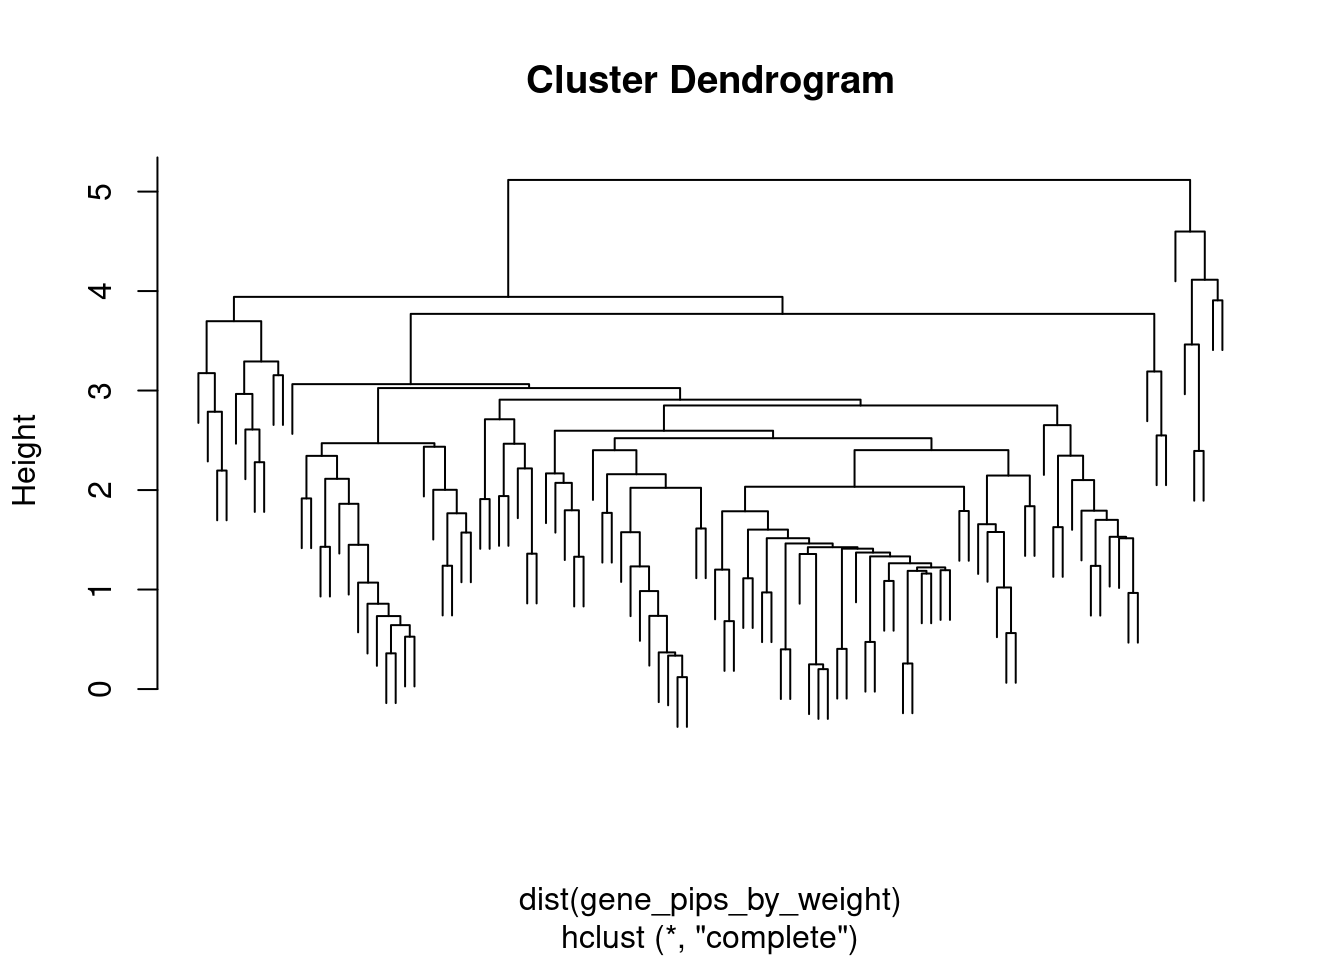
par(mar=c(14.1, 4.1, 4.1, 2.1))

image(t(gene_pips_by_weight[rev(cluster_ctwas_genes$order),rev(cluster_ctwas_weights$order)]),
      axes=F)
mtext(text=colnames(gene_pips_by_weight)[cluster_ctwas_weights$order], side=1, line=0.3, at=seq(0,1,1/(ncol(gene_pips_by_weight)-1)), las=2, cex=0.8)
mtext(text=rownames(gene_pips_by_weight)[cluster_ctwas_genes$order], side=2, line=0.3, at=seq(0,1,1/(nrow(gene_pips_by_weight)-1)), las=1, cex=0.4)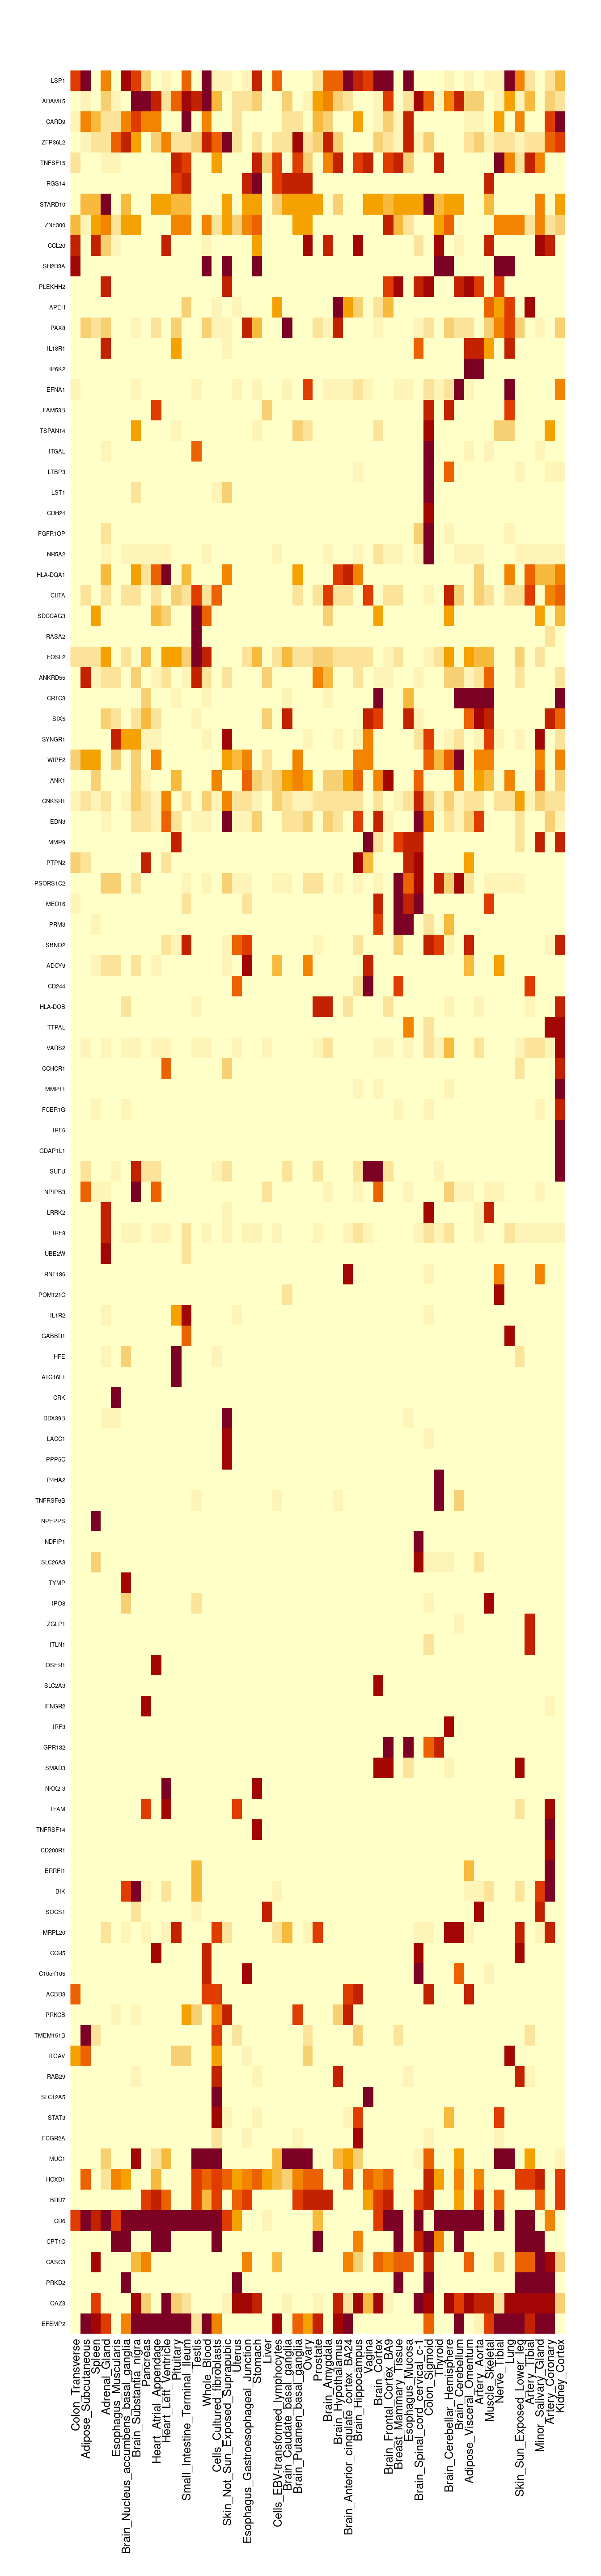
| Version | Author | Date |
|---|---|---|
| 65634fd | wesleycrouse | 2022-06-30 |
cTWAS genes with highest proportion of total PIP on a single tissue
#genes with highest proportion of PIP on a single tissue
gene_pips_proportion <- gene_pips_by_weight/rowSums(gene_pips_by_weight)

proportion_table <- data.frame(genename=as.character(rownames(gene_pips_proportion)))
proportion_table$max_pip_prop <- apply(gene_pips_proportion,1,max)
proportion_table$max_weight <- colnames(gene_pips_proportion)[apply(gene_pips_proportion,1,which.max)]

proportion_table[order(-proportion_table$max_pip_prop),]
genename max_pip_prop max_weight
93 PRM3 1.00000000 Testis
83 PSORS1C2 0.99842369 Minor_Salivary_Gland
59 RNF186 0.98868827 Colon_Transverse
89 HLA-DOB 0.96955968 Skin_Sun_Exposed_Lower_leg
36 TTPAL 0.85130518 Brain_Cerebellum
75 SBNO2 0.83546548 Esophagus_Mucosa
54 PTPN2 0.79706019 Cells_Cultured_fibroblasts
2 NR5A2 0.78374252 Adipose_Subcutaneous
22 SYNGR1 0.76299521 Artery_Aorta
64 UBE2W 0.74410712 Colon_Transverse
28 GDAP1L1 0.73642730 Artery_Tibial
73 CD244 0.63873911 Esophagus_Mucosa
92 SIX5 0.62578804 Stomach
82 EDN3 0.62101675 Lung
110 BIK 0.60285459 Whole_Blood
44 CCHCR1 0.57581089 Brain_Nucleus_accumbens_basal_ganglia
49 FCER1G 0.55452993 Brain_Substantia_nigra
17 ANK1 0.55263580 Adrenal_Gland
5 HLA-DQA1 0.54018943 Adipose_Subcutaneous
35 VARS2 0.51577606 Brain_Cerebellum
18 WIPF2 0.50895483 Adrenal_Gland
97 SMAD3 0.48497233 Thyroid
108 SOCS1 0.48148359 Whole_Blood
74 ADCY9 0.47717504 Esophagus_Mucosa
90 ANKRD55 0.46393437 Small_Intestine_Terminal_Ileum
16 SDCCAG3 0.46036987 Adipose_Visceral_Omentum
78 TMEM151B 0.45527099 Heart_Left_Ventricle
6 FGFR1OP 0.45119480 Adipose_Subcutaneous
94 MED16 0.44378066 Testis
84 CRTC3 0.42814341 Muscle_Skeletal
63 POM121C 0.40272334 Colon_Transverse
86 CNKSR1 0.40064269 Pancreas
34 MMP11 0.36676265 Brain_Cerebellar_Hemisphere
62 GABBR1 0.35059105 Colon_Transverse
58 SH2D3A 0.34776642 Cells_EBV-transformed_lymphocytes
102 CCR5 0.34196188 Whole_Blood
31 IRF6 0.33893558 Brain_Caudate_basal_ganglia
100 ERRFI1 0.33885165 Whole_Blood
99 MRPL20 0.32630317 Whole_Blood
48 APEH 0.32503279 Brain_Spinal_cord_cervical_c-1
77 LST1 0.31311483 Heart_Atrial_Appendage
4 ATG16L1 0.31172678 Colon_Transverse
80 DDX39B 0.30412920 Liver
60 IL1R2 0.29694085 Colon_Transverse
109 NPIPB3 0.29635735 Whole_Blood
68 FOSL2 0.27532210 Skin_Not_Sun_Exposed_Suprapubic
23 IP6K2 0.27389688 Artery_Coronary
55 MMP9 0.25643248 Cells_Cultured_fibroblasts
40 TSPAN14 0.25042370 Cells_Cultured_fibroblasts
11 CIITA 0.24968778 Adipose_Subcutaneous
88 P4HA2 0.24872385 Skin_Not_Sun_Exposed_Suprapubic
47 PLEKHH2 0.23111280 Brain_Spinal_cord_cervical_c-1
21 ITGAL 0.22742557 Esophagus_Muscularis
101 ACBD3 0.22148098 Whole_Blood
103 CD200R1 0.21906703 Whole_Blood
43 IL18R1 0.21561116 Brain_Nucleus_accumbens_basal_ganglia
95 NKX2-3 0.21125181 Thyroid
105 C10orf105 0.20666395 Whole_Blood
66 CRK 0.20641365 Prostate
56 TNFRSF6B 0.20575755 Uterus
46 PAX8 0.20422533 Esophagus_Muscularis
70 RASA2 0.19645561 Stomach
85 LRRK2 0.18873332 Nerve_Tibial
41 LACC1 0.17336551 Brain_Frontal_Cortex_BA9
61 HFE 0.17085903 Colon_Transverse
26 SUFU 0.16702825 Artery_Tibial
10 CDH24 0.16295490 Nerve_Tibial
45 PRKCB 0.16275180 Brain_Nucleus_accumbens_basal_ganglia
50 NDFIP1 0.16038375 Cells_Cultured_fibroblasts
72 EFNA1 0.15745234 Esophagus_Mucosa
81 SLC26A3 0.15625471 Liver
65 IRF8 0.15341195 Colon_Transverse
25 ITGAV 0.15188545 Heart_Atrial_Appendage
106 FAM53B 0.14582502 Whole_Blood
19 SLC12A5 0.13734951 Brain_Putamen_basal_ganglia
67 IFNGR2 0.13545725 Stomach
38 CD6 0.13026212 Brain_Cortex
37 FCGR2A 0.11665997 Brain_Nucleus_accumbens_basal_ganglia
7 CARD9 0.11612567 Uterus
53 NPEPPS 0.11544422 Uterus
76 OSER1 0.11151659 Esophagus_Mucosa
32 PPP5C 0.11139335 Brain_Cerebellar_Hemisphere
12 TNFRSF14 0.11090722 Adipose_Visceral_Omentum
98 IRF3 0.10883277 Thyroid
52 STAT3 0.10780988 Whole_Blood
9 LTBP3 0.10579791 Small_Intestine_Terminal_Ileum
30 RAB29 0.09849395 Brain_Anterior_cingulate_cortex_BA24
57 TYMP 0.09772021 Cells_Cultured_fibroblasts
79 SLC2A3 0.09479647 Heart_Atrial_Appendage
87 ITLN1 0.09046501 Pituitary
13 MUC1 0.09042692 Brain_Amygdala
3 ZFP36L2 0.08677497 Spleen
96 GPR132 0.08601513 Thyroid
51 IPO8 0.08121398 Cells_Cultured_fibroblasts
33 PRKD2 0.07987312 Brain_Cerebellar_Hemisphere
71 ZGLP1 0.07908120 Esophagus_Gastroesophageal_Junction
91 TFAM 0.07616221 Small_Intestine_Terminal_Ileum
29 CCL20 0.07605188 Brain_Nucleus_accumbens_basal_ganglia
15 TNFSF15 0.07348760 Esophagus_Muscularis
39 CPT1C 0.07032861 Brain_Substantia_nigra
27 BRD7 0.06968491 Whole_Blood
42 CASC3 0.06863957 Esophagus_Mucosa
69 HOXD1 0.06547475 Esophagus_Gastroesophageal_Junction
20 OAZ3 0.06245172 Nerve_Tibial
24 EFEMP2 0.05425307 Stomach
107 STARD10 0.05293731 Whole_Blood
1 ADAM15 0.04843368 Cells_Cultured_fibroblasts
104 ZNF300 0.04664545 Whole_Blood
8 LSP1 0.04139708 Esophagus_Muscularis
14 RGS14 0.03571563 UterusGenes nearby and nearest to GWAS peaks
#####load positions for all genes on autosomes in ENSEMBL, subset to only protein coding and lncRNA with non-missing HGNC symbol
library(biomaRt)

ensembl <- useEnsembl(biomart="ENSEMBL_MART_ENSEMBL", dataset="hsapiens_gene_ensembl")
G_list <- getBM(filters= "chromosome_name", attributes= c("hgnc_symbol","chromosome_name","start_position","end_position","gene_biotype", "ensembl_gene_id", "strand"), values=1:22, mart=ensembl)

save(G_list, file=paste0("G_list_", trait_id, ".RData"))
load(paste0("G_list_", trait_id, ".RData"))

G_list <- G_list[G_list$gene_biotype %in% c("protein_coding"),]
G_list$hgnc_symbol[G_list$hgnc_symbol==""] <- "-"
G_list$tss <- G_list[,c("end_position", "start_position")][cbind(1:nrow(G_list),G_list$strand/2+1.5)]

#####load z scores from the analysis and add positions from the LD reference
# results_dir <- results_dirs[1]
# load(paste0(results_dir, "/", analysis_id, "_expr_z_snp.Rd"))
#
# LDR_dir <- "/project2/mstephens/wcrouse/UKB_LDR_0.1/"
# LDR_files <- list.files(LDR_dir)
# LDR_files <- LDR_files[grep(".Rvar" ,LDR_files)]
#
# z_snp$chrom <- as.integer(NA)
# z_snp$pos <- as.integer(NA)
#
# for (i in 1:length(LDR_files)){
#   print(i)
#
#   LDR_info <- read.table(paste0(LDR_dir, LDR_files[i]), header=T)
#   z_snp_index <- which(z_snp$id %in% LDR_info$id)
#   z_snp[z_snp_index,c("chrom", "pos")] <- t(sapply(z_snp_index, function(x){unlist(LDR_info[match(z_snp$id[x], LDR_info$id),c("chrom", "pos")])}))
# }
#
# z_snp <- z_snp[,c("id", "z", "chrom","pos")]
# save(z_snp, file=paste0("z_snp_pos_", trait_id, ".RData"))
load(paste0("z_snp_pos_", trait_id, ".RData"))

####################
#identify genes within 500kb of genome-wide significant variant ("nearby")
G_list$nearby <- NA

window_size <- 500000

for (chr in 1:22){
  #index genes on chromosome
  G_list_index <- which(G_list$chromosome_name==chr)

  #subset z_snp to chromosome, then subset to significant genome-wide significant variants
  z_snp_chr <- z_snp[z_snp$chrom==chr,,drop=F]
  z_snp_chr <- z_snp_chr[abs(z_snp_chr$z)>qnorm(1-(5E-8/2), lower=T),,drop=F]

  #iterate over genes on chromsome and check if a genome-wide significant SNP is within the window
  for (i in G_list_index){
    window_start <- G_list$start_position[i] - window_size
    window_end <- G_list$end_position[i] + window_size
    G_list$nearby[i] <- any(z_snp_chr$pos>=window_start & z_snp_chr$pos<=window_end)
  }
}

####################
#identify genes that are nearest to lead genome-wide significant variant ("nearest")
G_list$nearest <- F
G_list$distance <- Inf
G_list$which_nearest <- NA

window_size <- 500000

n_peaks <- 0

for (chr in 1:22){
  #index genes on chromosome
  G_list_index <- which(G_list$chromosome_name==chr & G_list$gene_biotype=="protein_coding")

  #subset z_snp to chromosome, then subset to significant genome-wide significant variants
  z_snp_chr <- z_snp[z_snp$chrom==chr,,drop=F]
  z_snp_chr <- z_snp_chr[abs(z_snp_chr$z)>qnorm(1-(5E-8/2), lower=T),,drop=F]

  while (nrow(z_snp_chr)>0){
    n_peaks <- n_peaks + 1

    lead_index <- which.max(abs(z_snp_chr$z))
    lead_position <- z_snp_chr$pos[lead_index]

    distances <- sapply(G_list_index, function(i){
      if (lead_position >= G_list$start_position[i] & lead_position <= G_list$end_position[i]){
        distance <- 0
      } else {
        distance <- min(abs(G_list$start_position[i] - lead_position), abs(G_list$end_position[i] - lead_position))
      }
      distance
    })

    min_distance <- min(distances)

    G_list$nearest[G_list_index[distances==min_distance]] <- T

    nearest_genes <- paste0(G_list$hgnc_symbol[G_list_index[distances==min_distance]], collapse=", ")

    update_index <- which(G_list$distance[G_list_index] > distances)
    G_list$distance[G_list_index][update_index] <- distances[update_index]
    G_list$which_nearest[G_list_index][update_index] <- nearest_genes

    window_start <- lead_position - window_size
    window_end <- lead_position + window_size
    z_snp_chr <- z_snp_chr[!(z_snp_chr$pos>=window_start & z_snp_chr$pos<=window_end),,drop=F]
  }
}

G_list$distance[G_list$distance==Inf] <- NA

#report number of GWAS peaks
sum(n_peaks)
[1] 131Enrichment analysis using known IBD genes from ABC paper
known_genes <- data.table::fread("nasser_2021_ABC_IBD_genes.txt")
known_genes <- unique(known_genes$KnownGene)

# dbs <- c("GO_Biological_Process_2021")
# GO_enrichment <- enrichr(known_genes, dbs)
#
# for (db in dbs){
#   cat(paste0(db, "\n\n"))
#   enrich_results <- GO_enrichment[[db]]
#   enrich_results <- enrich_results[enrich_results$Adjusted.P.value<0.05,c("Term", "Overlap", "Adjusted.P.value", "Genes")]
#   print(enrich_results)
#   print(plotEnrich(GO_enrichment[[db]]))
# }
#
# save(enrich_results, file="ABC_IBD_genes_enrichment.RData")
# write.csv(enrich_results, file="ABC_IBD_genes_enrichment.csv")

enrich_results <- as.data.frame(data.table::fread("ABC_IBD_genes_enrichment.csv"))

#report number of known IBD genes in annotations
length(known_genes)
[1] 26Summary table for selected tissue groups
#mapping genename to ensembl
genename_mapping <- data.frame(genename=as.character(), ensembl_id=as.character(), weight=as.character())

for (i in 1:length(results_dirs)){
  results_dir <- results_dirs[i]
  weight <- rev(unlist(strsplit(results_dir, "/")))[1]
  analysis_id <- paste(trait_id, weight, sep="_")

  sqlite <- RSQLite::dbDriver("SQLite")
  db = RSQLite::dbConnect(sqlite, paste0("/project2/mstephens/wcrouse/predictdb_nolnc/mashr_", weight, ".db"))
  query <- function(...) RSQLite::dbGetQuery(db, ...)
  gene_info <- query("select gene, genename, gene_type from extra")
  RSQLite::dbDisconnect(db)

  genename_mapping <- rbind(genename_mapping, cbind(gene_info[,c("gene","genename")],weight))
}

genename_mapping <- genename_mapping[,c("gene","genename"),drop=F]
genename_mapping <- genename_mapping[!duplicated(genename_mapping),]
selected_groups <- c("Blood or Immune", "Digestive")
selected_genes <- unique(unlist(sapply(df_group[selected_groups], function(x){x$ctwas})))
weight_groups <- weight_groups[order(weight_groups$group),]
selected_weights <- weight_groups$weight[weight_groups$group %in% selected_groups]
gene_pips_by_weight <- gene_pips_by_weight_bkup
results_table <- as.data.frame(round(gene_pips_by_weight[selected_genes,selected_weights],3))
results_table$n_discovered <- apply(results_table>0.8,1,sum,na.rm=T)
results_table$n_imputed <- apply(results_table, 1, function(x){sum(!is.na(x))-1})
results_table$ensembl_gene_id <- genename_mapping$gene[sapply(rownames(results_table), match, table=genename_mapping$genename)]
results_table$ensembl_gene_id <- sapply(results_table$ensembl_gene_id, function(x){unlist(strsplit(x, "[.]"))[1]})
results_table <- cbind(results_table, G_list[sapply(results_table$ensembl_gene_id, match, table=G_list$ensembl_gene_id),c("chromosome_name","start_position","end_position","nearby","nearest","distance","which_nearest")])
results_table$known <- rownames(results_table) %in% known_genes
load(paste0("group_enrichment_results_", trait_id, ".RData"))
group_enrichment_results$group <- as.character(group_enrichment_results$group)
group_enrichment_results$db <- as.character(group_enrichment_results$db)
group_enrichment_results <- group_enrichment_results[group_enrichment_results$group %in% selected_groups,,drop=F]
results_table$enriched_terms <- sapply(rownames(results_table), function(x){paste(group_enrichment_results$Term[grep(x, group_enrichment_results$Genes)],collapse="; ")})
write.csv(results_table, file=paste0("summary_table_inflammatory_bowel_disease_nolnc_corrected.csv"))Overlap of enrichment analysis
#collect GO terms for selected genes
db <- "GO_Biological_Process_2021"
GO_enrichment <- enrichr(selected_genes, db)
Uploading data to Enrichr... Done.
Querying GO_Biological_Process_2021... Done.
Parsing results... Done.enrich_results_selected_genes <- GO_enrichment[[db]]
load("ABC_IBD_genes_enrichment.RData")
enrich_results_known_genes <- enrich_results
overlap_table <- as.data.frame(matrix(F, nrow(enrich_results_known_genes), length(selected_genes)))
overlap_table <- cbind(enrich_results_known_genes$Term, overlap_table)
colnames(overlap_table) <- c("Term", selected_genes)
for (i in 1:nrow(overlap_table)){
Term <- overlap_table$Term[i]
if (Term %in% enrich_results_selected_genes$Term){
Term_genes <- enrich_results_selected_genes$Genes[enrich_results_selected_genes$Term==Term]
overlap_table[i, unlist(strsplit(Term_genes, ";"))] <- T
}
}
write.csv(overlap_table, file="GO_overlap_inflammatory_bowel_disease_nolnc_corrected.csv")Results and figures for the paper
Gene expression explains a small proportion of heritability
Note that the published MESC results in Yao et al. analyzed the same traits from Finucane 2015, which used ulcerative colitis summary statistics from Jostin’s 2012. We used more recent results from de Lange 2017. MESC also used prediction models from GTEx v7 while we used prediction models from GTEx v8.
Update: These results now match, using the summary statistics from de Lange 2017 and GTEx v8 models provided by MESC.
Trend lines are fit with (red) and without (blue) an intercept.
library(ggrepel)

mesc_results <- as.data.frame(data.table::fread("output/allweight_heritability.txt"))
mesc_results <- mesc_results[mesc_results$trait==trait_id,]
mesc_results$`h2med/h2g` <- mesc_results$h2med/mesc_results$h2
mesc_results$weight[!is.na(mesc_results$weight_predictdb)] <- mesc_results$weight_predictdb[!is.na(mesc_results$weight_predictdb)]
mesc_results <- mesc_results[,colnames(mesc_results)!="weight_predictdb"]
rownames(mesc_results) <- mesc_results$weight

output$pve_med <- output$pve_g / (output$pve_g + output$pve_s)
rownames(output) <- output$weight

df_plot <- output
df_plot <- df_plot[mesc_results$weight,]
df_plot$mesc <- as.numeric(mesc_results$`h2med/h2g`)
df_plot$ctwas <- as.numeric(df_plot$pve_med)
df_plot$tissue <- as.character(sapply(df_plot$weight, function(x){paste(unlist(strsplit(x, "_")), collapse=" ")}))

df_plot$label <- ""
label_list <- c("Whole Blood")

df_plot$label[df_plot$tissue %in% label_list] <- df_plot$tissue[df_plot$tissue %in% label_list]

####################

pdf(file = "output/IBD_cTWAS_vs_MESC.pdf", width = 4, height = 3)

#p <- ggplot(df_plot, aes(mesc, ctwas, label = tissue)) + geom_point(color = "blue", size=1.5)
p <- ggplot(df_plot, aes(mesc, ctwas, label = label)) + geom_point(color = "blue", size=2)
p <- p + geom_text_repel(size=3,
                         max.time=20,
                         max.iter=400000,
                         seed=1,
                         max.overlaps=Inf,
                         #force=2.8,
                         #force_pull=0.3,
                         force=1,
                         force_pull=1,
                         min.segment.length=0)
p <- p + ylab("(Gene PVE) / (Total PVE) using cTWAS") + xlab("(h2med) / (h2g) using MESC")
p <- p + geom_abline(slope=1, intercept=0, linetype=3, alpha=0.4)

xy_min <- min(df_plot$mesc, df_plot$ctwas, na.rm=T)
xy_max <- max(df_plot$mesc, df_plot$ctwas, na.rm=T)

p <- p + xlim(xy_min,xy_max) + ylim(xy_min,xy_max)

fit <- lm(ctwas~0+mesc, data=df_plot)
p <- p + geom_abline(slope=summary(fit)$coefficients["mesc","Estimate"], intercept=0, linetype=2, color="blue", alpha=0.4)

p <- p + theme_bw()


p <- p + theme(axis.title = element_text(color = "grey20", size = 10))

p
Warning: Removed 1 rows containing missing values (geom_point).Warning: Removed 1 rows containing missing values (geom_text_repel).dev.off()png
2 pWarning: Removed 1 rows containing missing values (geom_point).
Warning: Removed 1 rows containing missing values (geom_text_repel).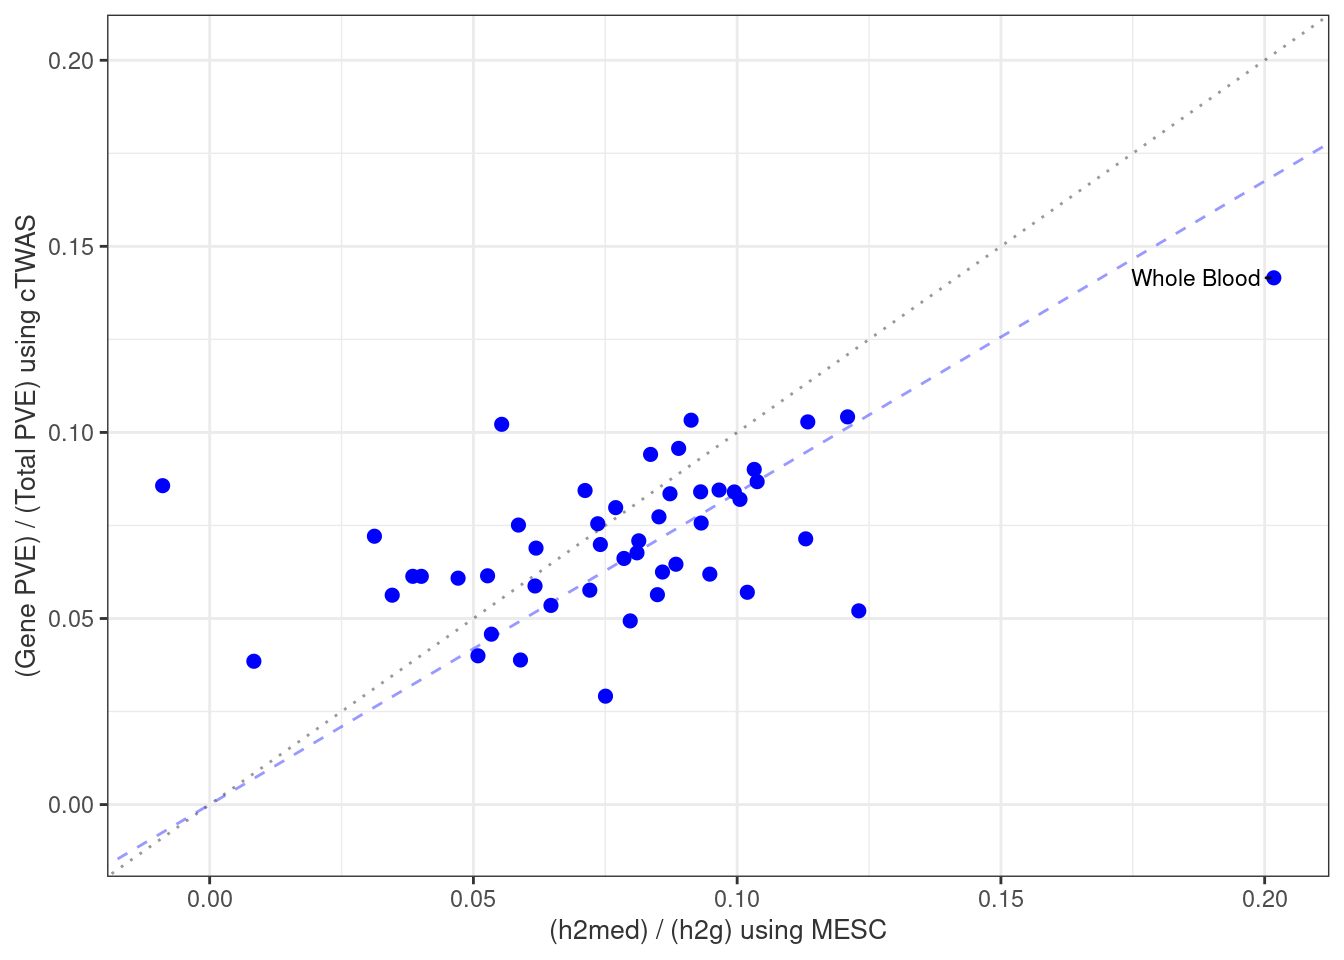
| Version | Author | Date |
|---|---|---|
| 691375a | wesleycrouse | 2022-08-24 |
| 755127a | wesleycrouse | 2022-07-28 |
| 96e4b26 | wesleycrouse | 2022-07-28 |
| cb3f976 | wesleycrouse | 2022-07-27 |
| dd9f346 | wesleycrouse | 2022-07-27 |
| 0803b64 | wesleycrouse | 2022-07-27 |
| 4c153a7 | wesleycrouse | 2022-07-25 |
| 30511bd | wesleycrouse | 2022-07-14 |
| 714a734 | wesleycrouse | 2022-07-14 |
| 772879d | wesleycrouse | 2022-07-14 |
| 3bd4709 | wesleycrouse | 2022-07-13 |
| f29fd71 | wesleycrouse | 2022-07-12 |
| bb25d5b | wesleycrouse | 2022-07-12 |
| 7ad4535 | wesleycrouse | 2022-07-12 |
| 6d451ae | wesleycrouse | 2022-07-11 |
| c866437 | wesleycrouse | 2022-07-11 |
| f975189 | wesleycrouse | 2022-07-11 |
| d0e05a0 | wesleycrouse | 2022-07-07 |
| e74100e | wesleycrouse | 2022-07-07 |
####################

df_plot$tissue_number <- order(df_plot$weight)

df_plot$legend_entry <- sapply(1:nrow(df_plot), function(x){paste0(df_plot$tissue_number[x], ": ", df_plot$tissue[x])})


png(filename = "output/IBD_cTWAS_vs_MESC_v2.png", width = 6, height = 5, units = "in", res=150)

p <- ggplot(df_plot, aes(mesc, ctwas, label = tissue_number))

p <- p + geom_point(color = "blue", size=1.5)

p <- p + geom_text_repel(min.segment.length=0,
                         size=2.4,
                         seed=1,
                         max.overlaps=Inf,
                         force=2,
                         force_pull=0.5)
p <- p + ylab("(Gene PVE) / (Total PVE) using cTWAS") + xlab("(h2med) / (h2g) using MESC")

p <- p + geom_abline(slope=1, intercept=0, linetype=3, alpha=0.4)

xy_min <- min(df_plot$mesc, df_plot$ctwas, na.rm=T)
xy_max <- max(df_plot$mesc, df_plot$ctwas, na.rm=T)

p <- p + xlim(xy_min,xy_max) + ylim(xy_min,xy_max)

fit <- lm(ctwas~0+mesc, data=df_plot)
p <- p + geom_abline(slope=summary(fit)$coefficients["mesc","Estimate"], intercept=0, linetype=2, color="blue", alpha=0.4)

p <- p + theme_bw()

#p <- p + theme(plot.margin = unit(c(1,15,1,1), "lines"))
# y_values <- xy_max-(xy_max-xy_min)*(1:nrow(df_plot))/nrow(df_plot)
# p <- p + geom_text(aes(label=legend_entry, x=xy_max, y=y_values, hjust=0))

p
Warning: Removed 1 rows containing missing values (geom_point).
Warning: Removed 1 rows containing missing values (geom_text_repel).dev.off()png
2 pWarning: Removed 1 rows containing missing values (geom_point).
Warning: Removed 1 rows containing missing values (geom_text_repel).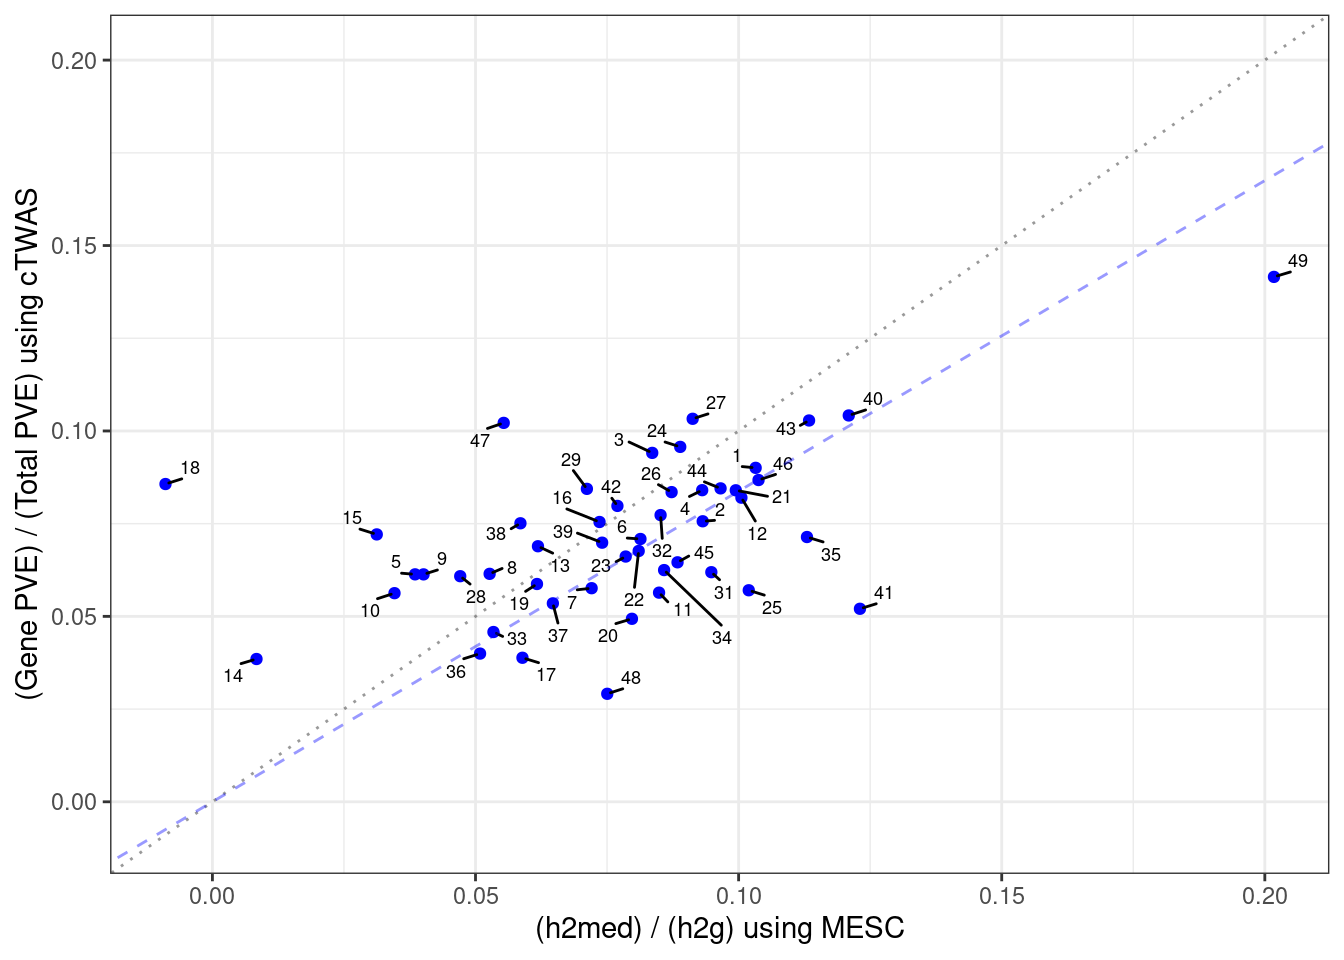
| Version | Author | Date |
|---|---|---|
| 3349d12 | wesleycrouse | 2022-09-16 |
| 6a57156 | wesleycrouse | 2022-09-14 |
| 6d10cf7 | wesleycrouse | 2022-09-09 |
| 220ba1d | wesleycrouse | 2022-09-09 |
| 2af4567 | wesleycrouse | 2022-09-02 |
| 7593421 | wesleycrouse | 2022-08-29 |
| 437d453 | wesleycrouse | 2022-08-29 |
| 691375a | wesleycrouse | 2022-08-24 |
| 755127a | wesleycrouse | 2022-07-28 |
| 96e4b26 | wesleycrouse | 2022-07-28 |
| cb3f976 | wesleycrouse | 2022-07-27 |
| dd9f346 | wesleycrouse | 2022-07-27 |
| 0803b64 | wesleycrouse | 2022-07-27 |
| 4c153a7 | wesleycrouse | 2022-07-25 |
| 30511bd | wesleycrouse | 2022-07-14 |
| 714a734 | wesleycrouse | 2022-07-14 |
| 772879d | wesleycrouse | 2022-07-14 |
| 3bd4709 | wesleycrouse | 2022-07-13 |
| f29fd71 | wesleycrouse | 2022-07-12 |
| bb25d5b | wesleycrouse | 2022-07-12 |
| 7ad4535 | wesleycrouse | 2022-07-12 |
| 6d451ae | wesleycrouse | 2022-07-11 |
| c866437 | wesleycrouse | 2022-07-11 |
| f975189 | wesleycrouse | 2022-07-11 |
| d0e05a0 | wesleycrouse | 2022-07-07 |
####################

#report correlation between cTWAS and MESC
cor(df_plot$mesc, df_plot$ctwas, use="complete.obs")
[1] 0.5389468cTWAS finds fewer genes than TWAS
Trend lines are fit with (red) and without (blue) an intercept.
library(ggrepel)

df_plot <- output
#df_plot <- df_plot[selected_weights,,drop=F]
df_plot$tissue <- sapply(df_plot$weight, function(x){paste(unlist(strsplit(x,"_")),collapse=" ")})

png(filename = "output/IBD_cTWAS_vs_TWAS_all.png", width = 6, height = 5, units = "in", res=150)

p <- ggplot(df_plot, aes(n_twas, n_ctwas, label = tissue))
p <- p + geom_point(color = "blue", size=1.5)
p <- p + geom_text_repel(min.segment.length=0,
                         size=2.4,
                         seed=1,
                         max.overlaps=Inf,
                         force=2,
                         force_pull=0.5)
p <- p + ylab("Number of cTWAS genes") + xlab("Number of TWAS genes")
p <- p + scale_y_continuous(breaks=seq(0,max(df_plot$n_ctwas),2))
p <- p + scale_x_continuous(breaks=seq(0,max(df_plot$n_twas),5))
p <- p + theme_bw()

fit <- lm(n_ctwas~0+n_twas, data=df_plot)
p <- p + geom_abline(slope=summary(fit)$coefficients["n_twas","Estimate"], intercept=0, linetype=2, color="blue")

p

dev.off()
png
2 #report correlation between cTWAS and TWAS
cor(df_plot$n_ctwas, df_plot$n_twas)[1] 0.483534####################
#using cutpoint for number of ctwas and twas genes to determine which tissues to label
df_plot <- output
df_plot$tissue <- sapply(df_plot$weight, function(x){paste(unlist(strsplit(x,"_")),collapse=" ")})
df_plot$tissue[df_plot$n_ctwas < 7.5 & df_plot$n_twas < 115] <- ""
png(filename = "output/IBD_cTWAS_vs_TWAS_top.png", width = 6, height = 5, units = "in", res=150)
p <- ggplot(df_plot, aes(n_twas, n_ctwas, label = tissue))
p <- p + geom_point(color = "blue", size=1.5)
p <- p + geom_text_repel(min.segment.length=0,
size=2.4,
seed=1,
max.overlaps=Inf,
force=1,
force_pull=0.5)
p <- p + ylab("Number of cTWAS genes") + xlab("Number of TWAS genes")
p <- p + scale_y_continuous(breaks=seq(0,max(df_plot$n_ctwas),2))
p <- p + scale_x_continuous(breaks=seq(0,max(df_plot$n_twas),5))
p <- p + theme_bw()
fit <- lm(n_ctwas~0+n_twas, data=df_plot)
p <- p + geom_abline(slope=summary(fit)$coefficients["n_twas","Estimate"], intercept=0, linetype=2, color="blue")
p
dev.off()png
2 ####################
#only labeling genes in "Blood or Immune" or "Digestive" groups
df_plot <- output
df_plot$tissue <- sapply(df_plot$weight, function(x){paste(unlist(strsplit(x,"_")),collapse=" ")})
df_plot[!(df_plot$weight %in% selected_weights),"tissue"] <- ""
png(filename = "output/IBD_cTWAS_vs_TWAS_bloodanddigest.png", width = 6, height = 5, units = "in", res=150)
p <- ggplot(df_plot, aes(n_twas, n_ctwas, label = tissue))
p <- p + geom_point(color = "blue", size=1.5)
p <- p + geom_text_repel(min.segment.length=0,
size=2.4,
seed=1,
max.overlaps=Inf,
force=1,
force_pull=0.5)
p <- p + ylab("Number of cTWAS genes") + xlab("Number of TWAS genes")
p <- p + scale_y_continuous(breaks=seq(0,max(df_plot$n_ctwas),2))
p <- p + scale_x_continuous(breaks=seq(0,max(df_plot$n_twas),5))
p <- p + theme_bw()
fit <- lm(n_ctwas~0+n_twas, data=df_plot)
p <- p + geom_abline(slope=summary(fit)$coefficients["n_twas","Estimate"], intercept=0, linetype=2, color="blue")
p
dev.off()png
2 ####################
#minimum and maximum number of discoveries per tissues
min(output$n_ctwas)[1] 0max(output$n_ctwas)[1] 17min(output$n_twas)[1] 68max(output$n_twas)[1] 125####################
df_plot <- output
df_plot$tissue <- sapply(df_plot$weight, function(x){paste(unlist(strsplit(x,"_")),collapse=" ")})
df_plot$label <- ""
#label_list <- c("Whole Blood")
label_list <- c(df_plot$tissue[which.max(df_plot$n_twas)], df_plot$tissue[which.max(df_plot$n_ctwas)])
df_plot$label[df_plot$tissue %in% label_list] <- df_plot$tissue[df_plot$tissue %in% label_list]
pdf(file = "output/IBD_cTWAS_vs_TWAS.pdf", width = 4, height = 3)
p <- ggplot(df_plot, aes(n_twas, n_ctwas, label = label))
p <- p + geom_point(color = "blue", size=1.5)
p <- p + geom_text_repel(min.segment.length=0,
size=3,
seed=1,
max.overlaps=Inf,
force=1,
force_pull=1)
p <- p + ylab("Number of cTWAS Genes") + xlab("Number of TWAS Genes")
p <- p + scale_y_continuous(breaks=seq(0,max(df_plot$n_ctwas),2))
p <- p + scale_x_continuous(breaks=seq(0,max(df_plot$n_twas),5))
p <- p + theme_bw()
fit <- lm(n_ctwas~0+n_twas, data=df_plot)
p <- p + geom_abline(slope=summary(fit)$coefficients["n_twas","Estimate"], intercept=0, linetype=2, color="blue", alpha=0.4) + ggtitle("IBD")
p
dev.off()png
2 Most cTWAS genes were found in a small number of tissues
#number of tissues with PIP>0.5 for cTWAS genes
gene_pips_by_weight_bkup <- gene_pips_by_weight
gene_pips_by_weight[is.na(gene_pips_by_weight)] <- 0

gene_pips_by_weight <- gene_pips_by_weight[apply(gene_pips_by_weight[,selected_weights,drop=F],1,max)>0.8,,drop=F]

ctwas_frequency <- rowSums(gene_pips_by_weight>0.5)

pdf(file = "output/IBD_tissue_specificity_selected_groups.pdf", width = 2.75, height = 3.5)

par(mar=c(4.6, 3.6, 1.1, 0.6))

hist(ctwas_frequency, col="grey", breaks=0:max(ctwas_frequency),
     #xlim=c(0,ncol(gene_pips_by_weight)),
     xlim=c(0,30),
     xlab="Number of Tissues\nwith PIP>0.5",
     ylab="Number of cTWAS Genes",
     main="")

dev.off()
png
2 #report number of genes in each tissue bin
table(ctwas_frequency)ctwas_frequency
1 2 3 4 6 7 8 10 11 12 13 14 15 19 21 22 26 29
16 3 7 6 2 3 3 4 2 1 1 1 1 2 1 1 1 1 #% less than 5
sum(ctwas_frequency<5)/length(ctwas_frequency)[1] 0.5714286#% equal to 1
sum(ctwas_frequency==1)/length(ctwas_frequency)[1] 0.2857143#list the frequency for each gene
ctwas_frequency ADAM15 ZFP36L2 ATG16L1 CARD9 LSP1 LTBP3 MUC1 RGS14 TNFSF15 OAZ3 ITGAL EFEMP2 BRD7 CCL20 PRKD2 FCGR2A CASC3 PAX8 NDFIP1 STAT3 TYMP SH2D3A RNF186 IL1R2 HFE GABBR1 POM121C UBE2W IRF8 CRK IFNGR2 FOSL2 HOXD1 RASA2 ZGLP1 EFNA1 CD244 ADCY9 SBNO2 OSER1 LST1 ANKRD55 TFAM SIX5 MRPL20 ERRFI1 ACBD3 CCR5 CD200R1 ZNF300 C10orf105 FAM53B STARD10 SOCS1 NPIPB3 BIK
21 14 3 8 26 7 10 29 15 13 4 19 3 10 11 8 11 3 4 10 7 1 1 1 1 2 1 1 4 3 6 4 12 3 10 4 1 1 1 6 3 1 8 1 2 1 4 2 1 22 1 7 19 1 3 1 Many cTWAS genes are novel - selected tissues
“Novel” is defined as 1) not in the silver standard, and 2) not the gene nearest to a genome-wide significant GWAS peak
#barplot of number of cTWAS genes in each tissue
df_plot <- output[output$weight %in% selected_weights,,drop=F]
df_plot <- df_plot[order(-df_plot$n_ctwas),,drop=F]

df_plot$tissue <- sapply(df_plot$weight, function(x){paste(unlist(strsplit(x,"_")),collapse=" ")})


pdf(file = "output/IBD_novel_ctwas_genes.pdf", width = 2.75, height = 3)

par(mar=c(6.6, 3.6, 1.1, 0.6))

barplot(df_plot$n_ctwas, names.arg=df_plot$tissue, las=2, ylab="Number of cTWAS Genes", main="",
        cex.lab=0.7,
        cex.axis=0.7,
        cex.names=0.6,
        axis.lty=1)


results_table$novel <- !(results_table$nearest | results_table$known)
df_plot$n_novel <- sapply(df_plot$weight, function(x){sum(results_table[df[[x]]$ctwas,"novel"], na.rm=T)})

barplot(df_plot$n_novel, names.arg=df_plot$tissue, las=2, col="blue", add=T, xaxt='n', yaxt='n')

legend("topright",
       legend = c("Silver Standard or\nNearest to GWAS Peak", "Novel"),
       fill = c("grey", "blue"), cex=0.6)

dev.off()
png
2 Number of cTWAS Genes - all tissues
df_plot <- output
df_plot <- df_plot[order(df_plot$n_ctwas),,drop=F]

df_plot$tissue <- sapply(df_plot$weight, function(x){paste(unlist(strsplit(x,"_")),collapse=" ")})

pdf(file = "output/IBD_number_ctwas_genes.pdf", width = 7, height = 5)

par(mar=c(3.6, 8.6, 0.6, 1.6))

barplot(df_plot$n_ctwas, names.arg=df_plot$tissue, las=2, xlab="Number of cTWAS Genes", main="",
        cex.lab=0.8,
        cex.axis=0.8,
        cex.names=0.5,
        axis.lty=1,
        col=c("darkblue", "grey50"),
        horiz=T,
        las=1)

grid(nx = NULL,
     ny = NA,
     lty = 2, col = "grey", lwd = 1)

dev.off()
png
2 Summary table of results
selected_weights_whitespace <- sapply(selected_weights, function(x){paste(unlist(strsplit(x, "_")), collapse=" ")})

results_summary <- data.frame(genename=as.character(rownames(results_table)),
                              ensembl_gene_id=results_table$ensembl_gene_id,
                              gene_biotype=G_list$gene_biotype[sapply(results_table$ensembl_gene_id, match, table=G_list$ensembl_gene_id)],
                              chromosome=results_table$chromosome_name,
                              start_position=results_table$start_position,
                              max_pip_tissue=selected_weights_whitespace[apply(results_table[,selected_weights], 1, which.max)],
                              max_pip=apply(results_table[,selected_weights], 1, max, na.rm=T),
                              other_tissues_detected=apply(results_table[,selected_weights],1,function(x){paste(selected_weights_whitespace[which(x>0.8 & x!=max(x,na.rm=T))], collapse="; ")}),
                              nearby=results_table$nearby,
                              nearest=results_table$nearest,
                              distance=G_list$distance[sapply(results_table$ensembl_gene_id, match, table=G_list$ensembl_gene_id)],
                              known=results_table$known,
                              enriched_terms=results_table$enriched_terms)

results_summary <- results_summary[order(results_summary$chromosome, results_summary$start_position),]

write.csv(results_summary, file=paste0("results_summary_inflammatory_bowel_disease_nolnc_corrected.csv"))
GO enrichment for genes in selected tissues
#enrichment for cTWAS genes using enrichR
library(enrichR)

dbs <- c("GO_Biological_Process_2021")

GO_enrichment <- enrichr(selected_genes, dbs)
Uploading data to Enrichr... Done.
Querying GO_Biological_Process_2021... Done.
Parsing results... Done.for (db in dbs){
cat(paste0(db, "\n\n"))
enrich_results <- GO_enrichment[[db]]
enrich_results <- enrich_results[enrich_results$Adjusted.P.value<0.05,c("Term", "Overlap", "Adjusted.P.value", "Genes")]
print(enrich_results)
print(plotEnrich(GO_enrichment[[db]]))
}GO_Biological_Process_2021
Term Overlap Adjusted.P.value Genes
1 cellular response to cytokine stimulus (GO:0071345) 11/482 6.244859e-05 MUC1;SBNO2;SOCS1;CCL20;IL1R2;IFNGR2;STAT3;IRF8;CCR5;CRK;ZFP36L2
2 cytokine-mediated signaling pathway (GO:0019221) 10/621 2.985445e-03 MUC1;SOCS1;TNFSF15;CCL20;IL1R2;IFNGR2;STAT3;IRF8;CCR5;CRK
3 negative regulation of CD8-positive, alpha-beta T cell activation (GO:2001186) 2/6 3.000584e-02 SOCS1;HFE
4 elastic fiber assembly (GO:0048251) 2/8 3.830251e-02 EFEMP2;LTBP3
5 regulation of DNA-templated transcription in response to stress (GO:0043620) 2/9 3.830251e-02 MUC1;RGS14
6 negative regulation of receptor binding (GO:1900121) 2/10 3.830251e-02 ADAM15;HFE
7 regulation of receptor binding (GO:1900120) 2/10 3.830251e-02 ADAM15;HFE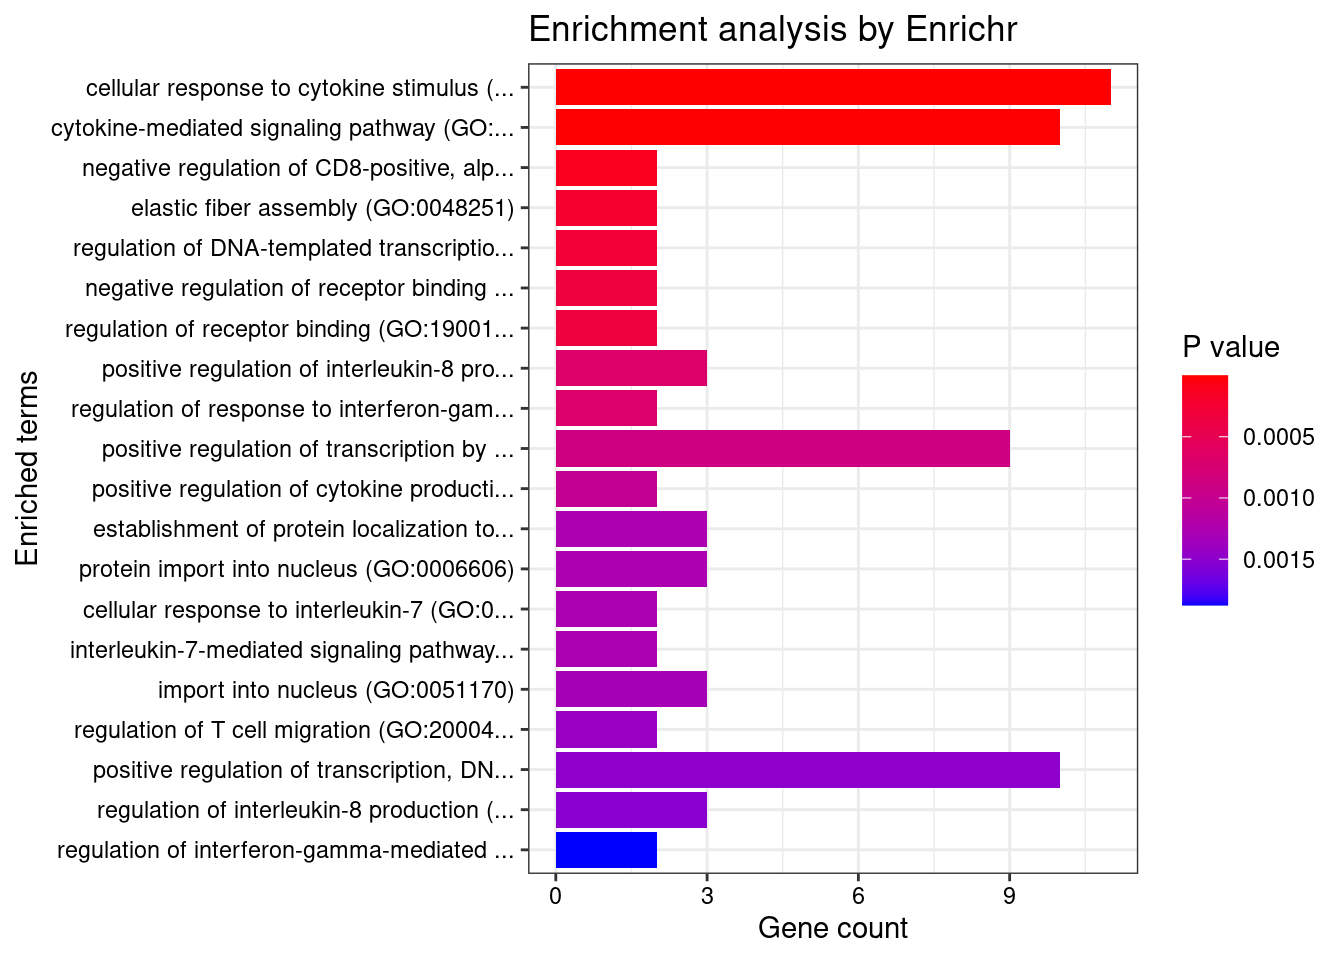
| Version | Author | Date |
|---|---|---|
| 220ba1d | wesleycrouse | 2022-09-09 |
Locus plots for HSPA6
locus_plot <- function(genename, tissue, plot_eqtl = T, label="cTWAS", xlim=NULL){
  results_dir <- results_dirs[grep(tissue, results_dirs)]
  weight <- rev(unlist(strsplit(results_dir, "/")))[1]
  analysis_id <- paste(trait_id, weight, sep="_")

  #load ctwas results
  ctwas_res <- data.table::fread(paste0(results_dir, "/", analysis_id, "_ctwas.susieIrss.txt"))

  #make unique identifier for regions and effects
  ctwas_res$region_tag <- paste(ctwas_res$region_tag1, ctwas_res$region_tag2, sep="_")
  ctwas_res$region_cs_tag <- paste(ctwas_res$region_tag, ctwas_res$cs_index, sep="_")

  #load z scores for SNPs
  load(paste0(results_dir, "/", analysis_id, "_expr_z_snp.Rd"))

  #separate gene and SNP results
  ctwas_gene_res <- ctwas_res[ctwas_res$type == "gene", ]
  ctwas_gene_res <- data.frame(ctwas_gene_res)
  ctwas_snp_res <- ctwas_res[ctwas_res$type == "SNP", ]
  ctwas_snp_res <- data.frame(ctwas_snp_res)

  #add gene information to results
  sqlite <- RSQLite::dbDriver("SQLite")
  db = RSQLite::dbConnect(sqlite, paste0("/project2/mstephens/wcrouse/predictdb_nolnc/mashr_", weight, ".db"))
  query <- function(...) RSQLite::dbGetQuery(db, ...)
  gene_info <- query("select gene, genename, gene_type from extra")
  RSQLite::dbDisconnect(db)

  ctwas_gene_res <- cbind(ctwas_gene_res, gene_info[sapply(ctwas_gene_res$id, match, gene_info$gene), c("genename", "gene_type")])

  #add z scores to results
  load(paste0(results_dir, "/", analysis_id, "_expr_z_gene.Rd"))
  ctwas_gene_res$z <- z_gene[ctwas_gene_res$id,]$z

  z_snp <- z_snp[z_snp$id %in% ctwas_snp_res$id,]
  ctwas_snp_res$z <- z_snp$z[match(ctwas_snp_res$id, z_snp$id)]

  #merge gene and snp results with added information
  ctwas_snp_res$genename=NA
  ctwas_snp_res$gene_type=NA

  ctwas_res <- rbind(ctwas_gene_res, ctwas_snp_res[,colnames(ctwas_gene_res)])

  region_tag <- ctwas_res$region_tag[which(ctwas_res$genename==genename)]

  region_tag1 <- unlist(strsplit(region_tag, "_"))[1]
  region_tag2 <- unlist(strsplit(region_tag, "_"))[2]

  a <- ctwas_res[ctwas_res$region_tag==region_tag,]

  rm(ctwas_res)

  regionlist <- readRDS(paste0(results_dir, "/", analysis_id, "_ctwas.regionlist.RDS"))
  region <- regionlist[[as.numeric(region_tag1)]][[region_tag2]]

  R_snp_info <- do.call(rbind, lapply(region$regRDS, function(x){data.table::fread(paste0(tools::file_path_sans_ext(x), ".Rvar"))}))

  a$pos[a$type=="gene"] <- G_list$start_position[match(sapply(a$id[a$type=="gene"], function(x){unlist(strsplit(x, "[.]"))[1]}) ,G_list$ensembl_gene_id)]
  a$pos <- a$pos/1000000

  if (!is.null(xlim)){
    if (is.na(xlim[1])){
      xlim[1] <- min(a$pos)
    }
    if (is.na(xlim[2])){
      xlim[2] <- max(a$pos)
    }
    a <- a[a$pos>=xlim[1] & a$pos<=xlim[2],,drop=F]
  }

  focus <- a$id[which(a$genename==genename)]
  a$iffocus <- as.numeric(a$id==focus)

  a$PVALUE <- (-log(2) - pnorm(abs(a$z), lower.tail=F, log.p=T))/log(10)

  R_gene <- readRDS(region$R_g_file)
  R_snp_gene <- readRDS(region$R_sg_file)
  R_snp <- as.matrix(Matrix::bdiag(lapply(region$regRDS, readRDS)))

  rownames(R_gene) <- region$gid
  colnames(R_gene) <- region$gid
  rownames(R_snp_gene) <- R_snp_info$id
  colnames(R_snp_gene) <- region$gid
  rownames(R_snp) <- R_snp_info$id
  colnames(R_snp) <- R_snp_info$id

  a$r2max <- NA

  a$r2max[a$type=="gene"] <- R_gene[focus,a$id[a$type=="gene"]]
  a$r2max[a$type=="SNP"] <- R_snp_gene[a$id[a$type=="SNP"],focus]

  r2cut <- 0.4
  colorsall <- c("#7fc97f", "#beaed4", "#fdc086")

  layout(matrix(1:2, ncol = 1), widths = 1, heights = c(1.5,1.5), respect = FALSE)
  par(mar = c(0, 4.1, 4.1, 2.1))

  plot(a$pos[a$type=="SNP"], a$PVALUE[a$type == "SNP"], pch = 21, xlab=paste0("Chromosome ", region_tag1, " position (Mb)"), frame.plot=FALSE, bg = colorsall[1], ylab = "-log10(p value)", panel.first = grid(), ylim =c(-(1/6)*max(a$PVALUE), max(a$PVALUE)*1.2), xaxt = 'n')

  points(a$pos[a$type=="SNP" & a$r2max > r2cut], a$PVALUE[a$type == "SNP"  & a$r2max > r2cut], pch = 21, bg = "purple")
  points(a$pos[a$type=="SNP" & a$iffocus == 1], a$PVALUE[a$type == "SNP" & a$iffocus == 1], pch = 21, bg = "salmon")
  points(a$pos[a$type=="gene"], a$PVALUE[a$type == "gene"], pch = 22, bg = colorsall[1], cex = 2)
  points(a$pos[a$type=="gene" & a$r2max > r2cut], a$PVALUE[a$type == "gene"  & a$r2max > r2cut], pch = 22, bg = "purple", cex = 2)
  points(a$pos[a$type=="gene" & a$iffocus == 1], a$PVALUE[a$type == "gene" & a$iffocus == 1], pch = 22, bg = "salmon", cex = 2)

  alpha=0.05
  abline(h=-log10(alpha/nrow(ctwas_gene_res)), col ="red", lty = 2)

  if (isTRUE(plot_eqtl)){
    for (cgene in a[a$type=="gene" & a$iffocus == 1, ]$id){
      load(paste0(results_dir, "/",analysis_id, "_expr_chr", region_tag1, ".exprqc.Rd"))
      eqtls <- rownames(wgtlist[[cgene]])
      points(a[a$id %in% eqtls,]$pos, rep( -(1/6)*max(a$PVALUE), nrow(a[a$id %in% eqtls,])), pch = "|", col = "salmon", cex = 1.5)
    }
  }

  if (label=="TWAS"){
    text(a$pos[a$id==focus], a$PVALUE[a$id==focus], labels=ctwas_gene_res$genename[ctwas_gene_res$id==focus], pos=3, cex=0.6)
  }

  par(mar = c(4.1, 4.1, 0.5, 2.1))

  plot(a$pos[a$type=="SNP"], a$PVALUE[a$type == "SNP"], pch = 19, xlab=paste0("Chromosome ", region_tag1, " position (Mb)"),frame.plot=FALSE, col = "white", ylim= c(0,1.1), ylab = "cTWAS PIP")

  grid()
  points(a$pos[a$type=="SNP"], a$susie_pip[a$type == "SNP"], pch = 21, xlab="Genomic position", bg = colorsall[1])
  points(a$pos[a$type=="SNP" & a$r2max > r2cut], a$susie_pip[a$type == "SNP"  & a$r2max >r2cut], pch = 21, bg = "purple")
  points(a$pos[a$type=="SNP" & a$iffocus == 1], a$susie_pip[a$type == "SNP" & a$iffocus == 1], pch = 21, bg = "salmon")
  points(a$pos[a$type=="gene"], a$susie_pip[a$type == "gene"], pch = 22, bg = colorsall[1], cex = 2)
  points(a$pos[a$type=="gene" & a$r2max > r2cut], a$susie_pip[a$type == "gene"  & a$r2max > r2cut], pch = 22, bg = "purple", cex = 2)
  points(a$pos[a$type=="gene" & a$iffocus == 1], a$susie_pip[a$type == "gene" & a$iffocus == 1], pch = 22, bg = "salmon", cex = 2)

  legend(max(a$pos)-0.2*(max(a$pos)-min(a$pos)), y= 1 ,c("Gene", "SNP","Lead TWAS Gene", "R2 > 0.4", "R2 <= 0.4"), pch = c(22,21,19,19,19), col = c("black", "black", "salmon", "purple", colorsall[1]), cex=0.7, title.adj = 0)

  if (label=="cTWAS"){
    text(a$pos[a$id==focus], a$susie_pip[a$id==focus], labels=ctwas_gene_res$genename[ctwas_gene_res$id==focus], pos=3, cex=0.6)
  }

  return(a)
}
genename <- "HSPA6"
tissue <- "Esophagus_Muscularis"
a <- locus_plot(genename, tissue, xlim=c(161.25, 161.75))
#ctwas results
head(a[order(-a$susie_pip), c("chrom", "pos", "id", "genename", "type", "susie_pip", "PVALUE") ], 10)
#nearest gene to GWAS peak
G_list[G_list$chromosome_name==unique(a$chrom) & G_list$start_position > min(a$pos*1000000) & G_list$end_position < max(a$pos*1000000),]
####################
#checking additional tissue
a <- locus_plot(genename, "Esophagus_Mucosa", xlim=c(161.25, 161.75))
#ctwas results
head(a[order(-a$susie_pip), c("chrom", "pos", "id", "genename", "type", "susie_pip", "PVALUE") ], 10)Locus plots for IRF8
genename <- "IRF8"
tissue <- names(which.max(results_table[genename,selected_weights]))

print(tissue)

a <- locus_plot(genename, tissue, xlim=c(85.75, 86.25))

#ctwas results
head(a[order(-a$susie_pip), c("chrom", "pos", "id", "genename", "type", "susie_pip", "PVALUE") ], 10)

#nearest gene to GWAS peak
G_list[G_list$chromosome_name==unique(a$chrom) & G_list$start_position > min(a$pos*1000000) & G_list$end_position < max(a$pos*1000000),]
Locus plots for CERKL
genename <- "CERKL"

tissue <- "Colon_Transverse"

print(tissue)

a <- locus_plot(genename, tissue, xlim=c(NA, 181.75))

#ctwas results
head(a[order(-a$susie_pip), c("chrom", "pos", "id", "genename", "type", "susie_pip", "PVALUE") ], 10)

#nearest gene to GWAS peak
G_list[G_list$chromosome_name==unique(a$chrom) & G_list$start_position > min(a$pos*1000000) & G_list$end_position < max(a$pos*1000000),]
Summary table of results - version 2
save.image("workspace3.RData")

results_summary <- data.frame(genename=as.character(rownames(results_table)),
                              ensembl_gene_id=results_table$ensembl_gene_id,
                              chromosome=results_table$chromosome_name,
                              start_position=results_table$start_position,
                              max_pip_tissue=selected_weights_whitespace[apply(results_table[,selected_weights], 1, which.max)],
                              max_pip_tissue_nospace=selected_weights[apply(results_table[,selected_weights], 1, which.max)],
                              max_pip=apply(results_table[,selected_weights], 1, max, na.rm=T),
                              other_tissues_detected=apply(results_table[,selected_weights],1,function(x){paste(selected_weights_whitespace[which(x>0.8 & x!=max(x,na.rm=T))], collapse="; ")}),
                              region_tag_tissue=NA,
                              z_tissue=NA,
                              num_eqtl_tissue=NA,
                              twas_fp_tissue=NA,
                              nearest_region_peak_tissue=NA,
                              distance_region_peak_tissue=NA,
                              which_nearest_region_peak_tissue=NA,
                              nearby=results_table$nearby,
                              nearest=results_table$nearest,
                              distance=results_table$distance,
                              which_nearest=results_table$which_nearest,
                              known=results_table$known,
                              stringsAsFactors=F)

for (i in 1:nrow(results_summary)){
  tissue <- results_summary$max_pip_tissue_nospace[i]
  gene <- results_summary$genename[i]
  gene_pips <- df[[tissue]]$gene_pips
  results_summary[i,c("region_tag_tissue", "z_tissue", "num_eqtl_tissue")] <- gene_pips[gene_pips$genename==gene,c("region_tag", "z", "num_eqtl")]
  region_tag <- results_summary$region_tag_tissue[i]
  results_summary$twas_fp_tissue[i] <- any(gene_pips$genename[gene_pips$region_tag==region_tag & gene_pips$genename!=gene] %in% df[[tissue]]$twas)


  region_pips <- df[[tissue]]$region_pips
  lead_snp <- region_pips$which_snp_maxz[region_pips$region==region_tag]

  chromosome <- results_summary$chromosome[i]
  lead_position <- z_snp$pos[z_snp$id==lead_snp]

  G_list_index <- which(G_list$chromosome_name==chromosome)

  distances <- sapply(G_list_index, function(i){
    if (lead_position >= G_list$start_position[i] & lead_position <= G_list$end_position[i]){
      distance <- 0
    } else {
      distance <- min(abs(G_list$start_position[i] - lead_position), abs(G_list$end_position[i] - lead_position))
    }
    distance
  })

  results_summary$which_nearest_region_peak_tissue[i] <- paste0(G_list$hgnc_symbol[G_list_index[which(distances==min(distances))]], collapse="; ")
  results_summary$distance_region_peak_tissue[i] <- distances[which(G_list_index==which(G_list$hgnc_symbol==gene))]
}

results_summary$nearest_region_peak_tissue <- sapply(1:nrow(results_summary), function(x){results_summary$genename[x] %in% unlist(strsplit(results_summary$which_nearest_region_peak_tissue[x], ";"))})

####################
#GO enrichment of cTWAS genes
# genes <- results_summary$genename
#
# dbs <- c("GO_Biological_Process_2021", "GO_Cellular_Component_2021", "GO_Molecular_Function_2021")
# GO_enrichment <- enrichr(genes, dbs)
#
# save(GO_enrichment, file=paste0(trait_id, "_enrichment_results.RData"))

####################
#enrichment of silver standard genes
# genes <- known_genes
#
# dbs <- c("GO_Biological_Process_2021", "GO_Cellular_Component_2021", "GO_Molecular_Function_2021")
# GO_enrichment_silver_standard <- enrichr(genes, dbs)
#
# save(GO_enrichment_silver_standard, file=paste0(trait_id, "_silver_standard_enrichment_results.RData"))


####################
#report GO cTWAS

load(paste0(trait_id, "_enrichment_results.RData"))

GO_enrichment <- do.call(rbind, GO_enrichment)
GO_enrichment$DB <- sapply(rownames(GO_enrichment), function(x){unlist(strsplit(x, split="[.]"))[1]})
rownames(GO_enrichment) <- NULL

GO_enrichment_out <- cbind(GO_enrichment[,c("Term", "DB"),drop=F],
                           GO_enrichment[,!(colnames(GO_enrichment) %in%
                                            c("Term", "DB", "Old.P.value", "Old.Adjusted.P.value")), drop=F])

write.csv(GO_enrichment_out, file="output/IBD_GO_ctwas.csv", row.names=F)

GO_enrichment <- GO_enrichment[GO_enrichment$Adjusted.P.value < 0.05,]
GO_enrichment <- GO_enrichment[order(-GO_enrichment$Odds.Ratio),]

results_summary$GO <- sapply(results_summary$genename, function(x){terms <- GO_enrichment$Term[grep(x, GO_enrichment$Genes)];
                                             if (length(terms)>0){terms <- terms[1:min(length(terms),5)]};
                                             paste0(terms, collapse="; ")})


####################
#report GO silver standard

load(paste0(trait_id, "_silver_standard_enrichment_results.RData"))

GO_enrichment_silver_standard <- do.call(rbind, GO_enrichment_silver_standard)
GO_enrichment_silver_standard$DB <- sapply(rownames(GO_enrichment_silver_standard), function(x){unlist(strsplit(x, split="[.]"))[1]})
rownames(GO_enrichment_silver_standard) <- NULL

GO_enrichment_silver_standard_out <- cbind(GO_enrichment_silver_standard[,c("Term", "DB"),drop=F],
                                                 GO_enrichment_silver_standard[,!(colnames(GO_enrichment_silver_standard) %in% c("Term", "DB", "Old.P.value", "Old.Adjusted.P.value")),drop=F])

write.csv(GO_enrichment_silver_standard_out, file="output/IBD_GO_silver.csv", row.names=F)

GO_enrichment_silver_standard <- GO_enrichment_silver_standard[GO_enrichment_silver_standard$Adjusted.P.value < 0.05,]
GO_enrichment_silver_standard <- GO_enrichment_silver_standard[order(-GO_enrichment_silver_standard$Odds.Ratio),]

#reload GO cTWAS for GO crosswalk
load(paste0(trait_id, "_enrichment_results.RData"))

GO_enrichment <- do.call(rbind, GO_enrichment)
GO_enrichment$DB <- sapply(rownames(GO_enrichment), function(x){unlist(strsplit(x, split="[.]"))[1]})
rownames(GO_enrichment) <- NULL

#overlap between sets
GO_enrichment <- GO_enrichment[GO_enrichment$Term %in% GO_enrichment_silver_standard$Term,,drop=F]
GO_enrichment_silver_standard <- GO_enrichment_silver_standard[GO_enrichment_silver_standard$Term %in% GO_enrichment$Term,,drop=F]
GO_enrichment <- GO_enrichment[match(GO_enrichment_silver_standard$Term, GO_enrichment$Term),]

results_summary$GO_silver <- sapply(results_summary$genename, function(x){terms <- GO_enrichment$Term[grep(x, GO_enrichment$Genes)];
                                                                          if (length(terms)>0){terms <- terms[1:min(length(terms),5)]};
                                                                          paste0(terms, collapse="; ")})

####################
#report FUMA

FUMA <- data.table::fread(paste0("/project2/xinhe/shengqian/cTWAS/cTWAS_analysis/data/FUMA_output/", trait_id, "/GS.txt"))
FUMA <- FUMA[FUMA$Category %in% c("GO_bp", "GO_cc", "GO_mf"),,drop=F]
FUMA <- FUMA[order(FUMA$p),]

FUMA <- FUMA[,-c("link")]
write.csv(FUMA, file="output/IBD_MAGMA.csv", row.names=F)

#reload GO cTWAS for GO crosswalk
load(paste0(trait_id, "_enrichment_results.RData"))
GO_enrichment <- do.call(rbind, GO_enrichment)
GO_enrichment$DB <- sapply(rownames(GO_enrichment), function(x){unlist(strsplit(x, split="[.]"))[1]})
rownames(GO_enrichment) <- NULL

GO_enrichment$Term_FUMA <- sapply(GO_enrichment$Term, function(x){rev(rev(unlist(strsplit(x, split=" [(]GO")))[-1])})
GO_enrichment$Term_FUMA <- paste0("GO_", toupper(gsub(" ", "_", GO_enrichment$Term_FUMA)))

#overlap between sets
GO_enrichment <- GO_enrichment[GO_enrichment$Term_FUMA %in% FUMA$GeneSet,,drop=F]
FUMA <- FUMA[FUMA$GeneSet %in% GO_enrichment$Term_FUMA]
GO_enrichment <- GO_enrichment[match(FUMA$GeneSet, GO_enrichment$Term_FUMA),]

results_summary$GO_MAGMA <- sapply(results_summary$genename, function(x){terms <- GO_enrichment$Term[grep(x, GO_enrichment$Genes)];
                                                                         if (length(terms)>0){terms <- terms[1:min(length(terms),5)]};
                                                                         paste0(terms, collapse="; ")})

####################
#report FUMA + susieGO

gsesusie <- as.data.frame(readxl::read_xlsx("gsesusie_enrichment.xlsx", sheet=trait_id))
gsesusie$GeneSet <- paste0("(", gsesusie$GeneSet, ")")

#reload GO cTWAS for GO crosswalk
load(paste0(trait_id, "_enrichment_results.RData"))
GO_enrichment <- do.call(rbind, GO_enrichment)
GO_enrichment$DB <- sapply(rownames(GO_enrichment), function(x){unlist(strsplit(x, split="[.]"))[1]})
rownames(GO_enrichment) <- NULL

GO_enrichment$GeneSet <- sapply(GO_enrichment$Term, function(x){rev(unlist(strsplit(x, " ")))[1]})

#overlap between sets
GO_enrichment <- GO_enrichment[GO_enrichment$GeneSet %in% gsesusie$GeneSet,,drop=F]
gsesusie <- gsesusie[gsesusie$GeneSet %in% GO_enrichment$GeneSet,,drop=F]
GO_enrichment <- GO_enrichment[match(gsesusie$GeneSet, GO_enrichment$GeneSet),]

results_summary$GO_MAGMA_SuSiE <- sapply(results_summary$genename, function(x){terms <- GO_enrichment$Term[grep(x, GO_enrichment$Genes)];
                                                                         if (length(terms)>0){terms <- terms[1:min(length(terms),5)]};
                                                                         paste0(terms, collapse="; ")})

results_summary <- results_summary[order(results_summary$chromosome, results_summary$start_position),]

results_summary <- results_summary[,!(colnames(results_summary) %in% c("max_pip_tissue_nospace"))]

write.csv(results_summary, file=paste0("results_summary_inflammatory_bowel_disease_nolnc_v2_corrected.csv"))

#number of genes in silver standard or at least one enriched term from GO silver standard
sum(results_summary$GO_silver!="" | results_summary$known)
[1] 33#number of genes in silver standard or at least one enriched term from GO silver standard or GO MAGMA
sum(results_summary$GO_silver!="" | results_summary$GO_MAGMA!="" | results_summary$known)[1] 34#number of genes in silver standard or at least one enriched term from GO silver standard or GO MAGMA or GO cTWAS
sum(results_summary$GO_silver!="" | results_summary$GO_MAGMA!="" | results_summary$known | results_summary$GO!="")[1] 34##########
results_summary_out <- dplyr::rename(results_summary, "nearest_region_peak"="nearest_region_peak_tissue")
results_summary_out <- dplyr::rename(results_summary_out, "which_nearest_region_peak"="which_nearest_region_peak_tissue")
results_summary_out <- dplyr::rename(results_summary_out, "distance_region_peak"="distance_region_peak_tissue")
results_summary_out <- dplyr::rename(results_summary_out, "GO_cTWAS"="GO")
results_summary_out <- results_summary_out[,!(colnames(results_summary_out) %in% c("GO_MAGMA_SuSiE", "twas_fp_tissue"))]
results_summary_out$which_nearest[!results_summary_out$nearby] <- ""
results_summary_out$distance[!results_summary_out$nearby] <- ""
write.csv(results_summary_out, file="output/IBD_detected_genes.csv", row.names=F)Summary table of results - Compact version
results_summary_compact <- results_summary[results_summary$max_pip>0.9,]

# results_summary_compact$evidence <- ""
# results_summary_compact$evidence[results_summary_compact$nearby & !results_summary_compact$nearest & !results_summary_compact$known] <- "Nearby"
# results_summary_compact$evidence[results_summary_compact$nearby & !results_summary_compact$nearest & results_summary_compact$known] <- "Nearby; Known"
# results_summary_compact$evidence[results_summary_compact$nearest & !results_summary_compact$known] <- "Nearest"
# results_summary_compact$evidence[results_summary_compact$nearest & results_summary_compact$known] <- "Nearest; Known"

results_summary_compact$evidence <- "Novel"
results_summary_compact$evidence[results_summary_compact$nearest & !results_summary_compact$known] <- "Nearest"
results_summary_compact$evidence[!results_summary_compact$nearest & results_summary_compact$known] <- "Known"
 results_summary_compact$evidence[results_summary_compact$nearest & results_summary_compact$known] <- "Nearest; Known"

results_summary_compact$position <- paste0("chr", results_summary_compact$chromosome, ":", results_summary_compact$start_position)

results_summary_compact$z_tissue <- round(results_summary_compact$z_tissue, 2)

results_summary_compact <- results_summary_compact[,c("genename", "position", "max_pip_tissue", "max_pip", "z_tissue", "other_tissues_detected", "evidence")]

rownames(results_summary_compact) <- NULL
colnames(results_summary_compact) <- c("Gene", "Position", "Max PIP Tissue", "Max PIP", "Z-score", "Other Tissues Detected", "Evidence")

write.csv(results_summary_compact, file=paste0("results_summary_inflammatory_bowel_disease_compact.csv"), row.names=F)
Novel Genes by Tissue Group
#barplot of number of cTWAS genes in each tissue
df_plot <- -sort(-sapply(groups[groups!="None"], function(x){length(df_group[[x]][["ctwas"]])}))

par(mar=c(10.1, 4.1, 4.1, 2.1))
barplot(df_plot, las=2, ylab="Number of cTWAS Genes", main="")

df_plot_novel <- rep(NA, length(df_plot))
names(df_plot_novel) <- names(df_plot)

for (i in 1:length(df_plot)){
  genename <- df_group[[names(df_plot)[i]]]$ctwas
  gene <- genename_mapping$gene[match(genename, genename_mapping$genename)]
  gene <- sapply(gene, function(x){unlist(strsplit(x, "[.]"))[1]})

  G_list_subset <- G_list[match(gene, G_list$ensembl_gene_id),]

  G_list_subset$known <- G_list_subset$hgnc_symbol %in% known_genes

  df_plot_novel[i] <- sum(!(G_list_subset$known | G_list_subset$nearest), na.rm=T)
}

barplot(df_plot_novel, las=2, col="blue", add=T, xaxt='n', yaxt='n')

legend("topright",
       legend = c("Silver Standard or\nNearest to GWAS Peak", "Novel"),
       fill = c("grey", "blue"))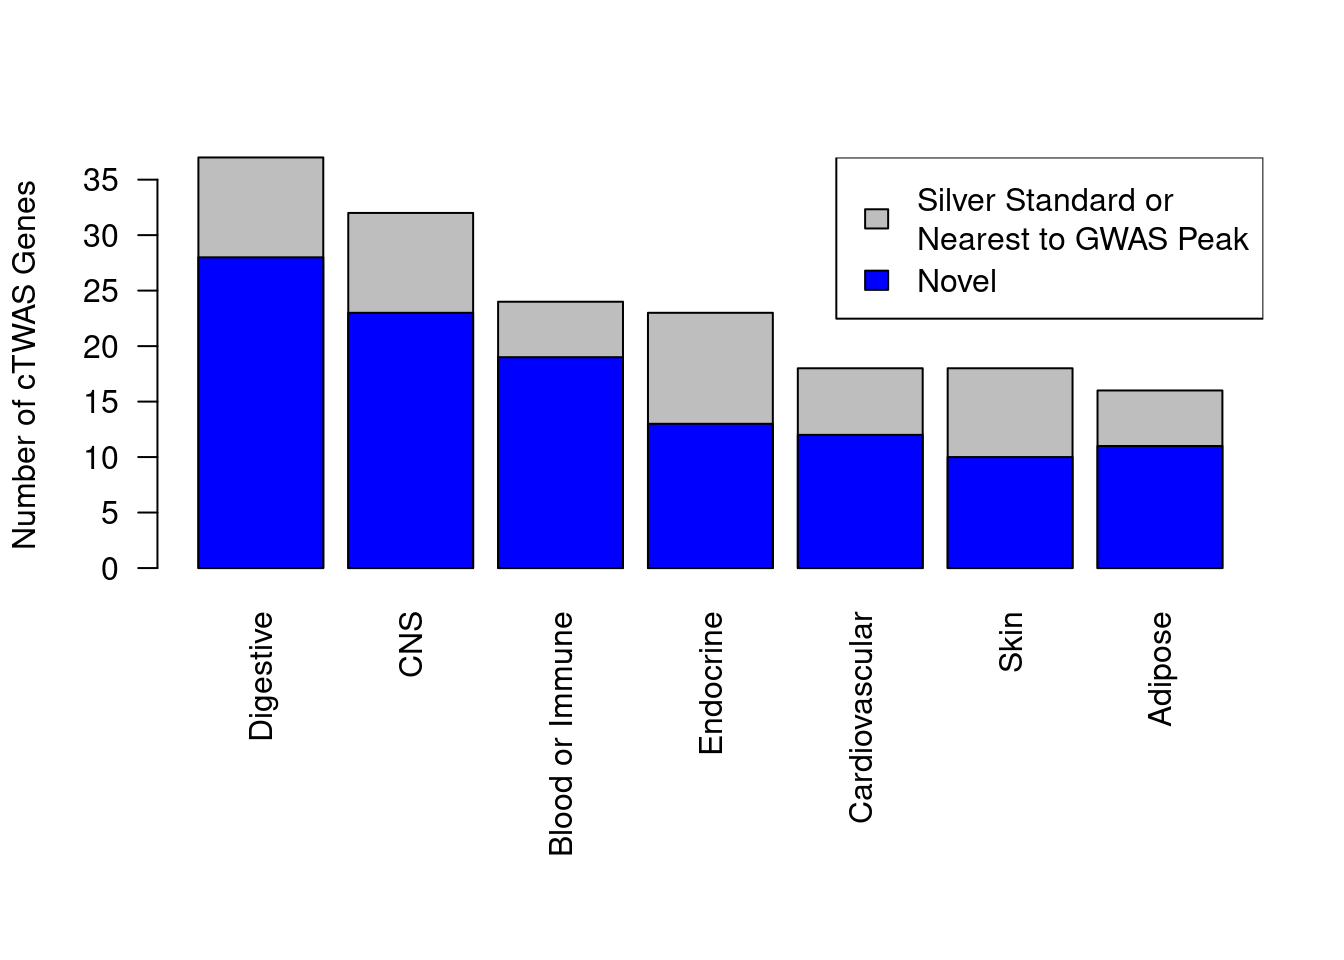
##########

#barplot of number of cTWAS genes in each tissue
df_plot <- -sort(-sapply(groups[groups!="None"], function(x){length(df_group[[x]][["ctwas"]])}))

df_plot_novel <- rep(NA, length(df_plot))
names(df_plot_novel) <- names(df_plot)

for (i in 1:length(df_plot)){
  genename <- df_group[[names(df_plot)[i]]]$ctwas
  gene <- genename_mapping$gene[match(genename, genename_mapping$genename)]
  gene <- sapply(gene, function(x){unlist(strsplit(x, "[.]"))[1]})

  G_list_subset <- G_list[match(gene, G_list$ensembl_gene_id),]

  G_list_subset$known <- G_list_subset$hgnc_symbol %in% known_genes

  df_plot_novel[i] <- sum(!(G_list_subset$known | G_list_subset$nearest), na.rm=T)
}

pdf(file = "output/IBD_novel_ctwas_genes_group.pdf", width = 2.75, height = 3)
par(mar=c(4.6, 3.6, 1.1, 0.6))

barplot(df_plot, las=2, col="blue", ylab="Number of cTWAS Genes", main="",
        cex.lab=0.8,
        cex.axis=0.8,
        cex.names=0.7,
        axis.lty=1)
barplot(df_plot-df_plot_novel, las=2, add=T, xaxt='n', yaxt='n')

legend("topright",
       legend = c("Silver Standard or\nNearest to GWAS Peak", "Novel"),
       fill = c("grey", "blue"), cex=0.5)

dev.off()
png
2 Updated locus plots
####################

load(paste0("G_list_", trait_id, ".RData"))
G_list <- G_list[G_list$gene_biotype %in% c("protein_coding"),]
G_list$hgnc_symbol[G_list$hgnc_symbol==""] <- "-"
G_list$tss <- G_list[,c("end_position", "start_position")][cbind(1:nrow(G_list),G_list$strand/2+1.5)]

####################

locus_plot_final <- function(genename=NULL, tissue=NULL, xlim=NULL, return_table=F, label_panel="TWAS", label_genes=NULL, label_pos=NULL, plot_eqtl=NULL, draw_gene_track=T, legend_side="right"){
  results_dir <- results_dirs[grep(tissue, results_dirs)]
  weight <- rev(unlist(strsplit(results_dir, "/")))[1]
  weight <- unlist(strsplit(weight, split="_nolnc"))
  analysis_id <- paste(trait_id, weight, sep="_")

  #load ctwas results
  ctwas_res <- data.table::fread(paste0(results_dir, "/", analysis_id, "_ctwas.susieIrss.txt"))

  #make unique identifier for regions and effects
  ctwas_res$region_tag <- paste(ctwas_res$region_tag1, ctwas_res$region_tag2, sep="_")
  ctwas_res$region_cs_tag <- paste(ctwas_res$region_tag, ctwas_res$cs_index, sep="_")

  #load z scores for SNPs
  load(paste0(results_dir, "/", analysis_id, "_expr_z_snp.Rd"))

  #separate gene and SNP results
  ctwas_gene_res <- ctwas_res[ctwas_res$type == "gene", ]
  ctwas_gene_res <- data.frame(ctwas_gene_res)
  ctwas_snp_res <- ctwas_res[ctwas_res$type == "SNP", ]
  ctwas_snp_res <- data.frame(ctwas_snp_res)

  #add gene information to results
  sqlite <- RSQLite::dbDriver("SQLite")
  db = RSQLite::dbConnect(sqlite, paste0("/project2/mstephens/wcrouse/predictdb_nolnc/mashr_", weight, "_nolnc.db"))
  query <- function(...) RSQLite::dbGetQuery(db, ...)
  gene_info <- query("select gene, genename, gene_type from extra")
  RSQLite::dbDisconnect(db)

  ctwas_gene_res <- cbind(ctwas_gene_res, gene_info[sapply(ctwas_gene_res$id, match, gene_info$gene), c("genename", "gene_type")])

  #add z scores to results
  load(paste0(results_dir, "/", analysis_id, "_expr_z_gene.Rd"))
  ctwas_gene_res$z <- z_gene[ctwas_gene_res$id,]$z

  z_snp <- z_snp[z_snp$id %in% ctwas_snp_res$id,]
  ctwas_snp_res$z <- z_snp$z[match(ctwas_snp_res$id, z_snp$id)]

  #merge gene and snp results with added information
  ctwas_snp_res$genename=NA
  ctwas_snp_res$gene_type=NA

  ctwas_res <- rbind(ctwas_gene_res, ctwas_snp_res[,colnames(ctwas_gene_res)])

  region_tag <- ctwas_res$region_tag[which(ctwas_res$genename==genename)]

  region_tag1 <- unlist(strsplit(region_tag, "_"))[1]
  region_tag2 <- unlist(strsplit(region_tag, "_"))[2]

  a <- ctwas_res[ctwas_res$region_tag==region_tag,]

  rm(ctwas_res)

  regionlist <- readRDS(paste0(results_dir, "/", analysis_id, "_ctwas.regionlist.RDS"))
  region <- regionlist[[as.numeric(region_tag1)]][[region_tag2]]

  R_snp_info <- do.call(rbind, lapply(region$regRDS, function(x){data.table::fread(paste0(tools::file_path_sans_ext(x), ".Rvar"))}))

  a_pos_bkup <- a$pos
  a$pos[a$type=="gene"] <- G_list$tss[match(sapply(a$id[a$type=="gene"], function(x){unlist(strsplit(x, "[.]"))[1]}) ,G_list$ensembl_gene_id)]
  a$pos[is.na(a$pos)] <- a_pos_bkup[is.na(a$pos)]
  a$pos <- a$pos/1000000

  if (!is.null(xlim)){

    if (is.na(xlim[1])){
      xlim[1] <- min(a$pos)
    }

    if (is.na(xlim[2])){
      xlim[2] <- max(a$pos)
    }

    a <- a[a$pos>=xlim[1] & a$pos<=xlim[2],,drop=F]
  }

  focus <- genename

  if (is.null(label_genes)){
    label_genes <- focus
  }

  if (is.null(label_pos)){
    label_pos <- rep(3, length(label_genes))
  }

  if (is.null(plot_eqtl)){
    plot_eqtl <- focus
  }

  focus <- a$id[which(a$genename==focus)]
  a$focus <- 0
  a$focus <- as.numeric(a$id==focus)

  a$PVALUE <- (-log(2) - pnorm(abs(a$z), lower.tail=F, log.p=T))/log(10)

  R_gene <- readRDS(region$R_g_file)
  R_snp_gene <- readRDS(region$R_sg_file)
  R_snp <- as.matrix(Matrix::bdiag(lapply(region$regRDS, readRDS)))

  rownames(R_gene) <- region$gid
  colnames(R_gene) <- region$gid
  rownames(R_snp_gene) <- R_snp_info$id
  colnames(R_snp_gene) <- region$gid
  rownames(R_snp) <- R_snp_info$id
  colnames(R_snp) <- R_snp_info$id

  a$r2max <- NA
  a$r2max[a$type=="gene"] <- R_gene[focus,a$id[a$type=="gene"]]
  a$r2max[a$type=="SNP"] <- R_snp_gene[a$id[a$type=="SNP"],focus]

  r2cut <- 0.4
  colorsall <- c("#7fc97f", "#beaed4", "#fdc086")

  start <- min(a$pos)
  end <- max(a$pos)

  if (draw_gene_track){
    layout(matrix(1:4, ncol = 1), widths = 1, heights = c(1.5,0.25,1.5,0.75), respect = FALSE)
  } else {
    layout(matrix(1:3, ncol = 1), widths = 1, heights = c(1.5,0.25,1.5), respect = FALSE)
  }

  par(mar = c(0, 4.1, 0, 2.1))

  plot(a$pos[a$type=="SNP"], a$PVALUE[a$type == "SNP"], pch = 21, xlab=paste0("Chromosome ", region_tag1, " position (Mb)"), frame.plot=FALSE, bg = colorsall[1], ylab = "-log10(p value)", panel.first = grid(), ylim =c(0, max(a$PVALUE)*1.1), xaxt = 'n', xlim=c(start, end))

  points(a$pos[a$type=="SNP" & a$r2max > r2cut], a$PVALUE[a$type == "SNP"  & a$r2max > r2cut], pch = 21, bg = "purple")
  points(a$pos[a$type=="SNP" & a$focus == 1], a$PVALUE[a$type == "SNP" & a$focus == 1], pch = 21, bg = "salmon")
  points(a$pos[a$type=="gene"], a$PVALUE[a$type == "gene"], pch = 22, bg = colorsall[1], cex = 2)
  points(a$pos[a$type=="gene" & a$r2max > r2cut], a$PVALUE[a$type == "gene"  & a$r2max > r2cut], pch = 22, bg = "purple", cex = 2)
  points(a$pos[a$type=="gene" & a$focus == 1], a$PVALUE[a$type == "gene" & a$focus == 1], pch = 22, bg = "salmon", cex = 2)

  alpha=0.05
  abline(h=-log10(alpha/nrow(ctwas_gene_res)), col ="red", lty = 2)

  if (label_panel=="TWAS"){
    for (i in 1:length(label_genes)){
      text(a$pos[a$genename==label_genes[i]], a$PVALUE[a$genename==label_genes[i]], labels=label_genes[i], pos=label_pos[i], cex=0.7)
    }
  }

  par(mar = c(0.25, 4.1, 0.25, 2.1))

  plot(NA, xlim = c(start, end), ylim = c(0, length(plot_eqtl)), frame.plot = F, axes = F, xlab = NA, ylab = NA)

  for (i in 1:length(plot_eqtl)){
    cgene <- a$id[which(a$genename==plot_eqtl[i])]
    load(paste0(results_dir, "/",analysis_id, "_expr_chr", region_tag1, ".exprqc.Rd"))
    eqtls <- rownames(wgtlist[[cgene]])
    eqtl_pos <- a$pos[a$id %in% eqtls]

    col="grey"

    rect(start, length(plot_eqtl)+1-i-0.8, end, length(plot_eqtl)+1-i-0.2, col = col, border = T, lwd = 1)

    if (length(eqtl_pos)>0){
      for (j in 1:length(eqtl_pos)){
        segments(x0=eqtl_pos[j], x1=eqtl_pos[j], y0=length(plot_eqtl)+1-i-0.2, length(plot_eqtl)+1-i-0.8, lwd=1.5)
      }
    }
  }

  text(start, length(plot_eqtl)-(1:length(plot_eqtl))+0.5,
       labels = plot_eqtl, srt = 0, pos = 2, xpd = TRUE, cex=0.7)

  par(mar = c(4.1, 4.1, 0, 2.1))

  plot(a$pos[a$type=="SNP"], a$PVALUE[a$type == "SNP"], pch = 19, xlab=paste0("Chromosome ", region_tag1, " position (Mb)"),frame.plot=FALSE, col = "white", ylim= c(0,1.1), ylab = "cTWAS PIP", xlim = c(start, end))

  grid()
  points(a$pos[a$type=="SNP"], a$susie_pip[a$type == "SNP"], pch = 21, xlab="Genomic position", bg = colorsall[1])
  points(a$pos[a$type=="SNP" & a$r2max > r2cut], a$susie_pip[a$type == "SNP"  & a$r2max >r2cut], pch = 21, bg = "purple")
  points(a$pos[a$type=="SNP" & a$focus == 1], a$susie_pip[a$type == "SNP" & a$focus == 1], pch = 21, bg = "salmon")
  points(a$pos[a$type=="gene"], a$susie_pip[a$type == "gene"], pch = 22, bg = colorsall[1], cex = 2)
  points(a$pos[a$type=="gene" & a$r2max > r2cut], a$susie_pip[a$type == "gene"  & a$r2max > r2cut], pch = 22, bg = "purple", cex = 2)
  points(a$pos[a$type=="gene" & a$focus == 1], a$susie_pip[a$type == "gene" & a$focus == 1], pch = 22, bg = "salmon", cex = 2)

  x_pos <- ifelse(legend_side=="right", max(a$pos)-0.2*(max(a$pos)-min(a$pos)), min(a$pos)+0.05*(max(a$pos)-min(a$pos)))

  legend(x_pos, y= 1 ,c("Gene", "SNP","Lead TWAS Gene", "R2 > 0.4", "R2 <= 0.4"), pch = c(22,21,19,19,19), col = c("black", "black", "salmon", "purple", colorsall[1]), cex=0.7, title.adj = 0)

  if (label_panel=="cTWAS"){
    for (i in 1:length(label_genes)){
      text(a$pos[a$genename==label_genes[i]], a$susie_pip[a$genename==label_genes[i]], labels=label_genes[i], pos=label_pos[i], cex=0.7)
    }
  }

  if (draw_gene_track){
    source("code/trackplot.R")

    query_ucsc = TRUE
    build = "hg38"
    col = "gray70"
    txname = NULL
    genename = NULL
    collapse_txs = TRUE
    gene_model = "data/hg38.ensGene.gtf.gz"
    isGTF = T

    ##########
    start <- min(a$pos)*1000000
    end <- max(a$pos)*1000000
    chr <- paste0("chr",as.character(unique(a$chrom)))

    #collect gene models
    if(is.null(gene_model)){
      if(query_ucsc){
        message("Missing gene model. Trying to query UCSC genome browser..")
        etbl = .extract_geneModel_ucsc(chr, start = start, end = end, refBuild = build, txname = txname, genename = genename)
      } else{
        etbl = NULL
      }
    } else{
      if(isGTF){
        etbl = .parse_gtf(gtf = gene_model, chr = chr, start = start, end = end, txname = txname, genename = genename)
      } else{
        etbl = .extract_geneModel(ucsc_tbl = gene_model, chr = chr, start = start, end = end, txname = txname, genename = genename)
      }
    }

    #draw gene models
    if(!is.null(etbl)){
      if(collapse_txs){
        etbl = .collapse_tx(etbl)
      }

      #subset to protein coding genes in ensembl and lincRNAs included in the analysis
      #etbl <- etbl[names(etbl) %in% G_list$ensembl_gene_id]
      etbl <- etbl[names(etbl) %in% c(G_list$ensembl_gene_id[G_list$gene_biotype=="protein_coding"], sapply(a$id[a$type=="gene"], function(x){unlist(strsplit(x, split="[.]"))[1]}))]

      for (i in 1:length(etbl)){
        ensembl_name <- attr(etbl[[i]], "gene")
        gene_name <- G_list$hgnc_symbol[match(ensembl_name, G_list$ensembl_gene_id)]
        if (gene_name=="" | is.na(gene_name)){
          gene_name <- a$genename[sapply(a$id, function(x){unlist(strsplit(x,split="[.]"))[1]})==ensembl_name]
        }
        if (length(gene_name)>0){
          attr(etbl[[i]], "gene") <- gene_name
        }

        attr(etbl[[i]], "imputed") <- ensembl_name %in% sapply(ctwas_gene_res$id, function(x){unlist(strsplit(x, split="[.]"))[1]})

      }

      par(mar = c(0, 4.1, 0, 2.1))

      plot(NA, xlim = c(start, end), ylim = c(0, length(etbl)), frame.plot = FALSE, axes = FALSE, xlab = NA, ylab = NA)

      etbl <- etbl[order(-sapply(etbl, function(x){attr(x, "start")}))]

      for(tx_id in 1:length(etbl)){
        txtbl = etbl[[tx_id]]

        if (attr(txtbl, "imputed")){
          exon_col = "#192a56"
        } else {
          exon_col = "darkred"
        }

        segments(x0 = attr(txtbl, "start"), y0 = tx_id-0.45, x1 = attr(txtbl, "end"), y1 = tx_id-0.45, col = exon_col, lwd = 1)

        if(is.na(attr(txtbl, "tx"))){
          text(x = start, y = tx_id-0.45, labels = paste0(attr(txtbl, "gene")), cex = 0.7, adj = 0, srt = 0, pos = 2, xpd = TRUE)
        } else {
          text(x = start, y = tx_id-0.45, labels = paste0(attr(txtbl, "tx"), " [", attr(txtbl, "gene"), "]"), cex = 0.7, adj = 0, srt = 0, pos = 2, xpd = TRUE)
        }

        rect(xleft = txtbl[[1]], ybottom = tx_id-0.75, xright = txtbl[[2]], ytop = tx_id-0.25, col = exon_col, border = NA)
        if(attr(txtbl, "strand") == "+"){
          dirat = pretty(x = c(min(txtbl[[1]]), max(txtbl[[2]])))
          dirat[1] = min(txtbl[[1]]) #Avoid drawing arrows outside gene length
          dirat[length(dirat)] = max(txtbl[[2]])
          points(x = dirat, y = rep(tx_id-0.45, length(dirat)), pch = ">", col = exon_col)
        }else{
          dirat = pretty(x = c(min(txtbl[[1]]), max(txtbl[[2]])))
          dirat[1] = min(txtbl[[1]]) #Avoid drawing arrows outside gene length
          dirat[length(dirat)] = max(txtbl[[2]])
          points(x = dirat, y = rep(tx_id-0.45, length(dirat)), pch = "<", col = exon_col)
        }
      }
    }
  }

  if (return_table){
    return(a)
  }
}
LSP1
a <- locus_plot_final(genename="LSP1", tissue="Esophagus_Muscularis", return_table=T)

a[a$type=="gene",]

a <- locus_plot_final(genename="LSP1", tissue="Esophagus_Muscularis", xlim=c(1.8,2), return_table=T,
                      label_genes = c("LSP1", "PRR33", "TNNT3"), label_panel = "cTWAS")

a[a$type=="gene",]
UBE2W
a <- locus_plot_final(genename="UBE2W", tissue="Colon_Transverse", return_table=T, legend_side="left")Parsing gtf file..Registered S3 method overwritten by 'R.oo':
method from
throw.default R.methodsS3Collapsing transcripts..Warning in `[.data.table`(tx_tbl[, `:=`(id, paste0(start, ":", end))], !duplicated(id), : Ignoring by= because j= is not supplied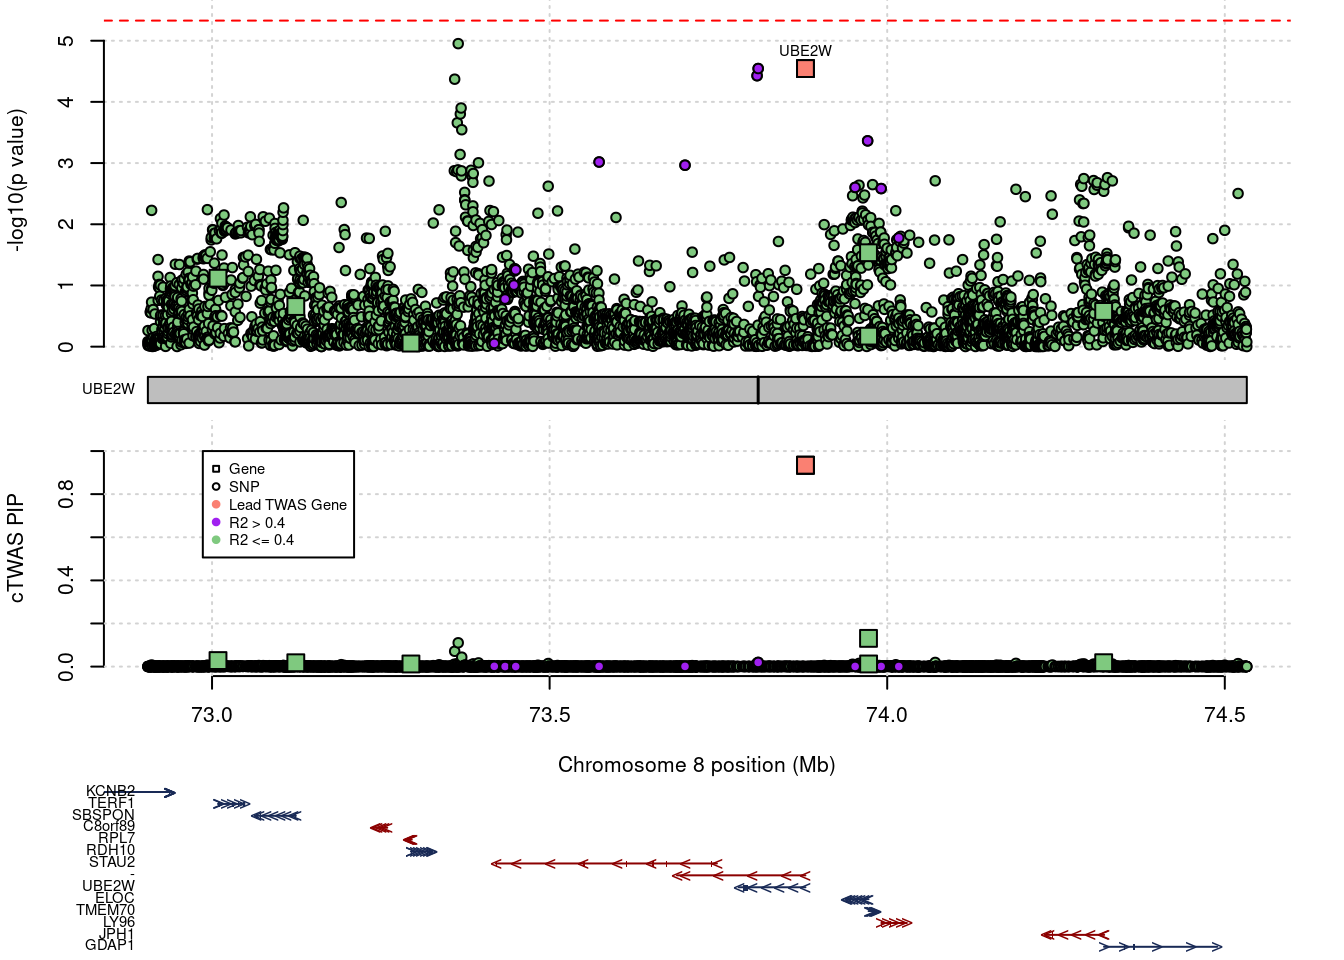
a[a$type=="gene",] chrom id pos type region_tag1 region_tag2 cs_index susie_pip mu2 region_tag region_cs_tag genename gene_type z focus PVALUE r2max
6475 8 ENSG00000147601.13 73.00886 gene 8 54 0 0.02807322 13.011187 8_54 8_54_0 TERF1 protein_coding 1.7741935 0 1.11900849 -0.023658043
8147 8 ENSG00000164764.10 73.12409 gene 8 54 0 0.01791246 8.797277 8_54 8_54_0 SBSPON protein_coding 1.2240000 0 0.65570162 -0.021281750
3743 8 ENSG00000121039.9 73.29460 gene 8 54 0 0.01215983 5.200293 8_54 8_54_0 RDH10 protein_coding 0.1578652 0 0.05820888 -0.026477930
2068 8 ENSG00000104343.19 73.87891 gene 8 54 1 0.93425774 22.319012 8_54 8_54_1 UBE2W protein_coding -4.1849593 1 4.54482438 1.000000000
7017 8 ENSG00000154582.16 73.97231 gene 8 54 0 0.13100078 24.289211 8_54 8_54_0 ELOC protein_coding -2.1812260 0 1.53511265 -0.239652272
9738 8 ENSG00000175606.10 73.97244 gene 8 54 0 0.01228499 5.351219 8_54 8_54_0 TMEM70 protein_coding 0.4222222 0 0.17207347 -0.049612461
2072 8 ENSG00000104381.12 74.32061 gene 8 54 0 0.01804684 8.775692 8_54 8_54_0 GDAP1 protein_coding 1.1129032 0 0.57552674 -0.003384426a <- locus_plot_final(genename="UBE2W", tissue="Colon_Transverse", return_table=T, legend_side="left", xlim=c(73.3,74.1),
label_genes = c("UBE2W", "ELOC", "TMEM70"), label_panel = "cTWAS")Parsing gtf file..
Collapsing transcripts..Warning in `[.data.table`(tx_tbl[, `:=`(id, paste0(start, ":", end))], !duplicated(id), : Ignoring by= because j= is not supplied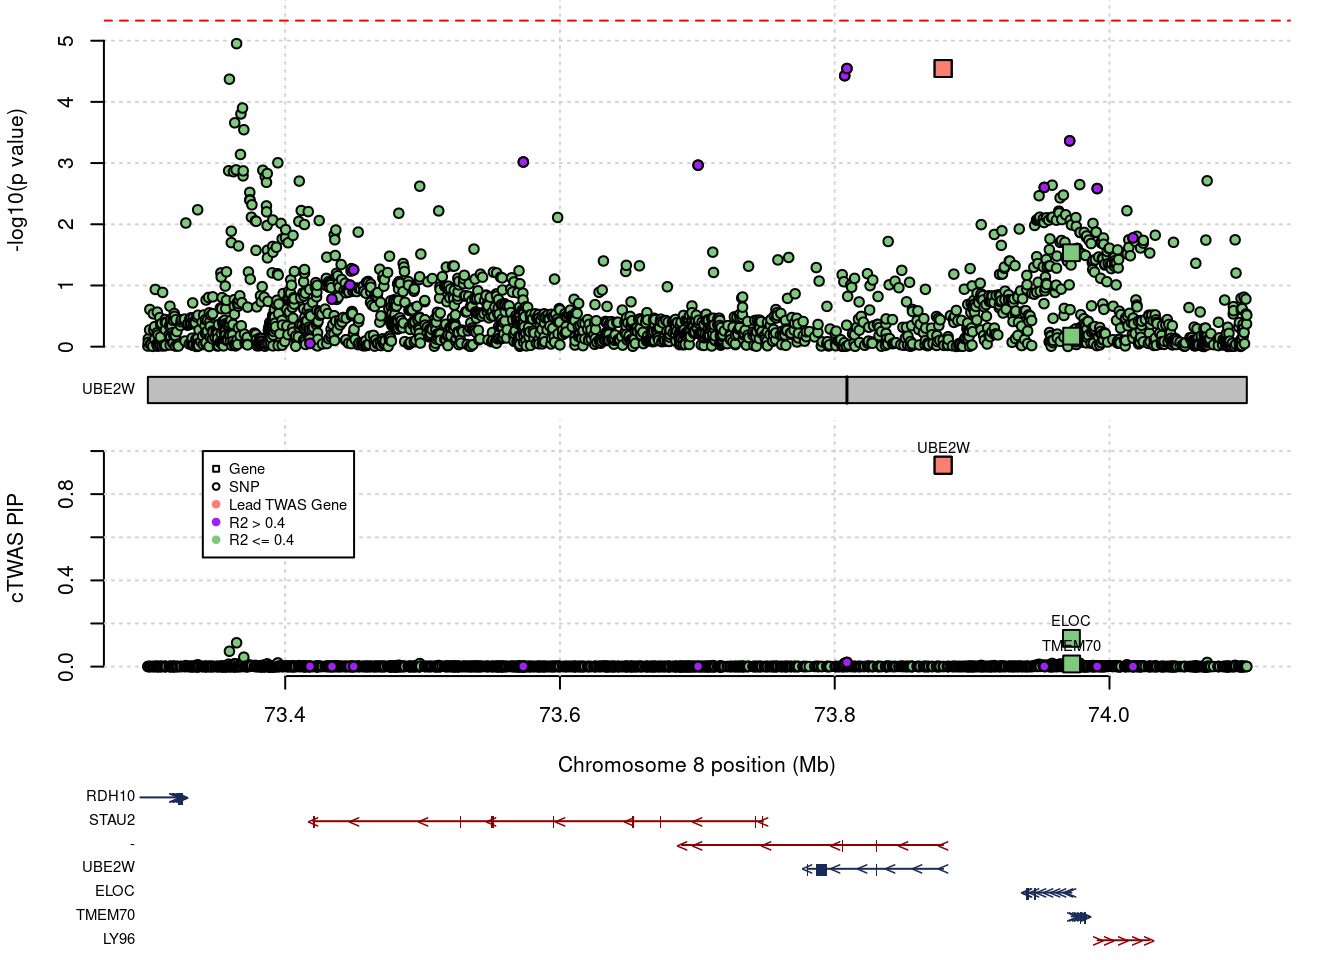
a[a$type=="gene",] chrom id pos type region_tag1 region_tag2 cs_index susie_pip mu2 region_tag region_cs_tag genename gene_type z focus PVALUE r2max
2068 8 ENSG00000104343.19 73.87891 gene 8 54 1 0.93425774 22.319012 8_54 8_54_1 UBE2W protein_coding -4.1849593 1 4.5448244 1.00000000
7017 8 ENSG00000154582.16 73.97231 gene 8 54 0 0.13100078 24.289211 8_54 8_54_0 ELOC protein_coding -2.1812260 0 1.5351127 -0.23965227
9738 8 ENSG00000175606.10 73.97244 gene 8 54 0 0.01228499 5.351219 8_54 8_54_0 TMEM70 protein_coding 0.4222222 0 0.1720735 -0.04961246TYMP
a <- locus_plot_final(genename="TYMP", tissue="Esophagus_Mucosa", return_table=T, legend_side="left")

a[a$type=="gene",]

a <- locus_plot_final(genename="TYMP", tissue="Esophagus_Mucosa", return_table=T, legend_side="left", xlim=c(50.45, 50.6),
                      label_genes = c("SBF1","LMF2","NCAPH2","SCO2","TYMP","ODF3B","CPT1B","MIOX"), label_panel = "cTWAS")

a[a$type=="gene",]
CCR5
a <- locus_plot_final(genename="CCR5", tissue="Whole_Blood", return_table=T, legend_side="left")

a[a$type=="gene",]

a <- locus_plot_final(genename="CCR5", tissue="Whole_Blood", return_table=T, legend_side="left", xlim=c(46.1, 46.5),
                      label_genes=c("CCR3","CCR1","CCR2","CCR5"), label_panel="cTWAS")

a[a$type=="gene",]
GO Visualization
df <- data.table::fread("data/webgestalt_IBD.txt")

####################
#heatmap

# heatmap_mat <- matrix(0, nrow=length(unique(df$`Gene Symbol`)), ncol=length(unique(df$Term)))
# rownames(heatmap_mat) <- unique(df$`Gene Symbol`)
# colnames(heatmap_mat) <- unique(df$Term)
#
# for (i in 1:ncol(heatmap_mat)){
#   for (j in 1:nrow(heatmap_mat)){
#     if (rownames(heatmap_mat)[j] %in% df$`Gene Symbol`[df$Term==colnames(heatmap_mat)[i]]){
#       heatmap_mat[j,i] <- 1
#     }
#   }
# }
#
# heatmap_mat <- heatmap_mat[,rev(order(-colSums(heatmap_mat)))]
# heatmap_mat <- heatmap_mat[rev(order(rownames(heatmap_mat))),]
#
# heatmap_mat_col_labels <- colnames(heatmap_mat)
# heatmap_mat_row_labels <- rownames(heatmap_mat)
#
# #color_palette <- gray(0:1)
# color_palette <- c("white", "green")
#
# image(t(heatmap_mat), axes=F, col=color_palette )
# mtext(text=heatmap_mat_col_labels, side=3, line=0.3, at=seq(0,1,1/(ncol(heatmap_mat)-1)), las=2, cex=0.6)
# mtext(text=heatmap_mat_row_labels, side=2, line=0.3, at=seq(0,1,1/(nrow(heatmap_mat)-1)), las=1, cex=0.6)
# grid(ncol(heatmap_mat),nrow(heatmap_mat))
# box(col = "black")

####################
#venn diagram

library(VennDiagram)
Loading required package: gridLoading required package: futile.loggerterm_gene_list <- sapply(unique(df$Term), function(x){df$`User ID`[df$Term==x]})
names(term_gene_list) <- c("Cytokine\nProduction",
"Defense\nResponse",
"Immune\nResponse",
"Positive Regulation of\nProtein Modification Process")
v0 <- venn.diagram( term_gene_list, filename=NULL, disable.logging=T,
fill = c("red", "blue", "green", "yellow"),
alpha = 0.50,
col = "transparent",
cex=0.6)
grid.newpage()
grid.draw(v0)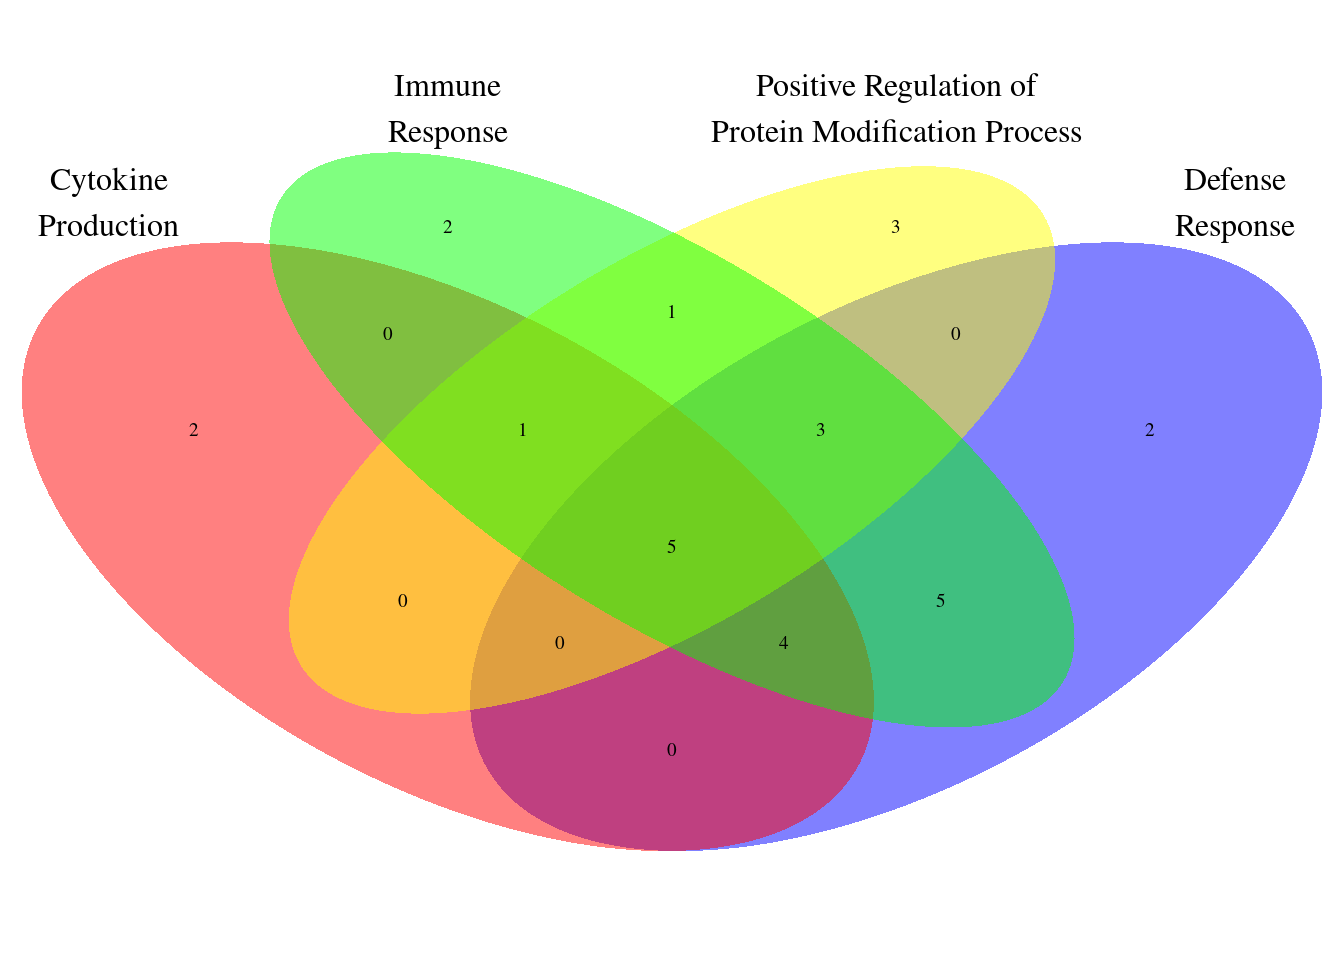
| Version | Author | Date |
|---|---|---|
| 220ba1d | wesleycrouse | 2022-09-09 |
overlaps <- calculate.overlap(term_gene_list)

# extract indexes of overlaps from list names
indx <- as.numeric(sapply(names(overlaps),function(x){unlist(strsplit(x, "a"))[2]}))

# labels start at position 7 in the list for Venn's with 3 circles
for (i in 1:length(overlaps)){
  v0[[8 + indx[i]]]$label <- paste(overlaps[[i]], collapse = "\n")
}

pdf(file = "output/IBD_GO_Venn.pdf", width = 4.5, height = 3)

grid.newpage()
grid.draw(v0)

dev.off()
png
2 save.image("workspace2.RData")
####################
#venn diagram - revised GO terms
df <- data.table::fread("data/webgestalt_FDR05_IBD.txt")
library(VennDiagram)
term_gene_list <- sapply(unique(df$Term), function(x){df$`User ID`[df$Term==x]})
names(term_gene_list) <- c("Cytokine Production",
"Defense\nResponse",
"Regulation of\nImmune System Process",
"Immune\nResponse",
"Positive Regulation of\nProtein Modification Process")
v0 <- venn.diagram( term_gene_list, filename=NULL, disable.logging=T,
fill = c("red", "blue", "green", "yellow", "purple"),
alpha = 0.50,
col = "transparent",
cex=0.6)
grid.newpage()
grid.draw(v0)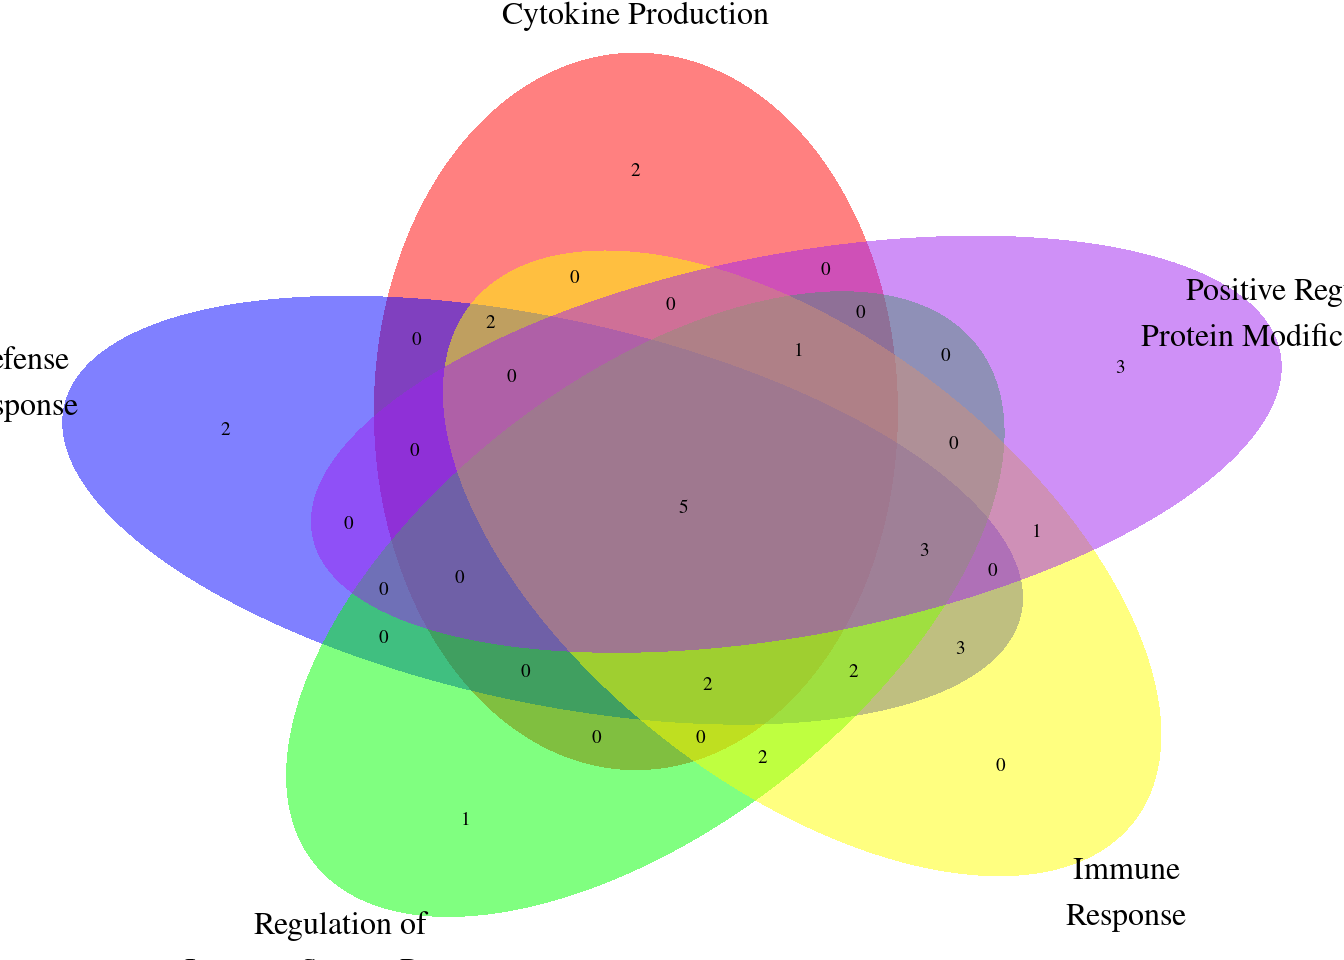
| Version | Author | Date |
|---|---|---|
| 3349d12 | wesleycrouse | 2022-09-16 |
overlaps <- calculate.overlap(term_gene_list)

# extract indexes of overlaps from list names
indx <- as.numeric(sapply(names(overlaps),function(x){unlist(strsplit(x, "a"))[2]}))

# labels start at position 7 in the list for Venn's with 3 circles
for (i in 1:length(overlaps)){
  v0[[10 + indx[i]]]$label <- paste(overlaps[[i]], collapse = "\n")
}

pdf(file = "output/IBD_GO_Venn_v2.pdf", width = 4.5, height = 3)

grid.newpage()
grid.draw(v0)

dev.off()
png
2 ####################
df <- data.table::fread("data/webgestalt_FDR05_IBD.txt")
term_gene_list <- sapply(unique(df$Term), function(x){df$`User ID`[df$Term==x]})
#drop immune response
term_gene_list <- term_gene_list[!(names(term_gene_list) %in% c("immune response"))]
names(term_gene_list) <- c("Cytokine\nProduction",
"Defense\nResponse",
"Regulation of\nImmune System Process",
"Positive Regulation of\nProtein Modification Process")
v0 <- venn.diagram( term_gene_list, filename=NULL, disable.logging=T,
fill = c("red", "blue", "green", "yellow"),
alpha = 0.50,
col = "transparent",
cex=0.6)
grid.newpage()
grid.draw(v0)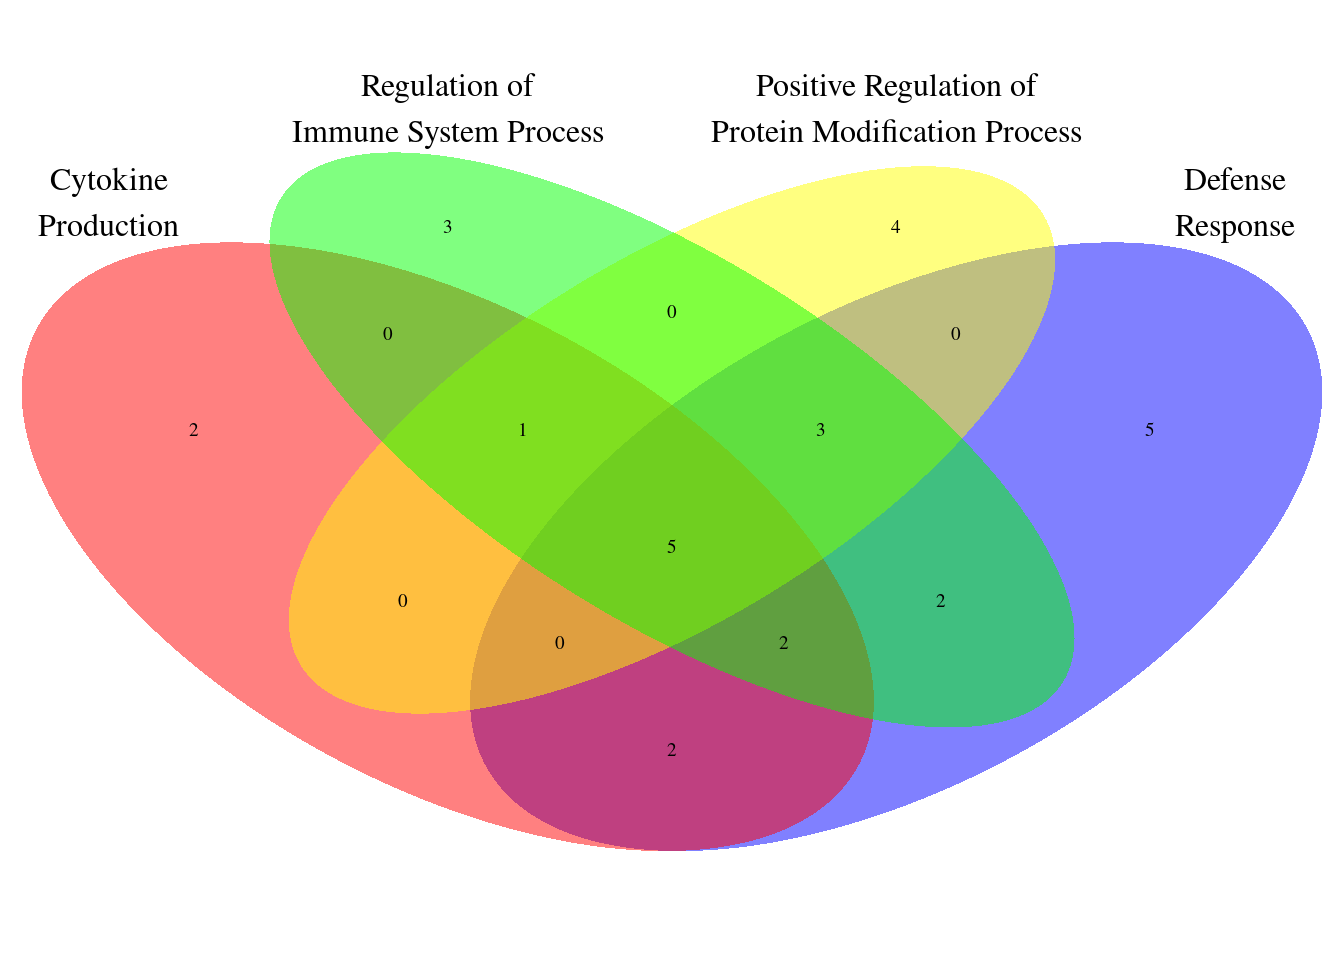
| Version | Author | Date |
|---|---|---|
| 3349d12 | wesleycrouse | 2022-09-16 |
overlaps <- calculate.overlap(term_gene_list)

# extract indexes of overlaps from list names
indx <- as.numeric(sapply(names(overlaps),function(x){unlist(strsplit(x, "a"))[2]}))

# labels start at position 7 in the list for Venn's with 3 circles
for (i in 1:length(overlaps)){
  v0[[8 + indx[i]]]$label <- paste(overlaps[[i]], collapse = "\n")
}

pdf(file = "output/IBD_GO_Venn_v3.pdf", width = 4.5, height = 3)

grid.newpage()
grid.draw(v0)

dev.off()
png
2 ####################
#output full WebGestalt results
webgestalt_full <- as.data.frame(data.table::fread("data/IBD_webgestalt_FDR05/enrichment_results_wg_result1662780405.txt"))
webgestalt_full <- webgestalt_full[,colnames(webgestalt_full)[!(colnames(webgestalt_full) %in% c("link", "overlapId"))]]
webgestalt_full <- dplyr::rename(webgestalt_full, "Genes"="userId")
write.csv(webgestalt_full, file="output/IBD_GO_webgestalt.csv", row.names=F)Updated locus plots - for paper
####################

load(paste0("G_list_", trait_id, ".RData"))
G_list <- G_list[G_list$gene_biotype %in% c("protein_coding"),]
G_list$hgnc_symbol[G_list$hgnc_symbol==""] <- "-"
G_list$tss <- G_list[,c("end_position", "start_position")][cbind(1:nrow(G_list),G_list$strand/2+1.5)]

####################

locus_plot_final_pub <- function(genename=NULL, tissue=NULL, xlim=NULL, return_table=F, label_panel="TWAS", label_genes=NULL, label_pos=NULL, plot_eqtl=NULL, draw_gene_track=T, legend_side="right", legend_panel="cTWAS", twas_ymax=NULL){
  results_dir <- results_dirs[grep(tissue, results_dirs)]
  weight <- rev(unlist(strsplit(results_dir, "/")))[1]
  weight <- unlist(strsplit(weight, split="_nolnc"))
  analysis_id <- paste(trait_id, weight, sep="_")

  #load ctwas results
  ctwas_res <- data.table::fread(paste0(results_dir, "/", analysis_id, "_ctwas.susieIrss.txt"))

  #make unique identifier for regions and effects
  ctwas_res$region_tag <- paste(ctwas_res$region_tag1, ctwas_res$region_tag2, sep="_")
  ctwas_res$region_cs_tag <- paste(ctwas_res$region_tag, ctwas_res$cs_index, sep="_")

  #load z scores for SNPs
  load(paste0(results_dir, "/", analysis_id, "_expr_z_snp.Rd"))

  #separate gene and SNP results
  ctwas_gene_res <- ctwas_res[ctwas_res$type == "gene", ]
  ctwas_gene_res <- data.frame(ctwas_gene_res)
  ctwas_snp_res <- ctwas_res[ctwas_res$type == "SNP", ]
  ctwas_snp_res <- data.frame(ctwas_snp_res)

  #add gene information to results
  sqlite <- RSQLite::dbDriver("SQLite")
  db = RSQLite::dbConnect(sqlite, paste0("/project2/mstephens/wcrouse/predictdb_nolnc/mashr_", weight, "_nolnc.db"))
  query <- function(...) RSQLite::dbGetQuery(db, ...)
  gene_info <- query("select gene, genename, gene_type from extra")
  RSQLite::dbDisconnect(db)

  ctwas_gene_res <- cbind(ctwas_gene_res, gene_info[sapply(ctwas_gene_res$id, match, gene_info$gene), c("genename", "gene_type")])

  #add z scores to results
  load(paste0(results_dir, "/", analysis_id, "_expr_z_gene.Rd"))
  ctwas_gene_res$z <- z_gene[ctwas_gene_res$id,]$z

  z_snp <- z_snp[z_snp$id %in% ctwas_snp_res$id,]
  ctwas_snp_res$z <- z_snp$z[match(ctwas_snp_res$id, z_snp$id)]

  #merge gene and snp results with added information
  ctwas_snp_res$genename=NA
  ctwas_snp_res$gene_type=NA

  ctwas_res <- rbind(ctwas_gene_res, ctwas_snp_res[,colnames(ctwas_gene_res)])

  region_tag <- ctwas_res$region_tag[which(ctwas_res$genename==genename)]

  region_tag1 <- unlist(strsplit(region_tag, "_"))[1]
  region_tag2 <- unlist(strsplit(region_tag, "_"))[2]

  a <- ctwas_res[ctwas_res$region_tag==region_tag,]

  regionlist <- readRDS(paste0(results_dir, "/", analysis_id, "_ctwas.regionlist.RDS"))
  region <- regionlist[[as.numeric(region_tag1)]][[region_tag2]]

  R_snp_info <- do.call(rbind, lapply(region$regRDS, function(x){data.table::fread(paste0(tools::file_path_sans_ext(x), ".Rvar"))}))

  a_pos_bkup <- a$pos
  a$pos[a$type=="gene"] <- G_list$tss[match(sapply(a$id[a$type=="gene"], function(x){unlist(strsplit(x, "[.]"))[1]}) ,G_list$ensembl_gene_id)]
  a$pos[is.na(a$pos)] <- a_pos_bkup[is.na(a$pos)]
  a$pos <- a$pos/1000000

 if (!is.null(xlim)){

    if (is.na(xlim[1])){
      xlim[1] <- min(a$pos)
    }

    if (is.na(xlim[2])){
      xlim[2] <- max(a$pos)
    }

    a <- a[a$pos>=xlim[1] & a$pos<=xlim[2],,drop=F]
  }

  focus <- genename

  if (is.null(label_genes)){
    label_genes <- focus
  }

  if (is.null(label_pos)){
    label_pos <- rep(3, length(label_genes))
  }

  if (is.null(plot_eqtl)){
    plot_eqtl <- focus
  }

  focus <- a$id[which(a$genename==focus)]
  a$focus <- 0
  a$focus <- as.numeric(a$id==focus)

  a$PVALUE <- (-log(2) - pnorm(abs(a$z), lower.tail=F, log.p=T))/log(10)

  R_gene <- readRDS(region$R_g_file)
  R_snp_gene <- readRDS(region$R_sg_file)
  R_snp <- as.matrix(Matrix::bdiag(lapply(region$regRDS, readRDS)))

  rownames(R_gene) <- region$gid
  colnames(R_gene) <- region$gid
  rownames(R_snp_gene) <- R_snp_info$id
  colnames(R_snp_gene) <- region$gid
  rownames(R_snp) <- R_snp_info$id
  colnames(R_snp) <- R_snp_info$id

  a$r2max <- NA
  a$r2max[a$type=="gene"] <- R_gene[focus,a$id[a$type=="gene"]]
  a$r2max[a$type=="SNP"] <- R_snp_gene[a$id[a$type=="SNP"],focus]

  r2cut <- 0.4
  colorsall <- c("#7fc97f", "#beaed4", "#fdc086")

  start <- min(a$pos)
  end <- max(a$pos)

  layout(matrix(1:4, ncol = 1), widths = 1, heights = c(1.5,0.25,1.75,0.75), respect = FALSE)

  par(mar = c(0, 4.1, 0, 2.1))

  if (is.null(twas_ymax)){
    twas_ymax <- max(a$PVALUE)*1.1
  }

  plot(a$pos[a$type=="SNP"], a$PVALUE[a$type == "SNP"], pch = 21, xlab=paste0("Chromosome ", region_tag1, " position (Mb)"), frame.plot=FALSE, bg = colorsall[1], ylab = "-log10(p value)", panel.first = grid(), ylim =c(0, twas_ymax), xaxt = 'n', xlim=c(start, end))

  alpha=0.05
  abline(h=-log10(alpha/nrow(ctwas_gene_res)), col ="red", lty = 2)

  points(a$pos[a$type=="SNP" & a$r2max > r2cut], a$PVALUE[a$type == "SNP"  & a$r2max > r2cut], pch = 21, bg = "purple")
  points(a$pos[a$type=="SNP" & a$focus == 1], a$PVALUE[a$type == "SNP" & a$focus == 1], pch = 21, bg = "salmon")
  points(a$pos[a$type=="gene"], a$PVALUE[a$type == "gene"], pch = 22, bg = colorsall[1], cex = 2)
  points(a$pos[a$type=="gene" & a$r2max > r2cut], a$PVALUE[a$type == "gene"  & a$r2max > r2cut], pch = 22, bg = "purple", cex = 2)
  points(a$pos[a$type=="gene" & a$focus == 1], a$PVALUE[a$type == "gene" & a$focus == 1], pch = 22, bg = "salmon", cex = 2)

  if (legend_panel=="TWAS"){
    x_pos <- ifelse(legend_side=="right", max(a$pos)-0.2*(max(a$pos)-min(a$pos)), min(a$pos))
    legend(x_pos, y= twas_ymax*0.95, c("Gene", "SNP","Lead TWAS Gene", "R2 > 0.4", "R2 <= 0.4"), pch = c(22,21,19,19,19), col = c("black", "black", "salmon", "purple", colorsall[1]), cex=0.7, title.adj = 0)
  }

  if (label_panel=="TWAS" | label_panel=="both"){
    for (i in 1:length(label_genes)){
      text(a$pos[a$genename==label_genes[i]], a$PVALUE[a$genename==label_genes[i]], labels=label_genes[i], pos=label_pos[i], cex=0.7)
    }
  }

  par(mar = c(0.25, 4.1, 0.25, 2.1))

  plot(NA, xlim = c(start, end), ylim = c(0, length(plot_eqtl)), frame.plot = F, axes = F, xlab = NA, ylab = NA)

  for (i in 1:length(plot_eqtl)){
    cgene <- a$id[which(a$genename==plot_eqtl[i])]
    load(paste0(results_dir, "/",analysis_id, "_expr_chr", region_tag1, ".exprqc.Rd"))
    eqtls <- rownames(wgtlist[[cgene]])
    eqtl_pos <- a$pos[a$id %in% eqtls]

    #col="grey"
    col="#c6e8f0"

    rect(start, length(plot_eqtl)+1-i-0.8, end, length(plot_eqtl)+1-i-0.2, col = col, border = T, lwd = 1)

    if (length(eqtl_pos)>0){
      for (j in 1:length(eqtl_pos)){
        segments(x0=eqtl_pos[j], x1=eqtl_pos[j], y0=length(plot_eqtl)+1-i-0.2, length(plot_eqtl)+1-i-0.8, lwd=1.5)
      }
    }
  }

  text(start, length(plot_eqtl)-(1:length(plot_eqtl))+0.5,
       labels = paste0(plot_eqtl, " eQTL"), srt = 0, pos = 2, xpd = TRUE, cex=0.7)

  par(mar = c(4.1, 4.1, 0, 2.1))

  plot(a$pos[a$type=="SNP"], a$susie_pip[a$type == "SNP"], pch = 19, xlab=paste0("Chromosome ", region_tag1, " position (Mb)"),frame.plot=FALSE, col = "white", ylim= c(0,1.1), ylab = "cTWAS PIP", xlim = c(start, end))

  grid()
  points(a$pos[a$type=="SNP"], a$susie_pip[a$type == "SNP"], pch = 21, xlab="Genomic position", bg = colorsall[1])
  points(a$pos[a$type=="SNP" & a$r2max > r2cut], a$susie_pip[a$type == "SNP"  & a$r2max >r2cut], pch = 21, bg = "purple")
  points(a$pos[a$type=="SNP" & a$focus == 1], a$susie_pip[a$type == "SNP" & a$focus == 1], pch = 21, bg = "salmon")
  points(a$pos[a$type=="gene"], a$susie_pip[a$type == "gene"], pch = 22, bg = colorsall[1], cex = 2)
  points(a$pos[a$type=="gene" & a$r2max > r2cut], a$susie_pip[a$type == "gene"  & a$r2max > r2cut], pch = 22, bg = "purple", cex = 2)
  points(a$pos[a$type=="gene" & a$focus == 1], a$susie_pip[a$type == "gene" & a$focus == 1], pch = 22, bg = "salmon", cex = 2)

  if (legend_panel=="cTWAS"){
    x_pos <- ifelse(legend_side=="right", max(a$pos)-0.2*(max(a$pos)-min(a$pos)), min(a$pos))
    legend(x_pos, y= 1 ,c("Gene", "SNP","Lead TWAS Gene", "R2 > 0.4", "R2 <= 0.4"), pch = c(22,21,19,19,19), col = c("black", "black", "salmon", "purple", colorsall[1]), cex=0.7, title.adj = 0)
  }

  if (label_panel=="cTWAS" | label_panel=="both"){
    for (i in 1:length(label_genes)){
      text(a$pos[a$genename==label_genes[i]], a$susie_pip[a$genename==label_genes[i]], labels=label_genes[i], pos=label_pos[i], cex=0.7)
    }
  }

  if (return_table){
    return(a)
  }
}

####################

library(Gviz)
Loading required package: S4VectorsLoading required package: stats4Loading required package: BiocGenericsLoading required package: parallel
Attaching package: 'BiocGenerics'The following objects are masked from 'package:parallel':
clusterApply, clusterApplyLB, clusterCall, clusterEvalQ, clusterExport, clusterMap, parApply, parCapply, parLapply, parLapplyLB, parRapply, parSapply, parSapplyLBThe following objects are masked from 'package:stats':
IQR, mad, sd, var, xtabsThe following objects are masked from 'package:base':
anyDuplicated, append, as.data.frame, basename, cbind, colnames, dirname, do.call, duplicated, eval, evalq, Filter, Find, get, grep, grepl, intersect, is.unsorted, lapply, Map, mapply, match, mget, order, paste, pmax, pmax.int, pmin, pmin.int, Position, rank, rbind, Reduce, rownames, sapply, setdiff, sort, table, tapply, union, unique, unsplit, which, which.max, which.min
Attaching package: 'S4Vectors'The following object is masked from 'package:base':
expand.gridLoading required package: IRangesLoading required package: GenomicRangesLoading required package: GenomeInfoDblocus_plot_gene_track_pub <- function(a, label_pos=NULL, filter_noncoding=T){
chr <- unique(a$chrom)
start <- min(a$pos)*1000000
end <- max(a$pos)*1000000
biomTrack <- BiomartGeneRegionTrack(chromosome = chr,
start = start,
end = end,
name = "ENSEMBL",
biomart = ensembl,
filters=list(biotype="protein_coding"))
biomTrack <- as(biomTrack, "GeneRegionTrack")
if (filter_noncoding){
biomTrack <- biomTrack[biomTrack@range@elementMetadata@listData$feature %in% c("protein_coding", "utr3", "utr5")]
}
if (isTRUE(label_pos=="above")){
displayPars(biomTrack)$just.group <- "above"
} else if (isTRUE(label_pos=="right")){
displayPars(biomTrack)$just.group <- "right"
}
symbol(biomTrack)[symbol(biomTrack)==""] <- gene(biomTrack)[symbol(biomTrack)==""]
grid.newpage()
plotTracks(biomTrack, collapseTranscripts = "meta", transcriptAnnotation = "symbol", from=start, to=end, panel.only=T, add=F)
return(biomTrack)
}UBE2W
pdf(file = "output/IBD_UBE2W_plot.pdf", width = 5, height = 3.5)

a <- locus_plot_final_pub(genename="UBE2W",
                          tissue="Colon_Transverse",
                          return_table=T,
                          legend_side="left",
                          xlim=c(73.3,74.1),
                          label_genes = c("UBE2W", "ELOC", "TMEM70"),
                          label_panel = "both",
                          label_pos=c(3,3,3),
                          plot_eqtl=c("UBE2W"),
                          legend_panel="cTWAS")

dev.off()
png
2 pdf(file = "output/IBD_UBE2W_plot_genetrack.pdf", width = 3.86, height = 0.5)
biomTrack <- locus_plot_gene_track_pub(a)
dev.off()png
2 pdf(file = "output/IBD_UBE2W_plot_genetrack_v2.pdf", width = 3.86, height = 0.5)
biomTrack <- locus_plot_gene_track_pub(a, label_pos="right")
dev.off()png
2 LSP1
pdf(file = "output/IBD_LSP1_plot.pdf", width = 5, height = 3.5)

a <- locus_plot_final_pub(genename="LSP1",
                          tissue="Esophagus_Muscularis",
                          return_table=T,
                          legend_side="left",
                          xlim=c(1.8,2),
                          label_genes = c("LSP1", "PRR33", "TNNT3"),
                          label_panel = "both",
                          label_pos=c(3,3,3),
                          plot_eqtl="LSP1",
                          legend_panel="cTWAS")

dev.off()
png
2 pdf(file = "output/IBD_LSP1_plot_genetrack.pdf", width = 3.86, height = 0.5)
biomTrack <- locus_plot_gene_track_pub(a, label_pos="above")
dev.off()png
2 TYMP
pdf(file = "output/IBD_TYMP_plot.pdf", width = 5, height = 3.5)

a <- locus_plot_final_pub(genename="TYMP",
                          tissue="Esophagus_Mucosa",
                          return_table=T,
                          legend_side="left",
                          xlim=c(50.45, 50.6),
                          label_genes = c("SBF1","LMF2","NCAPH2","SCO2","TYMP","ODF3B","CPT1B","MIOX"),
                          label_panel = "both",
                          label_pos=rep(3,8),
                          plot_eqtl="TYMP",
                          legend_panel="cTWAS")

dev.off()
png
2 pdf(file = "output/IBD_TYMP_plot_genetrack.pdf", width = 3.86, height = 0.7)
biomTrack <- locus_plot_gene_track_pub(a, filter_noncoding=F)
dev.off()png
2 pdf(file = "output/IBD_TYMP_plot_genetrack_v2.pdf", width = 3.86, height = 0.7)
biomTrack <- locus_plot_gene_track_pub(a, label_pos="right", filter_noncoding=F)
dev.off()png
2 CCR5
pdf(file = "output/IBD_CCR5_plot.pdf", width = 5, height = 3.5)

a <- locus_plot_final_pub(genename="CCR5",
                          tissue="Whole_Blood",
                          return_table=T,
                          legend_side="left",
                          xlim=c(46.1, 46.5),
                          label_genes = c("CCR3","CCR1","CCR2","CCR5"),
                          label_panel = "both",
                          label_pos=rep(3,4),
                          plot_eqtl="CCR5",
                          legend_panel="cTWAS")

dev.off()
png
2 pdf(file = "output/IBD_CCR5_plot_genetrack.pdf", width = 3.86, height = 0.5)
biomTrack <- locus_plot_gene_track_pub(a, label_pos="above", filter_noncoding=F)
dev.off()png
2
sessionInfo()R version 3.6.1 (2019-07-05)
Platform: x86_64-pc-linux-gnu (64-bit)
Running under: Scientific Linux 7.4 (Nitrogen)
Matrix products: default
BLAS/LAPACK: /software/openblas-0.2.19-el7-x86_64/lib/libopenblas_haswellp-r0.2.19.so
locale:
[1] LC_CTYPE=en_US.UTF-8 LC_NUMERIC=C LC_TIME=en_US.UTF-8 LC_COLLATE=en_US.UTF-8 LC_MONETARY=en_US.UTF-8 LC_MESSAGES=en_US.UTF-8 LC_PAPER=en_US.UTF-8 LC_NAME=C LC_ADDRESS=C LC_TELEPHONE=C LC_MEASUREMENT=en_US.UTF-8 LC_IDENTIFICATION=C
attached base packages:
[1] parallel stats4 grid stats graphics grDevices utils datasets methods base
other attached packages:
[1] Gviz_1.28.3 GenomicRanges_1.36.0 GenomeInfoDb_1.20.0 IRanges_2.18.1 S4Vectors_0.22.1 BiocGenerics_0.30.0 VennDiagram_1.6.20 futile.logger_1.4.3 ggrepel_0.9.1 biomaRt_2.40.1 ggplot2_3.3.5 WebGestaltR_0.4.4 enrichR_3.0
loaded via a namespace (and not attached):
[1] readxl_1.3.1 backports_1.1.4 Hmisc_4.2-0 workflowr_1.6.2 igraph_1.2.4.1 lazyeval_0.2.2 splines_3.6.1 BiocParallel_1.18.0 digest_0.6.20 ensembldb_2.8.0 foreach_1.5.1 htmltools_0.5.2 fansi_0.5.0 magrittr_2.0.3 checkmate_2.1.0 memoise_2.0.0 BSgenome_1.52.0 cluster_2.1.0 doParallel_1.0.16 Biostrings_2.52.0 readr_1.4.0 matrixStats_0.57.0 R.utils_2.9.0 svglite_1.2.2 prettyunits_1.0.2 colorspace_1.4-1 blob_1.2.1 xfun_0.8 dplyr_1.0.9 crayon_1.4.1 RCurl_1.98-1.1 jsonlite_1.6 survival_2.44-1.1 VariantAnnotation_1.30.1 iterators_1.0.13
[36] glue_1.6.2 gtable_0.3.0 zlibbioc_1.30.0 XVector_0.24.0 DelayedArray_0.10.0 apcluster_1.4.8 scales_1.2.0 futile.options_1.0.1 DBI_1.1.1 rngtools_1.5 Rcpp_1.0.6 progress_1.2.2 htmlTable_1.13.1 foreign_0.8-71 bit_4.0.4 Formula_1.2-3 htmlwidgets_1.3 httr_1.4.1 RColorBrewer_1.1-2 acepack_1.4.1 ellipsis_0.3.2 pkgconfig_2.0.3 XML_3.98-1.20 R.methodsS3_1.7.1 farver_2.1.0 nnet_7.3-12 utf8_1.2.1 tidyselect_1.1.2 labeling_0.3 rlang_1.0.2 later_0.8.0 AnnotationDbi_1.46.0 munsell_0.5.0 cellranger_1.1.0 tools_3.6.1
[71] cachem_1.0.5 cli_3.3.0 generics_0.0.2 RSQLite_2.2.7 evaluate_0.14 stringr_1.4.0 fastmap_1.1.0 yaml_2.2.0 knitr_1.23 bit64_4.0.5 fs_1.5.2 purrr_0.3.4 AnnotationFilter_1.8.0 doRNG_1.8.2 whisker_0.3-2 formatR_1.7 R.oo_1.22.0 compiler_3.6.1 rstudioapi_0.10 curl_3.3 tibble_3.1.7 stringi_1.4.3 GenomicFeatures_1.36.3 gdtools_0.1.9 lattice_0.20-38 ProtGenerics_1.16.0 Matrix_1.2-18 vctrs_0.4.1 pillar_1.7.0 lifecycle_1.0.1 data.table_1.14.0 bitops_1.0-6 httpuv_1.5.1 rtracklayer_1.44.0 R6_2.5.0
[106] latticeExtra_0.6-28 promises_1.0.1 gridExtra_2.3 codetools_0.2-16 lambda.r_1.2.3 dichromat_2.0-0 assertthat_0.2.1 SummarizedExperiment_1.14.1 rprojroot_2.0.2 rjson_0.2.20 withr_2.4.1 GenomicAlignments_1.20.1 Rsamtools_2.0.0 GenomeInfoDbData_1.2.1 hms_1.1.0 rpart_4.1-15 rmarkdown_1.13 git2r_0.26.1 biovizBase_1.32.0 Biobase_2.44.0 base64enc_0.1-3