Inflammatory bowel disease - all weights (no lncRNA)
wesleycrouse
2022-06-09
Last updated: 2022-06-14
Checks: 6 1
Knit directory: ctwas_applied/
This reproducible R Markdown analysis was created with workflowr (version 1.6.2). The Checks tab describes the reproducibility checks that were applied when the results were created. The Past versions tab lists the development history.
The R Markdown file has staged changes. To know which version of the R Markdown file created these results, you’ll want to first commit it to the Git repo. If you’re still working on the analysis, you can ignore this warning. When you’re finished, you can run wflow_publish to commit the R Markdown file and build the HTML.
Great job! The global environment was empty. Objects defined in the global environment can affect the analysis in your R Markdown file in unknown ways. For reproduciblity it’s best to always run the code in an empty environment.
The command set.seed(20210726) was run prior to running the code in the R Markdown file. Setting a seed ensures that any results that rely on randomness, e.g. subsampling or permutations, are reproducible.
Great job! Recording the operating system, R version, and package versions is critical for reproducibility.
Nice! There were no cached chunks for this analysis, so you can be confident that you successfully produced the results during this run.
Great job! Using relative paths to the files within your workflowr project makes it easier to run your code on other machines.
Great! You are using Git for version control. Tracking code development and connecting the code version to the results is critical for reproducibility.
The results in this page were generated with repository version 061cee5. See the Past versions tab to see a history of the changes made to the R Markdown and HTML files.
Note that you need to be careful to ensure that all relevant files for the analysis have been committed to Git prior to generating the results (you can use wflow_publish or wflow_git_commit). workflowr only checks the R Markdown file, but you know if there are other scripts or data files that it depends on. Below is the status of the Git repository when the results were generated:
Ignored files:
    Ignored:    analysis/figure/

Untracked files:
    Untracked:  ebi-a-GCST004131_enrichment_results.RData
    Untracked:  ebi-a-GCST004131silver_standard_enrichment_results.RData
    Untracked:  group_enrichment_results.RData
    Untracked:  results_summary_inflammatory_bowel_disease_nolnc_v2.csv
    Untracked:  workspace.RData
    Untracked:  workspace2.RData
    Untracked:  workspace3.RData
    Untracked:  z_snp_pos_ebi-a-GCST004131.RData
    Untracked:  z_snp_pos_ebi-a-GCST004132.RData
    Untracked:  z_snp_pos_ebi-a-GCST004133.RData
    Untracked:  z_snp_pos_ukb-d-30780_irnt.RData

Unstaged changes:
    Modified:   analysis/ebi-a-GCST004131_allweights_nolnc.Rmd

Staged changes:
    Modified:   analysis/ebi-a-GCST004131_allweights_nolnc.Rmd
    Modified:   analysis/ukb-d-30780_irnt_Liver_nolnc_known.Rmd
    Modified:   code/automate_Rmd.R
    Modified:   summary_table_inflammatory_bowel_disease_nolnc.csv
Note that any generated files, e.g. HTML, png, CSS, etc., are not included in this status report because it is ok for generated content to have uncommitted changes.
These are the previous versions of the repository in which changes were made to the R Markdown (analysis/ebi-a-GCST004131_allweights_nolnc.Rmd) and HTML (docs/ebi-a-GCST004131_allweights_nolnc.html) files. If you’ve configured a remote Git repository (see ?wflow_git_remote), click on the hyperlinks in the table below to view the files as they were in that past version.
| File | Version | Author | Date | Message |
|---|---|---|---|---|
| Rmd | 061cee5 | wesleycrouse | 2022-06-14 | updating LDL locus plots |
| Rmd | 397176f | wesleycrouse | 2022-06-10 | no lncRNA for IBD |
| html | 397176f | wesleycrouse | 2022-06-10 | no lncRNA for IBD |
| Rmd | 0136d2e | wesleycrouse | 2022-06-10 | reports without lncRNA |
options(width=1000)trait_id <- "ebi-a-GCST004131"
trait_name <- "Inflammatory bowel disease"
source("/project2/mstephens/wcrouse/UKB_analysis_allweights/ctwas_config.R")
trait_dir <- paste0("/project2/mstephens/wcrouse/UKB_analysis_allweights/", trait_id)
results_dirs <- list.dirs(trait_dir, recursive=F)
results_dirs <- results_dirs[grep("nolnc", results_dirs)]Load cTWAS results for all weights
df <- list()

for (i in 1:length(results_dirs)){
  print(i)

  results_dir <- results_dirs[i]
  weight <- rev(unlist(strsplit(results_dir, "/")))[1]
  weight <- unlist(strsplit(weight, split="_nolnc"))
  analysis_id <- paste(trait_id, weight, sep="_")

  #load ctwas results
  ctwas_res <- data.table::fread(paste0(results_dir, "/", analysis_id, "_ctwas.susieIrss.txt"))

  #make unique identifier for regions and effects
  ctwas_res$region_tag <- paste(ctwas_res$region_tag1, ctwas_res$region_tag2, sep="_")
  ctwas_res$region_cs_tag <- paste(ctwas_res$region_tag, ctwas_res$cs_index, sep="_")

  #load z scores for SNPs and collect sample size
  load(paste0(results_dir, "/", analysis_id, "_expr_z_snp.Rd"))

  sample_size <- z_snp$ss
  sample_size <- as.numeric(names(which.max(table(sample_size))))

  #separate gene and SNP results
  ctwas_gene_res <- ctwas_res[ctwas_res$type == "gene", ]
  ctwas_gene_res <- data.frame(ctwas_gene_res)
  ctwas_snp_res <- ctwas_res[ctwas_res$type == "SNP", ]
  ctwas_snp_res <- data.frame(ctwas_snp_res)

  #add gene information to results
  sqlite <- RSQLite::dbDriver("SQLite")
  db = RSQLite::dbConnect(sqlite, paste0("/project2/mstephens/wcrouse/predictdb_nolnc/mashr_", weight, "_nolnc.db"))
  query <- function(...) RSQLite::dbGetQuery(db, ...)
  gene_info <- query("select gene, genename, gene_type from extra")
  RSQLite::dbDisconnect(db)

  ctwas_gene_res <- cbind(ctwas_gene_res, gene_info[sapply(ctwas_gene_res$id, match, gene_info$gene), c("genename", "gene_type")])

  #add z scores to results
  load(paste0(results_dir, "/", analysis_id, "_expr_z_gene.Rd"))
  ctwas_gene_res$z <- z_gene[ctwas_gene_res$id,]$z

  z_snp <- z_snp[z_snp$id %in% ctwas_snp_res$id,]
  ctwas_snp_res$z <- z_snp$z[match(ctwas_snp_res$id, z_snp$id)]

  #merge gene and snp results with added information
  ctwas_snp_res$genename=NA
  ctwas_snp_res$gene_type=NA

  ctwas_res <- rbind(ctwas_gene_res, ctwas_snp_res[,colnames(ctwas_gene_res)])

  #get number of eQTL for genes
  num_eqtl <- c()
  for (i in 1:22){
    load(paste0(results_dir, "/", analysis_id, "_expr_chr", i, ".exprqc.Rd"))
    num_eqtl <- c(num_eqtl, unlist(lapply(wgtlist, nrow)))
  }
  ctwas_gene_res$num_eqtl <- num_eqtl[ctwas_gene_res$id]

  #get number of SNPs from s1 results; adjust for thin argument
  ctwas_res_s1 <- data.table::fread(paste0(results_dir, "/", analysis_id, "_ctwas.s1.susieIrss.txt"))
  n_snps <- sum(ctwas_res_s1$type=="SNP")/thin
  rm(ctwas_res_s1)

  #load estimated parameters
  load(paste0(results_dir, "/", analysis_id, "_ctwas.s2.susieIrssres.Rd"))

  #estimated group prior
  estimated_group_prior <- group_prior_rec[,ncol(group_prior_rec)]
  names(estimated_group_prior) <- c("gene", "snp")
  estimated_group_prior["snp"] <- estimated_group_prior["snp"]*thin #adjust parameter to account for thin argument

  #estimated group prior variance
  estimated_group_prior_var <- group_prior_var_rec[,ncol(group_prior_var_rec)]
  names(estimated_group_prior_var) <- c("gene", "snp")

  #report group size
  group_size <- c(nrow(ctwas_gene_res), n_snps)

  #estimated group PVE
  estimated_group_pve <- estimated_group_prior_var*estimated_group_prior*group_size/sample_size
  names(estimated_group_pve) <- c("gene", "snp")

  #ctwas genes using PIP>0.8
  ctwas_genes_index <- ctwas_gene_res$susie_pip>0.8
  ctwas_genes <- ctwas_gene_res$genename[ctwas_genes_index]

  #twas genes using bonferroni threshold
  alpha <- 0.05
  sig_thresh <- qnorm(1-(alpha/nrow(ctwas_gene_res)/2), lower=T)

  twas_genes_index <- abs(ctwas_gene_res$z) > sig_thresh
  twas_genes <- ctwas_gene_res$genename[twas_genes_index]

  #gene PIPs and z scores
  gene_pips <- ctwas_gene_res[,c("genename", "region_tag", "susie_pip", "z", "region_cs_tag", "num_eqtl")]

  #total PIPs by region
  regions <- unique(ctwas_gene_res$region_tag)
  region_pips <- data.frame(region=regions, stringsAsFactors=F)
  region_pips$gene_pip <- sapply(regions, function(x){sum(ctwas_gene_res$susie_pip[ctwas_gene_res$region_tag==x])})
  region_pips$snp_pip <- sapply(regions, function(x){sum(ctwas_snp_res$susie_pip[ctwas_snp_res$region_tag==x])})
  region_pips$snp_maxz <- sapply(regions, function(x){max(abs(ctwas_snp_res$z[ctwas_snp_res$region_tag==x]))})
  region_pips$which_snp_maxz <- sapply(regions, function(x){ctwas_snp_res_index <- ctwas_snp_res$region_tag==x; ctwas_snp_res$id[ctwas_snp_res_index][which.max(abs(ctwas_snp_res$z[ctwas_snp_res_index]))]})

  #total PIPs by causal set
  regions_cs <- unique(ctwas_gene_res$region_cs_tag)
  region_cs_pips <- data.frame(region_cs=regions_cs, stringsAsFactors=F)
  region_cs_pips$gene_pip <- sapply(regions_cs, function(x){sum(ctwas_gene_res$susie_pip[ctwas_gene_res$region_cs_tag==x])})
  region_cs_pips$snp_pip <- sapply(regions_cs, function(x){sum(ctwas_snp_res$susie_pip[ctwas_snp_res$region_cs_tag==x])})

  df[[weight]] <- list(prior=estimated_group_prior,
                     prior_var=estimated_group_prior_var,
                     pve=estimated_group_pve,
                     ctwas=ctwas_genes,
                     twas=twas_genes,
                     gene_pips=gene_pips,
                     region_pips=region_pips,
                     sig_thresh=sig_thresh,
                     region_cs_pips=region_cs_pips)
}
[1] 1
[1] 2
[1] 3
[1] 4
[1] 5
[1] 6
[1] 7
[1] 8
[1] 9
[1] 10
[1] 11
[1] 12
[1] 13
[1] 14
[1] 15
[1] 16
[1] 17
[1] 18
[1] 19
[1] 20
[1] 21
[1] 22
[1] 23
[1] 24
[1] 25
[1] 26
[1] 27
[1] 28
[1] 29
[1] 30
[1] 31
[1] 32
[1] 33
[1] 34
[1] 35
[1] 36
[1] 37
[1] 38
[1] 39
[1] 40
[1] 41
[1] 42
[1] 43
[1] 44
[1] 45
[1] 46
[1] 47
[1] 48
[1] 49save(df, file=paste(trait_dir, "results_df_nolnc.RData", sep="/"))
load(paste(trait_dir, "results_df_nolnc.RData", sep="/"))
output <- data.frame(weight=names(df),
prior_g=unlist(lapply(df, function(x){x$prior["gene"]})),
prior_s=unlist(lapply(df, function(x){x$prior["snp"]})),
prior_var_g=unlist(lapply(df, function(x){x$prior_var["gene"]})),
prior_var_s=unlist(lapply(df, function(x){x$prior_var["snp"]})),
pve_g=unlist(lapply(df, function(x){x$pve["gene"]})),
pve_s=unlist(lapply(df, function(x){x$pve["snp"]})),
n_ctwas=unlist(lapply(df, function(x){length(x$ctwas)})),
n_twas=unlist(lapply(df, function(x){length(x$twas)})),
row.names=NULL,
stringsAsFactors=F)Plot estimated prior parameters and PVE
#plot estimated group prior

output <- output[order(-output$prior_g),]

par(mar=c(10.1, 4.1, 4.1, 2.1))

plot(output$prior_g, type="l", ylim=c(0, max(output$prior_g, output$prior_s)*1.1),
     xlab="", ylab="Estimated Group Prior", xaxt = "n", col="blue")
lines(output$prior_s)

axis(1, at = 1:nrow(output),
     labels = output$weight,
     las=2,
     cex.axis=0.6)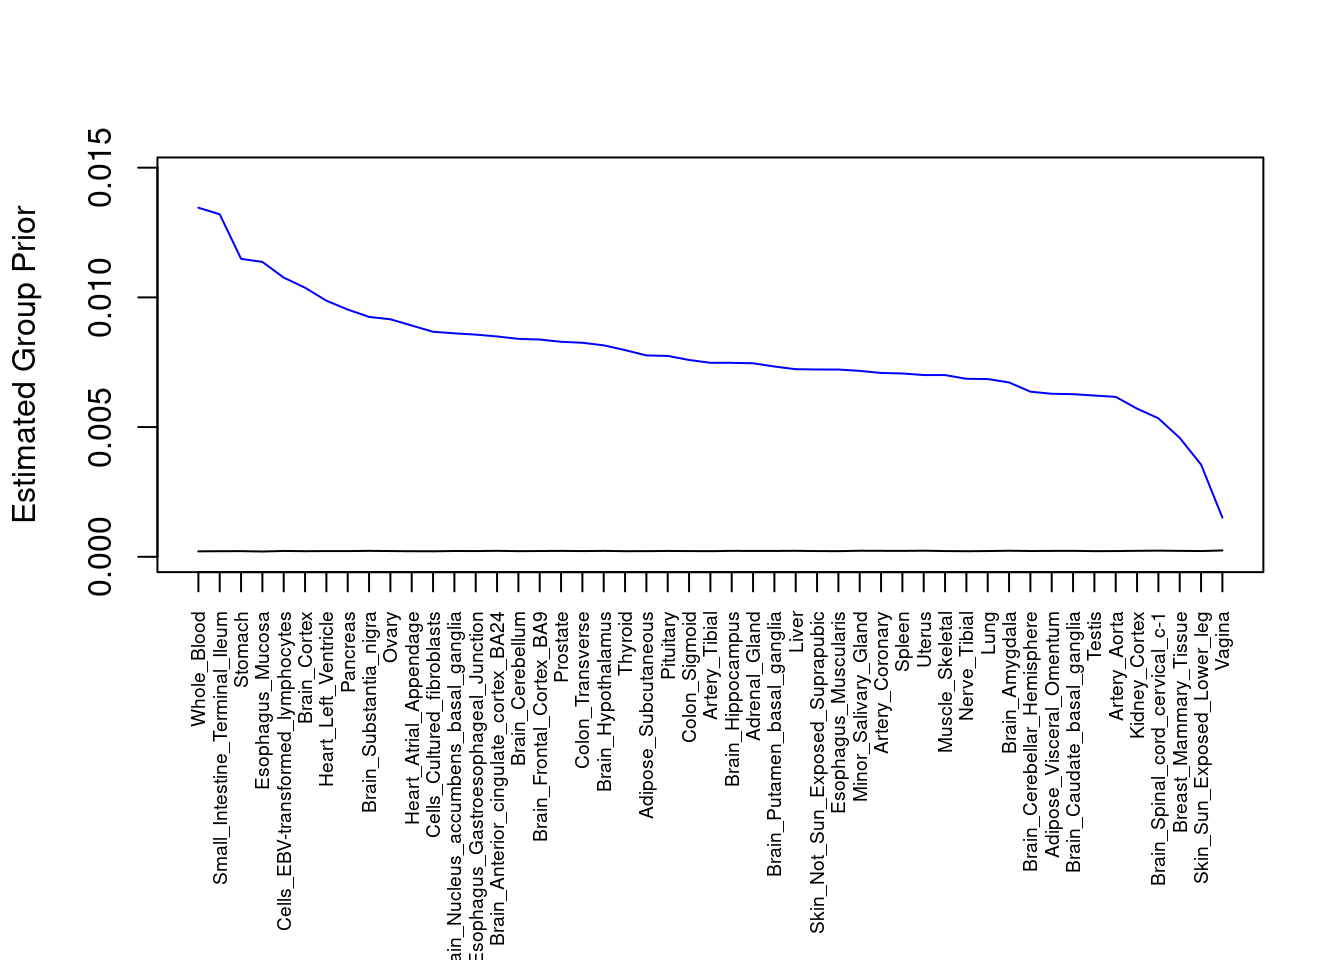
| Version | Author | Date |
|---|---|---|
| 397176f | wesleycrouse | 2022-06-10 |
####################
#plot estimated group prior variance

par(mar=c(10.1, 4.1, 4.1, 2.1))

plot(output$prior_var_g, type="l", ylim=c(0, max(output$prior_var_g, output$prior_var_s)*1.1),
     xlab="", ylab="Estimated Group Prior Variance", xaxt = "n", col="blue")
lines(output$prior_var_s)

axis(1, at = 1:nrow(output),
     labels = output$weight,
     las=2,
     cex.axis=0.6)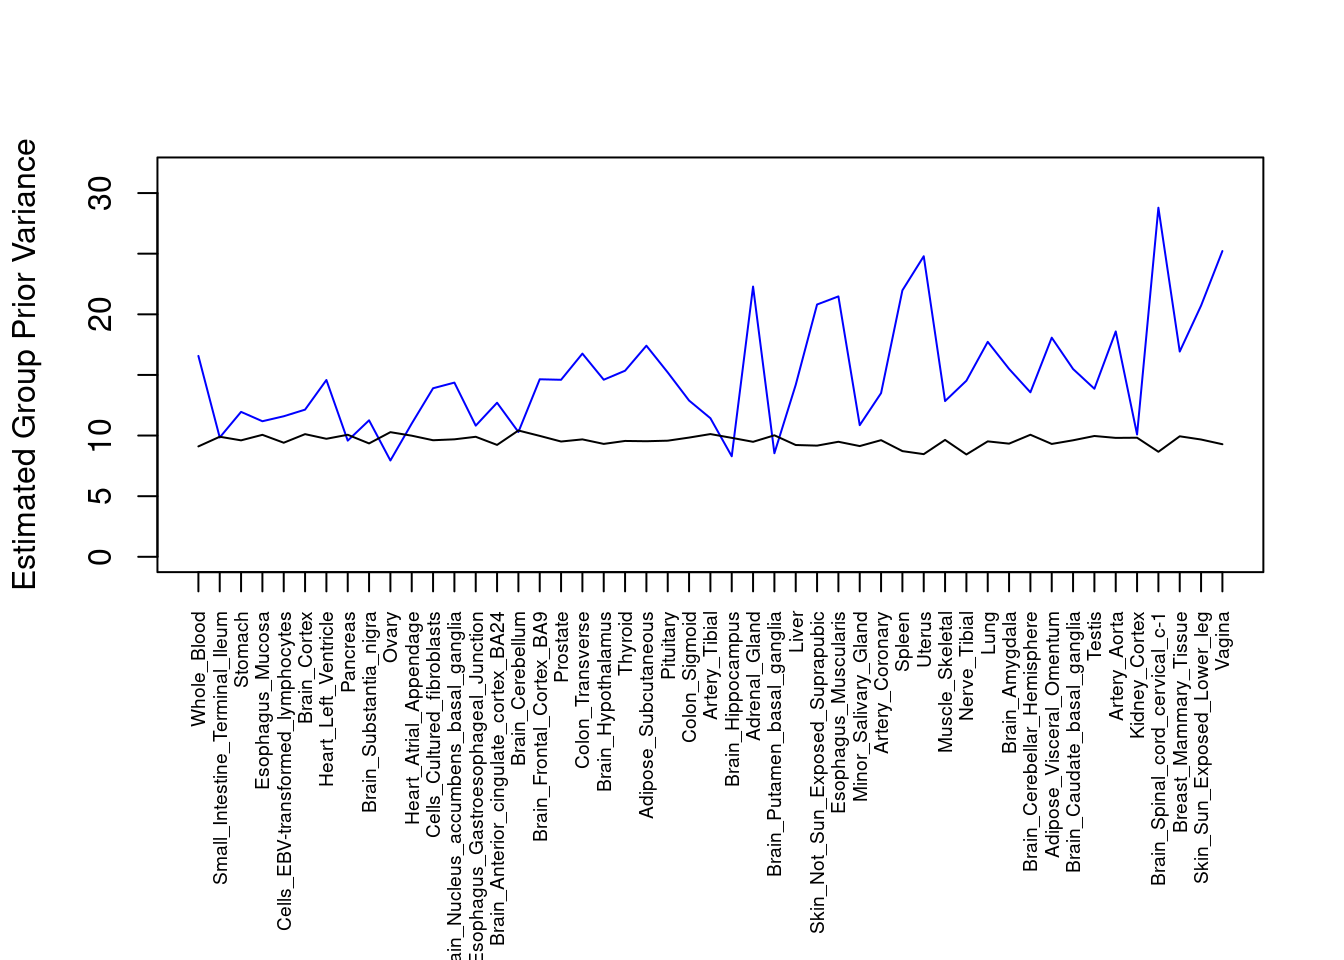
| Version | Author | Date |
|---|---|---|
| 397176f | wesleycrouse | 2022-06-10 |
####################
#plot PVE

output <- output[order(-output$pve_g),]

par(mar=c(10.1, 4.1, 4.1, 2.1))

plot(output$pve_g, type="l", ylim=c(0, max(output$pve_g+output$pve_s)*1.1),
     xlab="", ylab="Estimated PVE", xaxt = "n", col="blue")
lines(output$pve_s)
lines(output$pve_g+output$pve_s, lty=2)

axis(1, at = 1:nrow(output),
     labels = output$weight,
     las=2,
     cex.axis=0.6)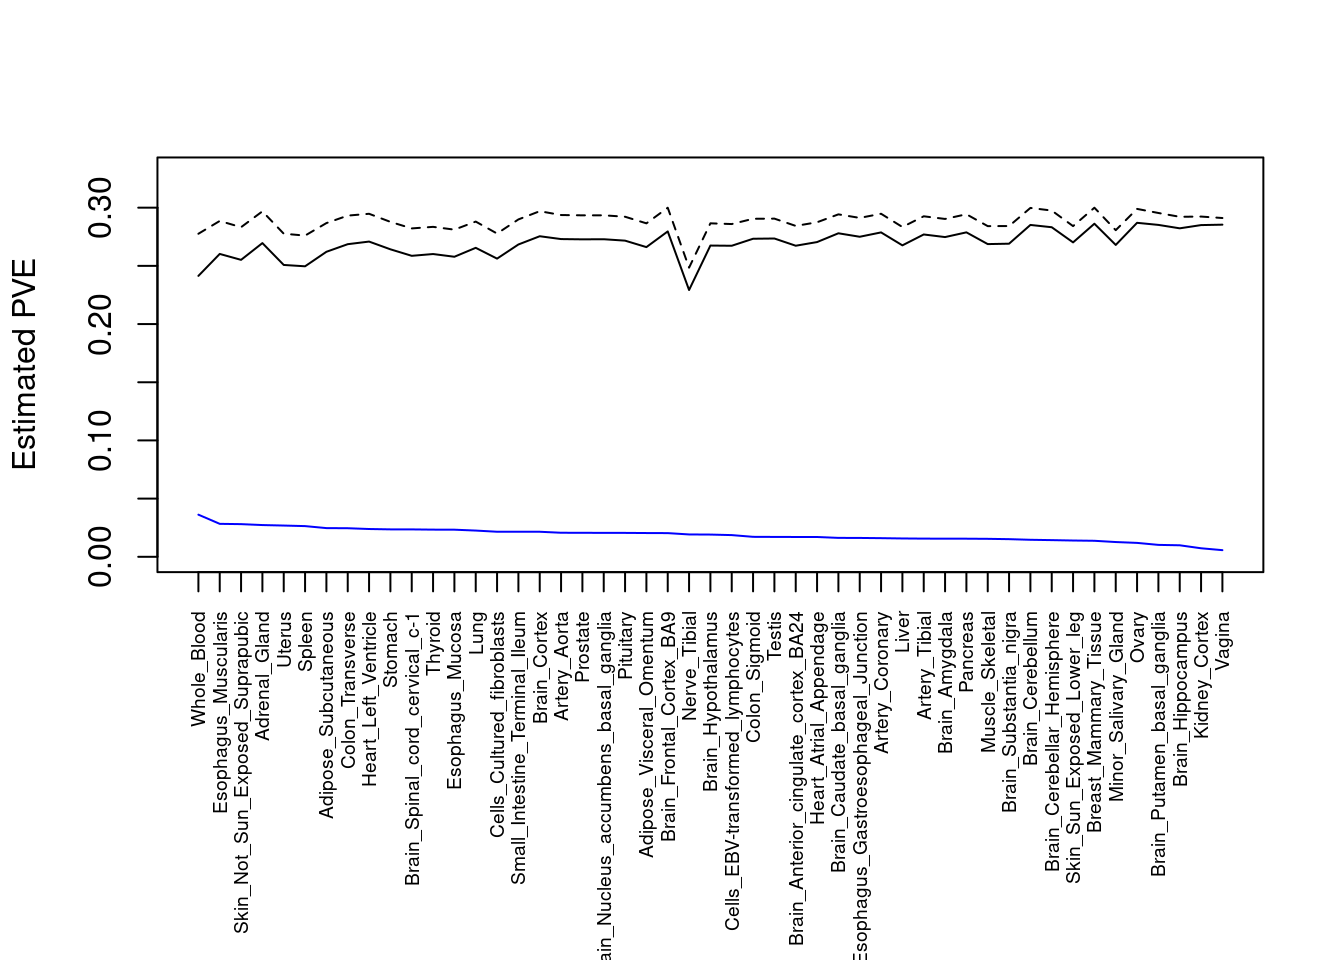
| Version | Author | Date |
|---|---|---|
| 397176f | wesleycrouse | 2022-06-10 |
Number of cTWAS and TWAS genes
cTWAS genes are the set of genes with PIP>0.8 in any tissue. TWAS genes are the set of genes with significant z score (Bonferroni within tissue) in any tissue.
#plot number of significant cTWAS and TWAS genes in each tissue
plot(output$n_ctwas, output$n_twas, xlab="Number of cTWAS Genes", ylab="Number of TWAS Genes")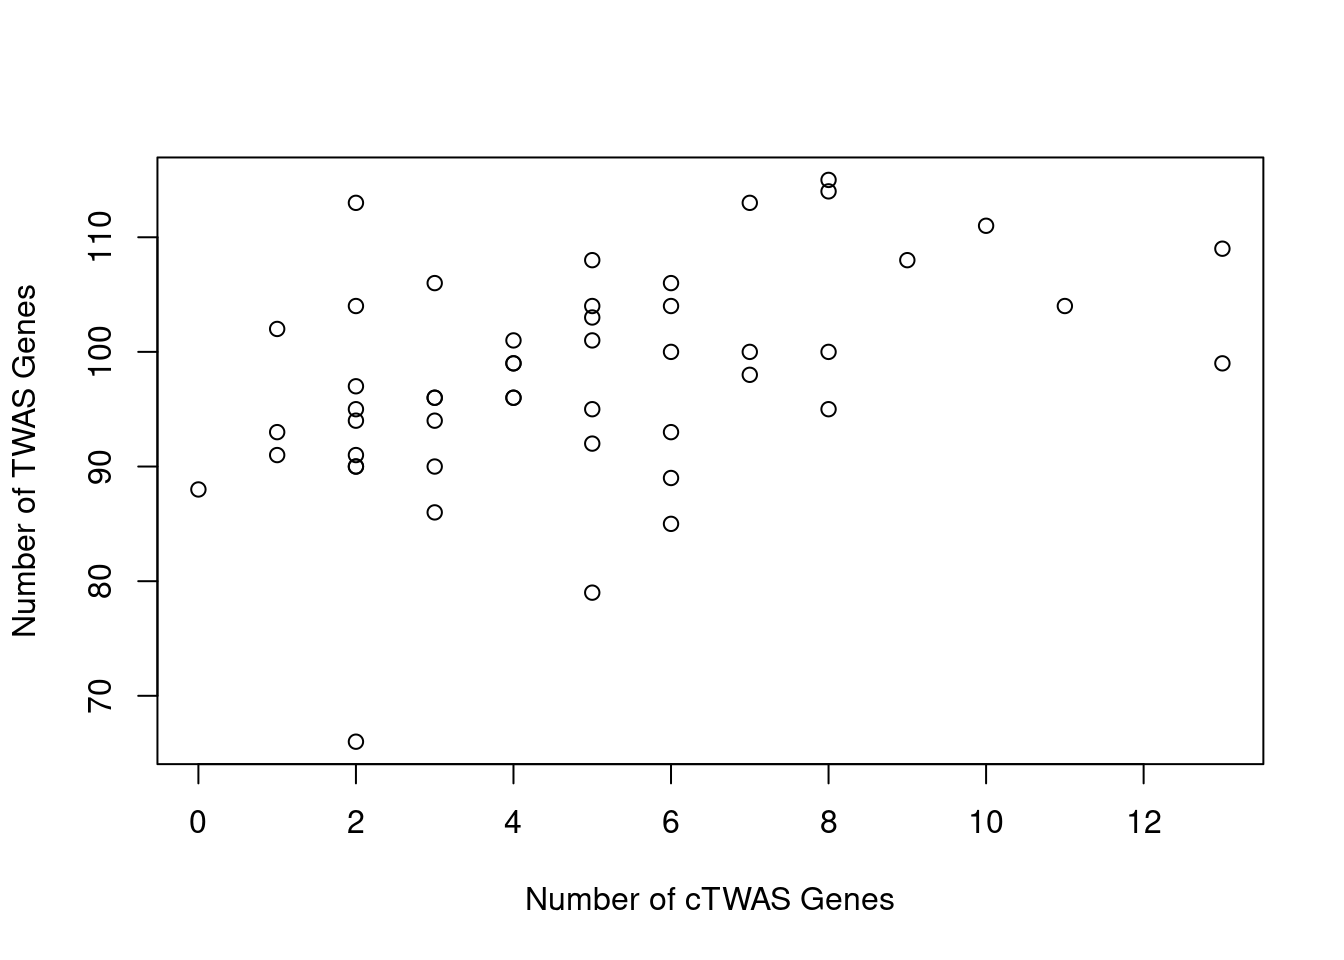
| Version | Author | Date |
|---|---|---|
| 397176f | wesleycrouse | 2022-06-10 |
#number of ctwas_genes
ctwas_genes <- unique(unlist(lapply(df, function(x){x$ctwas})))
length(ctwas_genes)
[1] 98#number of twas_genes
twas_genes <- unique(unlist(lapply(df, function(x){x$twas})))
length(twas_genes)[1] 488Enrichment analysis for cTWAS genes
GO
#enrichment for cTWAS genes using enrichR
library(enrichR)
Welcome to enrichR
Checking connection ... Enrichr ... Connection is Live!
FlyEnrichr ... Connection is available!
WormEnrichr ... Connection is available!
YeastEnrichr ... Connection is available!
FishEnrichr ... Connection is available!dbs <- c("GO_Biological_Process_2021", "GO_Cellular_Component_2021", "GO_Molecular_Function_2021")
GO_enrichment <- enrichr(ctwas_genes, dbs)Uploading data to Enrichr... Done.
Querying GO_Biological_Process_2021... Done.
Querying GO_Cellular_Component_2021... Done.
Querying GO_Molecular_Function_2021... Done.
Parsing results... Done.for (db in dbs){
cat(paste0(db, "\n\n"))
enrich_results <- GO_enrichment[[db]]
enrich_results <- enrich_results[enrich_results$Adjusted.P.value<0.05,c("Term", "Overlap", "Adjusted.P.value", "Genes")]
print(enrich_results)
print(plotEnrich(GO_enrichment[[db]]))
}GO_Biological_Process_2021
Term Overlap Adjusted.P.value Genes
1 cytokine-mediated signaling pathway (GO:0019221) 19/621 1.863826e-07 CIITA;TNFRSF6B;FCER1G;TNFSF15;CCL20;IFNGR2;STAT3;MMP9;PSMA6;MUC1;IRF3;IRF8;TNFRSF14;IRF6;CCR5;CRK;HLA-DQA1;IL18R1;IP6K2
2 cellular response to cytokine stimulus (GO:0071345) 14/482 5.911729e-05 SMAD3;CCL20;IFNGR2;STAT3;MMP9;ZFP36L2;MAPK13;SBNO2;MUC1;IRF8;CCR5;CRK;IL18R1;PTPN2
3 positive regulation of cytokine production (GO:0001819) 11/335 3.143453e-04 LACC1;FCER1G;IRF3;CD6;CARD9;STAT3;PRKD2;TNFRSF14;IL18R1;CD244;MAPK13
4 interferon-gamma-mediated signaling pathway (GO:0060333) 6/68 3.165680e-04 CIITA;IRF3;IFNGR2;IRF8;IRF6;HLA-DQA1
5 cellular response to interferon-gamma (GO:0071346) 7/121 5.450892e-04 CIITA;IRF3;CCL20;IFNGR2;IRF8;IRF6;HLA-DQA1
6 positive regulation of transcription by RNA polymerase II (GO:0045944) 16/908 1.705093e-03 CIITA;CRTC3;SMAD3;STAT3;MED16;POU5F1;FOSL2;SBNO2;MUC1;NR5A2;IRF3;ZGLP1;IRF8;PRKD2;IRF6;ZNF300
7 regulation of receptor binding (GO:1900120) 3/10 2.378608e-03 ADAM15;HFE;MMP9
8 positive regulation of transcription, DNA-templated (GO:0045893) 18/1183 2.429020e-03 CIITA;CRTC3;SMAD3;STAT3;MED16;POU5F1;FOSL2;SBNO2;NR5A2;DDX39B;IRF3;ZGLP1;TFAM;IRF8;PRKD2;IRF6;BRD7;ZNF300
9 positive regulation of DNA-binding transcription factor activity (GO:0051091) 8/246 3.930045e-03 PSMA6;CRTC3;SMAD3;PRKCB;CARD9;STAT3;PRKD2;IL18R1
10 positive regulation of cytokine production involved in inflammatory response (GO:1900017) 3/17 9.202932e-03 CD6;CARD9;STAT3
11 response to cytokine (GO:0034097) 6/150 1.089078e-02 CIITA;SMAD3;SMPD1;STAT3;IL18R1;PTPN2
12 positive regulation of NF-kappaB transcription factor activity (GO:0051092) 6/155 1.195705e-02 PSMA6;PRKCB;CARD9;STAT3;PRKD2;IL18R1
13 neutrophil mediated immunity (GO:0002446) 10/488 1.267541e-02 SYNGR1;TSPAN14;FCER1G;FCGR2A;CARD9;SLC2A3;ITGAV;APEH;ITGAL;MMP9
14 positive regulation of antigen receptor-mediated signaling pathway (GO:0050857) 3/21 1.267541e-02 PRKCB;RAB29;PRKD2
15 transmembrane receptor protein tyrosine kinase signaling pathway (GO:0007169) 9/404 1.373554e-02 EFNA1;CNKSR1;RGS14;STAT3;PRKD2;ITGAV;MMP9;CRK;PTPN2
16 cellular response to type I interferon (GO:0071357) 4/65 2.140716e-02 IRF3;IRF8;IRF6;IP6K2
17 type I interferon signaling pathway (GO:0060337) 4/65 2.140716e-02 IRF3;IRF8;IRF6;IP6K2
18 regulation of transcription by RNA polymerase II (GO:0006357) 23/2206 2.194364e-02 CIITA;CRTC3;SMAD3;PRKCB;HOXD1;STAT3;MED16;POU5F1;FOSL2;EFNA1;SBNO2;MUC1;NR5A2;IRF3;SIX5;ZGLP1;IRF8;PRKD2;IRF6;BRD7;CRK;NKX2-3;ZNF300
19 cellular response to organic substance (GO:0071310) 5/123 2.194364e-02 SMAD3;LRRK2;STAT3;IL18R1;PTPN2
20 positive regulation of receptor binding (GO:1900122) 2/6 2.194364e-02 HFE;MMP9
21 cellular response to tumor necrosis factor (GO:0071356) 6/194 2.299437e-02 PSMA6;TNFRSF6B;TNFSF15;CCL20;TNFRSF14;ZFP36L2
22 positive regulation of protein phosphorylation (GO:0001934) 8/371 2.715162e-02 EFNA1;SH2D3A;HFE;LRRK2;ITLN1;PRKD2;TNFRSF14;MMP9
23 regulation of inflammatory response (GO:0050727) 6/206 2.884631e-02 LACC1;PSMA6;SBNO2;MMP9;PTPN2;MAPK13
24 neutrophil degranulation (GO:0043312) 9/481 3.074546e-02 SYNGR1;TSPAN14;FCER1G;FCGR2A;SLC2A3;ITGAV;APEH;ITGAL;MMP9
25 neutrophil activation involved in immune response (GO:0002283) 9/485 3.131344e-02 SYNGR1;TSPAN14;FCER1G;FCGR2A;SLC2A3;ITGAV;APEH;ITGAL;MMP9
26 regulation of T cell receptor signaling pathway (GO:0050856) 3/35 3.195836e-02 RAB29;PRKD2;PTPN2
27 MAPK cascade (GO:0000165) 7/303 3.367927e-02 PSMA6;LRRK2;RASA2;ITGAV;CCR5;ZFP36L2;MAPK13
28 negative regulation of lipid localization (GO:1905953) 2/9 3.418254e-02 ITGAV;PTPN2
29 regulation of DNA-templated transcription in response to stress (GO:0043620) 2/9 3.418254e-02 MUC1;RGS14
30 negative regulation of alpha-beta T cell activation (GO:0046636) 2/9 3.418254e-02 HFE;TNFRSF14
31 positive regulation of production of molecular mediator of immune response (GO:0002702) 3/38 3.418254e-02 LACC1;TNFRSF14;CD244
32 negative regulation of receptor binding (GO:1900121) 2/10 3.669974e-02 ADAM15;HFE
33 negative regulation of transmembrane transport (GO:0034763) 2/10 3.669974e-02 PRKCB;OAZ3
34 immunoglobulin mediated immune response (GO:0016064) 2/10 3.669974e-02 FCER1G;CARD9
35 positive regulation of vascular endothelial growth factor receptor signaling pathway (GO:0030949) 2/10 3.669974e-02 PRKCB;PRKD2
36 T cell differentiation (GO:0030217) 3/41 3.669974e-02 FCER1G;ZFP36L2;PTPN2
37 negative regulation of mitotic cell cycle phase transition (GO:1901991) 4/92 3.669974e-02 PSMA6;GPR132;BRD7;ZFP36L2
38 regulation of cytokine production involved in inflammatory response (GO:1900015) 3/43 4.007787e-02 CD6;CARD9;STAT3
39 B cell mediated immunity (GO:0019724) 2/11 4.060728e-02 FCER1G;CARD9
40 regulation of MAP kinase activity (GO:0043405) 4/97 4.131872e-02 EDN3;RGS14;LRRK2;SMPD1
41 antigen processing and presentation of exogenous peptide antigen via MHC class II (GO:0019886) 4/98 4.139963e-02 FCER1G;HLA-DMB;HLA-DOB;HLA-DQA1
42 regulation of pri-miRNA transcription by RNA polymerase II (GO:1902893) 3/45 4.139963e-02 SMAD3;STAT3;POU5F1
43 antigen processing and presentation of peptide antigen via MHC class II (GO:0002495) 4/100 4.209691e-02 FCER1G;HLA-DMB;HLA-DOB;HLA-DQA1
44 positive regulation of signal transduction (GO:0009967) 6/252 4.209691e-02 TSPAN14;PRKCB;LRRK2;STAT3;PRKD2;ITGAV
45 eye photoreceptor cell differentiation (GO:0001754) 2/12 4.209691e-02 STAT3;TULP1
46 antigen processing and presentation of exogenous peptide antigen (GO:0002478) 4/103 4.463307e-02 FCER1G;HLA-DMB;HLA-DOB;HLA-DQA1
47 mitochondrion organization (GO:0007005) 5/175 4.463307e-02 BIK;LRRK2;RAB29;TFAM;TYMP
48 negative regulation of locomotion (GO:0040013) 2/13 4.463307e-02 CRK;PTPN2
49 entry into host (GO:0044409) 2/13 4.463307e-02 ITGAV;CCR5
50 protein localization to mitochondrion (GO:0070585) 2/13 4.463307e-02 LRRK2;RNF186
51 regulation of response to interferon-gamma (GO:0060330) 2/14 4.896791e-02 IFNGR2;PTPN2
52 positive regulation of lymphocyte migration (GO:2000403) 2/14 4.896791e-02 CCL20;TNFRSF14
53 positive regulation of T cell receptor signaling pathway (GO:0050862) 2/14 4.896791e-02 RAB29;PRKD2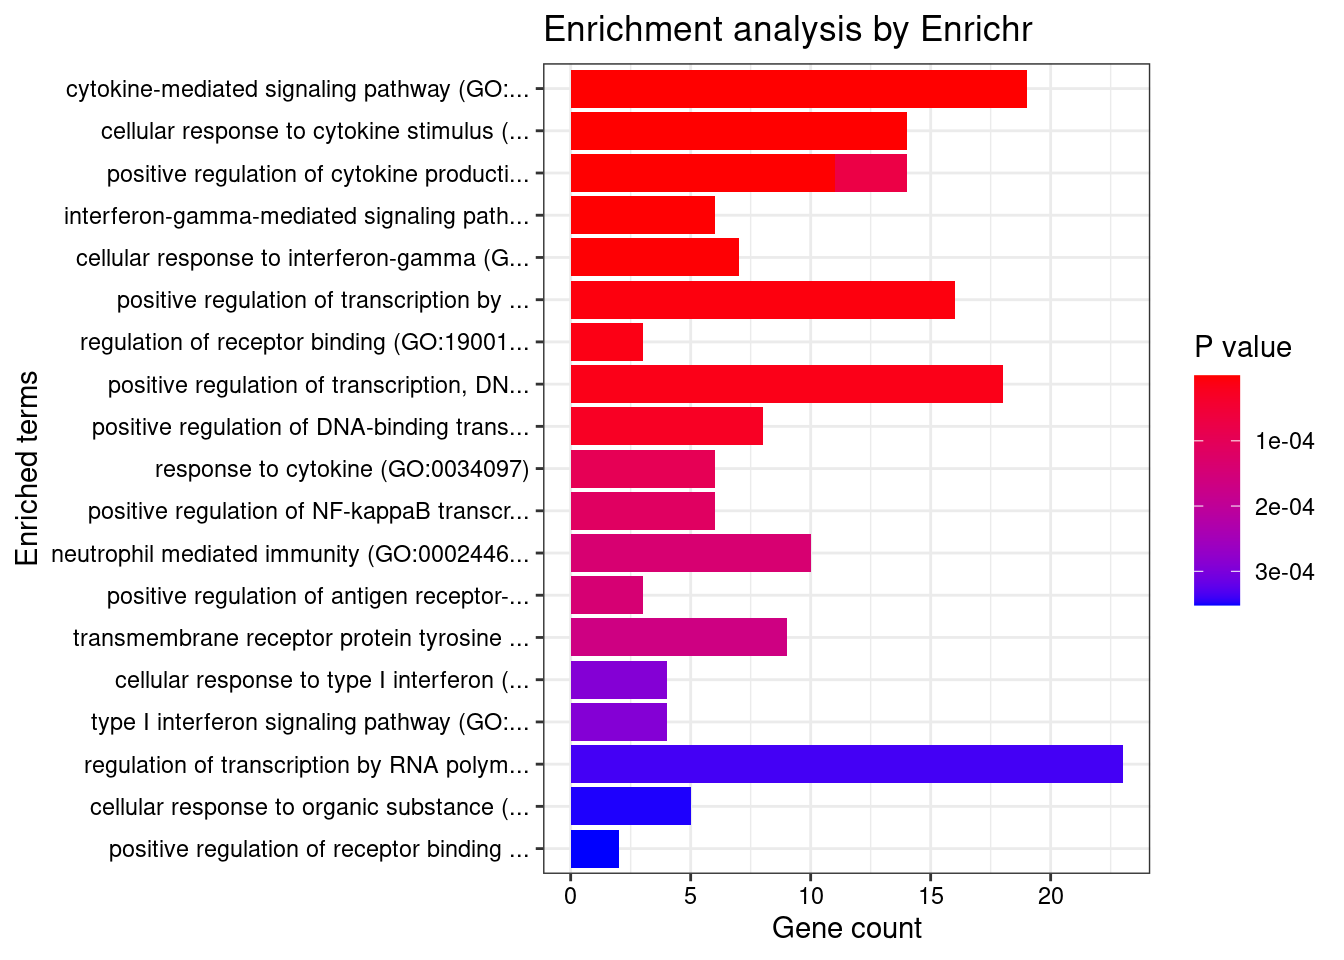
| Version | Author | Date |
|---|---|---|
| 397176f | wesleycrouse | 2022-06-10 |
GO_Cellular_Component_2021

                                       Term Overlap Adjusted.P.value                                           Genes
1          MHC protein complex (GO:0042611)    4/20     0.0002966772                    HLA-DMB;HFE;HLA-DOB;HLA-DQA1
2 MHC class II protein complex (GO:0042613)    3/13     0.0018890833                        HLA-DMB;HLA-DOB;HLA-DQA1
3   secretory granule membrane (GO:0030667)   7/274     0.0160587058 SYNGR1;TSPAN14;FCER1G;FCGR2A;SLC2A3;ITGAV;ITGAL
4    specific granule membrane (GO:0035579)    4/91     0.0313641233                      TSPAN14;SLC2A3;ITGAV;ITGAL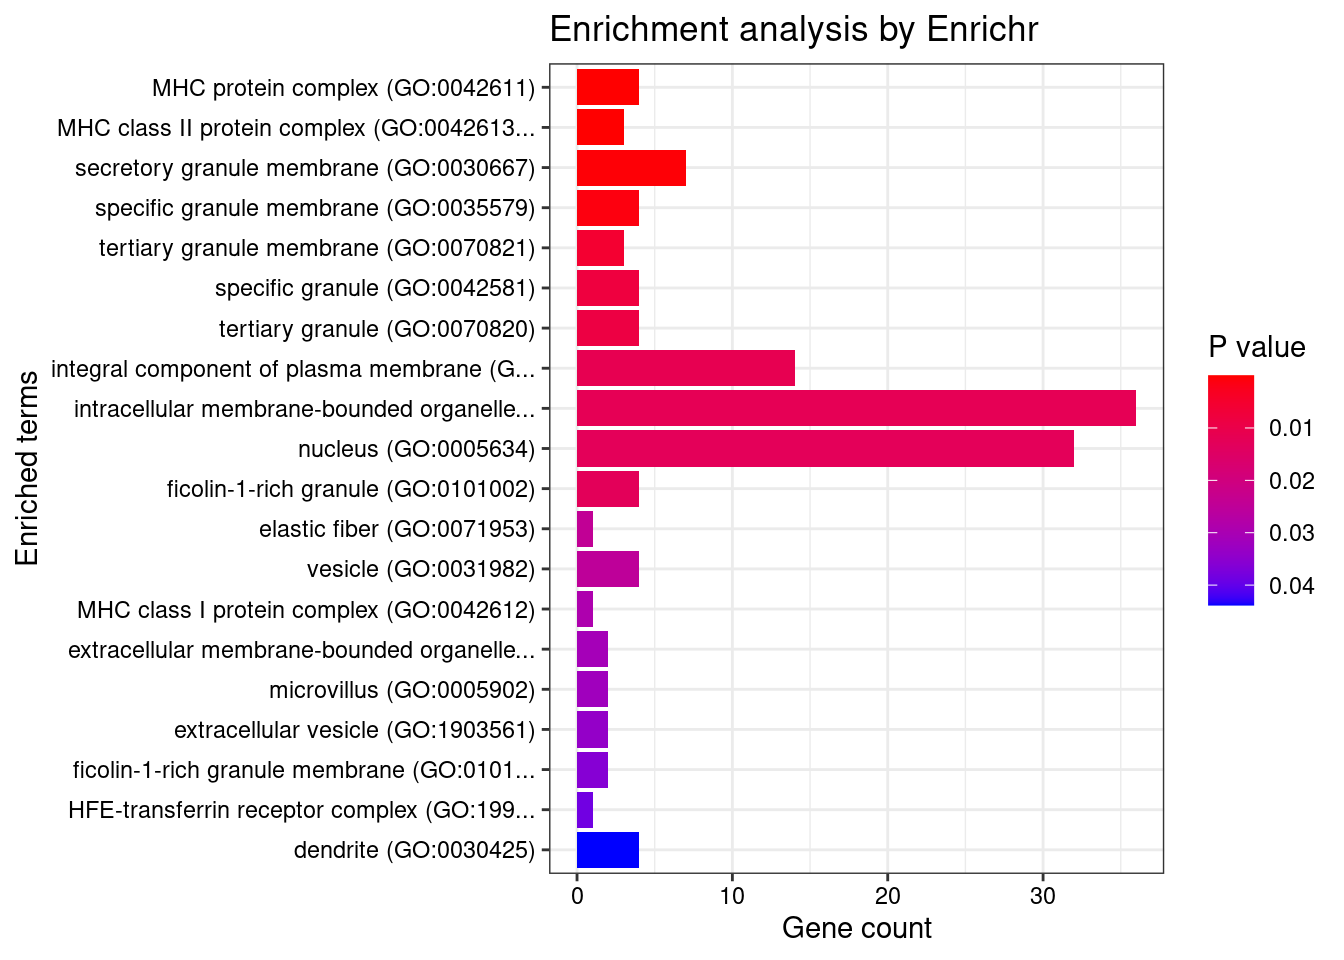
| Version | Author | Date |
|---|---|---|
| 397176f | wesleycrouse | 2022-06-10 |
GO_Molecular_Function_2021

                                                               Term Overlap Adjusted.P.value                                                                Genes
1 transcription regulatory region nucleic acid binding (GO:0001067)   7/212       0.01457666                             CIITA;SMAD3;NR5A2;STAT3;TFAM;BRD7;POU5F1
2        sequence-specific double-stranded DNA binding (GO:1990837)  12/712       0.01630229 CIITA;SMAD3;NR5A2;IRF3;HOXD1;STAT3;TFAM;IRF8;IRF6;BRD7;NKX2-3;POU5F1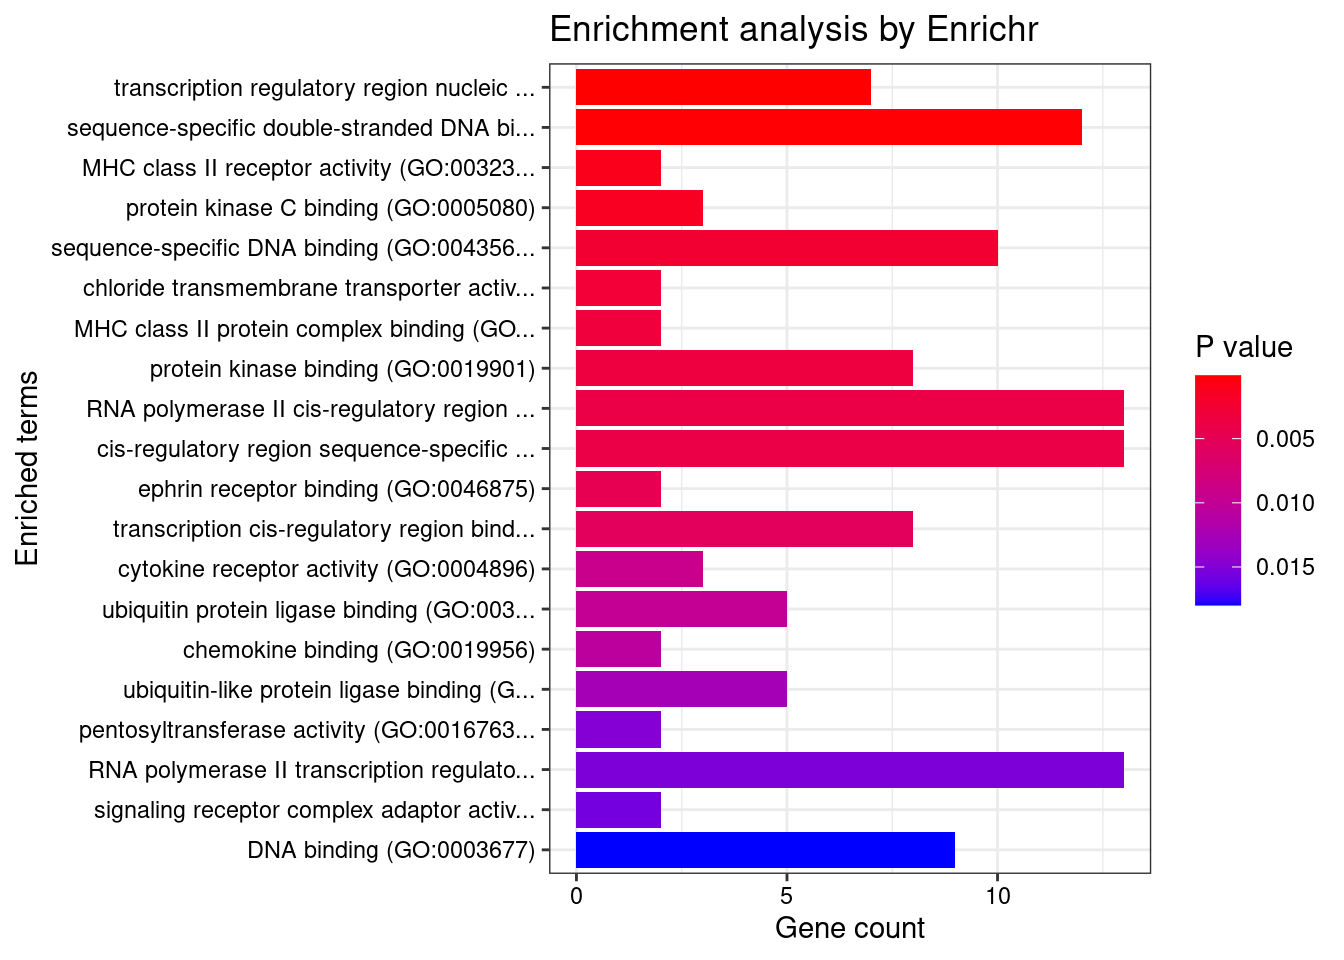
| Version | Author | Date |
|---|---|---|
| 397176f | wesleycrouse | 2022-06-10 |
KEGG
#enrichment for cTWAS genes using KEGG

library(WebGestaltR)******************************************* ** Welcome to WebGestaltR ! ** *******************************************background <- unique(unlist(lapply(df, function(x){x$gene_pips$genename})))
#listGeneSet()
databases <- c("pathway_KEGG")
enrichResult <- WebGestaltR(enrichMethod="ORA", organism="hsapiens",
interestGene=ctwas_genes, referenceGene=background,
enrichDatabase=databases, interestGeneType="genesymbol",
referenceGeneType="genesymbol", isOutput=F)Loading the functional categories...
Loading the ID list...
Loading the reference list...
Performing the enrichment analysis...enrichResult[,c("description", "size", "overlap", "FDR", "userId")] description size overlap FDR userId
1 Inflammatory bowel disease (IBD) 57 7 0.0001314914 HLA-DQA1;IL18R1;STAT3;IFNGR2;HLA-DOB;HLA-DMB;SMAD3
2 Tuberculosis 157 10 0.0001314914 HLA-DQA1;CARD9;LSP1;CIITA;FCGR2A;MAPK13;FCER1G;IFNGR2;HLA-DOB;HLA-DMB
3 Leishmaniasis 64 7 0.0001314914 HLA-DQA1;FCGR2A;MAPK13;PRKCB;IFNGR2;HLA-DOB;HLA-DMB
4 Toxoplasmosis 104 8 0.0002442145 HLA-DQA1;CIITA;MAPK13;STAT3;IFNGR2;HLA-DOB;HLA-DMB;CCR5
5 Influenza A 150 9 0.0003550225 HLA-DQA1;CIITA;MAPK13;PRKCB;IFNGR2;DDX39B;HLA-DOB;HLA-DMB;IRF3
6 Th17 cell differentiation 97 7 0.0010846400 HLA-DQA1;MAPK13;STAT3;IFNGR2;HLA-DOB;HLA-DMB;SMAD3
7 Asthma 25 4 0.0027783225 HLA-DQA1;FCER1G;HLA-DOB;HLA-DMB
8 Staphylococcus aureus infection 51 5 0.0031375672 HLA-DQA1;ITGAL;FCGR2A;HLA-DOB;HLA-DMB
9 Rheumatoid arthritis 80 5 0.0234725479 HLA-DQA1;ITGAL;CCL20;HLA-DOB;HLA-DMB
10 Th1 and Th2 cell differentiation 84 5 0.0264080328 HLA-DQA1;MAPK13;IFNGR2;HLA-DOB;HLA-DMB
11 Cell adhesion molecules (CAMs) 131 6 0.0266611231 HLA-DQA1;ITGAL;CD6;ITGAV;HLA-DOB;HLA-DMB
12 Epstein-Barr virus infection 181 7 0.0266611231 HLA-DQA1;ITGAL;MAPK13;STAT3;HLA-DOB;HLA-DMB;IRF3
13 Viral myocarditis 54 4 0.0308944017 HLA-DQA1;ITGAL;HLA-DOB;HLA-DMB
14 Rap1 signaling pathway 196 7 0.0363319789 RGS14;ITGAL;PRKD2;MAPK13;EFNA1;PRKCB;CRK
15 Antigen processing and presentation 59 4 0.0372874524 HLA-DQA1;CIITA;HLA-DOB;HLA-DMB
16 Human cytomegalovirus infection 207 7 0.0421875284 MAPK13;PRKCB;STAT3;ITGAV;CRK;IRF3;CCR5
17 Natural killer cell mediated cytotoxicity 105 5 0.0421875284 ITGAL;PRKCB;FCER1G;IFNGR2;CD244
18 Allograft rejection 32 3 0.0456612296 HLA-DQA1;HLA-DOB;HLA-DMB
19 Graft-versus-host disease 32 3 0.0456612296 HLA-DQA1;HLA-DOB;HLA-DMB
20 Herpes simplex infection 162 6 0.0465845737 HLA-DQA1;TNFRSF14;IFNGR2;HLA-DOB;HLA-DMB;IRF3DisGeNET
#enrichment for cTWAS genes using DisGeNET
# devtools::install_bitbucket("ibi_group/disgenet2r")
library(disgenet2r)
disgenet_api_key <- get_disgenet_api_key(
email = "wesleycrouse@gmail.com",
password = "uchicago1" )
Sys.setenv(DISGENET_API_KEY= disgenet_api_key)
res_enrich <- disease_enrichment(entities=ctwas_genes, vocabulary = "HGNC", database = "CURATED")RAB29 gene(s) from the input list not found in DisGeNET CURATEDNPIPB3 gene(s) from the input list not found in DisGeNET CURATEDRGS14 gene(s) from the input list not found in DisGeNET CURATEDNPEPPS gene(s) from the input list not found in DisGeNET CURATEDZNF300 gene(s) from the input list not found in DisGeNET CURATEDTTPAL gene(s) from the input list not found in DisGeNET CURATEDADAM15 gene(s) from the input list not found in DisGeNET CURATEDDDX39B gene(s) from the input list not found in DisGeNET CURATEDZGLP1 gene(s) from the input list not found in DisGeNET CURATEDTNFRSF6B gene(s) from the input list not found in DisGeNET CURATEDRNF186 gene(s) from the input list not found in DisGeNET CURATEDTSPAN14 gene(s) from the input list not found in DisGeNET CURATEDUBE2W gene(s) from the input list not found in DisGeNET CURATEDFGFR1OP gene(s) from the input list not found in DisGeNET CURATEDPRM3 gene(s) from the input list not found in DisGeNET CURATEDCPEB4 gene(s) from the input list not found in DisGeNET CURATEDPLEKHH2 gene(s) from the input list not found in DisGeNET CURATEDCDH24 gene(s) from the input list not found in DisGeNET CURATEDBIK gene(s) from the input list not found in DisGeNET CURATEDPOM121C gene(s) from the input list not found in DisGeNET CURATEDHLA-DOB gene(s) from the input list not found in DisGeNET CURATEDC10orf105 gene(s) from the input list not found in DisGeNET CURATEDOAZ3 gene(s) from the input list not found in DisGeNET CURATEDHLA-DMB gene(s) from the input list not found in DisGeNET CURATEDAPEH gene(s) from the input list not found in DisGeNET CURATEDSDCCAG3 gene(s) from the input list not found in DisGeNET CURATEDBRD7 gene(s) from the input list not found in DisGeNET CURATEDGPR132 gene(s) from the input list not found in DisGeNET CURATEDNDFIP1 gene(s) from the input list not found in DisGeNET CURATEDCRTC3 gene(s) from the input list not found in DisGeNET CURATEDOSER1 gene(s) from the input list not found in DisGeNET CURATEDCASC3 gene(s) from the input list not found in DisGeNET CURATEDif (any(res_enrich@qresult$FDR < 0.05)){
print(res_enrich@qresult[res_enrich@qresult$FDR < 0.05, c("Description", "FDR", "Ratio", "BgRatio")])
} Description FDR Ratio BgRatio
45 Ulcerative Colitis 6.212227e-09 10/66 63/9703
50 Crohn Disease 3.032380e-04 6/66 50/9703
9 Aortic Aneurysm 2.107038e-03 3/66 7/9703
98 Inflammatory Bowel Diseases 1.336939e-02 4/66 35/9703
13 Rheumatoid Arthritis 1.471359e-02 7/66 174/9703
232 Crohn's disease of large bowel 1.471359e-02 4/66 44/9703
290 Crohn's disease of the ileum 1.471359e-02 4/66 44/9703
384 Regional enteritis 1.471359e-02 4/66 44/9703
458 IIeocolitis 1.471359e-02 4/66 44/9703
110 Leukemia, T-Cell 2.753462e-02 2/66 5/9703
162 Pancreatic Neoplasm 3.186065e-02 5/66 100/9703
342 Malignant neoplasm of pancreas 3.197491e-02 5/66 102/9703
102 Lead Poisoning 4.093995e-02 2/66 7/9703
542 Juvenile pauciarticular chronic arthritis 4.093995e-02 2/66 7/9703Gene sets curated by Macarthur Lab
gene_set_dir <- "/project2/mstephens/wcrouse/gene_sets/"
gene_set_files <- c("gwascatalog.tsv",
"mgi_essential.tsv",
"core_essentials_hart.tsv",
"clinvar_path_likelypath.tsv",
"fda_approved_drug_targets.tsv")
gene_sets <- lapply(gene_set_files, function(x){as.character(read.table(paste0(gene_set_dir, x))[,1])})
names(gene_sets) <- sapply(gene_set_files, function(x){unlist(strsplit(x, "[.]"))[1]})
gene_lists <- list(ctwas_genes=ctwas_genes)
#background is union of genes analyzed in all tissue
background <- unique(unlist(lapply(df, function(x){x$gene_pips$genename})))
#genes in gene_sets filtered to ensure inclusion in background
gene_sets <- lapply(gene_sets, function(x){x[x %in% background]})
####################
hyp_score <- data.frame()
size <- c()
ngenes <- c()
for (i in 1:length(gene_sets)) {
for (j in 1:length(gene_lists)){
group1 <- length(gene_sets[[i]])
group2 <- length(as.vector(gene_lists[[j]]))
size <- c(size, group1)
Overlap <- length(intersect(gene_sets[[i]],as.vector(gene_lists[[j]])))
ngenes <- c(ngenes, Overlap)
Total <- length(background)
hyp_score[i,j] <- phyper(Overlap-1, group2, Total-group2, group1,lower.tail=F)
}
}
rownames(hyp_score) <- names(gene_sets)
colnames(hyp_score) <- names(gene_lists)
hyp_score_padj <- apply(hyp_score,2, p.adjust, method="BH", n=(nrow(hyp_score)*ncol(hyp_score)))
hyp_score_padj <- as.data.frame(hyp_score_padj)
hyp_score_padj$gene_set <- rownames(hyp_score_padj)
hyp_score_padj$nset <- size
hyp_score_padj$ngenes <- ngenes
hyp_score_padj$percent <- ngenes/size
hyp_score_padj <- hyp_score_padj[order(hyp_score_padj$ctwas_genes),]
colnames(hyp_score_padj)[1] <- "padj"
hyp_score_padj <- hyp_score_padj[,c(2:5,1)]
rownames(hyp_score_padj)<- NULL
hyp_score_padj gene_set nset ngenes percent padj
1 gwascatalog 5967 61 0.010222893 1.584903e-07
2 mgi_essential 2304 22 0.009548611 2.584673e-02
3 fda_approved_drug_targets 352 5 0.014204545 8.694548e-02
4 clinvar_path_likelypath 2771 21 0.007578492 1.329255e-01
5 core_essentials_hart 265 1 0.003773585 7.851889e-01Enrichment analysis for TWAS genes
#enrichment for TWAS genes
dbs <- c("GO_Biological_Process_2021", "GO_Cellular_Component_2021", "GO_Molecular_Function_2021")
GO_enrichment <- enrichr(twas_genes, dbs)Uploading data to Enrichr... Done.
Querying GO_Biological_Process_2021... Done.
Querying GO_Cellular_Component_2021... Done.
Querying GO_Molecular_Function_2021... Done.
Parsing results... Done.for (db in dbs){
cat(paste0(db, "\n\n"))
enrich_results <- GO_enrichment[[db]]
enrich_results <- enrich_results[enrich_results$Adjusted.P.value<0.05,c("Term", "Overlap", "Adjusted.P.value", "Genes")]
print(enrich_results)
print(plotEnrich(GO_enrichment[[db]]))
}GO_Biological_Process_2021
Term Overlap Adjusted.P.value Genes
1 cytokine-mediated signaling pathway (GO:0019221) 64/621 2.575398e-19 CSF3;CIITA;CD40;TNFRSF6B;IL23R;RORC;IL27;IFI35;IL18RAP;PSMD3;MAP3K8;JAK2;FCER1G;GPR35;IL1R1;IFNGR2;IL1R2;IL13;HLA-B;HLA-C;TYK2;HLA-G;MMP9;PSMA6;IRF1;LTA;IRF8;IRF6;HLA-DQB2;HLA-DQB1;CCL13;NUMBL;CAMK2A;PDGFB;CUL1;NOD2;IL1RL1;MUC1;BCL2L11;SOCS1;CXCR2;TNFRSF14;HLA-DQA2;CAMK2G;HLA-DQA1;IL12RB2;IP6K2;STAT5A;STAT5B;HLA-DRB5;CCL20;TNFSF15;STAT3;LIF;PSMB9;IL4;POMC;IL2RA;HLA-DPB1;HLA-DRA;TNFSF8;TRIM31;HLA-DRB1;IL18R1
2 interferon-gamma-mediated signaling pathway (GO:0060333) 20/68 1.460944e-13 CIITA;HLA-DRB5;IFNGR2;CAMK2A;HLA-B;HLA-C;HLA-G;IRF1;HLA-DPB1;IRF8;HLA-DRA;IRF6;JAK2;TRIM31;CAMK2G;HLA-DQA2;HLA-DQB2;HLA-DQA1;HLA-DRB1;HLA-DQB1
3 cellular response to interferon-gamma (GO:0071346) 24/121 1.582856e-12 CCL13;HLA-DRB5;CIITA;CCL20;IFNGR2;CAMK2A;HLA-B;HLA-C;HLA-G;AIF1;IRF1;HLA-DPB1;HLA-DRA;IRF8;IRF6;JAK2;TRIM31;HLA-DQA2;CAMK2G;HLA-DQA1;HLA-DRB1;SLC26A6;HLA-DQB2;HLA-DQB1
4 cellular response to cytokine stimulus (GO:0071345) 38/482 1.611088e-07 CCL13;CSF3;NUMBL;CD40;IL23R;GBA;RORC;AIF1;ZFP36L2;ZFP36L1;MUC1;BCL2L11;SOCS1;HYAL1;JAK2;IL12RB2;STAT5A;STAT5B;SMAD3;CCL20;IL1R1;IFNGR2;IL1R2;STAT3;IL13;LIF;TYK2;MMP9;IRGM;RHOA;IL4;POMC;IL2RA;IRF1;IRF8;SLC26A6;PTPN2;IL18R1
5 antigen processing and presentation of exogenous peptide antigen via MHC class II (GO:0019886) 16/98 1.029054e-06 HLA-DRB5;FCER1G;KIF11;HLA-DMA;HLA-DMB;HLA-DPB1;HLA-DRA;HLA-DOA;FCGR2B;HLA-DOB;HLA-DQA2;AP1M2;HLA-DQA1;HLA-DRB1;HLA-DQB2;HLA-DQB1
6 antigen processing and presentation of peptide antigen via MHC class II (GO:0002495) 16/100 1.164331e-06 HLA-DRB5;FCER1G;KIF11;HLA-DMA;HLA-DMB;HLA-DPB1;HLA-DRA;HLA-DOA;FCGR2B;HLA-DOB;HLA-DQA2;AP1M2;HLA-DQA1;HLA-DRB1;HLA-DQB2;HLA-DQB1
7 antigen processing and presentation of exogenous peptide antigen (GO:0002478) 16/103 1.556929e-06 HLA-DRB5;FCER1G;KIF11;HLA-DMA;HLA-DMB;HLA-DPB1;HLA-DRA;HLA-DOA;FCGR2B;HLA-DOB;HLA-DQA2;AP1M2;HLA-DQA1;HLA-DRB1;HLA-DQB2;HLA-DQB1
8 antigen receptor-mediated signaling pathway (GO:0050851) 19/185 5.014941e-05 DENND1B;HLA-DRB5;PRKCB;CUL1;BTNL2;LIME1;PSMB9;PSMA6;PSMD3;HLA-DPB1;HLA-DRA;PRKD2;HLA-DQA2;ICOSLG;HLA-DQA1;HLA-DRB1;LAT;HLA-DQB2;HLA-DQB1
9 positive regulation of cytokine production (GO:0001819) 26/335 7.195532e-05 PTGER4;CD40;IL23R;IL27;PARK7;NOD2;AGPAT1;LY9;AIF1;POLR2E;TNFRSF14;IL12RB2;FCER1G;IL1R1;IL13;CARD9;STAT3;HLA-G;IL4;LACC1;CD6;IRF1;HLA-DPB1;PRKD2;IL18R1;CD244
10 T cell receptor signaling pathway (GO:0050852) 17/158 9.341814e-05 DENND1B;HLA-DRB5;CUL1;BTNL2;PSMB9;PSMA6;PSMD3;HLA-DPB1;HLA-DRA;PRKD2;HLA-DQA2;ICOSLG;HLA-DQA1;HLA-DRB1;LAT;HLA-DQB2;HLA-DQB1
11 antigen processing and presentation of endogenous peptide antigen (GO:0002483) 6/14 1.306670e-04 ERAP2;TAP2;TAP1;HLA-DRA;HLA-G;HLA-DRB1
12 regulation of immune response (GO:0050776) 17/179 4.522950e-04 DENND1B;CD40;ITGA4;HLA-B;HLA-C;ICAM5;HLA-G;ADCY7;IL4;FCGR3A;NCR3;FCGR2A;IRF1;HLA-DRA;FCGR2B;HLA-DRB1;MICB
13 antigen processing and presentation of exogenous peptide antigen via MHC class I (GO:0042590) 11/78 6.171310e-04 PSMA6;FCER1G;PSMD3;HLA-B;TAP2;HLA-C;TAP1;ITGAV;LNPEP;HLA-G;PSMB9
14 peptide antigen assembly with MHC protein complex (GO:0002501) 4/6 9.965873e-04 HLA-DMA;HLA-DMB;HLA-DRA;HLA-DRB1
15 antigen processing and presentation of peptide antigen via MHC class I (GO:0002474) 7/33 2.226547e-03 FCER1G;ERAP2;HLA-B;TAP2;HLA-C;TAP1;HLA-G
16 regulation of response to interferon-gamma (GO:0060330) 5/14 2.226547e-03 SOCS1;IFNGR2;CDC37;JAK2;PTPN2
17 immune response-regulating cell surface receptor signaling pathway (GO:0002768) 5/14 2.226547e-03 BAG6;CD40;NCR3;HLA-G;MICB
18 regulation of interferon-gamma-mediated signaling pathway (GO:0060334) 6/23 2.226547e-03 SOCS1;IFNGR2;CDC37;JAK2;IRGM;PTPN2
19 regulation of T cell proliferation (GO:0042129) 10/76 2.238758e-03 IL4;HLA-DMB;CD6;IL23R;HLA-DPB1;IL27;TNFSF8;HLA-G;AIF1;HLA-DRB1
20 antigen processing and presentation of exogenous peptide antigen via MHC class I, TAP-independent (GO:0002480) 4/8 3.076211e-03 HLA-B;HLA-C;LNPEP;HLA-G
21 cellular response to tumor necrosis factor (GO:0071356) 16/194 3.076211e-03 CCL13;CD40;TNFRSF6B;TNFSF15;CCL20;GBA;ZFP36L2;PSMB9;ZFP36L1;PSMA6;HYAL1;PSMD3;LTA;TNFSF8;TNFRSF14;JAK2
22 regulation of MAP kinase activity (GO:0043405) 11/97 3.076211e-03 CD40;EDN3;RGS14;LRRK2;GBA;ERBB2;PDGFB;MST1R;NOD2;TRIB1;LIME1
23 cellular response to type I interferon (GO:0071357) 9/65 3.114431e-03 IRF1;HLA-B;HLA-C;IRF8;IFI35;TYK2;IRF6;HLA-G;IP6K2
24 type I interferon signaling pathway (GO:0060337) 9/65 3.114431e-03 IRF1;HLA-B;HLA-C;IRF8;IFI35;TYK2;IRF6;HLA-G;IP6K2
25 positive regulation of DNA-binding transcription factor activity (GO:0051091) 18/246 4.087374e-03 CD40;CSF3;CRTC3;SMAD3;PRKCB;CARD9;STAT3;CAMK2A;ARID5B;PARK7;NOD2;PSMA6;IL18RAP;HSF1;PRKD2;PLPP3;TRIM31;IL18R1
26 interleukin-23-mediated signaling pathway (GO:0038155) 4/9 4.099958e-03 IL23R;STAT3;TYK2;JAK2
27 regulation of immune effector process (GO:0002697) 8/53 4.099958e-03 C4B;C4A;C7;HLA-DRA;FCGR2B;CFB;HLA-DRB1;C2
28 regulation of B cell activation (GO:0050864) 6/28 4.816361e-03 IL4;NOD2;FCGR2B;IKZF3;ZFP36L2;ZFP36L1
29 inflammatory response (GO:0006954) 17/230 5.080170e-03 PTGER4;CCL13;CD40;CIITA;PTGIR;CCL20;STAT3;LYZ;AIF1;IL4;NCR3;HYAL1;IL2RA;CXCR2;REL;FCGR2B;LAT
30 positive regulation of transcription, DNA-templated (GO:0045893) 51/1183 5.279002e-03 CSF3;CIITA;CD40;CRTC3;ELL;THRA;RORC;PARK7;LITAF;ETS2;HHEX;NFATC2IP;MLX;RFPL1;TET2;RUNX3;POU5F1;MED24;NR5A2;DDX39B;TFR2;IRF1;IRF8;PRKD2;IRF6;ATF6B;NOTCH4;SATB2;PDGFB;NOD2;NFIL3;NSD1;HSF1;ERBB2;TNNI2;BRD7;ZNF300;STAT5B;DR1;EGR2;SMAD3;STAT3;LIF;PBX2;FOSL2;IL4;POMC;ZGLP1;REL;QRICH1;HLA-DRB1
31 antigen processing and presentation of exogenous peptide antigen via MHC class I, TAP-dependent (GO:0002479) 9/73 6.163806e-03 PSMA6;PSMD3;HLA-B;TAP2;HLA-C;TAP1;ITGAV;HLA-G;PSMB9
32 response to cytokine (GO:0034097) 13/150 7.021701e-03 CSF3;CD40;CIITA;SMAD3;IL1R1;IL23R;STAT3;RHOA;SELP;REL;JAK2;IL18R1;PTPN2
33 regulation of T cell migration (GO:2000404) 5/20 7.734834e-03 CCL20;TNFRSF14;CCR6;AIF1;RHOA
34 B cell mediated immunity (GO:0019724) 4/11 7.734834e-03 FCER1G;CARD9;FCGR2B;HLA-G
35 inositol phosphate biosynthetic process (GO:0032958) 4/11 7.734834e-03 ITPKC;IPMK;IP6K1;IP6K2
36 positive regulation of cellular respiration (GO:1901857) 4/11 7.734834e-03 IL4;PRELID1;NUPR1;PARK7
37 negative regulation of inflammatory response to antigenic stimulus (GO:0002862) 12/136 9.548103e-03 PTGER4;POMC;GPR25;FCGR3A;PTGIR;FCGR2A;PRKAR2A;GPBAR1;ADCY3;FCGR2B;ADCY7;HLA-DRB1
38 regulation of CD4-positive, alpha-beta T cell differentiation (GO:0043370) 4/12 1.077998e-02 SOCS1;HLA-DRA;RUNX3;HLA-DRB1
39 regulation of interleukin-10 production (GO:0032653) 7/48 1.081872e-02 IL4;IL23R;IL13;STAT3;NOD2;FCGR2B;HLA-DRB1
40 regulation of defense response (GO:0031347) 9/83 1.304603e-02 PSMA6;CYLD;LACC1;IL1R1;IRF1;PARK7;NOD2;JAK2;FCGR2B
41 macrophage activation (GO:0042116) 6/36 1.415865e-02 IL4;CRTC3;IL13;IFI35;JAK2;AIF1
42 cellular response to organic substance (GO:0071310) 11/123 1.415865e-02 STAT5B;CSF3;SMAD3;LRRK2;ERBB2;STAT3;PDGFB;PARK7;RHOA;IL18R1;PTPN2
43 negative regulation of inflammatory response (GO:0050728) 15/212 1.490938e-02 PTGER4;GPR25;PTGIR;IL13;GBA;GPBAR1;ADCY3;ADCY7;IL4;POMC;FCGR3A;FCGR2A;PRKAR2A;HLA-DRB1;PTPN2
44 positive regulation of transcription by RNA polymerase II (GO:0045944) 40/908 1.490938e-02 CSF3;CIITA;CD40;CRTC3;ELL;THRA;ATF6B;NOTCH4;SATB2;PDGFB;PARK7;NOD2;LITAF;HHEX;MUC1;HSF1;NFATC2IP;MLX;ZNF300;STAT5B;DR1;EGR2;SMAD3;STAT3;TET2;LIF;PBX2;POU5F1;FOSL2;IL4;POMC;MED24;NR5A2;TFR2;ZGLP1;IRF1;REL;IRF8;PRKD2;IRF6
45 regulation of tyrosine phosphorylation of STAT protein (GO:0042509) 8/68 1.490938e-02 IL4;CD40;SOCS1;IL23R;STAT3;LIF;JAK2;PTPN2
46 regulation of intracellular pH (GO:0051453) 6/37 1.502290e-02 CLN3;SLC9A4;LRRK2;SLC26A3;TM9SF4;SLC26A6
47 positive regulation of protein serine/threonine kinase activity (GO:0071902) 10/106 1.503449e-02 CD40;CCNY;EDN3;LRRK2;ERBB2;PDGFB;MST1R;NOD2;IRGM;RHOA
48 regulation of T-helper cell differentiation (GO:0045622) 3/6 1.503449e-02 HLA-DRA;IL27;HLA-DRB1
49 intracellular pH elevation (GO:0051454) 3/6 1.503449e-02 CLN3;SLC26A3;SLC26A6
50 growth hormone receptor signaling pathway via JAK-STAT (GO:0060397) 4/14 1.503449e-02 STAT5A;STAT5B;STAT3;JAK2
51 T-helper cell differentiation (GO:0042093) 4/14 1.503449e-02 PTGER4;IL4;GPR183;RORC
52 positive regulation of lymphocyte migration (GO:2000403) 4/14 1.503449e-02 CCL20;TNFRSF14;AIF1;RHOA
53 positive regulation of regulatory T cell differentiation (GO:0045591) 4/14 1.503449e-02 SOCS1;HLA-DRA;HLA-G;HLA-DRB1
54 positive regulation of T cell mediated cytotoxicity (GO:0001916) 5/26 1.865248e-02 IL23R;HLA-B;HLA-DRA;HLA-G;HLA-DRB1
55 interleukin-27-mediated signaling pathway (GO:0070106) 4/15 1.936118e-02 STAT3;IL27;TYK2;JAK2
56 negative regulation of mitotic cell cycle phase transition (GO:1901991) 9/92 1.936118e-02 PSMA6;GPR132;RFPL1;PSMD3;CUL1;BRD7;ZFP36L2;ZFP36L1;PSMB9
57 cellular response to interleukin-1 (GO:0071347) 12/155 1.936118e-02 PSMA6;CCL13;CD40;IL1R1;HYAL1;CCL20;IL1R2;PSMD3;CUL1;MAP3K8;NOD2;PSMB9
58 response to glucocorticoid (GO:0051384) 5/27 1.936118e-02 BCL2L11;GOT1;ZFP36L2;UBE2L3;ZFP36L1
59 negative regulation of immune response (GO:0050777) 13/178 1.936118e-02 PTGER4;GPR25;PTGIR;GPBAR1;ADCY3;HLA-G;ADCY7;POMC;FCGR3A;FCGR2A;PRKAR2A;FCGR2B;HLA-DRB1
60 positive regulation of interferon-gamma production (GO:0032729) 7/57 1.936118e-02 IL1R1;IL23R;HLA-DPB1;IL27;CD244;IL18R1;IL12RB2
61 antigen processing and presentation of endogenous peptide antigen via MHC class I via ER pathway (GO:0002484) 3/7 1.936118e-02 HLA-B;HLA-C;HLA-G
62 antigen processing and presentation of endogenous peptide antigen via MHC class I via ER pathway, TAP-independent (GO:0002486) 3/7 1.936118e-02 HLA-B;HLA-C;HLA-G
63 cellular response to interleukin-18 (GO:0071351) 3/7 1.936118e-02 IL18RAP;PDGFB;IL18R1
64 regulation of T cell tolerance induction (GO:0002664) 3/7 1.936118e-02 IL2RA;HLA-B;HLA-G
65 interleukin-18-mediated signaling pathway (GO:0035655) 3/7 1.936118e-02 IL18RAP;PDGFB;IL18R1
66 T-helper 17 cell differentiation (GO:0072539) 3/7 1.936118e-02 STAT3;RORC;LY9
67 nucleotide-binding oligomerization domain containing 2 signaling pathway (GO:0070431) 3/7 1.936118e-02 LACC1;NOD2;IRGM
68 positive regulation of lymphocyte proliferation (GO:0050671) 8/75 1.941130e-02 IL4;CD40;HLA-DMB;CD6;IL23R;GPR183;HLA-DPB1;AIF1
69 cellular response to corticosteroid stimulus (GO:0071384) 4/16 1.962930e-02 BCL2L11;ZFP36L2;UBE2L3;ZFP36L1
70 dendritic cell chemotaxis (GO:0002407) 4/16 1.962930e-02 CXCR1;GPR183;CXCR2;CCR6
71 polyol biosynthetic process (GO:0046173) 4/16 1.962930e-02 ITPKC;IPMK;IP6K1;IP6K2
72 nucleotide-binding oligomerization domain containing signaling pathway (GO:0070423) 5/28 2.007826e-02 CYLD;LACC1;NOD2;AAMP;IRGM
73 regulation of inflammatory response to antigenic stimulus (GO:0002861) 11/137 2.062310e-02 PTGER4;POMC;GPR25;FCGR3A;PTGIR;FCGR2A;PRKAR2A;GPBAR1;ADCY3;ADCY7;HLA-DRB1
74 tumor necrosis factor-mediated signaling pathway (GO:0033209) 10/116 2.062310e-02 PSMA6;CD40;TNFRSF6B;TNFSF15;PSMD3;LTA;TNFRSF14;TNFSF8;JAK2;PSMB9
75 regulation of inflammatory response (GO:0050727) 14/206 2.062310e-02 PTGER4;IL1R1;IL13;GBA;IFI35;PARK7;NOD2;MMP9;IL4;CYLD;LACC1;PSMA6;JAK2;PTPN2
76 positive regulation of leukocyte mediated cytotoxicity (GO:0001912) 6/43 2.080157e-02 NCR3;IL23R;HLA-B;HLA-DRA;HLA-G;HLA-DRB1
77 positive regulation of T cell differentiation (GO:0045582) 6/43 2.080157e-02 IL4;SOCS1;IL23R;HLA-DRA;HLA-G;HLA-DRB1
78 regulation of T cell mediated cytotoxicity (GO:0001914) 5/29 2.195013e-02 IL23R;HLA-B;HLA-DRA;HLA-G;HLA-DRB1
79 positive regulation of cytokine production involved in inflammatory response (GO:1900017) 4/17 2.262730e-02 CD6;CARD9;STAT3;NOD2
80 antigen processing and presentation of endogenous peptide antigen via MHC class I (GO:0019885) 3/8 2.400139e-02 ERAP2;TAP2;TAP1
81 regulation of apoptotic cell clearance (GO:2000425) 3/8 2.400139e-02 C4B;C4A;C2
82 positive regulation of apoptotic cell clearance (GO:2000427) 3/8 2.400139e-02 C4B;C4A;C2
83 positive regulation of CD4-positive, alpha-beta T cell differentiation (GO:0043372) 3/8 2.400139e-02 SOCS1;HLA-DRA;HLA-DRB1
84 positive regulation of MHC class II biosynthetic process (GO:0045348) 3/8 2.400139e-02 IL4;CIITA;JAK2
85 response to interferon-gamma (GO:0034341) 8/80 2.400139e-02 CCL13;CD40;CIITA;CCL20;IL23R;IRF8;AIF1;SLC26A6
86 cellular response to glucocorticoid stimulus (GO:0071385) 4/18 2.561649e-02 BCL2L11;ZFP36L2;UBE2L3;ZFP36L1
87 dendritic cell migration (GO:0036336) 4/18 2.561649e-02 CXCR1;GPR183;CXCR2;CCR6
88 positive regulation of response to endoplasmic reticulum stress (GO:1905898) 4/18 2.561649e-02 BAG6;BCL2L11;FCGR2B;BOK
89 regulation of cellular pH (GO:0030641) 5/31 2.644237e-02 CLN3;LACC1;SLC9A4;TM9SF4;SLC26A6
90 phosphorylation (GO:0016310) 21/400 2.733781e-02 PRRT1;BRD2;CERKL;DGKD;PRKCB;LRRK2;STAT3;CAMK2A;PDGFB;STK19;TYK2;RUNX3;CLK2;STK25;GRK6;ERBB2;PRKD2;COQ8B;JAK2;TRIB1;NADK
91 neutrophil mediated immunity (GO:0002446) 24/488 2.948127e-02 RAB5C;FCER1G;RNASET2;CARD9;HSPA6;HLA-B;HLA-C;NBEAL2;LYZ;APEH;MMP9;RHOA;TSPAN14;SYNGR1;FCGR2A;CXCR1;PLAU;PSMD3;TMBIM1;NEU1;CXCR2;ORMDL3;ITGAV;ATP6V0A1
92 transmembrane receptor protein tyrosine kinase signaling pathway (GO:0007169) 21/404 2.948127e-02 DDR1;ATP6V1G2;RGS14;STAT3;MST1;PDGFB;MST1R;MMP9;RHOA;EFNA1;GIGYF1;EFNA3;ARPC2;ERBB2;POLR2E;PRKD2;ITGAV;JAK2;AAMP;PTPN2;ATP6V0A1
93 cellular response to interleukin-7 (GO:0098761) 4/19 2.948127e-02 STAT5A;STAT5B;SOCS1;STAT3
94 regulation of lymphocyte proliferation (GO:0050670) 4/19 2.948127e-02 LST1;IL27;TNFSF8;IKZF3
95 interleukin-7-mediated signaling pathway (GO:0038111) 4/19 2.948127e-02 STAT5A;STAT5B;SOCS1;STAT3
96 cellular response to interleukin-9 (GO:0071355) 3/9 3.062923e-02 STAT5A;STAT5B;STAT3
97 interleukin-9-mediated signaling pathway (GO:0038113) 3/9 3.062923e-02 STAT5A;STAT5B;STAT3
98 positive regulation of memory T cell differentiation (GO:0043382) 3/9 3.062923e-02 IL23R;HLA-DRA;HLA-DRB1
99 positive regulation of T cell proliferation (GO:0042102) 7/66 3.093312e-02 IL4;HLA-DMB;CD6;IL23R;HLA-DPB1;AIF1;ICOSLG
100 regulation of interferon-gamma production (GO:0032649) 8/86 3.289562e-02 IL1R1;IL23R;HLA-DPB1;IL27;CD244;HLA-DRB1;IL18R1;IL12RB2
101 regulation of lymphocyte differentiation (GO:0045619) 4/20 3.366603e-02 PRELID1;IKZF3;ZFP36L2;ZFP36L1
102 growth hormone receptor signaling pathway (GO:0060396) 4/20 3.366603e-02 STAT5A;STAT5B;STAT3;JAK2
103 MAPK cascade (GO:0000165) 17/303 3.551101e-02 PTGER4;LRRK2;CAMK2A;PDGFB;CUL1;ZFP36L2;PSMB9;ZFP36L1;PSMA6;IL2RA;PSMD3;HSF1;ERBB2;MAP3K8;ITGAV;JAK2;LAT
104 regulation of response to external stimulus (GO:0032101) 10/130 3.551101e-02 CYLD;LACC1;PSMA6;IL1R1;IRF1;SAG;PARK7;NOD2;JAK2;FCGR2B
105 positive regulation of MAP kinase activity (GO:0043406) 7/69 3.795606e-02 CD40;EDN3;LRRK2;ERBB2;PDGFB;MST1R;NOD2
106 response to endoplasmic reticulum stress (GO:0034976) 9/110 3.827878e-02 BAG6;BCL2L11;ATF6B;SEC16A;ATP2A1;QRICH1;RNF186;RNF5;USP19
107 positive regulation of T cell cytokine production (GO:0002726) 4/21 3.827878e-02 IL4;DENND1B;IL1R1;IL18R1
108 regulation of epithelial cell apoptotic process (GO:1904035) 3/10 3.827878e-02 NUPR1;BOK;ZFP36L1
109 regulation of memory T cell differentiation (GO:0043380) 3/10 3.827878e-02 IL23R;HLA-DRA;HLA-DRB1
110 immunoglobulin mediated immune response (GO:0016064) 3/10 3.827878e-02 FCER1G;CARD9;FCGR2B
111 positive regulation of peptidyl-tyrosine phosphorylation (GO:0050731) 10/134 4.179079e-02 EFNA1;IL4;CSF3;CD40;IL23R;STAT3;PDGFB;LIF;TNFRSF14;JAK2
112 positive regulation of myeloid leukocyte differentiation (GO:0002763) 5/36 4.181099e-02 IL23R;HSF1;LIF;HLA-DRB1;ZFP36L1
113 positive regulation of T cell mediated immunity (GO:0002711) 5/36 4.181099e-02 IL23R;HLA-B;HLA-DRA;HLA-G;HLA-DRB1
114 positive regulation of phagocytosis (GO:0050766) 6/53 4.288916e-02 C4B;C4A;FCER1G;LMAN2;FCGR2B;C2
115 neutrophil degranulation (GO:0043312) 23/481 4.288916e-02 RAB5C;FCER1G;RNASET2;HSPA6;HLA-B;HLA-C;NBEAL2;LYZ;APEH;MMP9;RHOA;TSPAN14;SYNGR1;FCGR2A;CXCR1;PLAU;PSMD3;TMBIM1;NEU1;CXCR2;ORMDL3;ITGAV;ATP6V0A1
116 regulation of endoplasmic reticulum stress-induced intrinsic apoptotic signaling pathway (GO:1902235) 4/22 4.300318e-02 BCL2L11;LRRK2;PARK7;BOK
117 regulation of humoral immune response (GO:0002920) 6/54 4.605854e-02 C4B;C4A;C7;FCGR2B;CFB;C2
118 regulation of epithelial cell proliferation (GO:0050678) 8/93 4.605854e-02 GPX1;HYAL1;ERBB2;NUPR1;NOD2;FUT2;RUNX3;ZFP36L1
119 neutrophil activation involved in immune response (GO:0002283) 23/485 4.605854e-02 RAB5C;FCER1G;RNASET2;HSPA6;HLA-B;HLA-C;NBEAL2;LYZ;APEH;MMP9;RHOA;TSPAN14;SYNGR1;FCGR2A;CXCR1;PLAU;PSMD3;TMBIM1;NEU1;CXCR2;ORMDL3;ITGAV;ATP6V0A1
120 response to molecule of bacterial origin (GO:0002237) 7/73 4.615042e-02 C4B;SELP;CD6;IL23R;JAK2;TRIB1;FCGR2B
121 cellular response to interleukin-2 (GO:0071352) 3/11 4.622157e-02 STAT5A;STAT5B;IL2RA
122 interleukin-2-mediated signaling pathway (GO:0038110) 3/11 4.622157e-02 STAT5A;STAT5B;IL2RA
123 interleukin-35-mediated signaling pathway (GO:0070757) 3/11 4.622157e-02 STAT3;JAK2;IL12RB2
124 interleukin-1-mediated signaling pathway (GO:0070498) 8/94 4.664045e-02 PSMA6;IL1R1;IL1R2;PSMD3;CUL1;MAP3K8;NOD2;PSMB9
125 ERK1 and ERK2 cascade (GO:0070371) 4/23 4.664045e-02 PTGER4;ITGAV;ZFP36L2;ZFP36L1
126 regulation of supramolecular fiber organization (GO:1902903) 4/23 4.664045e-02 EFEMP2;GPX1;PARK7;CAMSAP2
127 positive regulation of interleukin-17 production (GO:0032740) 4/23 4.664045e-02 IL23R;CARD9;NOD2;LY9
128 regulation of cytokine-mediated signaling pathway (GO:0001959) 7/74 4.680327e-02 CYLD;SOCS1;IFNGR2;CDC37;JAK2;AGPAT1;PTPN2
129 positive regulation of immune response (GO:0050778) 7/75 4.978187e-02 HLA-DMB;IL23R;HLA-DRA;IFI35;NOD2;FCGR2B;HLA-DRB1
130 positive regulation of T cell activation (GO:0050870) 7/75 4.978187e-02 IL4;HLA-DMB;CD6;IL23R;HLA-DPB1;NOD2;AIF1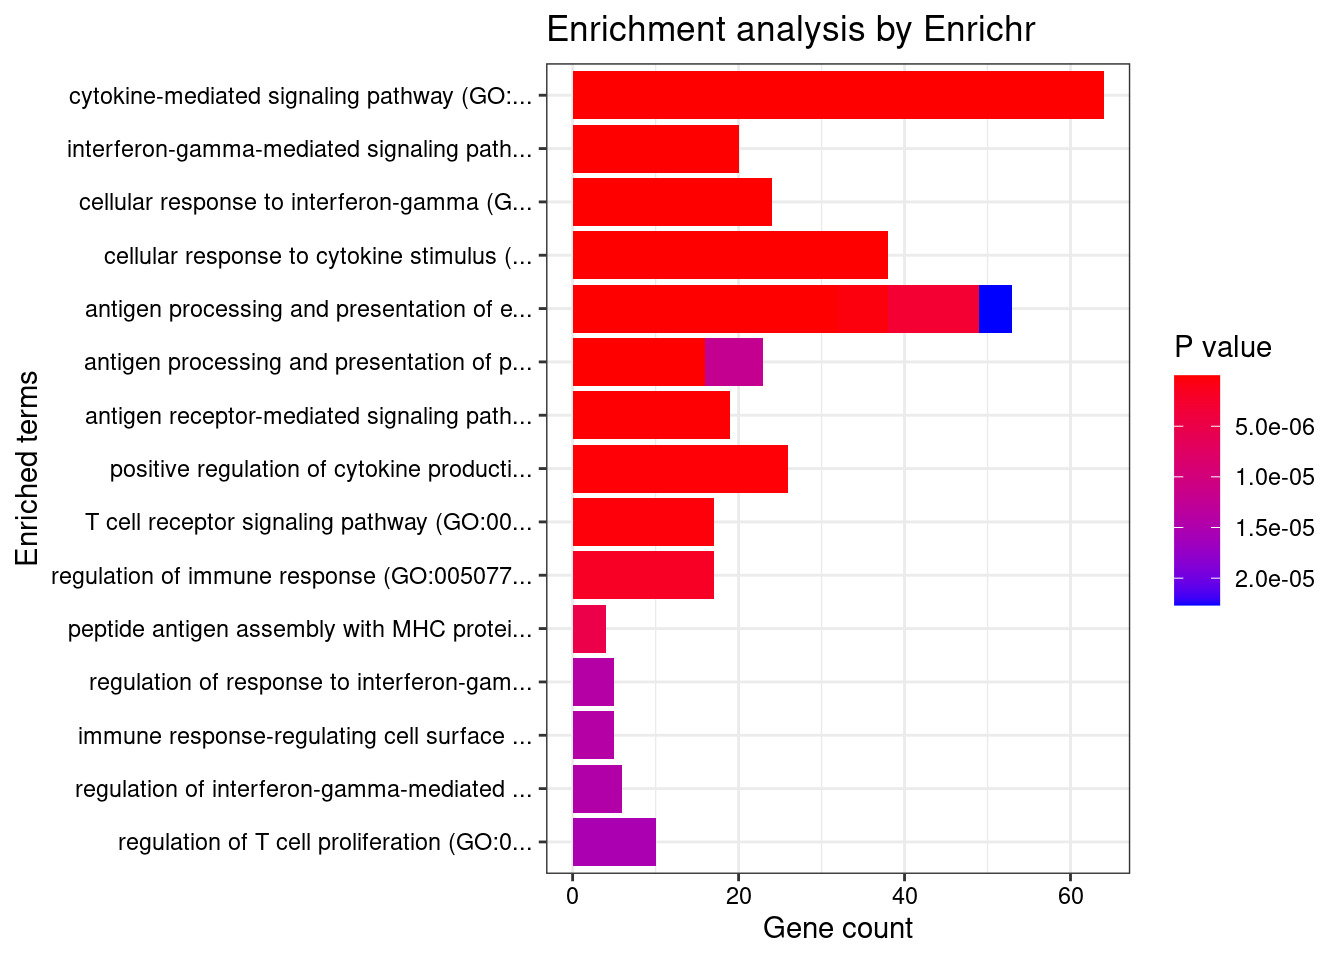
| Version | Author | Date |
|---|---|---|
| 397176f | wesleycrouse | 2022-06-10 |
GO_Cellular_Component_2021
Term Overlap Adjusted.P.value Genes
1 MHC protein complex (GO:0042611) 13/20 1.492530e-14 HLA-DRB5;HLA-B;HLA-C;HLA-DMA;HLA-DMB;HLA-DPB1;HLA-DRA;HLA-DOA;HLA-DOB;HLA-DQA1;HLA-DQB2;HLA-DRB1;HLA-DQB1
2 MHC class II protein complex (GO:0042613) 11/13 1.492530e-14 HLA-DRB5;HLA-DMA;HLA-DMB;HLA-DPB1;HLA-DRA;HLA-DOA;HLA-DOB;HLA-DQA1;HLA-DQB2;HLA-DRB1;HLA-DQB1
3 integral component of lumenal side of endoplasmic reticulum membrane (GO:0071556) 11/28 1.475484e-09 HLA-DRB5;HLA-B;HLA-DPB1;HLA-C;HLA-DRA;HLA-DQA2;HLA-G;HLA-DQA1;HLA-DQB2;HLA-DRB1;HLA-DQB1
4 lumenal side of endoplasmic reticulum membrane (GO:0098553) 11/28 1.475484e-09 HLA-DRB5;HLA-B;HLA-DPB1;HLA-C;HLA-DRA;HLA-DQA2;HLA-G;HLA-DQA1;HLA-DQB2;HLA-DRB1;HLA-DQB1
5 coated vesicle membrane (GO:0030662) 13/55 2.589125e-08 HLA-DRB5;SEC16A;HLA-B;HLA-C;HLA-G;HLA-DPB1;HLA-DRA;KDELR2;HLA-DQA2;HLA-DQB2;HLA-DQA1;HLA-DRB1;HLA-DQB1
6 ER to Golgi transport vesicle membrane (GO:0012507) 12/54 2.150248e-07 HLA-DRB5;SEC16A;HLA-B;HLA-DPB1;HLA-C;HLA-DRA;HLA-G;HLA-DQA2;HLA-DQB2;HLA-DQA1;HLA-DRB1;HLA-DQB1
7 COPII-coated ER to Golgi transport vesicle (GO:0030134) 14/79 2.248684e-07 HLA-DRB5;SEC16A;HLA-B;HLA-C;HLA-G;LMAN2;HLA-DPB1;HLA-DRA;HLA-DQA2;TMED5;HLA-DQB2;HLA-DQA1;HLA-DRB1;HLA-DQB1
8 transport vesicle membrane (GO:0030658) 12/60 5.761257e-07 HLA-DRB5;SEC16A;HLA-B;HLA-DPB1;HLA-C;HLA-DRA;HLA-G;HLA-DQA2;HLA-DQB2;HLA-DQA1;HLA-DRB1;HLA-DQB1
9 lysosome (GO:0005764) 32/477 7.444692e-06 RAB5C;LRRK2;GBA;LITAF;CLN3;HLA-DMA;HLA-DMB;NAGLU;HYAL1;NEU1;CXCR2;HLA-DOA;HLA-DQA2;HLA-DOB;HLA-DQA1;AP1M2;ATP6V0A1;STARD3;HLA-DRB5;USP4;RNASET2;LNPEP;GALC;SYT11;TMBIM1;HLA-DPB1;SPNS1;CSPG5;HLA-DRA;HLA-DRB1;HLA-DQB2;HLA-DQB1
10 lytic vacuole membrane (GO:0098852) 22/267 1.796284e-05 STARD3;HLA-DRB5;RAB5C;GBA;LNPEP;LITAF;CLN3;HLA-DMA;HLA-DMB;TMBIM1;HLA-DPB1;SPNS1;HLA-DRA;HLA-DOA;HLA-DQA2;HLA-DOB;HLA-DQA1;HLA-DRB1;HLA-DQB2;AP1M2;ATP6V0A1;HLA-DQB1
11 endocytic vesicle membrane (GO:0030666) 16/158 3.759403e-05 HLA-DRB5;CAMK2A;HLA-B;TAP2;HLA-C;TAP1;HLA-G;HLA-DPB1;HLA-DRA;HLA-DQA2;CAMK2G;HLA-DQA1;HLA-DRB1;HLA-DQB2;ATP6V0A1;HLA-DQB1
12 integral component of endoplasmic reticulum membrane (GO:0030176) 15/142 4.269762e-05 HLA-DRB5;ATF6B;HLA-B;TAP2;HLA-C;TAP1;HLA-G;CLN3;HLA-DPB1;HLA-DRA;HLA-DQA2;HLA-DQA1;HLA-DRB1;HLA-DQB2;HLA-DQB1
13 trans-Golgi network membrane (GO:0032588) 12/99 9.902387e-05 ARFRP1;HLA-DRB5;HLA-DPB1;HLA-DRA;HLA-DQA2;SCAMP3;AP1M2;HLA-DQA1;HLA-DRB1;HLA-DQB2;BOK;HLA-DQB1
14 lysosomal membrane (GO:0005765) 23/330 1.244228e-04 STARD3;HLA-DRB5;RAB5C;GBA;LNPEP;LITAF;CLN3;SYNGR1;HLA-DMA;HLA-DMB;TMBIM1;HLA-DPB1;SPNS1;HLA-DRA;HLA-DOA;HLA-DQA2;HLA-DOB;HLA-DQA1;HLA-DRB1;HLA-DQB2;AP1M2;ATP6V0A1;HLA-DQB1
15 bounding membrane of organelle (GO:0098588) 37/767 1.114380e-03 GPSM1;NOTCH4;CAMK2A;PDGFB;ATP2A1;FUT2;CLN3;CXCR1;LMAN2;ORMDL3;CXCR2;ERBB2;HLA-DQA2;CAMK2G;HLA-DQA1;AP1M2;BOK;ATP6V0A1;HLA-DRB5;TAP2;HLA-B;TAP1;HLA-C;B3GALT6;HLA-G;IRGM;RHOA;FCGR2A;TMBIM1;HLA-DPB1;HLA-DRA;CSPG5;KDELR2;PLPP3;HLA-DRB1;HLA-DQB2;HLA-DQB1
16 trans-Golgi network (GO:0005802) 17/239 1.313816e-03 HLA-DRB5;GBA;SCAMP3;ARFRP1;CLN3;SYT11;HLA-DPB1;RAB29;HLA-DRA;PLPP3;HLA-DQA2;HLA-DQA1;HLA-DRB1;HLA-DQB2;AP1M2;HLA-DQB1;BOK
17 secretory granule membrane (GO:0030667) 18/274 2.007234e-03 FCER1G;RAB5C;HLA-B;HLA-C;NBEAL2;RHOA;SELP;SYNGR1;TSPAN14;FCGR2A;CXCR1;PLAU;CXCR2;ORMDL3;TMBIM1;ITGAV;LY6G6F;ATP6V0A1
18 integral component of plasma membrane (GO:0005887) 58/1454 2.007234e-03 DDR1;GPR25;CNTNAP1;CD40;GPR65;IL23R;ICAM5;SLC7A10;FCRLA;FCGR3A;IL18RAP;ITGAV;CCR6;PTGIR;FCER1G;GPR35;IL1R1;IFNGR2;HLA-B;HLA-C;NCR3;TFR2;CDHR4;PLPP3;SLC22A4;NOTCH4;ADCY3;SEMA3F;MST1R;ADCY7;MUC1;C7;LMAN2;CXCR2;ERBB2;SLC38A3;HLA-DQA2;HLA-DQA1;IL12RB2;GABBR1;KCNJ11;TNFSF15;LNPEP;SELP;SLC6A7;TSPAN14;FCGR2A;CD6;GPR183;IL2RA;HLA-DRA;CSPG5;TNFSF8;FCGR2B;SLC26A3;HLA-DRB1;SLC26A6;IL18R1
19 cytoplasmic vesicle membrane (GO:0030659) 22/380 2.299150e-03 HLA-DRB5;CAMK2A;HLA-B;HLA-C;RHOA;FCGR2A;CXCR1;CXCR2;ORMDL3;TMBIM1;ERBB2;HLA-DPB1;CSPG5;HLA-DRA;HLA-DQA2;CAMK2G;HLA-DQA1;HLA-DRB1;HLA-DQB2;AP1M2;ATP6V0A1;HLA-DQB1
20 endocytic vesicle (GO:0030139) 14/189 2.865650e-03 HLA-DRB5;RAB5C;CAMK2A;NOD2;SYT11;HLA-DPB1;HLA-DRA;ITGAV;HLA-DQA2;CAMK2G;HLA-DQA1;HLA-DRB1;HLA-DQB2;HLA-DQB1
21 clathrin-coated endocytic vesicle membrane (GO:0030669) 8/69 3.138292e-03 HLA-DRB5;HLA-DPB1;HLA-DRA;HLA-DQA2;HLA-DQB2;HLA-DQA1;HLA-DRB1;HLA-DQB1
22 Golgi membrane (GO:0000139) 24/472 6.888966e-03 GPSM1;HLA-DRB5;NOTCH4;PDGFB;HLA-B;HLA-C;B3GALT6;FUT2;HLA-G;IRGM;SCAMP3;ARFRP1;CLN3;LMAN2;HLA-DPB1;HLA-DRA;KDELR2;HLA-DQA2;HLA-DQA1;HLA-DRB1;HLA-DQB2;AP1M2;HLA-DQB1;BOK
23 phagocytic vesicle membrane (GO:0030670) 6/45 7.755802e-03 HLA-B;TAP2;HLA-C;TAP1;HLA-G;ATP6V0A1
24 phagocytic vesicle (GO:0045335) 9/100 7.755802e-03 SYT11;HLA-B;TAP2;HLA-C;TAP1;ITGAV;NOD2;HLA-G;ATP6V0A1
25 clathrin-coated endocytic vesicle (GO:0045334) 8/85 1.081206e-02 HLA-DRB5;HLA-DPB1;HLA-DRA;HLA-DQA2;HLA-DQB2;HLA-DQA1;HLA-DRB1;HLA-DQB1
26 late endosome membrane (GO:0031902) 7/68 1.247464e-02 STARD3;HLA-DMA;HLA-DRB5;HLA-DMB;HLA-DRA;LITAF;HLA-DRB1
27 clathrin-coated vesicle membrane (GO:0030665) 8/90 1.451035e-02 HLA-DRB5;HLA-DPB1;HLA-DRA;HLA-DQA2;HLA-DQB2;HLA-DQA1;HLA-DRB1;HLA-DQB1
28 early endosome membrane (GO:0031901) 8/97 2.251082e-02 CLN3;RAB5C;HLA-B;HLA-C;HLA-G;LITAF;SNX20;BOK
29 endosome membrane (GO:0010008) 17/325 2.337445e-02 STARD3;HLA-DRB5;RAB5C;HLA-B;HLA-C;HLA-G;SNX20;SCAMP3;CLN3;HLA-DMA;HLA-DMB;TMBIM1;ERBB2;HLA-DRA;HLA-DRB1;ATP6V0A1;BOK
30 recycling endosome (GO:0055037) 10/145 2.449080e-02 CLN3;SYT11;HLA-B;RAB29;HLA-C;TUBG1;HLA-G;PDLIM4;SCAMP3;BOK
31 early endosome lumen (GO:0031905) 2/5 4.471680e-02 LNPEP;PDLIM4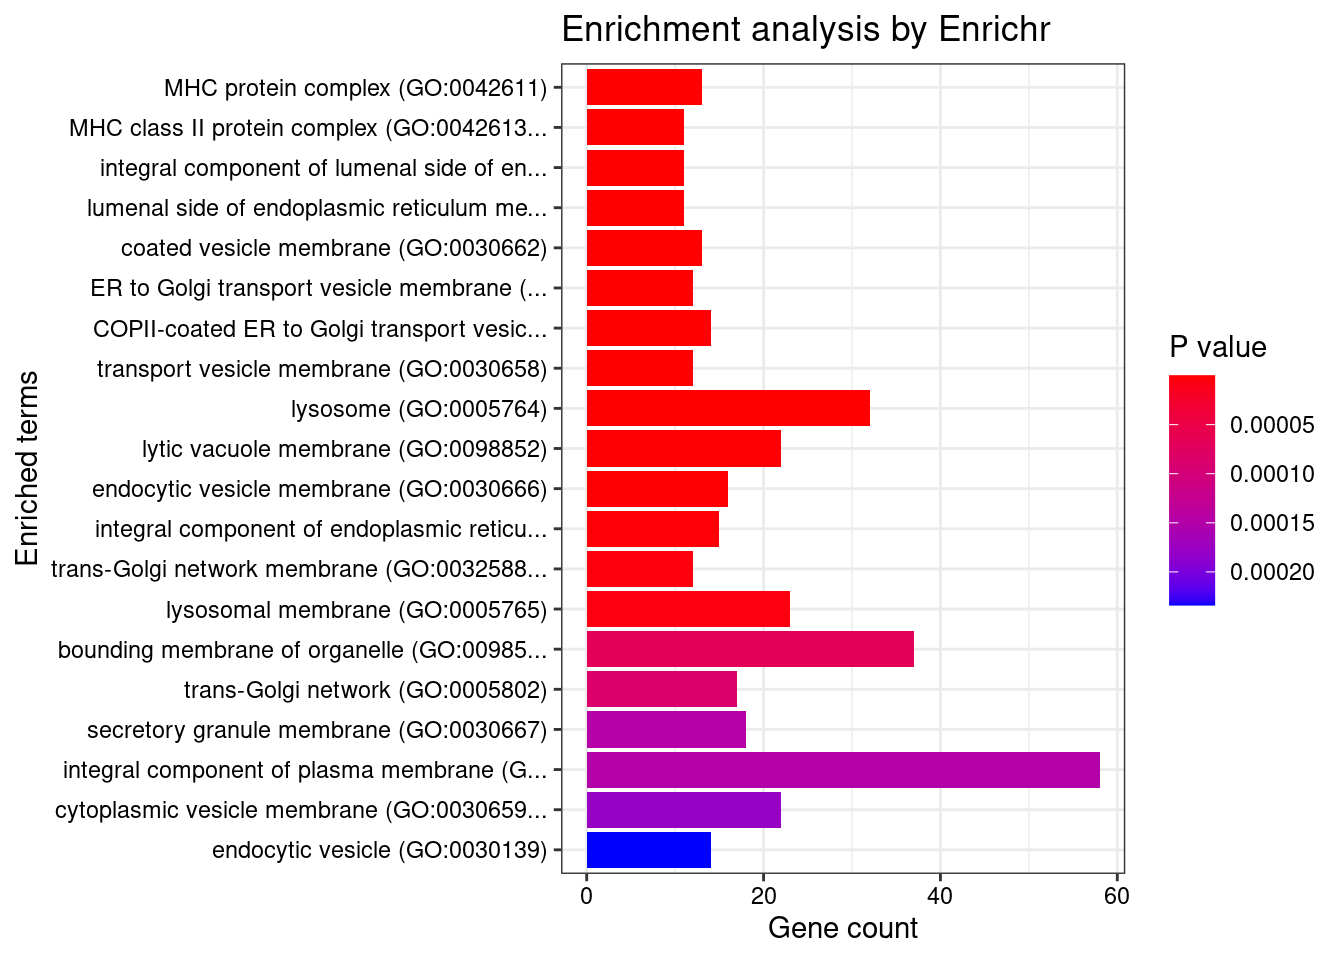
| Version | Author | Date |
|---|---|---|
| 397176f | wesleycrouse | 2022-06-10 |
GO_Molecular_Function_2021
Term Overlap Adjusted.P.value Genes
1 MHC class II receptor activity (GO:0032395) 8/10 2.266833e-09 HLA-DRA;HLA-DOA;HLA-DOB;HLA-DQA2;HLA-DQA1;HLA-DQB2;HLA-DRB1;HLA-DQB1
2 MHC class II protein complex binding (GO:0023026) 6/17 4.463103e-04 HLA-DMA;HLA-DMB;HLA-DRA;HLA-DOA;HLA-DOB;HLA-DRB1
3 cytokine receptor activity (GO:0004896) 11/88 1.417601e-03 IL1RL1;IL18RAP;CXCR1;IL1R1;IL23R;IFNGR2;IL1R2;IL2RA;CCR6;IL18R1;IL12RB2
4 kinase activity (GO:0016301) 11/112 1.031843e-02 CERKL;ITPKC;DGKD;LRRK2;IPMK;CAMK2A;COQ8B;IP6K1;NADK;COASY;IP6K2
5 C-X-C chemokine receptor activity (GO:0016494) 3/5 1.233223e-02 CXCR1;GPR35;CXCR2
6 inositol hexakisphosphate kinase activity (GO:0000828) 3/8 4.694422e-02 ITPKC;IP6K1;IP6K2
7 transcription regulatory region nucleic acid binding (GO:0001067) 14/212 4.694422e-02 EGR2;CIITA;SMAD3;THRA;ATF6B;STAT3;ARID5B;POU5F1;HHEX;NR5A2;PER3;IRF1;HSF1;BRD7
8 ubiquitin protein ligase binding (GO:0031625) 16/265 4.694422e-02 EGR2;CD40;SMAD3;HSPA1L;CUL2;HSPA6;CUL1;CASC3;SCAMP3;POU5F1;UBE2L3;BAG6;SYT11;PRKAR2A;TNFRSF14;TRIB1
9 chemokine binding (GO:0019956) 5/32 4.872107e-02 CXCR1;ITGA4;CXCR2;ITGAV;CCR6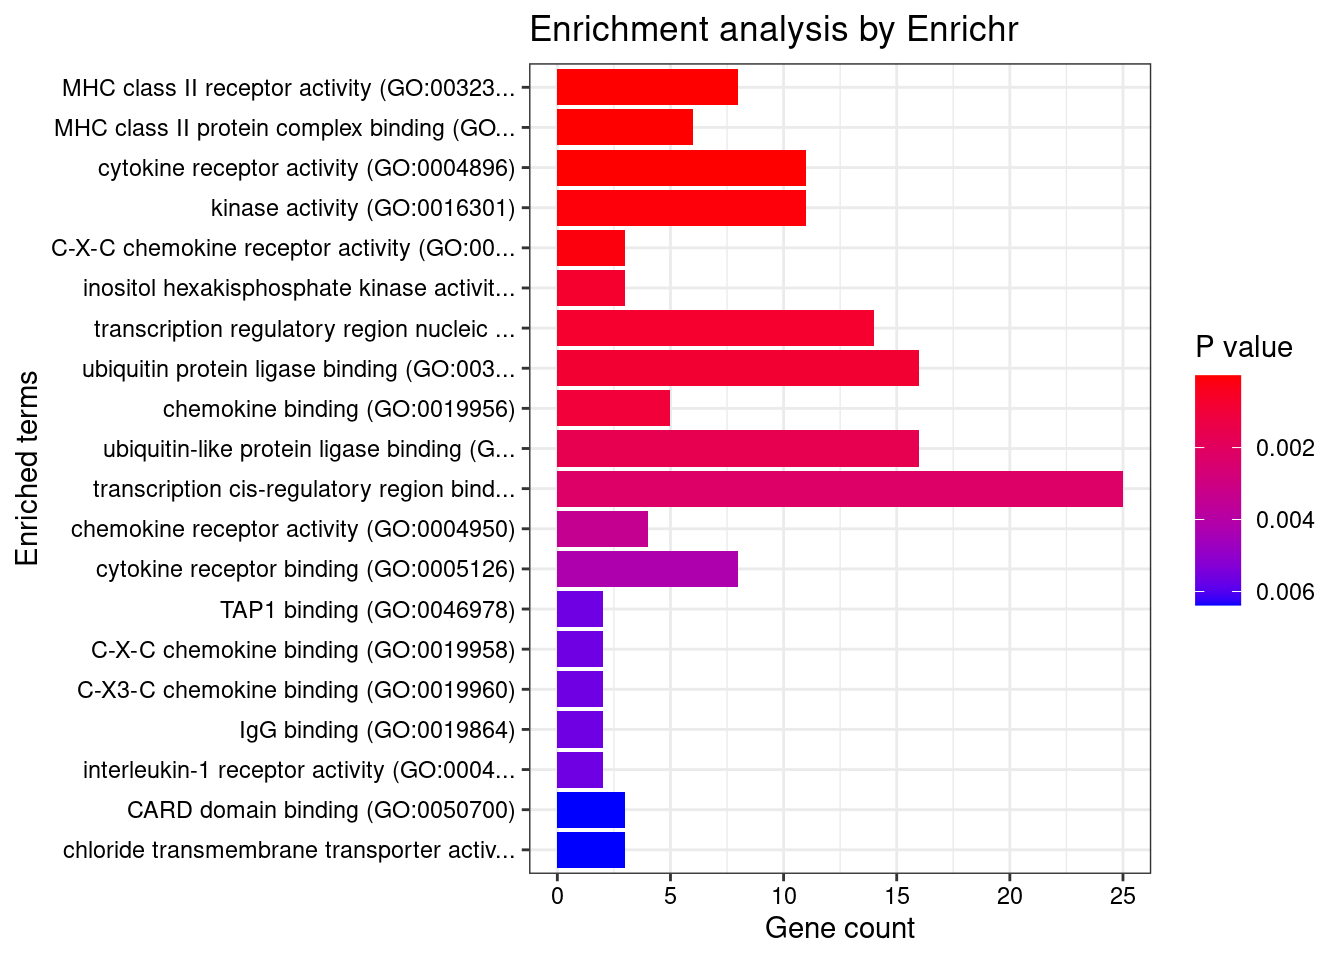
| Version | Author | Date |
|---|---|---|
| 397176f | wesleycrouse | 2022-06-10 |
Enrichment analysis for cTWAS genes in top tissues separately
GO
output <- output[order(-output$pve_g),]
top_tissues <- output$weight[1:5]
for (tissue in top_tissues){
cat(paste0(tissue, "\n\n"))
ctwas_genes_tissue <- df[[tissue]]$ctwas
cat(paste0("Number of cTWAS Genes in Tissue: ", length(ctwas_genes_tissue), "\n\n"))
dbs <- c("GO_Biological_Process_2021")
GO_enrichment <- enrichr(ctwas_genes_tissue, dbs)
for (db in dbs){
cat(paste0("\n", db, "\n\n"))
enrich_results <- GO_enrichment[[db]]
enrich_results <- enrich_results[enrich_results$Adjusted.P.value<0.05,c("Term", "Overlap", "Adjusted.P.value", "Genes")]
print(enrich_results)
print(plotEnrich(GO_enrichment[[db]]))
}
}Whole_Blood
Number of cTWAS Genes in Tissue: 13
Uploading data to Enrichr... Done.
Querying GO_Biological_Process_2021... Done.
Parsing results... Done.
GO_Biological_Process_2021
Term Overlap Adjusted.P.value Genes
1 positive regulation of cytokine production involved in inflammatory response (GO:1900017) 2/17 0.01476978 CARD9;STAT3
2 regulation of cytokine production involved in inflammatory response (GO:1900015) 2/43 0.03518617 CARD9;STAT3
3 positive regulation of interleukin-6 production (GO:0032755) 2/76 0.03518617 CARD9;STAT3
4 regulation of interleukin-6 production (GO:0032675) 2/110 0.03518617 CARD9;STAT3
5 positive regulation of cysteine-type endopeptidase activity involved in apoptotic process (GO:0043280) 2/119 0.03518617 TNFSF15;CARD9
6 positive regulation of metallopeptidase activity (GO:1905050) 1/5 0.03518617 STAT3
7 radial glial cell differentiation (GO:0060019) 1/6 0.03518617 STAT3
8 T-helper 17 cell lineage commitment (GO:0072540) 1/6 0.03518617 STAT3
9 regulation of transmission of nerve impulse (GO:0051969) 1/6 0.03518617 TYMP
10 release of sequestered calcium ion into cytosol by sarcoplasmic reticulum (GO:0014808) 1/6 0.03518617 CCR5
11 regulation of digestive system process (GO:0044058) 1/6 0.03518617 TYMP
12 positive regulation of NF-kappaB transcription factor activity (GO:0051092) 2/155 0.03518617 CARD9;STAT3
13 skin morphogenesis (GO:0043589) 1/7 0.03518617 ERRFI1
14 negative regulation of cytoplasmic translation (GO:2000766) 1/7 0.03518617 CPEB4
15 T-helper 17 cell differentiation (GO:0072539) 1/7 0.03518617 STAT3
16 astrocyte differentiation (GO:0048708) 1/7 0.03518617 STAT3
17 release of sequestered calcium ion into cytosol by endoplasmic reticulum (GO:1903514) 1/7 0.03518617 CCR5
18 regulation of miRNA mediated inhibition of translation (GO:1905616) 1/7 0.03518617 STAT3
19 photoreceptor cell differentiation (GO:0046530) 1/7 0.03518617 STAT3
20 positive regulation of miRNA mediated inhibition of translation (GO:1905618) 1/7 0.03518617 STAT3
21 cellular response to interleukin-21 (GO:0098757) 1/8 0.03518617 STAT3
22 fusion of virus membrane with host plasma membrane (GO:0019064) 1/8 0.03518617 CCR5
23 T-helper cell lineage commitment (GO:0002295) 1/8 0.03518617 STAT3
24 membrane fusion involved in viral entry into host cell (GO:0039663) 1/8 0.03518617 CCR5
25 myeloid leukocyte mediated immunity (GO:0002444) 1/8 0.03518617 CARD9
26 interleukin-21-mediated signaling pathway (GO:0038114) 1/8 0.03518617 STAT3
27 mitochondrion organization (GO:0007005) 2/175 0.03518617 BIK;TYMP
28 cellular response to interleukin-9 (GO:0071355) 1/9 0.03518617 STAT3
29 cellular response to leptin stimulus (GO:0044320) 1/9 0.03518617 STAT3
30 response to leptin (GO:0044321) 1/9 0.03518617 STAT3
31 interleukin-23-mediated signaling pathway (GO:0038155) 1/9 0.03518617 STAT3
32 interleukin-9-mediated signaling pathway (GO:0038113) 1/9 0.03518617 STAT3
33 ionotropic glutamate receptor signaling pathway (GO:0035235) 1/10 0.03518617 CPEB4
34 regulation of receptor binding (GO:1900120) 1/10 0.03518617 ADAM15
35 leptin-mediated signaling pathway (GO:0033210) 1/10 0.03518617 STAT3
36 cellular response to oxygen levels (GO:0071453) 1/10 0.03518617 CPEB4
37 lung epithelium development (GO:0060428) 1/10 0.03518617 ERRFI1
38 regulation of T-helper 17 type immune response (GO:2000316) 1/10 0.03518617 CARD9
39 nucleoside metabolic process (GO:0009116) 1/10 0.03518617 TYMP
40 immunoglobulin mediated immune response (GO:0016064) 1/10 0.03518617 CARD9
41 negative regulation of protein autophosphorylation (GO:0031953) 1/10 0.03518617 ERRFI1
42 sarcoplasmic reticulum calcium ion transport (GO:0070296) 1/10 0.03518617 CCR5
43 negative regulation of receptor binding (GO:1900121) 1/10 0.03518617 ADAM15
44 cytokine-mediated signaling pathway (GO:0019221) 3/621 0.03518617 TNFSF15;STAT3;CCR5
45 positive regulation of posttranscriptional gene silencing (GO:0060148) 1/11 0.03518617 STAT3
46 pyrimidine nucleoside catabolic process (GO:0046135) 1/11 0.03518617 TYMP
47 pyrimidine nucleoside salvage (GO:0043097) 1/11 0.03518617 TYMP
48 pyrimidine-containing compound salvage (GO:0008655) 1/11 0.03518617 TYMP
49 B cell mediated immunity (GO:0019724) 1/11 0.03518617 CARD9
50 response to sterol (GO:0036314) 1/11 0.03518617 CCR5
51 interleukin-35-mediated signaling pathway (GO:0070757) 1/11 0.03518617 STAT3
52 cellular response to growth hormone stimulus (GO:0071378) 1/12 0.03518617 STAT3
53 regulation of feeding behavior (GO:0060259) 1/12 0.03518617 STAT3
54 eye photoreceptor cell differentiation (GO:0001754) 1/12 0.03518617 STAT3
55 pyrimidine-containing compound metabolic process (GO:0072527) 1/12 0.03518617 TYMP
56 nucleoside catabolic process (GO:0009164) 1/12 0.03518617 TYMP
57 nucleoside salvage (GO:0043174) 1/12 0.03518617 TYMP
58 positive regulation of T-helper 17 type immune response (GO:2000318) 1/12 0.03518617 CARD9
59 mitochondrial genome maintenance (GO:0000002) 1/12 0.03518617 TYMP
60 negative regulation of production of miRNAs involved in gene silencing by miRNA (GO:1903799) 1/12 0.03518617 STAT3
61 positive regulation of adaptive immune response based on somatic recombination of immune receptors built from immunoglobulin superfamily domains (GO:0002824) 1/13 0.03518617 CARD9
62 cellular response to interleukin-15 (GO:0071350) 1/13 0.03518617 STAT3
63 antifungal innate immune response (GO:0061760) 1/13 0.03518617 CARD9
64 negative regulation of epidermal growth factor-activated receptor activity (GO:0007175) 1/13 0.03518617 ERRFI1
65 homeostasis of number of cells (GO:0048872) 1/13 0.03518617 CARD9
66 interleukin-15-mediated signaling pathway (GO:0035723) 1/13 0.03518617 STAT3
67 entry into host (GO:0044409) 1/13 0.03518617 CCR5
68 cellular response to lipid (GO:0071396) 2/219 0.03540538 ADAM15;CCR5
69 pyrimidine nucleoside biosynthetic process (GO:0046134) 1/14 0.03574728 TYMP
70 growth hormone receptor signaling pathway via JAK-STAT (GO:0060397) 1/14 0.03574728 STAT3
71 positive regulation of granulocyte macrophage colony-stimulating factor production (GO:0032725) 1/14 0.03574728 CARD9
72 inflammatory response (GO:0006954) 2/230 0.03577016 STAT3;CCR5
73 apoptotic process (GO:0006915) 2/231 0.03577016 ADAM15;BIK
74 pyrimidine nucleoside metabolic process (GO:0006213) 1/15 0.03577016 TYMP
75 regulation of cytoplasmic translation (GO:2000765) 1/15 0.03577016 CPEB4
76 interleukin-27-mediated signaling pathway (GO:0070106) 1/15 0.03577016 STAT3
77 activation of NF-kappaB-inducing kinase activity (GO:0007250) 1/16 0.03669493 TNFSF15
78 regulation of granulocyte macrophage colony-stimulating factor production (GO:0032645) 1/16 0.03669493 CARD9
79 dendritic cell chemotaxis (GO:0002407) 1/16 0.03669493 CCR5
80 positive regulation of DNA-binding transcription factor activity (GO:0051091) 2/246 0.03755071 CARD9;STAT3
81 pyrimidine-containing compound catabolic process (GO:0072529) 1/17 0.03755071 TYMP
82 vasculature development (GO:0001944) 1/17 0.03755071 ERRFI1
83 positive regulation of stress-activated protein kinase signaling cascade (GO:0070304) 1/18 0.03834481 CARD9
84 dendritic cell migration (GO:0036336) 1/18 0.03834481 CCR5
85 interleukin-6-mediated signaling pathway (GO:0070102) 1/18 0.03834481 STAT3
86 cellular response to interleukin-7 (GO:0098761) 1/19 0.03864440 STAT3
87 response to cholesterol (GO:0070723) 1/19 0.03864440 CCR5
88 regulation of nervous system process (GO:0031644) 1/19 0.03864440 TYMP
89 interleukin-7-mediated signaling pathway (GO:0038111) 1/19 0.03864440 STAT3
90 adaptive immune response based on somatic recombination of immune receptors built from immunoglobulin superfamily domains (GO:0002460) 1/20 0.03891705 STAT3
91 positive regulation of peptidyl-lysine acetylation (GO:2000758) 1/20 0.03891705 BRD7
92 eye morphogenesis (GO:0048592) 1/20 0.03891705 STAT3
93 growth hormone receptor signaling pathway (GO:0060396) 1/20 0.03891705 STAT3
94 positive regulation of histone acetylation (GO:0035066) 1/23 0.04377306 BRD7
95 positive regulation of interleukin-17 production (GO:0032740) 1/23 0.04377306 CARD9
96 defense response to fungus (GO:0050832) 1/24 0.04472107 CARD9
97 negative regulation of protein tyrosine kinase activity (GO:0061099) 1/24 0.04472107 ERRFI1
98 innate immune response (GO:0045087) 2/302 0.04472612 ADAM15;CARD9
99 receptor signaling pathway via STAT (GO:0097696) 1/25 0.04472612 STAT3
100 positive regulation of release of cytochrome c from mitochondria (GO:0090200) 1/25 0.04472612 BIK
101 regulation of epidermal cell differentiation (GO:0045604) 1/25 0.04472612 ERRFI1
102 negative regulation of signaling receptor activity (GO:2000272) 1/26 0.04559830 ERRFI1
103 regulation of myelination (GO:0031641) 1/26 0.04559830 TYMP
104 positive regulation of erythrocyte differentiation (GO:0045648) 1/27 0.04599816 STAT3
105 positive regulation of gene silencing by miRNA (GO:2000637) 1/27 0.04599816 STAT3
106 regulation of epidermal growth factor-activated receptor activity (GO:0007176) 1/27 0.04599816 ERRFI1
107 cellular response to oxygen-containing compound (GO:1901701) 2/323 0.04637501 CCR5;CPEB4
108 cellular response to interleukin-6 (GO:0071354) 1/28 0.04637501 STAT3
109 cellular response to acid chemical (GO:0071229) 1/28 0.04637501 CPEB4
110 glial cell differentiation (GO:0010001) 1/29 0.04758037 STAT3
111 positive regulation of cytokine production (GO:0001819) 2/335 0.04789997 CARD9;STAT3
112 positive regulation of endopeptidase activity (GO:0010950) 1/30 0.04789997 STAT3
113 response to alcohol (GO:0097305) 1/30 0.04789997 CCR5
114 receptor signaling pathway via JAK-STAT (GO:0007259) 1/31 0.04875920 STAT3
115 negative regulation of cell-matrix adhesion (GO:0001953) 1/32 0.04875920 ADAM15
116 response to amino acid (GO:0043200) 1/32 0.04875920 CPEB4
117 positive regulation of interleukin-10 production (GO:0032733) 1/32 0.04875920 STAT3
118 modulation by host of symbiont process (GO:0051851) 1/32 0.04875920 CARD9
119 regulation of histone acetylation (GO:0035065) 1/33 0.04875920 BRD7
120 regulation of interleukin-17 production (GO:0032660) 1/33 0.04875920 CARD9
121 apoptotic mitochondrial changes (GO:0008637) 1/33 0.04875920 BIK
122 positive regulation of histone modification (GO:0031058) 1/33 0.04875920 BRD7
123 positive regulation of pri-miRNA transcription by RNA polymerase II (GO:1902895) 1/34 0.04901639 STAT3
124 regulation of keratinocyte differentiation (GO:0045616) 1/34 0.04901639 ERRFI1
125 cellular response to amino acid stimulus (GO:0071230) 1/34 0.04901639 CPEB4
126 negative regulation of cell cycle G1/S phase transition (GO:1902807) 1/35 0.04964858 BRD7
127 lung development (GO:0030324) 1/35 0.04964858 ERRFI1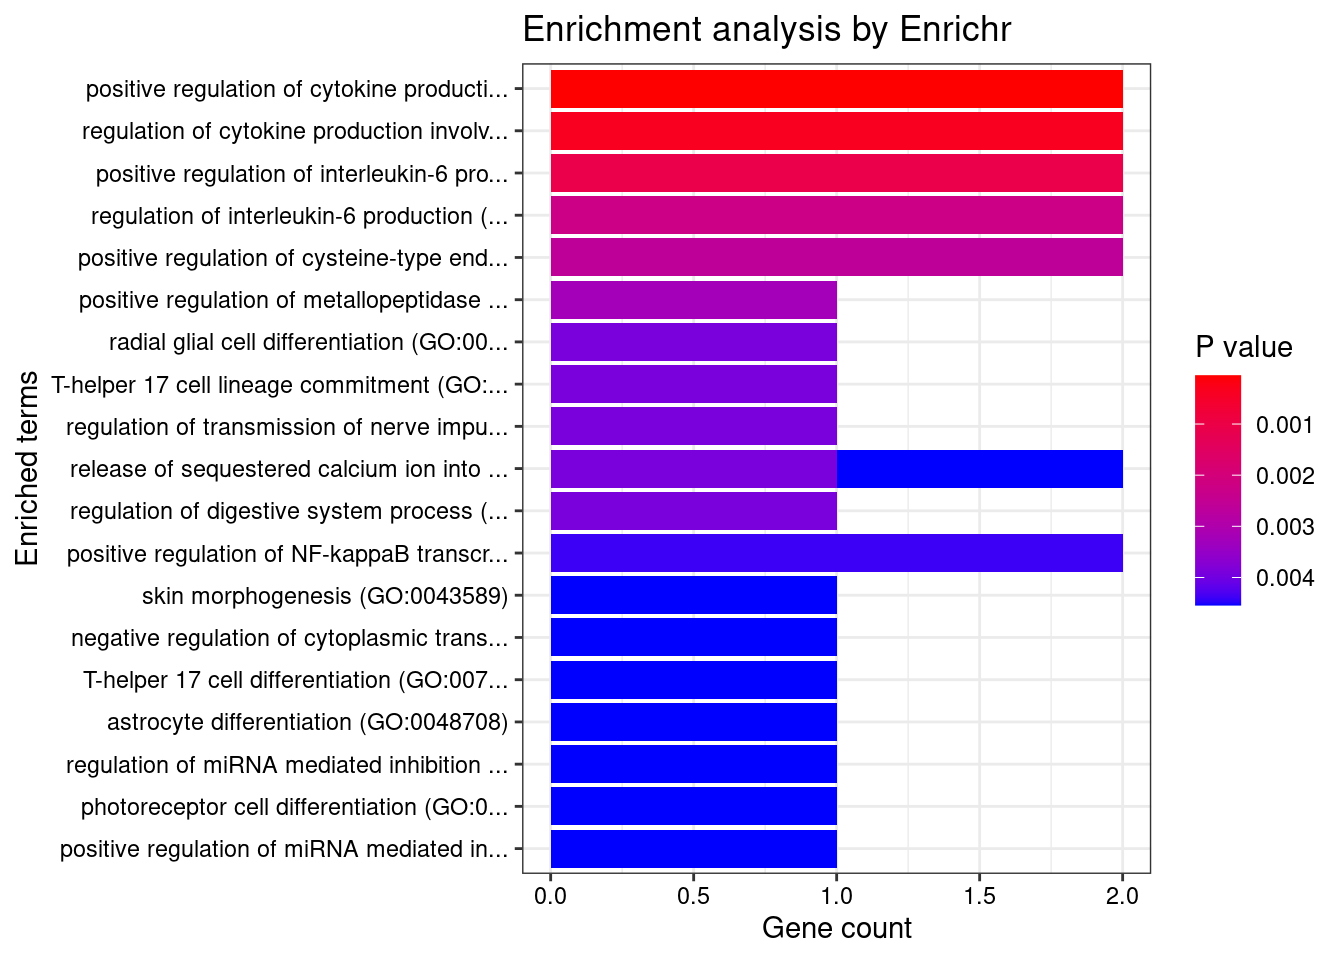
| Version | Author | Date |
|---|---|---|
| 397176f | wesleycrouse | 2022-06-10 |
Esophagus_Muscularis
Number of cTWAS Genes in Tissue: 8
Uploading data to Enrichr... Done.
Querying GO_Biological_Process_2021... Done.
Parsing results... Done.
GO_Biological_Process_2021
Term Overlap Adjusted.P.value Genes
1 cell-matrix adhesion (GO:0007160) 2/100 0.02777984 ADAM15;ITGAL
2 positive regulation of cysteine-type endopeptidase activity involved in apoptotic process (GO:0043280) 2/119 0.02777984 TNFSF15;CARD9
3 T cell extravasation (GO:0072683) 1/5 0.02777984 ITGAL
4 extracellular structure organization (GO:0043062) 2/216 0.02777984 ADAM15;ITGAL
5 external encapsulating structure organization (GO:0045229) 2/217 0.02777984 ADAM15;ITGAL
6 myeloid leukocyte mediated immunity (GO:0002444) 1/8 0.02777984 CARD9
7 regulation of DNA-templated transcription in response to stress (GO:0043620) 1/9 0.02777984 RGS14
8 regulation of ERK1 and ERK2 cascade (GO:0070372) 2/238 0.02777984 RGS14;CARD9
9 regulation of receptor binding (GO:1900120) 1/10 0.02777984 ADAM15
10 regulation of T-helper 17 type immune response (GO:2000316) 1/10 0.02777984 CARD9
11 immunoglobulin mediated immune response (GO:0016064) 1/10 0.02777984 CARD9
12 negative regulation of receptor binding (GO:1900121) 1/10 0.02777984 ADAM15
13 detection of light stimulus involved in sensory perception (GO:0050962) 1/11 0.02777984 TULP1
14 detection of light stimulus involved in visual perception (GO:0050908) 1/11 0.02777984 TULP1
15 B cell mediated immunity (GO:0019724) 1/11 0.02777984 CARD9
16 positive regulation of T-helper 17 type immune response (GO:2000318) 1/12 0.02777984 CARD9
17 eye photoreceptor cell differentiation (GO:0001754) 1/12 0.02777984 TULP1
18 positive regulation of adaptive immune response based on somatic recombination of immune receptors built from immunoglobulin superfamily domains (GO:0002824) 1/13 0.02777984 CARD9
19 homeostasis of number of cells (GO:0048872) 1/13 0.02777984 CARD9
20 antifungal innate immune response (GO:0061760) 1/13 0.02777984 CARD9
21 positive regulation of granulocyte macrophage colony-stimulating factor production (GO:0032725) 1/14 0.02777984 CARD9
22 extracellular matrix organization (GO:0030198) 2/300 0.02777984 ADAM15;ITGAL
23 eye photoreceptor cell development (GO:0042462) 1/15 0.02777984 TULP1
24 photoreceptor cell development (GO:0042461) 1/15 0.02777984 TULP1
25 innate immune response (GO:0045087) 2/302 0.02777984 ADAM15;CARD9
26 activation of NF-kappaB-inducing kinase activity (GO:0007250) 1/16 0.02777984 TNFSF15
27 regulation of granulocyte macrophage colony-stimulating factor production (GO:0032645) 1/16 0.02777984 CARD9
28 platelet-derived growth factor receptor signaling pathway (GO:0048008) 1/16 0.02777984 RGS14
29 nuclear transport (GO:0051169) 1/16 0.02777984 RGS14
30 detection of visible light (GO:0009584) 1/17 0.02777984 TULP1
31 positive regulation of cytokine production involved in inflammatory response (GO:1900017) 1/17 0.02777984 CARD9
32 positive regulation of stress-activated protein kinase signaling cascade (GO:0070304) 1/18 0.02848979 CARD9
33 long-term memory (GO:0007616) 1/19 0.02915617 RGS14
34 long-term synaptic potentiation (GO:0060291) 1/21 0.03126651 RGS14
35 positive regulation of interleukin-17 production (GO:0032740) 1/23 0.03233051 CARD9
36 negative regulation of G protein-coupled receptor signaling pathway (GO:0045744) 1/23 0.03233051 RGS14
37 defense response to fungus (GO:0050832) 1/24 0.03281866 CARD9
38 leukocyte cell-cell adhesion (GO:0007159) 1/28 0.03539206 ITGAL
39 receptor clustering (GO:0043113) 1/28 0.03539206 ITGAL
40 T cell activation involved in immune response (GO:0002286) 1/28 0.03539206 ITGAL
41 negative regulation of cell-matrix adhesion (GO:0001953) 1/32 0.03849505 ADAM15
42 modulation by host of symbiont process (GO:0051851) 1/32 0.03849505 CARD9
43 regulation of interleukin-17 production (GO:0032660) 1/33 0.03876803 CARD9
44 protein localization to cilium (GO:0061512) 1/35 0.04016908 TULP1
45 retina homeostasis (GO:0001895) 1/36 0.04036333 TULP1
46 neutrophil mediated immunity (GO:0002446) 2/488 0.04036333 CARD9;ITGAL
47 positive regulation of cell development (GO:0010720) 1/38 0.04036333 RGS14
48 cellular response to ketone (GO:1901655) 1/39 0.04036333 ADAM15
49 negative regulation of cell-substrate adhesion (GO:0010812) 1/40 0.04036333 ADAM15
50 nucleocytoplasmic transport (GO:0006913) 1/40 0.04036333 RGS14
51 heterophilic cell-cell adhesion via plasma membrane cell adhesion molecules (GO:0007157) 1/42 0.04153597 ITGAL
52 regulation of cytokine production involved in inflammatory response (GO:1900015) 1/43 0.04169984 CARD9
53 positive regulation of nervous system development (GO:0051962) 1/45 0.04280102 RGS14
54 negative regulation of MAP kinase activity (GO:0043407) 1/48 0.04330471 RGS14
55 cellular response to alcohol (GO:0097306) 1/48 0.04330471 ADAM15
56 regulation of stress-activated MAPK cascade (GO:0032872) 1/49 0.04330471 CARD9
57 cellular defense response (GO:0006968) 1/49 0.04330471 LSP1
58 negative regulation of ERK1 and ERK2 cascade (GO:0070373) 1/50 0.04341903 RGS14
59 positive regulation of phagocytosis (GO:0050766) 1/53 0.04522039 TULP1
60 regulation of phagocytosis (GO:0050764) 1/58 0.04861919 TULP1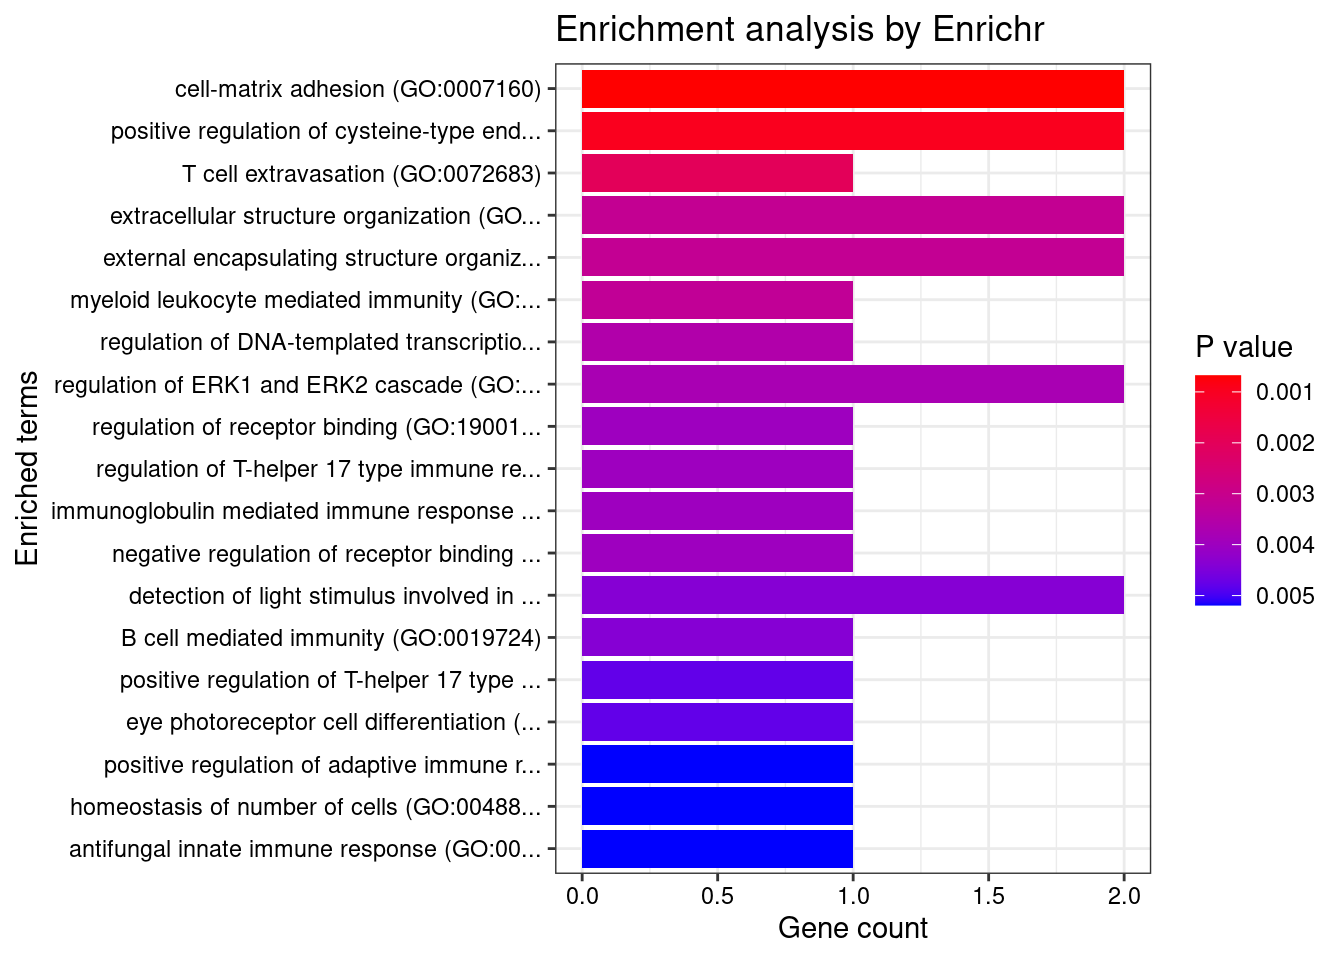
| Version | Author | Date |
|---|---|---|
| 397176f | wesleycrouse | 2022-06-10 |
Skin_Not_Sun_Exposed_Suprapubic
Number of cTWAS Genes in Tissue: 3
Uploading data to Enrichr... Done.
Querying GO_Biological_Process_2021... Done.
Parsing results... Done.
GO_Biological_Process_2021
Term Overlap Adjusted.P.value Genes
1 regulation of collagen fibril organization (GO:1904026) 1/6 0.004969581 EFEMP2
2 supramolecular fiber organization (GO:0097435) 2/351 0.004969581 EFEMP2;P4HA2
3 positive regulation of vascular associated smooth muscle cell differentiation (GO:1905065) 1/7 0.004969581 EFEMP2
4 vascular associated smooth muscle cell development (GO:0097084) 1/7 0.004969581 EFEMP2
5 vascular associated smooth muscle cell differentiation (GO:0035886) 1/8 0.004969581 EFEMP2
6 elastic fiber assembly (GO:0048251) 1/8 0.004969581 EFEMP2
7 peptidyl-proline hydroxylation to 4-hydroxy-L-proline (GO:0018401) 1/8 0.004969581 P4HA2
8 smooth muscle tissue development (GO:0048745) 1/10 0.005215477 EFEMP2
9 peptidyl-proline hydroxylation (GO:0019511) 1/11 0.005215477 P4HA2
10 aorta development (GO:0035904) 1/14 0.005215477 EFEMP2
11 regulation of extracellular matrix organization (GO:1903053) 1/15 0.005215477 EFEMP2
12 aorta morphogenesis (GO:0035909) 1/17 0.005215477 EFEMP2
13 negative regulation of vascular associated smooth muscle cell proliferation (GO:1904706) 1/17 0.005215477 EFEMP2
14 muscle tissue morphogenesis (GO:0060415) 1/17 0.005215477 EFEMP2
15 positive regulation of extracellular matrix organization (GO:1903055) 1/18 0.005215477 EFEMP2
16 artery development (GO:0060840) 1/23 0.005793244 EFEMP2
17 regulation of supramolecular fiber organization (GO:1902903) 1/23 0.005793244 EFEMP2
18 extracellular matrix assembly (GO:0085029) 1/24 0.005793244 EFEMP2
19 negative regulation of smooth muscle cell proliferation (GO:0048662) 1/33 0.007165924 EFEMP2
20 muscle cell development (GO:0055001) 1/33 0.007165924 EFEMP2
21 regulation of vascular associated smooth muscle cell proliferation (GO:1904705) 1/37 0.007650398 EFEMP2
22 positive regulation of cell-matrix adhesion (GO:0001954) 1/44 0.008681202 EFEMP2
23 collagen fibril organization (GO:0030199) 1/89 0.016419487 P4HA2
24 positive regulation of supramolecular fiber organization (GO:1902905) 1/91 0.016419487 EFEMP2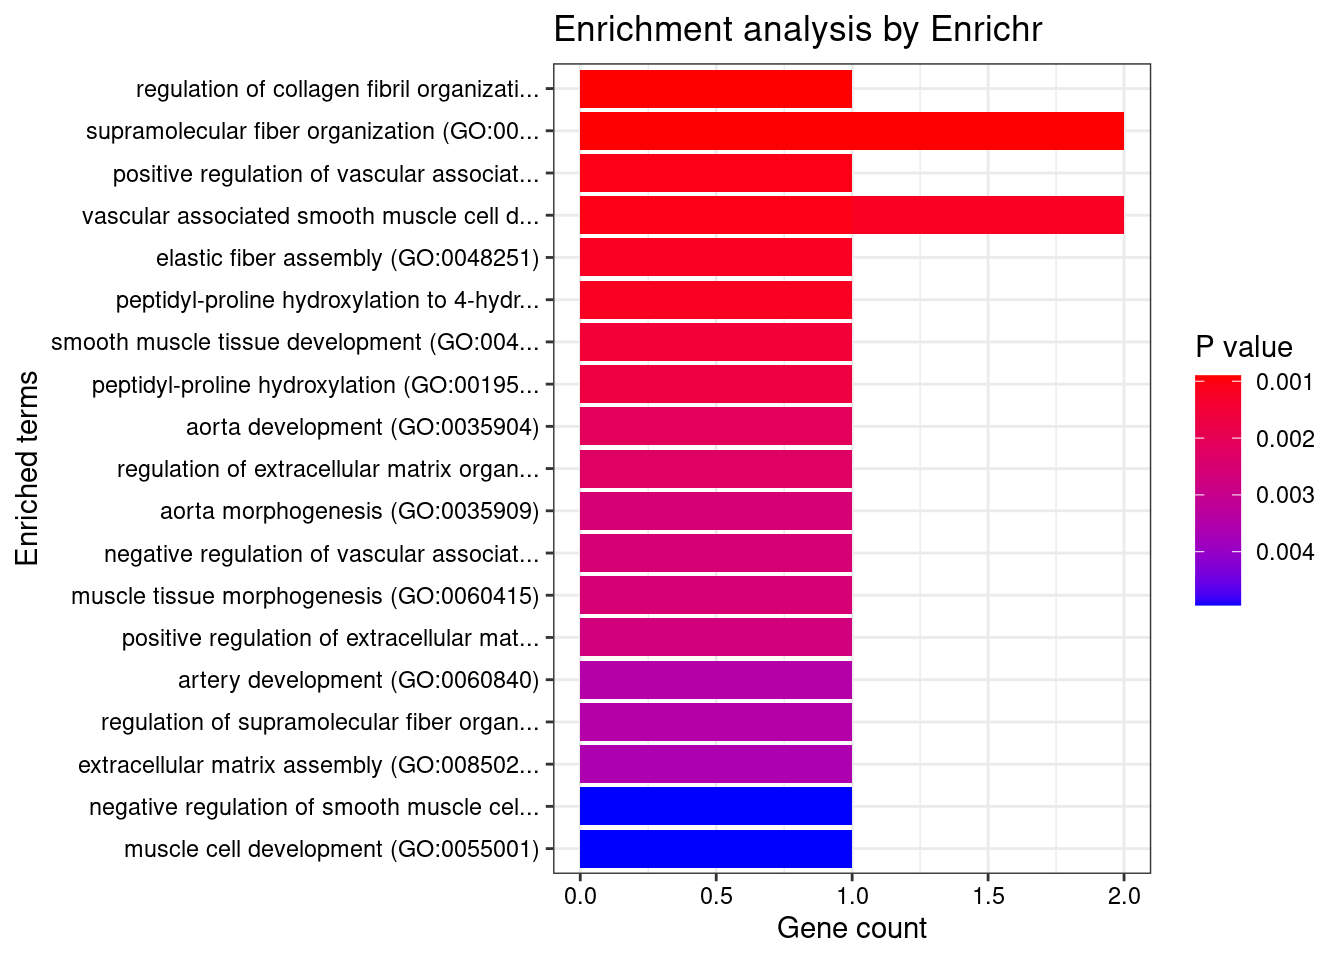
| Version | Author | Date |
|---|---|---|
| 397176f | wesleycrouse | 2022-06-10 |
Adrenal_Gland
Number of cTWAS Genes in Tissue: 5
Uploading data to Enrichr... Done.
Querying GO_Biological_Process_2021... Done.
Parsing results... Done.
GO_Biological_Process_2021
Term Overlap Adjusted.P.value Genes
1 positive regulation of cysteine-type endopeptidase activity involved in apoptotic process (GO:0043280) 2/119 0.02014338 TNFSF15;CARD9
2 regulation of ERK1 and ERK2 cascade (GO:0070372) 2/238 0.02014338 RGS14;CARD9
3 hypotonic response (GO:0006971) 1/7 0.02014338 SLC12A5
4 cellular ion homeostasis (GO:0006873) 1/7 0.02014338 SLC12A5
5 myeloid leukocyte mediated immunity (GO:0002444) 1/8 0.02014338 CARD9
6 innate immune response (GO:0045087) 2/302 0.02014338 ADAM15;CARD9
7 regulation of DNA-templated transcription in response to stress (GO:0043620) 1/9 0.02014338 RGS14
8 regulation of receptor binding (GO:1900120) 1/10 0.02014338 ADAM15
9 monovalent inorganic anion homeostasis (GO:0055083) 1/10 0.02014338 SLC12A5
10 chloride ion homeostasis (GO:0055064) 1/10 0.02014338 SLC12A5
11 regulation of T-helper 17 type immune response (GO:2000316) 1/10 0.02014338 CARD9
12 immunoglobulin mediated immune response (GO:0016064) 1/10 0.02014338 CARD9
13 negative regulation of receptor binding (GO:1900121) 1/10 0.02014338 ADAM15
14 B cell mediated immunity (GO:0019724) 1/11 0.02014338 CARD9
15 positive regulation of T-helper 17 type immune response (GO:2000318) 1/12 0.02014338 CARD9
16 positive regulation of adaptive immune response based on somatic recombination of immune receptors built from immunoglobulin superfamily domains (GO:0002824) 1/13 0.02014338 CARD9
17 homeostasis of number of cells (GO:0048872) 1/13 0.02014338 CARD9
18 antifungal innate immune response (GO:0061760) 1/13 0.02014338 CARD9
19 positive regulation of granulocyte macrophage colony-stimulating factor production (GO:0032725) 1/14 0.02014338 CARD9
20 activation of NF-kappaB-inducing kinase activity (GO:0007250) 1/16 0.02014338 TNFSF15
21 regulation of granulocyte macrophage colony-stimulating factor production (GO:0032645) 1/16 0.02014338 CARD9
22 platelet-derived growth factor receptor signaling pathway (GO:0048008) 1/16 0.02014338 RGS14
23 nuclear transport (GO:0051169) 1/16 0.02014338 RGS14
24 positive regulation of cytokine production involved in inflammatory response (GO:1900017) 1/17 0.02050853 CARD9
25 positive regulation of stress-activated protein kinase signaling cascade (GO:0070304) 1/18 0.02084424 CARD9
26 long-term memory (GO:0007616) 1/19 0.02115390 RGS14
27 long-term synaptic potentiation (GO:0060291) 1/21 0.02239975 RGS14
28 positive regulation of interleukin-17 production (GO:0032740) 1/23 0.02239975 CARD9
29 negative regulation of G protein-coupled receptor signaling pathway (GO:0045744) 1/23 0.02239975 RGS14
30 defense response to fungus (GO:0050832) 1/24 0.02239975 CARD9
31 potassium ion homeostasis (GO:0055075) 1/24 0.02239975 SLC12A5
32 monovalent inorganic cation homeostasis (GO:0055067) 1/27 0.02440491 SLC12A5
33 ion homeostasis (GO:0050801) 1/30 0.02628698 SLC12A5
34 negative regulation of cell-matrix adhesion (GO:0001953) 1/32 0.02643191 ADAM15
35 modulation by host of symbiont process (GO:0051851) 1/32 0.02643191 CARD9
36 regulation of interleukin-17 production (GO:0032660) 1/33 0.02649810 CARD9
37 positive regulation of cell development (GO:0010720) 1/38 0.02888681 RGS14
38 cellular response to ketone (GO:1901655) 1/39 0.02888681 ADAM15
39 negative regulation of cell-substrate adhesion (GO:0010812) 1/40 0.02888681 ADAM15
40 nucleocytoplasmic transport (GO:0006913) 1/40 0.02888681 RGS14
41 potassium ion import across plasma membrane (GO:1990573) 1/42 0.02944690 SLC12A5
42 regulation of cytokine production involved in inflammatory response (GO:1900015) 1/43 0.02944690 CARD9
43 metal ion homeostasis (GO:0055065) 1/44 0.02944690 SLC12A5
44 positive regulation of nervous system development (GO:0051962) 1/45 0.02944690 RGS14
45 negative regulation of MAP kinase activity (GO:0043407) 1/48 0.02944690 RGS14
46 cellular response to alcohol (GO:0097306) 1/48 0.02944690 ADAM15
47 regulation of stress-activated MAPK cascade (GO:0032872) 1/49 0.02944690 CARD9
48 chloride transmembrane transport (GO:1902476) 1/50 0.02944690 SLC12A5
49 negative regulation of ERK1 and ERK2 cascade (GO:0070373) 1/50 0.02944690 RGS14
50 regulation of neurogenesis (GO:0050767) 1/62 0.03453278 RGS14
51 positive regulation of cysteine-type endopeptidase activity (GO:2001056) 1/62 0.03453278 CARD9
52 regulation of cell-matrix adhesion (GO:0001952) 1/65 0.03453278 ADAM15
53 inorganic anion transmembrane transport (GO:0098661) 1/65 0.03453278 SLC12A5
54 extracellular matrix disassembly (GO:0022617) 1/66 0.03453278 ADAM15
55 cellular component disassembly (GO:0022411) 1/66 0.03453278 ADAM15
56 positive regulation of neurogenesis (GO:0050769) 1/72 0.03453278 RGS14
57 positive regulation of JNK cascade (GO:0046330) 1/73 0.03453278 CARD9
58 positive regulation of synaptic transmission (GO:0050806) 1/73 0.03453278 RGS14
59 NIK/NF-kappaB signaling (GO:0038061) 1/74 0.03453278 TNFSF15
60 negative regulation of protein binding (GO:0032091) 1/74 0.03453278 ADAM15
61 integrin-mediated signaling pathway (GO:0007229) 1/75 0.03453278 ADAM15
62 positive regulation of interleukin-6 production (GO:0032755) 1/76 0.03453278 CARD9
63 chloride transport (GO:0006821) 1/76 0.03453278 SLC12A5
64 inorganic cation import across plasma membrane (GO:0098659) 1/77 0.03453278 SLC12A5
65 negative regulation of protein serine/threonine kinase activity (GO:0071901) 1/78 0.03453278 RGS14
66 activation of cysteine-type endopeptidase activity involved in apoptotic process (GO:0006919) 1/81 0.03520592 TNFSF15
67 regulation of G protein-coupled receptor signaling pathway (GO:0008277) 1/82 0.03520592 RGS14
68 regulation of cysteine-type endopeptidase activity involved in apoptotic process (GO:0043281) 1/89 0.03749063 CARD9
69 protein complex oligomerization (GO:0051259) 1/90 0.03749063 CARD9
70 negative regulation of MAPK cascade (GO:0043409) 1/94 0.03858206 RGS14
71 regulation of MAP kinase activity (GO:0043405) 1/97 0.03924088 RGS14
72 positive regulation of stress-activated MAPK cascade (GO:0032874) 1/99 0.03933437 CARD9
73 cell-matrix adhesion (GO:0007160) 1/100 0.03933437 ADAM15
74 regulation of JNK cascade (GO:0046328) 1/105 0.04055501 CARD9
75 regulation of interleukin-6 production (GO:0032675) 1/110 0.04055501 CARD9
76 activation of protein kinase activity (GO:0032147) 1/114 0.04055501 TNFSF15
77 negative regulation of cell motility (GO:2000146) 1/114 0.04055501 ADAM15
78 cellular response to lectin (GO:1990858) 1/115 0.04055501 CARD9
79 stimulatory C-type lectin receptor signaling pathway (GO:0002223) 1/115 0.04055501 CARD9
80 positive regulation of protein metabolic process (GO:0051247) 1/115 0.04055501 CARD9
81 ion transport (GO:0006811) 1/116 0.04055501 SLC12A5
82 tumor necrosis factor-mediated signaling pathway (GO:0033209) 1/116 0.04055501 TNFSF15
83 innate immune response activating cell surface receptor signaling pathway (GO:0002220) 1/119 0.04109027 CARD9
84 protein homooligomerization (GO:0051260) 1/121 0.04127522 CARD9
85 negative regulation of cell growth (GO:0030308) 1/126 0.04196027 ADAM15
86 negative regulation of growth (GO:0045926) 1/126 0.04196027 ADAM15
87 potassium ion transmembrane transport (GO:0071805) 1/139 0.04569800 SLC12A5
88 negative regulation of cell migration (GO:0030336) 1/144 0.04678045 ADAM15
89 regulation of cytokine production (GO:0001817) 1/150 0.04815321 CARD9
90 positive regulation of NF-kappaB transcription factor activity (GO:0051092) 1/155 0.04918086 CARD9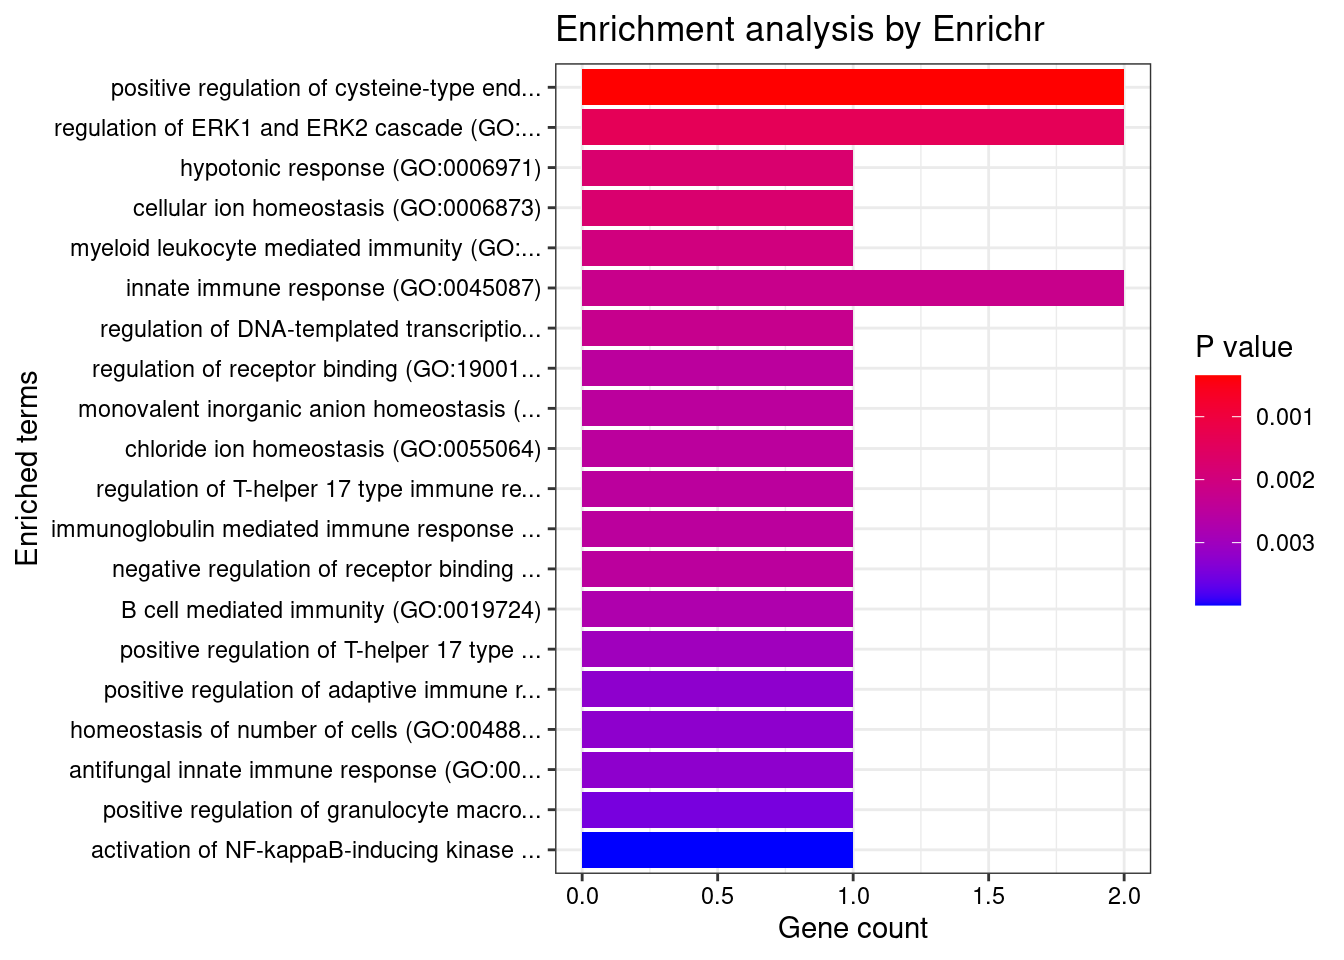
| Version | Author | Date |
|---|---|---|
| 397176f | wesleycrouse | 2022-06-10 |
Uterus
Number of cTWAS Genes in Tissue: 4
Uploading data to Enrichr... Done.
Querying GO_Biological_Process_2021... Done.
Parsing results... Done.
GO_Biological_Process_2021
Term Overlap Adjusted.P.value Genes
1 positive regulation of cytokine production involved in inflammatory response (GO:1900017) 2/17 0.0007173452 CARD9;STAT3
2 regulation of cytokine production involved in inflammatory response (GO:1900015) 2/43 0.0023774013 CARD9;STAT3
3 positive regulation of interleukin-6 production (GO:0032755) 2/76 0.0049913253 CARD9;STAT3
4 regulation of interleukin-6 production (GO:0032675) 2/110 0.0073565795 CARD9;STAT3
5 positive regulation of cysteine-type endopeptidase activity involved in apoptotic process (GO:0043280) 2/119 0.0073565795 TNFSF15;CARD9
6 positive regulation of NF-kappaB transcription factor activity (GO:0051092) 2/155 0.0103904667 CARD9;STAT3
7 regulation of ERK1 and ERK2 cascade (GO:0070372) 2/238 0.0103904667 RGS14;CARD9
8 positive regulation of DNA-binding transcription factor activity (GO:0051091) 2/246 0.0103904667 CARD9;STAT3
9 positive regulation of metallopeptidase activity (GO:1905050) 1/5 0.0103904667 STAT3
10 radial glial cell differentiation (GO:0060019) 1/6 0.0103904667 STAT3
11 T-helper 17 cell lineage commitment (GO:0072540) 1/6 0.0103904667 STAT3
12 regulation of miRNA mediated inhibition of translation (GO:1905616) 1/7 0.0103904667 STAT3
13 T-helper 17 cell differentiation (GO:0072539) 1/7 0.0103904667 STAT3
14 photoreceptor cell differentiation (GO:0046530) 1/7 0.0103904667 STAT3
15 astrocyte differentiation (GO:0048708) 1/7 0.0103904667 STAT3
16 positive regulation of miRNA mediated inhibition of translation (GO:1905618) 1/7 0.0103904667 STAT3
17 cellular response to interleukin-21 (GO:0098757) 1/8 0.0103904667 STAT3
18 T-helper cell lineage commitment (GO:0002295) 1/8 0.0103904667 STAT3
19 myeloid leukocyte mediated immunity (GO:0002444) 1/8 0.0103904667 CARD9
20 interleukin-21-mediated signaling pathway (GO:0038114) 1/8 0.0103904667 STAT3
21 positive regulation of cytokine production (GO:0001819) 2/335 0.0103904667 CARD9;STAT3
22 cellular response to interleukin-9 (GO:0071355) 1/9 0.0103904667 STAT3
23 cellular response to leptin stimulus (GO:0044320) 1/9 0.0103904667 STAT3
24 response to leptin (GO:0044321) 1/9 0.0103904667 STAT3
25 regulation of DNA-templated transcription in response to stress (GO:0043620) 1/9 0.0103904667 RGS14
26 interleukin-23-mediated signaling pathway (GO:0038155) 1/9 0.0103904667 STAT3
27 interleukin-9-mediated signaling pathway (GO:0038113) 1/9 0.0103904667 STAT3
28 leptin-mediated signaling pathway (GO:0033210) 1/10 0.0103904667 STAT3
29 regulation of T-helper 17 type immune response (GO:2000316) 1/10 0.0103904667 CARD9
30 immunoglobulin mediated immune response (GO:0016064) 1/10 0.0103904667 CARD9
31 positive regulation of posttranscriptional gene silencing (GO:0060148) 1/11 0.0103904667 STAT3
32 interleukin-35-mediated signaling pathway (GO:0070757) 1/11 0.0103904667 STAT3
33 B cell mediated immunity (GO:0019724) 1/11 0.0103904667 CARD9
34 transmembrane receptor protein tyrosine kinase signaling pathway (GO:0007169) 2/404 0.0103904667 RGS14;STAT3
35 positive regulation of T-helper 17 type immune response (GO:2000318) 1/12 0.0103904667 CARD9
36 cellular response to growth hormone stimulus (GO:0071378) 1/12 0.0103904667 STAT3
37 regulation of feeding behavior (GO:0060259) 1/12 0.0103904667 STAT3
38 eye photoreceptor cell differentiation (GO:0001754) 1/12 0.0103904667 STAT3
39 negative regulation of production of miRNAs involved in gene silencing by miRNA (GO:1903799) 1/12 0.0103904667 STAT3
40 positive regulation of adaptive immune response based on somatic recombination of immune receptors built from immunoglobulin superfamily domains (GO:0002824) 1/13 0.0103904667 CARD9
41 cellular response to interleukin-15 (GO:0071350) 1/13 0.0103904667 STAT3
42 homeostasis of number of cells (GO:0048872) 1/13 0.0103904667 CARD9
43 antifungal innate immune response (GO:0061760) 1/13 0.0103904667 CARD9
44 interleukin-15-mediated signaling pathway (GO:0035723) 1/13 0.0103904667 STAT3
45 growth hormone receptor signaling pathway via JAK-STAT (GO:0060397) 1/14 0.0107024248 STAT3
46 positive regulation of granulocyte macrophage colony-stimulating factor production (GO:0032725) 1/14 0.0107024248 CARD9
47 interleukin-27-mediated signaling pathway (GO:0070106) 1/15 0.0110305445 STAT3
48 activation of NF-kappaB-inducing kinase activity (GO:0007250) 1/16 0.0110305445 TNFSF15
49 regulation of granulocyte macrophage colony-stimulating factor production (GO:0032645) 1/16 0.0110305445 CARD9
50 platelet-derived growth factor receptor signaling pathway (GO:0048008) 1/16 0.0110305445 RGS14
51 nuclear transport (GO:0051169) 1/16 0.0110305445 RGS14
52 positive regulation of gene expression (GO:0010628) 2/482 0.0113975189 CARD9;STAT3
53 interleukin-6-mediated signaling pathway (GO:0070102) 1/18 0.0117164511 STAT3
54 positive regulation of stress-activated protein kinase signaling cascade (GO:0070304) 1/18 0.0117164511 CARD9
55 cellular response to interleukin-7 (GO:0098761) 1/19 0.0117164511 STAT3
56 long-term memory (GO:0007616) 1/19 0.0117164511 RGS14
57 interleukin-7-mediated signaling pathway (GO:0038111) 1/19 0.0117164511 STAT3
58 growth hormone receptor signaling pathway (GO:0060396) 1/20 0.0117164511 STAT3
59 adaptive immune response based on somatic recombination of immune receptors built from immunoglobulin superfamily domains (GO:0002460) 1/20 0.0117164511 STAT3
60 eye morphogenesis (GO:0048592) 1/20 0.0117164511 STAT3
61 long-term synaptic potentiation (GO:0060291) 1/21 0.0120996924 RGS14
62 positive regulation of interleukin-17 production (GO:0032740) 1/23 0.0128294251 CARD9
63 negative regulation of G protein-coupled receptor signaling pathway (GO:0045744) 1/23 0.0128294251 RGS14
64 defense response to fungus (GO:0050832) 1/24 0.0131770650 CARD9
65 receptor signaling pathway via STAT (GO:0097696) 1/25 0.0135139274 STAT3
66 positive regulation of erythrocyte differentiation (GO:0045648) 1/27 0.0141572497 STAT3
67 positive regulation of gene silencing by miRNA (GO:2000637) 1/27 0.0141572497 STAT3
68 cytokine-mediated signaling pathway (GO:0019221) 2/621 0.0142549719 TNFSF15;STAT3
69 cellular response to interleukin-6 (GO:0071354) 1/28 0.0142549719 STAT3
70 glial cell differentiation (GO:0010001) 1/29 0.0145520734 STAT3
71 positive regulation of endopeptidase activity (GO:0010950) 1/30 0.0148407316 STAT3
72 receptor signaling pathway via JAK-STAT (GO:0007259) 1/31 0.0151212986 STAT3
73 positive regulation of interleukin-10 production (GO:0032733) 1/32 0.0151860782 STAT3
74 modulation by host of symbiont process (GO:0051851) 1/32 0.0151860782 CARD9
75 regulation of interleukin-17 production (GO:0032660) 1/33 0.0154506776 CARD9
76 positive regulation of pri-miRNA transcription by RNA polymerase II (GO:1902895) 1/34 0.0157082446 STAT3
77 positive regulation of myeloid cell differentiation (GO:0045639) 1/37 0.0166522096 STAT3
78 regulation of erythrocyte differentiation (GO:0045646) 1/37 0.0166522096 STAT3
79 response to estradiol (GO:0032355) 1/38 0.0166734636 STAT3
80 positive regulation of cell development (GO:0010720) 1/38 0.0166734636 RGS14
81 response to peptide (GO:1901652) 1/39 0.0168997107 STAT3
82 nucleocytoplasmic transport (GO:0006913) 1/40 0.0171203755 RGS14
83 positive regulation of nervous system development (GO:0051962) 1/45 0.0185736831 RGS14
84 positive regulation of Notch signaling pathway (GO:0045747) 1/45 0.0185736831 STAT3
85 regulation of pri-miRNA transcription by RNA polymerase II (GO:1902893) 1/45 0.0185736831 STAT3
86 negative regulation of MAP kinase activity (GO:0043407) 1/48 0.0193521307 RGS14
87 regulation of interleukin-10 production (GO:0032653) 1/48 0.0193521307 STAT3
88 regulation of stress-activated MAPK cascade (GO:0032872) 1/49 0.0195293443 CARD9
89 negative regulation of ERK1 and ERK2 cascade (GO:0070373) 1/50 0.0197025166 RGS14
90 response to peptide hormone (GO:0043434) 1/52 0.0202599064 STAT3
91 positive regulation of interleukin-1 beta production (GO:0032731) 1/56 0.0215721292 STAT3
92 negative regulation of autophagy (GO:0010507) 1/59 0.0221674956 STAT3
93 positive regulation of tyrosine phosphorylation of STAT protein (GO:0042531) 1/59 0.0221674956 STAT3
94 response to organic cyclic compound (GO:0014070) 1/60 0.0221674956 STAT3
95 positive regulation of interleukin-8 production (GO:0032757) 1/61 0.0221674956 STAT3
96 regulation of neurogenesis (GO:0050767) 1/62 0.0221674956 RGS14
97 positive regulation of interleukin-1 production (GO:0032732) 1/62 0.0221674956 STAT3
98 positive regulation of cysteine-type endopeptidase activity (GO:2001056) 1/62 0.0221674956 CARD9
99 regulation of gene silencing by miRNA (GO:0060964) 1/67 0.0237043363 STAT3
100 regulation of tyrosine phosphorylation of STAT protein (GO:0042509) 1/68 0.0238157651 STAT3
101 negative regulation of cellular catabolic process (GO:0031330) 1/69 0.0239249354 STAT3
102 carbohydrate homeostasis (GO:0033500) 1/70 0.0240319137 STAT3
103 positive regulation of neurogenesis (GO:0050769) 1/72 0.0242789687 RGS14
104 positive regulation of JNK cascade (GO:0046330) 1/73 0.0242789687 CARD9
105 positive regulation of synaptic transmission (GO:0050806) 1/73 0.0242789687 RGS14
106 NIK/NF-kappaB signaling (GO:0038061) 1/74 0.0242789687 TNFSF15
107 cellular response to hormone stimulus (GO:0032870) 1/76 0.0242789687 STAT3
108 establishment of protein localization to organelle (GO:0072594) 1/76 0.0242789687 STAT3
109 protein import into nucleus (GO:0006606) 1/76 0.0242789687 STAT3
110 positive regulation of tumor necrosis factor production (GO:0032760) 1/77 0.0242789687 STAT3
111 import into nucleus (GO:0051170) 1/77 0.0242789687 STAT3
112 negative regulation of protein serine/threonine kinase activity (GO:0071901) 1/78 0.0243728600 RGS14
113 activation of cysteine-type endopeptidase activity involved in apoptotic process (GO:0006919) 1/81 0.0246072522 TNFSF15
114 positive regulation of tumor necrosis factor superfamily cytokine production (GO:1903557) 1/81 0.0246072522 STAT3
115 regulation of interleukin-8 production (GO:0032677) 1/81 0.0246072522 STAT3
116 regulation of G protein-coupled receptor signaling pathway (GO:0008277) 1/82 0.0246072522 RGS14
117 regulation of Notch signaling pathway (GO:0008593) 1/83 0.0246072522 STAT3
118 regulation of interleukin-1 beta production (GO:0032651) 1/83 0.0246072522 STAT3
119 glucose homeostasis (GO:0042593) 1/86 0.0252767242 STAT3
120 regulation of cysteine-type endopeptidase activity involved in apoptotic process (GO:0043281) 1/89 0.0257203099 CARD9
121 protein import (GO:0017038) 1/89 0.0257203099 STAT3
122 protein complex oligomerization (GO:0051259) 1/90 0.0257941760 CARD9
123 negative regulation of MAPK cascade (GO:0043409) 1/94 0.0267135370 RGS14
124 regulation of MAP kinase activity (GO:0043405) 1/97 0.0273376355 RGS14
125 positive regulation of stress-activated MAPK cascade (GO:0032874) 1/99 0.0276739347 CARD9
126 regulation of JNK cascade (GO:0046328) 1/105 0.0291050911 CARD9
127 protein localization to nucleus (GO:0034504) 1/106 0.0291487385 STAT3
128 activation of protein kinase activity (GO:0032147) 1/114 0.0304052244 TNFSF15
129 response to lipid (GO:0033993) 1/114 0.0304052244 STAT3
130 cellular response to lectin (GO:1990858) 1/115 0.0304052244 CARD9
131 stimulatory C-type lectin receptor signaling pathway (GO:0002223) 1/115 0.0304052244 CARD9
132 positive regulation of protein metabolic process (GO:0051247) 1/115 0.0304052244 CARD9
133 tumor necrosis factor-mediated signaling pathway (GO:0033209) 1/116 0.0304367347 TNFSF15
134 innate immune response activating cell surface receptor signaling pathway (GO:0002220) 1/119 0.0309839008 CARD9
135 protein homooligomerization (GO:0051260) 1/121 0.0312665773 CARD9
136 cellular response to organic substance (GO:0071310) 1/123 0.0315449435 STAT3
137 regulation of tumor necrosis factor production (GO:0032680) 1/124 0.0315669100 STAT3
138 positive regulation of peptidyl-tyrosine phosphorylation (GO:0050731) 1/134 0.0338400258 STAT3
139 response to cytokine (GO:0034097) 1/150 0.0372946513 STAT3
140 regulation of cytokine production (GO:0001817) 1/150 0.0372946513 CARD9
141 positive regulation of I-kappaB kinase/NF-kappaB signaling (GO:0043123) 1/171 0.0420926262 CARD9
142 positive regulation of ERK1 and ERK2 cascade (GO:0070374) 1/172 0.0420926262 CARD9
143 cellular response to tumor necrosis factor (GO:0071356) 1/194 0.0470667324 TNFSF15
144 regulation of signal transduction (GO:0009966) 1/198 0.0476892587 RGS14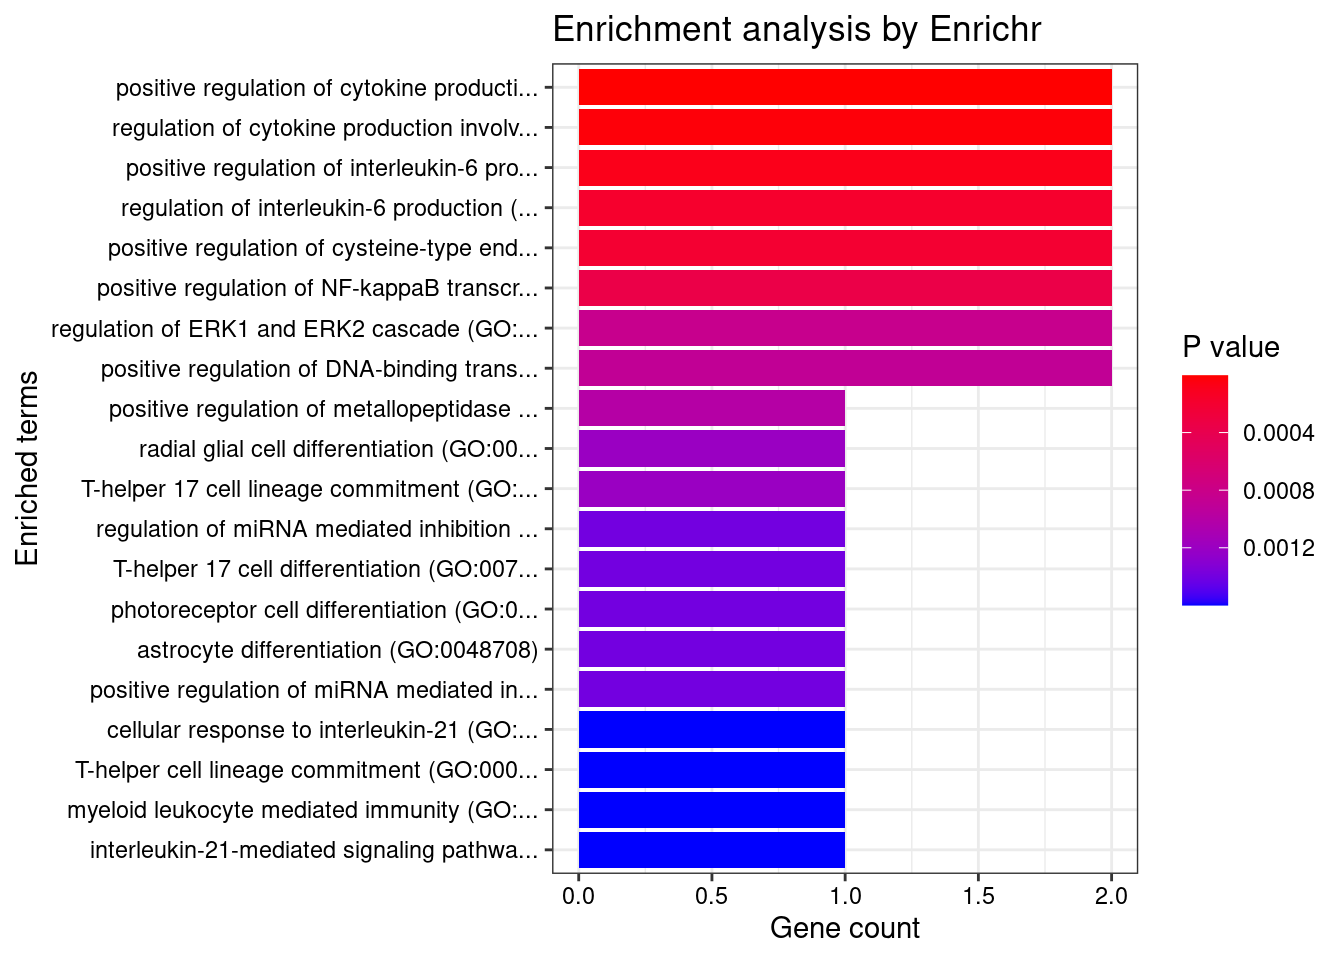
| Version | Author | Date |
|---|---|---|
| 397176f | wesleycrouse | 2022-06-10 |
KEGG
output <- output[order(-output$pve_g),]
top_tissues <- output$weight[1:5]
for (tissue in top_tissues){
cat(paste0(tissue, "\n\n"))
ctwas_genes_tissue <- df[[tissue]]$ctwas
background_tissue <- df[[tissue]]$gene_pips$genename
cat(paste0("Number of cTWAS Genes in Tissue: ", length(ctwas_genes_tissue), "\n\n"))
databases <- c("pathway_KEGG")
enrichResult <- NULL
try(enrichResult <- WebGestaltR(enrichMethod="ORA", organism="hsapiens",
interestGene=ctwas_genes_tissue, referenceGene=background_tissue,
enrichDatabase=databases, interestGeneType="genesymbol",
referenceGeneType="genesymbol", isOutput=F))
if (!is.null(enrichResult)){
print(enrichResult[,c("description", "size", "overlap", "FDR", "userId")])
}
cat("\n")
} Whole_Blood
Number of cTWAS Genes in Tissue: 13
Loading the functional categories...
Loading the ID list...
Loading the reference list...
Performing the enrichment analysis...Warning in oraEnrichment(interestGeneList, referenceGeneList, geneSet, minNum = minNum, : No significant gene set is identified based on FDR 0.05!
Esophagus_Muscularis
Number of cTWAS Genes in Tissue: 8
Loading the functional categories...
Loading the ID list...
Loading the reference list...
Performing the enrichment analysis...Warning in oraEnrichment(interestGeneList, referenceGeneList, geneSet, minNum = minNum, : No significant gene set is identified based on FDR 0.05!
Skin_Not_Sun_Exposed_Suprapubic
Number of cTWAS Genes in Tissue: 3
Loading the functional categories...
Loading the ID list...
Loading the reference list...
Performing the enrichment analysis...Warning in oraEnrichment(interestGeneList, referenceGeneList, geneSet, minNum = minNum, : No significant gene set is identified based on FDR 0.05!
Adrenal_Gland
Number of cTWAS Genes in Tissue: 5
Loading the functional categories...
Loading the ID list...
Loading the reference list...
Performing the enrichment analysis...Warning in oraEnrichment(interestGeneList, referenceGeneList, geneSet, minNum = minNum, : No significant gene set is identified based on FDR 0.05!
Uterus
Number of cTWAS Genes in Tissue: 4
Loading the functional categories...
Loading the ID list...
Loading the reference list...
Performing the enrichment analysis...Warning in oraEnrichment(interestGeneList, referenceGeneList, geneSet, minNum = minNum, : No significant gene set is identified based on FDR 0.05!DisGeNET
output <- output[order(-output$pve_g),]
top_tissues <- output$weight[1:5]
for (tissue in top_tissues){
cat(paste0(tissue, "\n\n"))
ctwas_genes_tissue <- df[[tissue]]$ctwas
cat(paste0("Number of cTWAS Genes in Tissue: ", length(ctwas_genes_tissue), "\n\n"))
res_enrich <- disease_enrichment(entities=ctwas_genes_tissue, vocabulary = "HGNC", database = "CURATED")
if (any(res_enrich@qresult$FDR < 0.05)){
  print(res_enrich@qresult[res_enrich@qresult$FDR < 0.05, c("Description", "FDR", "Ratio",  "BgRatio")])
}
cat("\n")
} Whole_Blood
Number of cTWAS Genes in Tissue: 13NPIPB3 gene(s) from the input list not found in DisGeNET CURATEDCPEB4 gene(s) from the input list not found in DisGeNET CURATEDBIK gene(s) from the input list not found in DisGeNET CURATEDZNF300 gene(s) from the input list not found in DisGeNET CURATEDADAM15 gene(s) from the input list not found in DisGeNET CURATEDBRD7 gene(s) from the input list not found in DisGeNET CURATEDC10orf105 gene(s) from the input list not found in DisGeNET CURATED Description FDR Ratio BgRatio
16 Ulcerative Colitis 0.0009013436 3/6 63/9703
25 Enteritis 0.0072150072 1/6 1/9703
35 Inflammatory Bowel Diseases 0.0072150072 2/6 35/9703
70 West Nile Fever 0.0072150072 1/6 1/9703
117 Encephalitis, West Nile Fever 0.0072150072 1/6 1/9703
118 West Nile Fever Meningitis 0.0072150072 1/6 1/9703
119 West Nile Fever Meningoencephalitis 0.0072150072 1/6 1/9703
120 West Nile Fever Myelitis 0.0072150072 1/6 1/9703
139 Deep seated dermatophytosis 0.0072150072 1/6 1/9703
141 Chronic Lymphoproliferative Disorder of NK-Cells 0.0072150072 1/6 1/9703
155 DIABETES MELLITUS, INSULIN-DEPENDENT, 22 (disorder) 0.0072150072 1/6 1/9703
157 Neutropenia and hyperlymphocytosis with large granular lymphocytes 0.0072150072 1/6 1/9703
159 Hyper-Ige Recurrent Infection Syndrome, Autosomal Dominant 0.0072150072 1/6 1/9703
164 AUTOIMMUNE DISEASE, MULTISYSTEM, INFANTILE-ONSET, 1 0.0072150072 1/6 1/9703
174 HYPER-IgE RECURRENT INFECTION SYNDROME 1, AUTOSOMAL DOMINANT 0.0072150072 1/6 1/9703
148 Visceral myopathy familial external ophthalmoplegia 0.0108197218 1/6 2/9703
149 Candidiasis, Familial, 2 0.0108197218 1/6 2/9703
152 T-Cell Large Granular Lymphocyte Leukemia 0.0108197218 1/6 2/9703
156 MITOCHONDRIAL DNA DEPLETION SYNDROME 5 (ENCEPHALOMYOPATHIC WITH OR WITHOUT METHYLMALONIC ACIDURIA) 0.0108197218 1/6 2/9703
166 Mitochondrial DNA Depletion Syndrome 1 0.0108197218 1/6 2/9703
58 Pancreatic Neoplasm 0.0127078576 2/6 100/9703
104 Malignant neoplasm of pancreas 0.0127078576 2/6 102/9703
126 MITOCHONDRIAL NEUROGASTROINTESTINAL ENCEPHALOPATHY SYNDROME 0.0129803203 1/6 3/9703
153 Hyper-Immunoglobulin E Syndrome, Autosomal Recessive 0.0129803203 1/6 3/9703
158 Hyper-Immunoglobulin E Syndrome, Autosomal Dominant 0.0129803203 1/6 3/9703
34 Inflammation 0.0154487801 2/6 127/9703
89 Ki-1+ Anaplastic Large Cell Lymphoma 0.0154487801 1/6 4/9703
163 Job Syndrome 0.0154487801 1/6 4/9703
12 Neoplastic Cell Transformation 0.0177675850 2/6 139/9703
41 Leukemia, T-Cell 0.0180189322 1/6 5/9703
8 Carcinoma 0.0192733691 2/6 164/9703
9 Malignant tumor of colon 0.0192733691 2/6 159/9703
17 Colonic Neoplasms 0.0192733691 2/6 152/9703
83 Anaplastic carcinoma 0.0192733691 2/6 163/9703
84 Carcinoma, Spindle-Cell 0.0192733691 2/6 163/9703
85 Undifferentiated carcinoma 0.0192733691 2/6 163/9703
86 Carcinomatosis 0.0192733691 2/6 163/9703
147 DIABETES MELLITUS, PERMANENT NEONATAL 0.0199053993 1/6 7/9703
55 Nephritis 0.0249235849 1/6 9/9703
101 Atrophic 0.0269935931 1/6 10/9703
68 Ankylosing spondylitis 0.0276142340 1/6 11/9703
96 Leukoencephalopathy 0.0276142340 1/6 11/9703
150 Copper-Overload Cirrhosis 0.0276142340 1/6 11/9703
53 Neoplasm Metastasis 0.0280032509 2/6 217/9703
39 Precursor B-Cell Lymphoblastic Leukemia-Lymphoma 0.0287783300 1/6 12/9703
31 Hepatitis C 0.0351636987 1/6 15/9703
71 T-Cell Lymphoma 0.0367004458 1/6 16/9703
30 Hepatitis, Chronic 0.0388213522 1/6 22/9703
47 Malignant neoplasm of stomach 0.0388213522 2/6 300/9703
69 Stomach Neoplasms 0.0388213522 2/6 297/9703
76 Chronic Persistent Hepatitis 0.0388213522 1/6 22/9703
91 Congenital diaphragmatic hernia 0.0388213522 1/6 21/9703
93 Congenital hernia of foramen of Morgagni 0.0388213522 1/6 19/9703
94 Congenital hernia of foramen of Bochdalek 0.0388213522 1/6 19/9703
106 Chronic active hepatitis 0.0388213522 1/6 22/9703
107 Cryptogenic Chronic Hepatitis 0.0388213522 1/6 22/9703
145 Hereditary Diffuse Gastric Cancer 0.0388213522 2/6 293/9703
146 Idiopathic Pulmonary Fibrosis 0.0388213522 1/6 21/9703
172 Hamman-Rich Disease 0.0388213522 1/6 19/9703
173 Usual Interstitial Pneumonia 0.0388213522 1/6 19/9703
175 Familial Idiopathic Pulmonary Fibrosis 0.0388213522 1/6 20/9703
77 Neonatal diabetes mellitus 0.0433701033 1/6 25/9703
46 Lymphatic Metastasis 0.0443775220 1/6 26/9703
26 Fever 0.0453525963 1/6 27/9703
28 IGA Glomerulonephritis 0.0480065552 1/6 34/9703
42 Adult T-Cell Lymphoma/Leukemia 0.0480065552 1/6 31/9703
92 Middle Cerebral Artery Syndrome 0.0480065552 1/6 34/9703
109 Middle Cerebral Artery Thrombosis 0.0480065552 1/6 34/9703
110 Middle Cerebral Artery Occlusion 0.0480065552 1/6 34/9703
111 Infarction, Middle Cerebral Artery 0.0480065552 1/6 34/9703
121 Middle Cerebral Artery Embolus 0.0480065552 1/6 34/9703
122 Left Middle Cerebral Artery Infarction 0.0480065552 1/6 34/9703
123 Embolic Infarction, Middle Cerebral Artery 0.0480065552 1/6 34/9703
124 Thrombotic Infarction, Middle Cerebral Artery 0.0480065552 1/6 34/9703
125 Right Middle Cerebral Artery Infarction 0.0480065552 1/6 34/9703
165 cervical cancer 0.0480065552 1/6 34/9703
2 Arthritis, Adjuvant-Induced 0.0480555122 1/6 40/9703
4 Autoimmune Diseases 0.0480555122 1/6 42/9703
14 Uterine Cervical Neoplasm 0.0480555122 1/6 35/9703
22 Dermatitis, Atopic 0.0480555122 1/6 36/9703
51 Memory Disorders 0.0480555122 1/6 43/9703
72 Eczema, Infantile 0.0480555122 1/6 36/9703
87 Diabetes, Autoimmune 0.0480555122 1/6 44/9703
88 Medullomyoblastoma 0.0480555122 1/6 43/9703
90 Memory impairment 0.0480555122 1/6 44/9703
97 Childhood Medulloblastoma 0.0480555122 1/6 43/9703
98 Adult Medulloblastoma 0.0480555122 1/6 43/9703
102 Brittle diabetes 0.0480555122 1/6 44/9703
112 Desmoplastic Medulloblastoma 0.0480555122 1/6 43/9703
113 Age-Related Memory Disorders 0.0480555122 1/6 43/9703
114 Memory Disorder, Semantic 0.0480555122 1/6 43/9703
115 Memory Disorder, Spatial 0.0480555122 1/6 43/9703
116 Memory Loss 0.0480555122 1/6 43/9703
130 Arthritis, Collagen-Induced 0.0480555122 1/6 40/9703
131 Arthritis, Experimental 0.0480555122 1/6 40/9703
137 Melanotic medulloblastoma 0.0480555122 1/6 43/9703
162 Diabetes Mellitus, Ketosis-Prone 0.0480555122 1/6 44/9703
168 Diabetes Mellitus, Sudden-Onset 0.0480555122 1/6 44/9703
23 Diabetes Mellitus, Insulin-Dependent 0.0486387134 1/6 45/9703
40 Acute Promyelocytic Leukemia 0.0492097029 1/6 46/9703
15 Primary biliary cirrhosis 0.0497688436 1/6 47/9703
Esophagus_Muscularis
Number of cTWAS Genes in Tissue: 8ADAM15 gene(s) from the input list not found in DisGeNET CURATEDRGS14 gene(s) from the input list not found in DisGeNET CURATED Description FDR Ratio BgRatio
11 Inflammatory Bowel Diseases 3.161429e-05 3/6 35/9703
5 Ulcerative Colitis 9.528490e-05 3/6 63/9703
6 Enteritis 3.813647e-03 1/6 1/9703
28 Deep seated dermatophytosis 3.813647e-03 1/6 1/9703
30 Retinitis Pigmentosa 14 3.813647e-03 1/6 1/9703
34 LEBER CONGENITAL AMAUROSIS 15 3.813647e-03 1/6 1/9703
32 Candidiasis, Familial, 2 6.535995e-03 1/6 2/9703
33 clinical depression 1.713931e-02 1/6 6/9703
18 Ankylosing spondylitis 2.789476e-02 1/6 11/9703
1 Behcet Syndrome 3.211294e-02 1/6 24/9703
15 Noonan Syndrome 3.211294e-02 1/6 24/9703
20 LEOPARD Syndrome 3.211294e-02 1/6 22/9703
22 Leber Congenital Amaurosis 3.211294e-02 1/6 22/9703
24 Costello syndrome (disorder) 3.211294e-02 1/6 19/9703
27 Cardio-facio-cutaneous syndrome 3.211294e-02 1/6 19/9703
31 Noonan syndrome-like disorder with loose anagen hair 3.211294e-02 1/6 19/9703
35 Noonan-Like Syndrome With Loose Anagen Hair 3.211294e-02 1/6 19/9703
9 Heart valve disease 3.283937e-02 1/6 26/9703
8 IGA Glomerulonephritis 4.059983e-02 1/6 34/9703
3 Calcinosis 4.322456e-02 1/6 42/9703
21 Tumoral calcinosis 4.322456e-02 1/6 42/9703
23 Microcalcification 4.322456e-02 1/6 42/9703
4 Primary biliary cirrhosis 4.428242e-02 1/6 47/9703
12 Acute Promyelocytic Leukemia 4.428242e-02 1/6 46/9703
Skin_Not_Sun_Exposed_Suprapubic
Number of cTWAS Genes in Tissue: 3
Description FDR Ratio BgRatio
9 Cutis Laxa, Autosomal Recessive, Type I 0.003091827 1/3 2/9703
12 Cutis laxa, recessive, type I 0.003091827 1/3 2/9703
14 CUTIS LAXA, AUTOSOMAL RECESSIVE, TYPE IB 0.003091827 1/3 1/9703
17 MYOPIA 25, AUTOSOMAL DOMINANT 0.003091827 1/3 1/9703
1 Aortic Aneurysm 0.007210546 1/3 7/9703
2 Cutis Laxa 0.007210546 1/3 6/9703
20 Familial thoracic aortic aneurysm and aortic dissection 0.046573375 1/3 53/9703
Adrenal_Gland
Number of cTWAS Genes in Tissue: 5RGS14 gene(s) from the input list not found in DisGeNET CURATEDADAM15 gene(s) from the input list not found in DisGeNET CURATED Description FDR Ratio BgRatio
12 Inflammatory Bowel Diseases 0.002498260 2/3 35/9703
2 Ulcerative Colitis 0.003401361 2/3 63/9703
5 Enteritis 0.003401361 1/3 1/9703
56 Deep seated dermatophytosis 0.003401361 1/3 1/9703
61 EPILEPSY, IDIOPATHIC GENERALIZED, SUSCEPTIBILITY TO, 14 0.003401361 1/3 1/9703
62 EPILEPTIC ENCEPHALOPATHY, EARLY INFANTILE, 34 0.003401361 1/3 1/9703
57 Candidiasis, Familial, 2 0.005830303 1/3 2/9703
29 Idiopathic generalized epilepsy 0.015298235 1/3 6/9703
4 Febrile Convulsions 0.020391338 1/3 9/9703
17 Ankylosing spondylitis 0.022425846 1/3 11/9703
7 Epilepsy, Temporal Lobe 0.033451717 1/3 23/9703
8 Uncinate Epilepsy 0.033451717 1/3 23/9703
31 Epilepsy, Benign Psychomotor, Childhood 0.033451717 1/3 23/9703
32 Epilepsy, Lateral Temporal 0.033451717 1/3 23/9703
1 Primary biliary cirrhosis 0.034999882 1/3 47/9703
9 IGA Glomerulonephritis 0.034999882 1/3 34/9703
10 Hyperalgesia 0.034999882 1/3 84/9703
13 Jacksonian Seizure 0.034999882 1/3 101/9703
14 Degenerative polyarthritis 0.034999882 1/3 93/9703
18 Status Epilepticus 0.034999882 1/3 68/9703
19 Epilepsy, Cryptogenic 0.034999882 1/3 82/9703
20 Osteoarthrosis Deformans 0.034999882 1/3 93/9703
21 Complex partial seizures 0.034999882 1/3 101/9703
22 Generalized seizures 0.034999882 1/3 101/9703
23 Clonic Seizures 0.034999882 1/3 101/9703
24 Aura 0.034999882 1/3 82/9703
25 Petit mal status 0.034999882 1/3 67/9703
26 Visual seizure 0.034999882 1/3 101/9703
27 Tonic Seizures 0.034999882 1/3 102/9703
28 Epileptic drop attack 0.034999882 1/3 101/9703
30 Grand Mal Status Epilepticus 0.034999882 1/3 67/9703
33 Complex Partial Status Epilepticus 0.034999882 1/3 67/9703
34 Seizures, Somatosensory 0.034999882 1/3 101/9703
35 Seizures, Auditory 0.034999882 1/3 101/9703
36 Olfactory seizure 0.034999882 1/3 101/9703
37 Gustatory seizure 0.034999882 1/3 101/9703
38 Vertiginous seizure 0.034999882 1/3 101/9703
39 Allodynia 0.034999882 1/3 84/9703
40 Tonic - clonic seizures 0.034999882 1/3 104/9703
42 Non-epileptic convulsion 0.034999882 1/3 101/9703
43 Single Seizure 0.034999882 1/3 101/9703
44 Awakening Epilepsy 0.034999882 1/3 82/9703
45 Atonic Absence Seizures 0.034999882 1/3 101/9703
46 Hyperalgesia, Primary 0.034999882 1/3 84/9703
47 Hyperalgesia, Secondary 0.034999882 1/3 84/9703
48 Tactile Allodynia 0.034999882 1/3 84/9703
49 Hyperalgesia, Thermal 0.034999882 1/3 84/9703
50 Convulsive Seizures 0.034999882 1/3 101/9703
51 Seizures, Focal 0.034999882 1/3 104/9703
52 Seizures, Sensory 0.034999882 1/3 101/9703
53 Status Epilepticus, Subclinical 0.034999882 1/3 67/9703
54 Non-Convulsive Status Epilepticus 0.034999882 1/3 67/9703
55 Simple Partial Status Epilepticus 0.034999882 1/3 67/9703
58 Mechanical Allodynia 0.034999882 1/3 84/9703
59 Nonepileptic Seizures 0.034999882 1/3 101/9703
60 Convulsions 0.034999882 1/3 102/9703
63 Absence Seizures 0.034999882 1/3 102/9703
64 Epileptic Seizures 0.034999882 1/3 101/9703
65 Myoclonic Seizures 0.034999882 1/3 104/9703
66 Generalized Absence Seizures 0.034999882 1/3 101/9703
6 Epilepsy 0.036062556 1/3 109/9703
11 Inflammation 0.041263188 1/3 127/9703
Uterus
Number of cTWAS Genes in Tissue: 4RGS14 gene(s) from the input list not found in DisGeNET CURATED Description FDR Ratio BgRatio
14 Ulcerative Colitis 3.838827e-05 3/3 63/9703
28 Inflammatory Bowel Diseases 2.782154e-03 2/3 35/9703
19 Enteritis 5.050505e-03 1/3 1/9703
117 Deep seated dermatophytosis 5.050505e-03 1/3 1/9703
119 Chronic Lymphoproliferative Disorder of NK-Cells 5.050505e-03 1/3 1/9703
130 Neutropenia and hyperlymphocytosis with large granular lymphocytes 5.050505e-03 1/3 1/9703
132 Hyper-Ige Recurrent Infection Syndrome, Autosomal Dominant 5.050505e-03 1/3 1/9703
137 AUTOIMMUNE DISEASE, MULTISYSTEM, INFANTILE-ONSET, 1 5.050505e-03 1/3 1/9703
146 HYPER-IgE RECURRENT INFECTION SYNDROME 1, AUTOSOMAL DOMINANT 5.050505e-03 1/3 1/9703
27 Inflammation 7.434933e-03 2/3 127/9703
125 Candidiasis, Familial, 2 7.574977e-03 1/3 2/9703
128 T-Cell Large Granular Lymphocyte Leukemia 7.574977e-03 1/3 2/9703
129 Hyper-Immunoglobulin E Syndrome, Autosomal Recessive 9.738252e-03 1/3 3/9703
131 Hyper-Immunoglobulin E Syndrome, Autosomal Dominant 9.738252e-03 1/3 3/9703
76 Ki-1+ Anaplastic Large Cell Lymphoma 1.136012e-02 1/3 4/9703
136 Job Syndrome 1.136012e-02 1/3 4/9703
33 Leukemia, T-Cell 1.336347e-02 1/3 5/9703
124 DIABETES MELLITUS, PERMANENT NEONATAL 1.766584e-02 1/3 7/9703
57 Ankylosing spondylitis 2.378499e-02 1/3 11/9703
85 Atrophic 2.378499e-02 1/3 10/9703
126 Copper-Overload Cirrhosis 2.378499e-02 1/3 11/9703
31 Precursor B-Cell Lymphoblastic Leukemia-Lymphoma 2.476528e-02 1/3 12/9703
2 Arthritis, Adjuvant-Induced 2.885721e-02 1/3 40/9703
4 Autoimmune Diseases 2.885721e-02 1/3 42/9703
12 Uterine Cervical Neoplasm 2.885721e-02 1/3 35/9703
20 Fever 2.885721e-02 1/3 27/9703
22 IGA Glomerulonephritis 2.885721e-02 1/3 34/9703
24 Hepatitis, Chronic 2.885721e-02 1/3 22/9703
34 Adult T-Cell Lymphoma/Leukemia 2.885721e-02 1/3 31/9703
38 Lymphatic Metastasis 2.885721e-02 1/3 26/9703
43 Memory Disorders 2.885721e-02 1/3 43/9703
59 T-Cell Lymphoma 2.885721e-02 1/3 16/9703
63 Chronic Persistent Hepatitis 2.885721e-02 1/3 22/9703
64 Neonatal diabetes mellitus 2.885721e-02 1/3 25/9703
74 Diabetes, Autoimmune 2.885721e-02 1/3 44/9703
75 Medullomyoblastoma 2.885721e-02 1/3 43/9703
77 Memory impairment 2.885721e-02 1/3 44/9703
78 Congenital diaphragmatic hernia 2.885721e-02 1/3 21/9703
79 Middle Cerebral Artery Syndrome 2.885721e-02 1/3 34/9703
80 Congenital hernia of foramen of Morgagni 2.885721e-02 1/3 19/9703
81 Congenital hernia of foramen of Bochdalek 2.885721e-02 1/3 19/9703
82 Childhood Medulloblastoma 2.885721e-02 1/3 43/9703
83 Adult Medulloblastoma 2.885721e-02 1/3 43/9703
86 Brittle diabetes 2.885721e-02 1/3 44/9703
90 Chronic active hepatitis 2.885721e-02 1/3 22/9703
91 Cryptogenic Chronic Hepatitis 2.885721e-02 1/3 22/9703
93 Middle Cerebral Artery Thrombosis 2.885721e-02 1/3 34/9703
94 Middle Cerebral Artery Occlusion 2.885721e-02 1/3 34/9703
95 Infarction, Middle Cerebral Artery 2.885721e-02 1/3 34/9703
96 Desmoplastic Medulloblastoma 2.885721e-02 1/3 43/9703
97 Age-Related Memory Disorders 2.885721e-02 1/3 43/9703
98 Memory Disorder, Semantic 2.885721e-02 1/3 43/9703
99 Memory Disorder, Spatial 2.885721e-02 1/3 43/9703
100 Memory Loss 2.885721e-02 1/3 43/9703
101 Middle Cerebral Artery Embolus 2.885721e-02 1/3 34/9703
102 Left Middle Cerebral Artery Infarction 2.885721e-02 1/3 34/9703
103 Embolic Infarction, Middle Cerebral Artery 2.885721e-02 1/3 34/9703
104 Thrombotic Infarction, Middle Cerebral Artery 2.885721e-02 1/3 34/9703
105 Right Middle Cerebral Artery Infarction 2.885721e-02 1/3 34/9703
109 Arthritis, Collagen-Induced 2.885721e-02 1/3 40/9703
110 Arthritis, Experimental 2.885721e-02 1/3 40/9703
115 Melanotic medulloblastoma 2.885721e-02 1/3 43/9703
123 Idiopathic Pulmonary Fibrosis 2.885721e-02 1/3 21/9703
135 Diabetes Mellitus, Ketosis-Prone 2.885721e-02 1/3 44/9703
138 cervical cancer 2.885721e-02 1/3 34/9703
140 Diabetes Mellitus, Sudden-Onset 2.885721e-02 1/3 44/9703
144 Hamman-Rich Disease 2.885721e-02 1/3 19/9703
145 Usual Interstitial Pneumonia 2.885721e-02 1/3 19/9703
147 Familial Idiopathic Pulmonary Fibrosis 2.885721e-02 1/3 20/9703
18 Diabetes Mellitus, Insulin-Dependent 2.908844e-02 1/3 45/9703
32 Acute Promyelocytic Leukemia 2.931302e-02 1/3 46/9703
13 Primary biliary cirrhosis 2.953124e-02 1/3 47/9703
16 Crohn Disease 2.975351e-02 1/3 50/9703
21 Fibrosis 2.975351e-02 1/3 50/9703
42 Medulloblastoma 2.975351e-02 1/3 50/9703
121 Cirrhosis 2.975351e-02 1/3 50/9703
112 Squamous cell carcinoma of the head and neck 3.053548e-02 1/3 52/9703
29 leukemia 3.187320e-02 1/3 55/9703
48 Pustulosis of Palms and Soles 3.219976e-02 1/3 57/9703
53 Psoriasis 3.219976e-02 1/3 57/9703
3 Atherosclerosis 3.227046e-02 1/3 59/9703
11 Brain Ischemia 3.227046e-02 1/3 60/9703
107 Cerebral Ischemia 3.227046e-02 1/3 60/9703
120 Atherogenesis 3.227046e-02 1/3 59/9703
46 Neoplasms, Experimental 3.505816e-02 1/3 66/9703
51 Cardiomyopathies, Primary 3.579804e-02 1/3 69/9703
56 Myocardial Diseases, Secondary 3.579804e-02 1/3 69/9703
37 Lung diseases 3.997030e-02 1/3 78/9703
23 Cardiomegaly 4.106930e-02 1/3 82/9703
116 Cardiac Hypertrophy 4.106930e-02 1/3 82/9703
143 Alveolitis, Fibrosing 4.110908e-02 1/3 83/9703
54 Pulmonary Fibrosis 4.163344e-02 1/3 85/9703
55 Reperfusion Injury 4.310610e-02 1/3 89/9703
47 Degenerative polyarthritis 4.407693e-02 1/3 93/9703
61 Osteoarthrosis Deformans 4.407693e-02 1/3 93/9703
49 Pancreatic Neoplasm 4.686691e-02 1/3 100/9703
88 Malignant neoplasm of pancreas 4.730164e-02 1/3 102/9703
1 Adenocarcinoma 4.780245e-02 1/3 116/9703
25 Hepatoma, Morris 4.780245e-02 1/3 110/9703
26 Hepatoma, Novikoff 4.780245e-02 1/3 110/9703
36 Liver Neoplasms, Experimental 4.780245e-02 1/3 110/9703
50 Precancerous Conditions 4.780245e-02 1/3 110/9703
60 Experimental Hepatoma 4.780245e-02 1/3 110/9703
65 Adenocarcinoma, Basal Cell 4.780245e-02 1/3 116/9703
66 Adenocarcinoma, Oxyphilic 4.780245e-02 1/3 116/9703
67 Carcinoma, Cribriform 4.780245e-02 1/3 116/9703
68 Carcinoma, Granular Cell 4.780245e-02 1/3 116/9703
69 Adenocarcinoma, Tubular 4.780245e-02 1/3 116/9703
84 Condition, Preneoplastic 4.780245e-02 1/3 110/9703Gene sets curated by Macarthur Lab
output <- output[order(-output$pve_g),]
top_tissues <- output$weight[1:5]

gene_set_dir <- "/project2/mstephens/wcrouse/gene_sets/"
gene_set_files <- c("gwascatalog.tsv",
                    "mgi_essential.tsv",
                    "core_essentials_hart.tsv",
                    "clinvar_path_likelypath.tsv",
                    "fda_approved_drug_targets.tsv")

for (tissue in top_tissues){
  cat(paste0(tissue, "\n\n"))

  ctwas_genes_tissue <- df[[tissue]]$ctwas
  background_tissue <- df[[tissue]]$gene_pips$genename

  cat(paste0("Number of cTWAS Genes in Tissue: ", length(ctwas_genes_tissue), "\n\n"))

  gene_sets <- lapply(gene_set_files, function(x){as.character(read.table(paste0(gene_set_dir, x))[,1])})
  names(gene_sets) <- sapply(gene_set_files, function(x){unlist(strsplit(x, "[.]"))[1]})

  gene_lists <- list(ctwas_genes_tissue=ctwas_genes_tissue)

  #genes in gene_sets filtered to ensure inclusion in background
  gene_sets <- lapply(gene_sets, function(x){x[x %in% background_tissue]})

  ##########
  hyp_score <- data.frame()
  size <- c()
  ngenes <- c()

  for (i in 1:length(gene_sets)) {
    for (j in 1:length(gene_lists)){
      group1 <- length(gene_sets[[i]])
      group2 <- length(as.vector(gene_lists[[j]]))
      size <- c(size, group1)
      Overlap <- length(intersect(gene_sets[[i]],as.vector(gene_lists[[j]])))
      ngenes <- c(ngenes, Overlap)
      Total <- length(background_tissue)
      hyp_score[i,j] <- phyper(Overlap-1, group2, Total-group2, group1,lower.tail=F)
    }
  }
  rownames(hyp_score) <- names(gene_sets)
  colnames(hyp_score) <- names(gene_lists)

  hyp_score_padj <- apply(hyp_score,2, p.adjust, method="BH", n=(nrow(hyp_score)*ncol(hyp_score)))
  hyp_score_padj <- as.data.frame(hyp_score_padj)
  hyp_score_padj$gene_set <- rownames(hyp_score_padj)
  hyp_score_padj$nset <- size
  hyp_score_padj$ngenes <- ngenes
  hyp_score_padj$percent <- ngenes/size

  hyp_score_padj <- hyp_score_padj[order(hyp_score_padj$ctwas_genes),]
  colnames(hyp_score_padj)[1] <- "padj"
  hyp_score_padj <- hyp_score_padj[,c(2:5,1)]
  rownames(hyp_score_padj)<- NULL

  print(hyp_score_padj)

  cat("\n")
}
Whole_Blood
Number of cTWAS Genes in Tissue: 13
gene_set nset ngenes percent padj
1 fda_approved_drug_targets 177 2 0.011299435 0.1123918
2 clinvar_path_likelypath 1605 4 0.002492212 0.3834035
3 gwascatalog 3492 5 0.001431844 0.6577661
4 mgi_essential 1255 2 0.001593625 0.6577661
5 core_essentials_hart 154 0 0.000000000 1.0000000
Esophagus_Muscularis
Number of cTWAS Genes in Tissue: 8
gene_set nset ngenes percent padj
1 gwascatalog 3890 6 0.0015424165 0.1362487
2 fda_approved_drug_targets 194 1 0.0051546392 0.3331416
3 clinvar_path_likelypath 1778 2 0.0011248594 0.6362565
4 mgi_essential 1413 1 0.0007077141 0.8361263
5 core_essentials_hart 175 0 0.0000000000 1.0000000
Skin_Not_Sun_Exposed_Suprapubic
Number of cTWAS Genes in Tissue: 3
gene_set nset ngenes percent padj
1 mgi_essential 1462 2 0.0013679891 0.2332385
2 gwascatalog 3930 2 0.0005089059 0.6907994
3 clinvar_path_likelypath 1830 1 0.0005464481 0.6907994
4 core_essentials_hart 172 0 0.0000000000 1.0000000
5 fda_approved_drug_targets 207 0 0.0000000000 1.0000000
Adrenal_Gland
Number of cTWAS Genes in Tissue: 5
gene_set nset ngenes percent padj
1 gwascatalog 3460 3 0.0008670520 0.5945492
2 mgi_essential 1234 2 0.0016207455 0.5945492
3 clinvar_path_likelypath 1592 1 0.0006281407 0.9773744
4 core_essentials_hart 152 0 0.0000000000 1.0000000
5 fda_approved_drug_targets 181 0 0.0000000000 1.0000000
Uterus
Number of cTWAS Genes in Tissue: 4
gene_set nset ngenes percent padj
1 gwascatalog 3209 3 0.0009348707 0.2143746
2 mgi_essential 1146 2 0.0017452007 0.2143746
3 clinvar_path_likelypath 1523 2 0.0013131976 0.2143746
4 core_essentials_hart 157 0 0.0000000000 1.0000000
5 fda_approved_drug_targets 169 0 0.0000000000 1.0000000Summary of results across tissues
weight_groups <- as.data.frame(matrix(c("Adipose_Subcutaneous", "Adipose",
                                        "Adipose_Visceral_Omentum", "Adipose",
                                        "Adrenal_Gland", "Endocrine",
                                        "Artery_Aorta", "Cardiovascular",
                                        "Artery_Coronary", "Cardiovascular",
                                        "Artery_Tibial", "Cardiovascular",
                                        "Brain_Amygdala", "CNS",
                                        "Brain_Anterior_cingulate_cortex_BA24", "CNS",
                                        "Brain_Caudate_basal_ganglia", "CNS",
                                        "Brain_Cerebellar_Hemisphere", "CNS",
                                        "Brain_Cerebellum", "CNS",
                                        "Brain_Cortex", "CNS",
                                        "Brain_Frontal_Cortex_BA9", "CNS",
                                        "Brain_Hippocampus", "CNS",
                                        "Brain_Hypothalamus", "CNS",
                                        "Brain_Nucleus_accumbens_basal_ganglia", "CNS",
                                        "Brain_Putamen_basal_ganglia", "CNS",
                                        "Brain_Spinal_cord_cervical_c-1", "CNS",
                                        "Brain_Substantia_nigra", "CNS",
                                        "Breast_Mammary_Tissue", "None",
                                        "Cells_Cultured_fibroblasts", "Skin",
                                        "Cells_EBV-transformed_lymphocytes", "Blood or Immune",
                                        "Colon_Sigmoid", "Digestive",
                                        "Colon_Transverse", "Digestive",
                                        "Esophagus_Gastroesophageal_Junction", "Digestive",
                                        "Esophagus_Mucosa", "Digestive",
                                        "Esophagus_Muscularis", "Digestive",
                                        "Heart_Atrial_Appendage", "Cardiovascular",
                                        "Heart_Left_Ventricle", "Cardiovascular",
                                        "Kidney_Cortex", "None",
                                        "Liver", "None",
                                        "Lung", "None",
                                        "Minor_Salivary_Gland", "None",
                                        "Muscle_Skeletal", "None",
                                        "Nerve_Tibial", "None",
                                        "Ovary", "None",
                                        "Pancreas", "None",
                                        "Pituitary", "Endocrine",
                                        "Prostate", "None",
                                        "Skin_Not_Sun_Exposed_Suprapubic", "Skin",
                                        "Skin_Sun_Exposed_Lower_leg", "Skin",
                                        "Small_Intestine_Terminal_Ileum", "Digestive",
                                        "Spleen", "Blood or Immune",
                                        "Stomach", "Digestive",
                                        "Testis", "Endocrine",
                                        "Thyroid", "Endocrine",
                                        "Uterus", "None",
                                        "Vagina", "None",
                                        "Whole_Blood", "Blood or Immune"),
                                      nrow=49, ncol=2, byrow=T), stringsAsFactors=F)
colnames(weight_groups) <- c("weight", "group")

#display tissue groups
print(weight_groups)
weight group
1 Adipose_Subcutaneous Adipose
2 Adipose_Visceral_Omentum Adipose
3 Adrenal_Gland Endocrine
4 Artery_Aorta Cardiovascular
5 Artery_Coronary Cardiovascular
6 Artery_Tibial Cardiovascular
7 Brain_Amygdala CNS
8 Brain_Anterior_cingulate_cortex_BA24 CNS
9 Brain_Caudate_basal_ganglia CNS
10 Brain_Cerebellar_Hemisphere CNS
11 Brain_Cerebellum CNS
12 Brain_Cortex CNS
13 Brain_Frontal_Cortex_BA9 CNS
14 Brain_Hippocampus CNS
15 Brain_Hypothalamus CNS
16 Brain_Nucleus_accumbens_basal_ganglia CNS
17 Brain_Putamen_basal_ganglia CNS
18 Brain_Spinal_cord_cervical_c-1 CNS
19 Brain_Substantia_nigra CNS
20 Breast_Mammary_Tissue None
21 Cells_Cultured_fibroblasts Skin
22 Cells_EBV-transformed_lymphocytes Blood or Immune
23 Colon_Sigmoid Digestive
24 Colon_Transverse Digestive
25 Esophagus_Gastroesophageal_Junction Digestive
26 Esophagus_Mucosa Digestive
27 Esophagus_Muscularis Digestive
28 Heart_Atrial_Appendage Cardiovascular
29 Heart_Left_Ventricle Cardiovascular
30 Kidney_Cortex None
31 Liver None
32 Lung None
33 Minor_Salivary_Gland None
34 Muscle_Skeletal None
35 Nerve_Tibial None
36 Ovary None
37 Pancreas None
38 Pituitary Endocrine
39 Prostate None
40 Skin_Not_Sun_Exposed_Suprapubic Skin
41 Skin_Sun_Exposed_Lower_leg Skin
42 Small_Intestine_Terminal_Ileum Digestive
43 Spleen Blood or Immune
44 Stomach Digestive
45 Testis Endocrine
46 Thyroid Endocrine
47 Uterus None
48 Vagina None
49 Whole_Blood Blood or Immunegroups <- unique(weight_groups$group)
df_group <- list()
for (i in 1:length(groups)){
group <- groups[i]
weights <- weight_groups$weight[weight_groups$group==group]
df_group[[group]] <- list(ctwas=unique(unlist(lapply(df[weights], function(x){x$ctwas}))),
background=unique(unlist(lapply(df[weights], function(x){x$gene_pips$genename}))))
}
output <- output[sapply(weight_groups$weight, match, output$weight),,drop=F]
output$group <- weight_groups$group
output$n_ctwas_group <- sapply(output$group, function(x){length(df_group[[x]][["ctwas"]])})
output$n_ctwas_group[output$group=="None"] <- 0
#barplot of number of cTWAS genes in each tissue
output <- output[order(-output$n_ctwas),,drop=F]
par(mar=c(10.1, 4.1, 4.1, 2.1))
barplot(output$n_ctwas, names.arg=output$weight, las=2, ylab="Number of cTWAS Genes", cex.names=0.6, main="Number of cTWAS Genes by Tissue")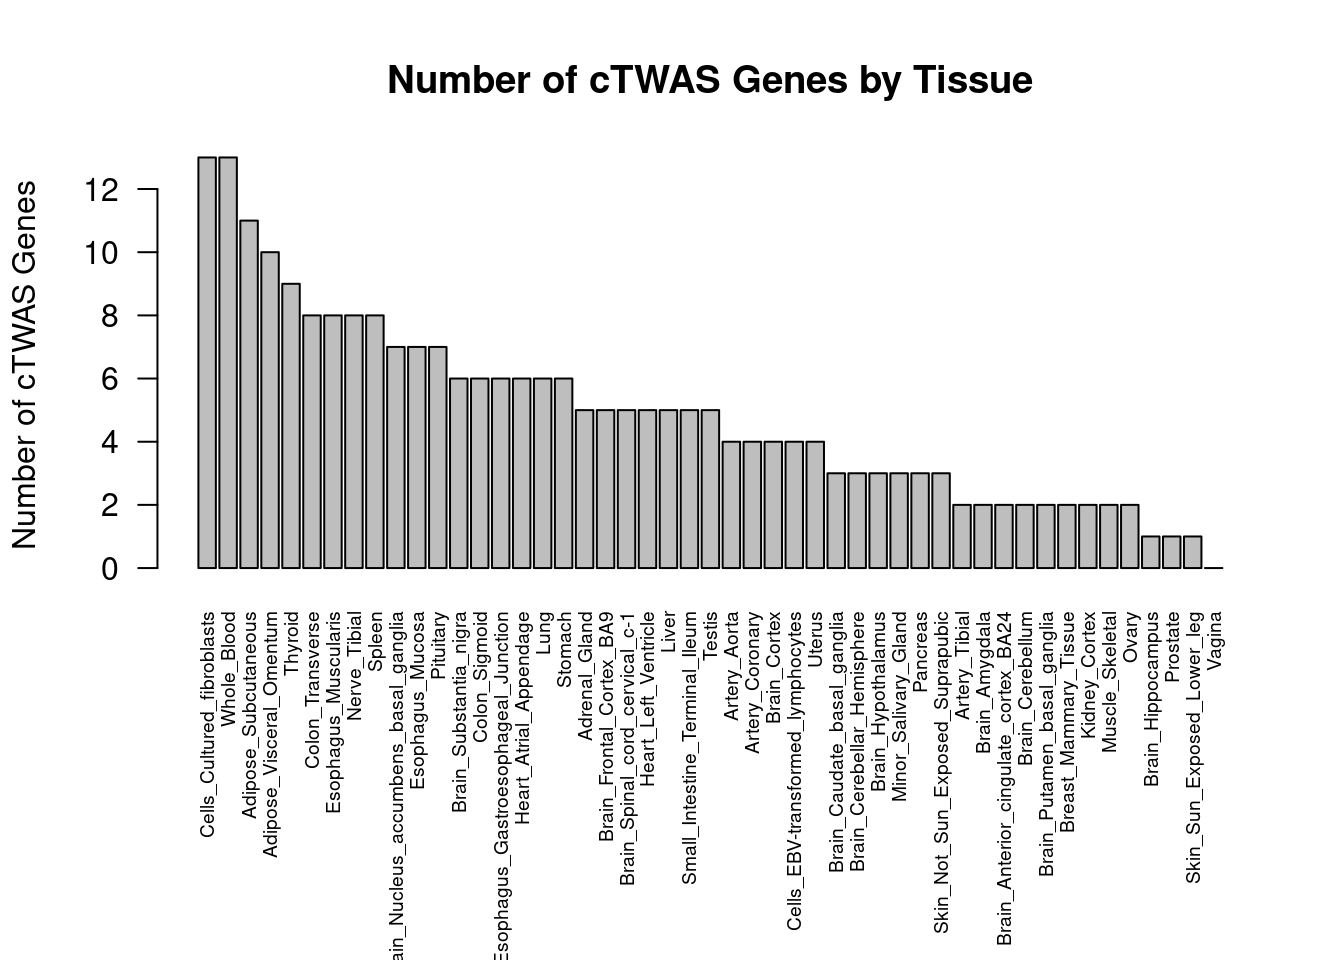
| Version | Author | Date |
|---|---|---|
| 397176f | wesleycrouse | 2022-06-10 |
#barplot of number of cTWAS genes in each tissue
df_plot <- -sort(-sapply(groups[groups!="None"], function(x){length(df_group[[x]][["ctwas"]])}))

par(mar=c(10.1, 4.1, 4.1, 2.1))
barplot(df_plot, las=2, ylab="Number of cTWAS Genes", main="Number of cTWAS Genes by Tissue Group")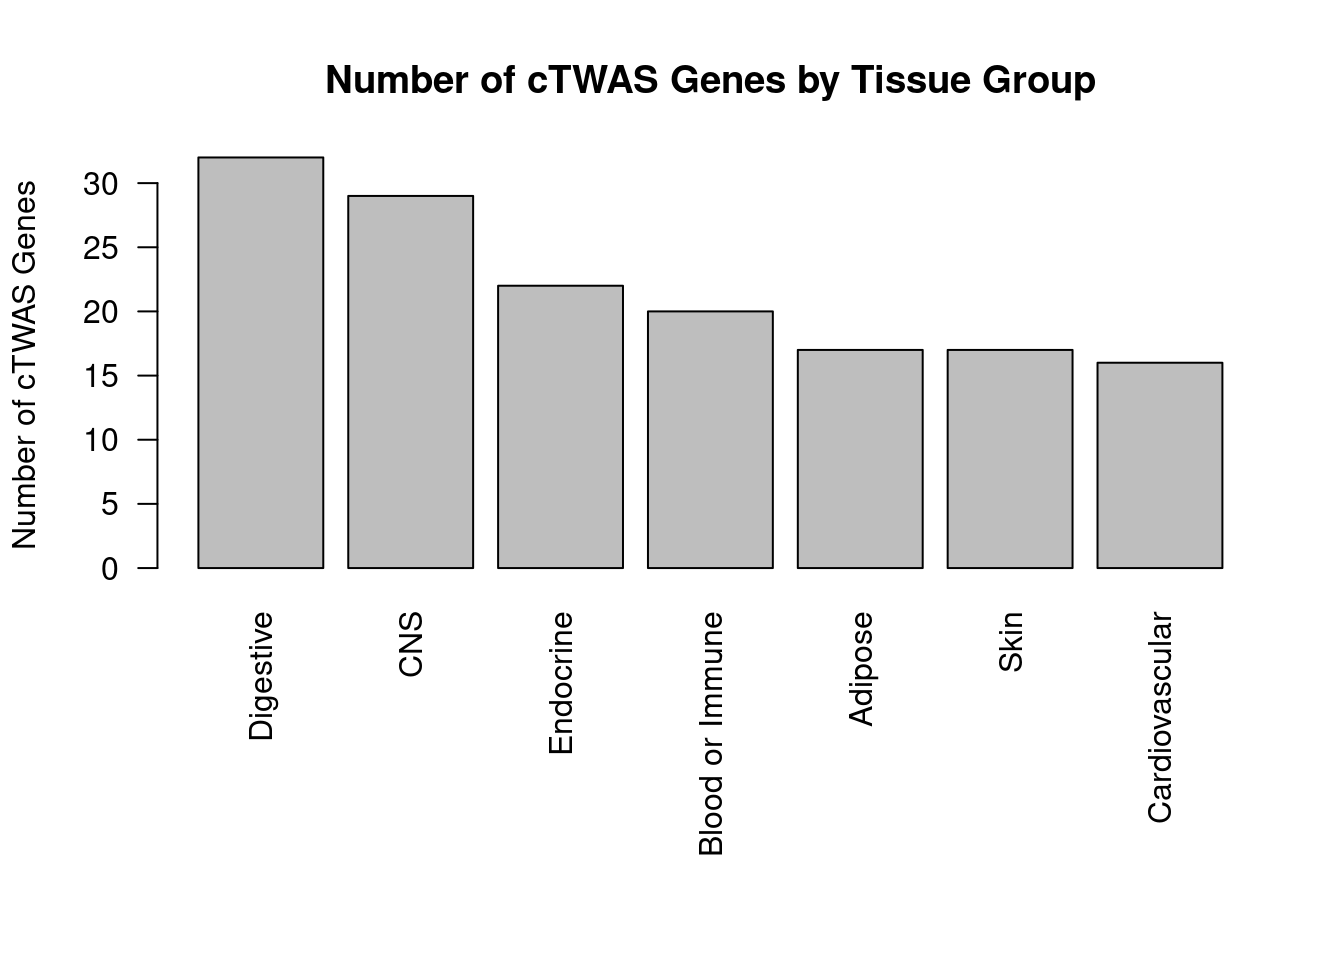
| Version | Author | Date |
|---|---|---|
| 397176f | wesleycrouse | 2022-06-10 |
Enrichment analysis for cTWAS genes in each tissue group
GO
suppressWarnings(rm(group_enrichment_results))

for (group in names(df_group)){
  cat(paste0(group, "\n\n"))

  ctwas_genes_group <- df_group[[group]]$ctwas

  cat(paste0("Number of cTWAS Genes in Tissue Group: ", length(ctwas_genes_group), "\n\n"))

  dbs <- c("GO_Biological_Process_2021")
  GO_enrichment <- enrichr(ctwas_genes_group, dbs)

  for (db in dbs){
    cat(paste0("\n", db, "\n\n"))
    enrich_results <- GO_enrichment[[db]]
    enrich_results <- enrich_results[enrich_results$Adjusted.P.value<0.05,c("Term", "Overlap", "Adjusted.P.value", "Genes")]
    print(enrich_results)
    print(plotEnrich(GO_enrichment[[db]]))

    if (nrow(enrich_results)>0){
      if (!exists("group_enrichment_results")){
        group_enrichment_results <- cbind(group, db, enrich_results)
      } else {
        group_enrichment_results <- rbind(group_enrichment_results, cbind(group, db, enrich_results))
      }
    }
  }

}
Adipose
Number of cTWAS Genes in Tissue Group: 17
Uploading data to Enrichr... Done.
Querying GO_Biological_Process_2021... Done.
Parsing results... Done.
GO_Biological_Process_2021
Term Overlap Adjusted.P.value Genes
1 regulation of DNA-templated transcription in response to stress (GO:0043620) 2/9 0.006220559 MUC1;RGS14
2 cytokine-mediated signaling pathway (GO:0019221) 5/621 0.016427096 CIITA;MUC1;TNFSF15;TNFRSF14;HLA-DQA1
3 cellular response to tumor necrosis factor (GO:0071356) 3/194 0.046985695 TNFSF15;TNFRSF14;ZFP36L2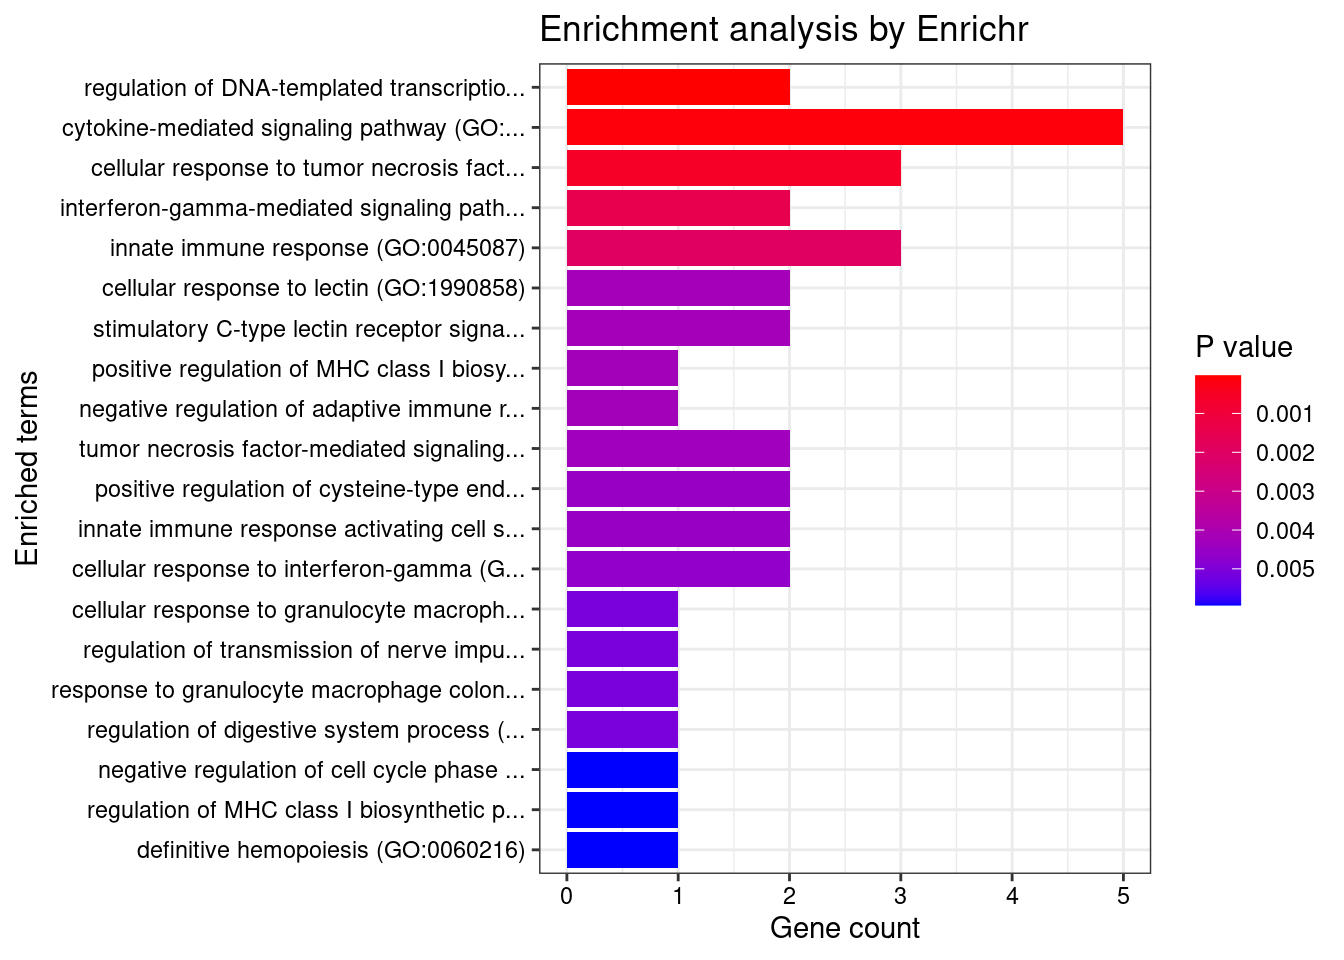
| Version | Author | Date |
|---|---|---|
| 397176f | wesleycrouse | 2022-06-10 |
Endocrine

Number of cTWAS Genes in Tissue Group: 22

Uploading data to Enrichr... Done.
  Querying GO_Biological_Process_2021... Done.
Parsing results... Done.

GO_Biological_Process_2021

                                                                                                     Term Overlap Adjusted.P.value                                Genes
1                            regulation of DNA-templated transcription in response to stress (GO:0043620)     2/9      0.009471354                           MUC1;RGS14
2                                                        cytokine-mediated signaling pathway (GO:0019221)   6/621      0.009471354 MUC1;IRF3;TNFSF15;CCL20;IFNGR2;STAT3
3                           positive regulation of DNA-binding transcription factor activity (GO:0051091)   4/246      0.013810076              SMAD3;PRKCB;CARD9;STAT3
4                                                     cellular response to cytokine stimulus (GO:0071345)   5/482      0.013810076        MUC1;SMAD3;CCL20;IFNGR2;STAT3
5               positive regulation of cytokine production involved in inflammatory response (GO:1900017)    2/17      0.013810076                          CARD9;STAT3
6  positive regulation of cysteine-type endopeptidase activity involved in apoptotic process (GO:0043280)   3/119      0.019398394                  SMAD3;TNFSF15;CARD9
7                                                      cellular response to interferon-gamma (GO:0071346)   3/121      0.019398394                    IRF3;CCL20;IFNGR2
8                                                                       response to cytokine (GO:0034097)   3/150      0.028162794                    SMAD3;SMPD1;STAT3
9                             positive regulation of NF-kappaB transcription factor activity (GO:0051092)   3/155      0.028162794                    PRKCB;CARD9;STAT3
10                       positive regulation of pri-miRNA transcription by RNA polymerase II (GO:1902895)    2/34      0.028162794                          SMAD3;STAT3
11                       regulation of cytokine production involved in inflammatory response (GO:1900015)    2/43      0.040964414                          CARD9;STAT3
12                                regulation of pri-miRNA transcription by RNA polymerase II (GO:1902893)    2/45      0.041113806                          SMAD3;STAT3
13                                                negative regulation of MAP kinase activity (GO:0043407)    2/48      0.043155151                          RGS14;SMPD1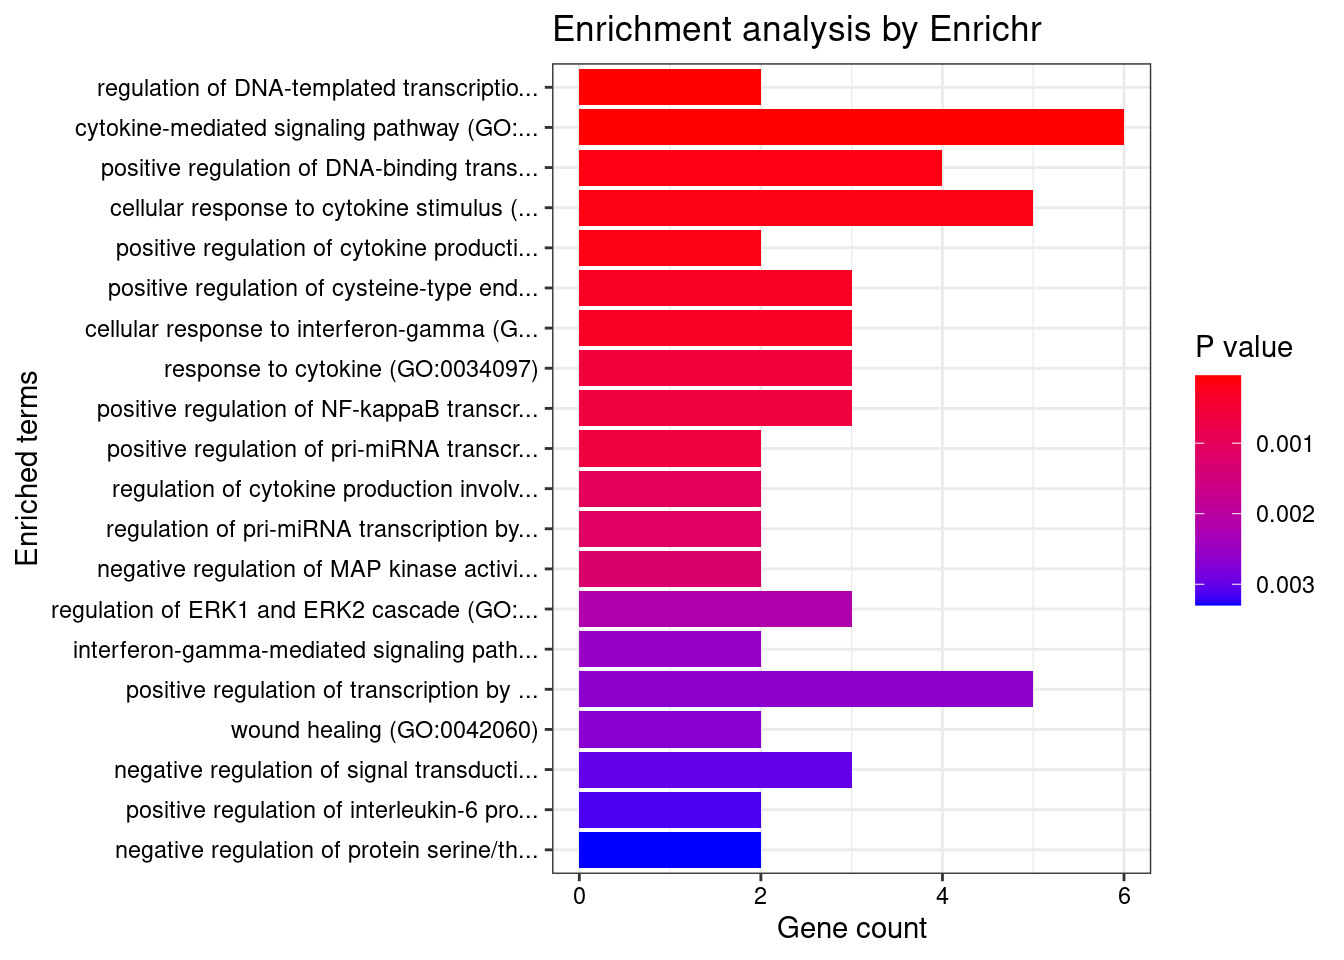
| Version | Author | Date |
|---|---|---|
| 397176f | wesleycrouse | 2022-06-10 |
Cardiovascular
Number of cTWAS Genes in Tissue Group: 16
Uploading data to Enrichr... Done.
Querying GO_Biological_Process_2021... Done.
Parsing results... Done.
GO_Biological_Process_2021
Term Overlap Adjusted.P.value Genes
1 cell-matrix adhesion (GO:0007160) 3/100 0.02001757 ADAM15;ITGAV;ITGAL
2 neutrophil degranulation (GO:0043312) 4/481 0.03273039 SYNGR1;SLC2A3;ITGAV;ITGAL
3 neutrophil activation involved in immune response (GO:0002283) 4/485 0.03273039 SYNGR1;SLC2A3;ITGAV;ITGAL
4 neutrophil mediated immunity (GO:0002446) 4/488 0.03273039 SYNGR1;SLC2A3;ITGAV;ITGAL
5 extracellular structure organization (GO:0043062) 3/216 0.03273039 ADAM15;ITGAV;ITGAL
6 external encapsulating structure organization (GO:0045229) 3/217 0.03273039 ADAM15;ITGAV;ITGAL
7 cytokine-mediated signaling pathway (GO:0019221) 4/621 0.04382387 TNFSF15;IFNGR2;STAT3;IP6K2
8 integrin-mediated signaling pathway (GO:0007229) 2/75 0.04382387 ADAM15;ITGAV
9 extracellular matrix organization (GO:0030198) 3/300 0.04382387 ADAM15;ITGAV;ITGAL
10 transmembrane receptor protein tyrosine kinase signaling pathway (GO:0007169) 3/404 0.04382387 RGS14;STAT3;ITGAV
11 T cell extravasation (GO:0072683) 1/5 0.04382387 ITGAL
12 glucose import across plasma membrane (GO:0098708) 1/5 0.04382387 SLC2A3
13 negative regulation of lipid transport (GO:0032369) 1/5 0.04382387 ITGAV
14 positive regulation of metallopeptidase activity (GO:1905050) 1/5 0.04382387 STAT3
15 negative regulation of cell growth (GO:0030308) 2/126 0.04382387 ADAM15;IP6K2
16 negative regulation of growth (GO:0045926) 2/126 0.04382387 ADAM15;IP6K2
17 radial glial cell differentiation (GO:0060019) 1/6 0.04382387 STAT3
18 T-helper 17 cell lineage commitment (GO:0072540) 1/6 0.04382387 STAT3
19 regulation of transmission of nerve impulse (GO:0051969) 1/6 0.04382387 TYMP
20 hexose import across plasma membrane (GO:0140271) 1/6 0.04382387 SLC2A3
21 regulation of collagen fibril organization (GO:1904026) 1/6 0.04382387 EFEMP2
22 regulation of digestive system process (GO:0044058) 1/6 0.04382387 TYMP
23 T-helper 17 cell differentiation (GO:0072539) 1/7 0.04382387 STAT3
24 regulation of transforming growth factor beta activation (GO:1901388) 1/7 0.04382387 ITGAV
25 astrocyte differentiation (GO:0048708) 1/7 0.04382387 STAT3
26 regulation of miRNA mediated inhibition of translation (GO:1905616) 1/7 0.04382387 STAT3
27 positive regulation of vascular associated smooth muscle cell differentiation (GO:1905065) 1/7 0.04382387 EFEMP2
28 negative regulation of low-density lipoprotein receptor activity (GO:1905598) 1/7 0.04382387 ITGAV
29 vascular associated smooth muscle cell development (GO:0097084) 1/7 0.04382387 EFEMP2
30 photoreceptor cell differentiation (GO:0046530) 1/7 0.04382387 STAT3
31 positive regulation of miRNA mediated inhibition of translation (GO:1905618) 1/7 0.04382387 STAT3
32 regulation of entry of bacterium into host cell (GO:2000535) 1/7 0.04382387 ITGAV
33 cellular response to interleukin-21 (GO:0098757) 1/8 0.04382387 STAT3
34 T-helper cell lineage commitment (GO:0002295) 1/8 0.04382387 STAT3
35 vascular associated smooth muscle cell differentiation (GO:0035886) 1/8 0.04382387 EFEMP2
36 elastic fiber assembly (GO:0048251) 1/8 0.04382387 EFEMP2
37 interleukin-21-mediated signaling pathway (GO:0038114) 1/8 0.04382387 STAT3
38 cellular response to interleukin-9 (GO:0071355) 1/9 0.04382387 STAT3
39 cellular response to leptin stimulus (GO:0044320) 1/9 0.04382387 STAT3
40 L-ascorbic acid metabolic process (GO:0019852) 1/9 0.04382387 SLC2A3
41 regulation of lipid transport (GO:0032368) 1/9 0.04382387 ITGAV
42 negative regulation of lipid localization (GO:1905953) 1/9 0.04382387 ITGAV
43 response to leptin (GO:0044321) 1/9 0.04382387 STAT3
44 regulation of DNA-templated transcription in response to stress (GO:0043620) 1/9 0.04382387 RGS14
45 interleukin-23-mediated signaling pathway (GO:0038155) 1/9 0.04382387 STAT3
46 interleukin-9-mediated signaling pathway (GO:0038113) 1/9 0.04382387 STAT3
47 regulation of receptor binding (GO:1900120) 1/10 0.04382387 ADAM15
48 smooth muscle tissue development (GO:0048745) 1/10 0.04382387 EFEMP2
49 leptin-mediated signaling pathway (GO:0033210) 1/10 0.04382387 STAT3
50 nucleoside metabolic process (GO:0009116) 1/10 0.04382387 TYMP
51 negative regulation of receptor binding (GO:1900121) 1/10 0.04382387 ADAM15
52 positive regulation of posttranscriptional gene silencing (GO:0060148) 1/11 0.04382387 STAT3
53 pyrimidine nucleoside catabolic process (GO:0046135) 1/11 0.04382387 TYMP
54 pyrimidine nucleoside salvage (GO:0043097) 1/11 0.04382387 TYMP
55 pyrimidine-containing compound salvage (GO:0008655) 1/11 0.04382387 TYMP
56 regulation of long-term neuronal synaptic plasticity (GO:0048169) 1/11 0.04382387 SYNGR1
57 inositol phosphate biosynthetic process (GO:0032958) 1/11 0.04382387 IP6K2
58 interleukin-35-mediated signaling pathway (GO:0070757) 1/11 0.04382387 STAT3
59 cellular response to growth hormone stimulus (GO:0071378) 1/12 0.04382387 STAT3
60 regulation of feeding behavior (GO:0060259) 1/12 0.04382387 STAT3
61 eye photoreceptor cell differentiation (GO:0001754) 1/12 0.04382387 STAT3
62 pyrimidine-containing compound metabolic process (GO:0072527) 1/12 0.04382387 TYMP
63 nucleoside catabolic process (GO:0009164) 1/12 0.04382387 TYMP
64 nucleoside salvage (GO:0043174) 1/12 0.04382387 TYMP
65 mitochondrial genome maintenance (GO:0000002) 1/12 0.04382387 TYMP
66 negative regulation of production of miRNAs involved in gene silencing by miRNA (GO:1903799) 1/12 0.04382387 STAT3
67 negative regulation of cellular process (GO:0048523) 3/566 0.04382387 ADAM15;BRD7;IP6K2
68 cellular response to interleukin-15 (GO:0071350) 1/13 0.04382387 STAT3
69 regulation of short-term neuronal synaptic plasticity (GO:0048172) 1/13 0.04382387 SYNGR1
70 glucose import (GO:0046323) 1/13 0.04382387 SLC2A3
71 negative regulation of macrophage derived foam cell differentiation (GO:0010745) 1/13 0.04382387 ITGAV
72 interleukin-15-mediated signaling pathway (GO:0035723) 1/13 0.04382387 STAT3
73 entry into host (GO:0044409) 1/13 0.04382387 ITGAV
74 regulation of response to interferon-gamma (GO:0060330) 1/14 0.04472651 IFNGR2
75 pyrimidine nucleoside biosynthetic process (GO:0046134) 1/14 0.04472651 TYMP
76 aorta development (GO:0035904) 1/14 0.04472651 EFEMP2
77 growth hormone receptor signaling pathway via JAK-STAT (GO:0060397) 1/14 0.04472651 STAT3
78 regulation of extracellular matrix organization (GO:1903053) 1/15 0.04540472 EFEMP2
79 pyrimidine nucleoside metabolic process (GO:0006213) 1/15 0.04540472 TYMP
80 interleukin-27-mediated signaling pathway (GO:0070106) 1/15 0.04540472 STAT3
81 phosphate-containing compound metabolic process (GO:0006796) 2/212 0.04540472 STAT3;IP6K2
82 regulation of cell growth (GO:0001558) 2/217 0.04540472 ADAM15;IP6K2
83 activation of NF-kappaB-inducing kinase activity (GO:0007250) 1/16 0.04540472 TNFSF15
84 nuclear transport (GO:0051169) 1/16 0.04540472 RGS14
85 platelet-derived growth factor receptor signaling pathway (GO:0048008) 1/16 0.04540472 RGS14
86 polyol biosynthetic process (GO:0046173) 1/16 0.04540472 IP6K2
87 negative regulation of vascular associated smooth muscle cell proliferation (GO:1904706) 1/17 0.04540472 EFEMP2
88 pyrimidine-containing compound catabolic process (GO:0072529) 1/17 0.04540472 TYMP
89 synaptic vesicle membrane organization (GO:0048499) 1/17 0.04540472 SYNGR1
90 aorta morphogenesis (GO:0035909) 1/17 0.04540472 EFEMP2
91 positive regulation of cytokine production involved in inflammatory response (GO:1900017) 1/17 0.04540472 STAT3
92 muscle tissue morphogenesis (GO:0060415) 1/17 0.04540472 EFEMP2
93 inflammatory response (GO:0006954) 2/230 0.04605520 STAT3;ITGAL
94 regulation of transforming growth factor beta production (GO:0071634) 1/18 0.04605520 ITGAV
95 positive regulation of extracellular matrix organization (GO:1903055) 1/18 0.04605520 EFEMP2
96 interleukin-6-mediated signaling pathway (GO:0070102) 1/18 0.04605520 STAT3
97 cellular response to interleukin-7 (GO:0098761) 1/19 0.04631017 STAT3
98 long-term memory (GO:0007616) 1/19 0.04631017 RGS14
99 regulation of nervous system process (GO:0031644) 1/19 0.04631017 TYMP
100 interleukin-7-mediated signaling pathway (GO:0038111) 1/19 0.04631017 STAT3
101 adaptive immune response based on somatic recombination of immune receptors built from immunoglobulin superfamily domains (GO:0002460) 1/20 0.04631017 STAT3
102 positive regulation of peptidyl-lysine acetylation (GO:2000758) 1/20 0.04631017 BRD7
103 eye morphogenesis (GO:0048592) 1/20 0.04631017 STAT3
104 glucose transmembrane transport (GO:1904659) 1/20 0.04631017 SLC2A3
105 growth hormone receptor signaling pathway (GO:0060396) 1/20 0.04631017 STAT3
106 negative regulation of lipid storage (GO:0010888) 1/20 0.04631017 ITGAV
107 extrinsic apoptotic signaling pathway in absence of ligand (GO:0097192) 1/21 0.04770735 ITGAV
108 long-term synaptic potentiation (GO:0060291) 1/21 0.04770735 RGS14
109 positive regulation of signal transduction (GO:0009967) 2/252 0.04788497 STAT3;ITGAV
110 regulation of lipid storage (GO:0010883) 1/22 0.04819552 ITGAV
111 ERK1 and ERK2 cascade (GO:0070371) 1/23 0.04819552 ITGAV
112 regulation of supramolecular fiber organization (GO:1902903) 1/23 0.04819552 EFEMP2
113 regulation of interferon-gamma-mediated signaling pathway (GO:0060334) 1/23 0.04819552 IFNGR2
114 artery development (GO:0060840) 1/23 0.04819552 EFEMP2
115 negative regulation of G protein-coupled receptor signaling pathway (GO:0045744) 1/23 0.04819552 RGS14
116 positive regulation of histone acetylation (GO:0035066) 1/23 0.04819552 BRD7
117 hexose transmembrane transport (GO:0008645) 1/23 0.04819552 SLC2A3
118 extracellular matrix assembly (GO:0085029) 1/24 0.04984613 EFEMP2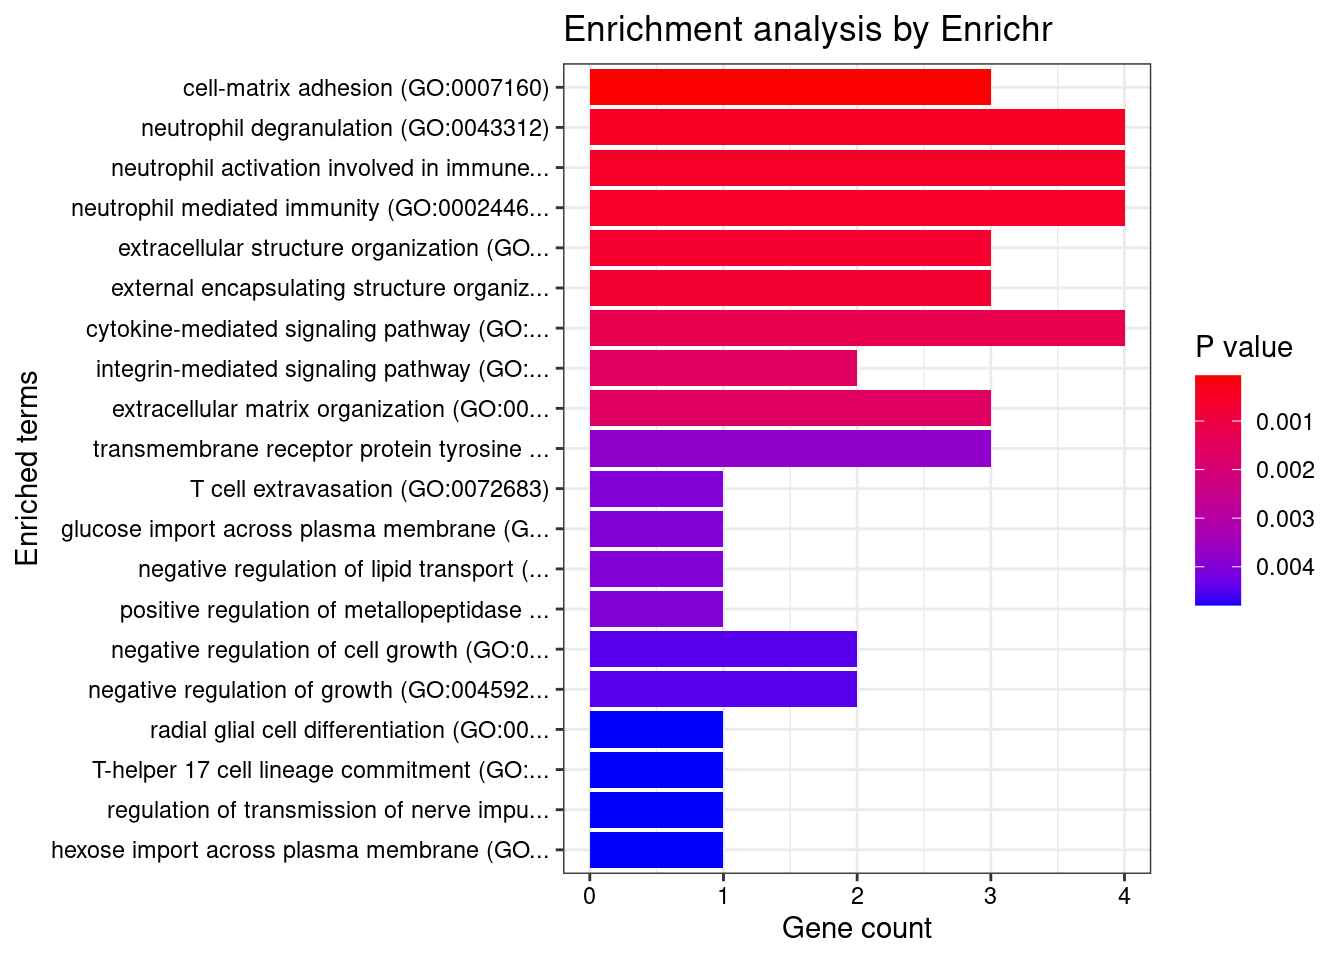
| Version | Author | Date |
|---|---|---|
| 397176f | wesleycrouse | 2022-06-10 |
CNS

Number of cTWAS Genes in Tissue Group: 29

Uploading data to Enrichr... Done.
  Querying GO_Biological_Process_2021... Done.
Parsing results... Done.

GO_Biological_Process_2021

                                                                                                Term Overlap Adjusted.P.value                                          Genes
1                    positive regulation of antigen receptor-mediated signaling pathway (GO:0050857)    3/21      0.001661907                              PRKCB;RAB29;PRKD2
2                                            positive regulation of cytokine production (GO:0001819)   6/335      0.001680945           LACC1;FCER1G;CD6;PRKD2;IL18R1;MAPK13
3                                                   cytokine-mediated signaling pathway (GO:0019221)   7/621      0.003578784 MUC1;FCER1G;CCL20;TNFSF15;IRF6;HLA-DQA1;IL18R1
4                       regulation of DNA-templated transcription in response to stress (GO:0043620)     2/9      0.007013764                                     MUC1;RGS14
5                                        negative regulation of transmembrane transport (GO:0034763)    2/10      0.007013764                                     PRKCB;OAZ3
6  positive regulation of vascular endothelial growth factor receptor signaling pathway (GO:0030949)    2/10      0.007013764                                    PRKCB;PRKD2
7                              positive regulation of T cell receptor signaling pathway (GO:0050862)    2/14      0.012113582                                    RAB29;PRKD2
8           regulation of vascular endothelial growth factor receptor signaling pathway (GO:0030947)    2/24      0.031860016                                    PRKCB;PRKD2
9                                                 cellular response to interferon-gamma (GO:0071346)   3/121      0.036274370                            CCL20;IRF6;HLA-DQA1
10                                     regulation of cell adhesion mediated by integrin (GO:0033628)    2/34      0.049460700                                     EFNA1;MUC1
11                                      regulation of T cell receptor signaling pathway (GO:0050856)    2/35      0.049460700                                    RAB29;PRKD2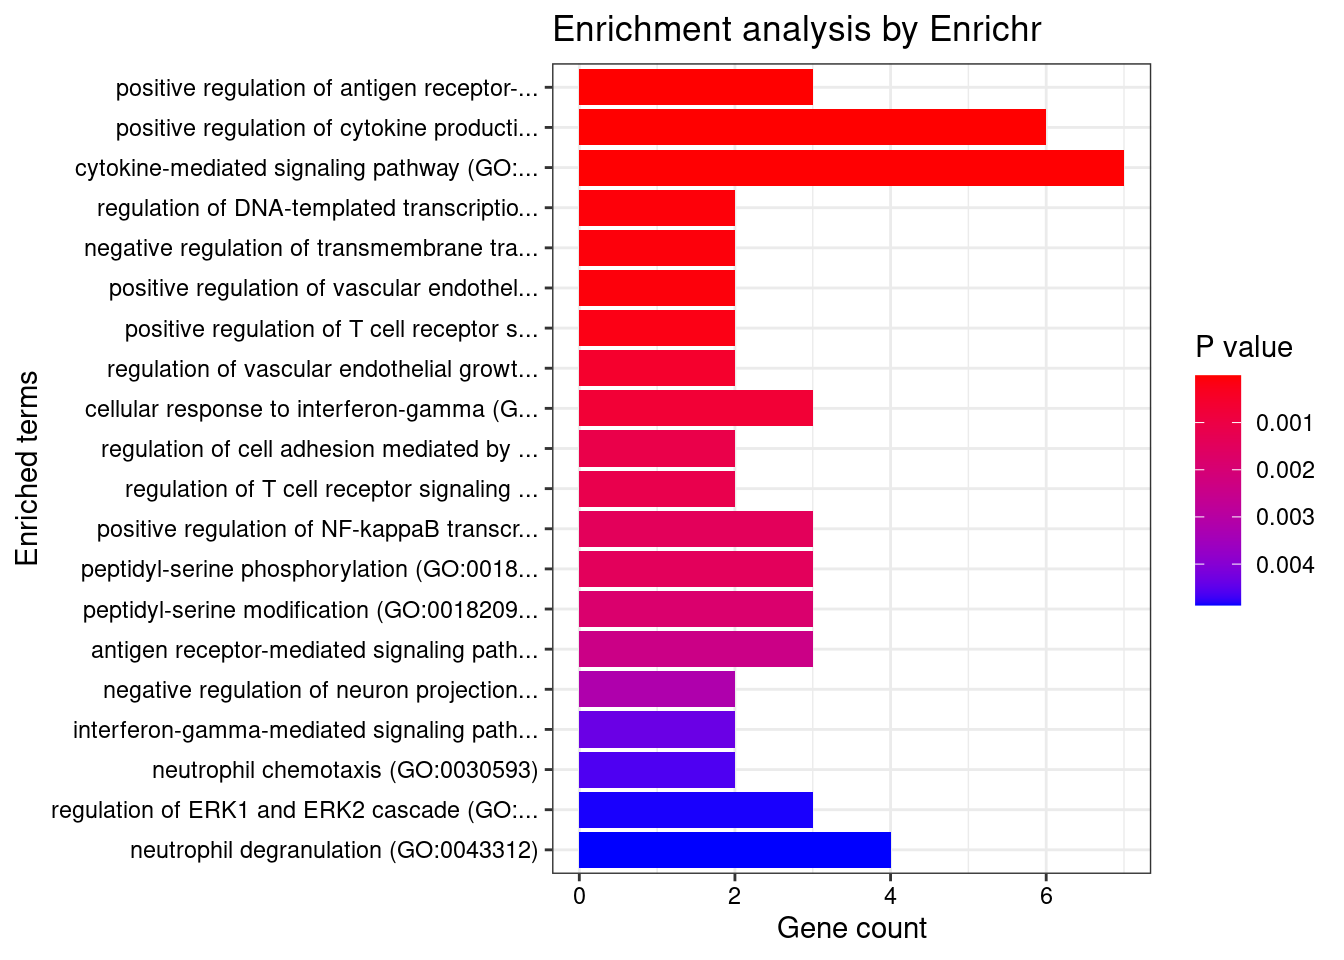
| Version | Author | Date |
|---|---|---|
| 397176f | wesleycrouse | 2022-06-10 |
None

Number of cTWAS Genes in Tissue Group: 27

Uploading data to Enrichr... Done.
  Querying GO_Biological_Process_2021... Done.
Parsing results... Done.

GO_Biological_Process_2021

                                                                                        Term Overlap Adjusted.P.value                                          Genes
1                                           cytokine-mediated signaling pathway (GO:0019221)   8/621     0.0006807294 PSMA6;MUC1;TNFSF15;CCL20;IFNGR2;STAT3;IRF8;CRK
2                                        cellular response to cytokine stimulus (GO:0071345)   7/482     0.0008271057       MUC1;CCL20;IFNGR2;STAT3;IRF8;CRK;ZFP36L2
3               regulation of DNA-templated transcription in response to stress (GO:0043620)     2/9     0.0131069228                                     MUC1;RGS14
4                                    cellular response to tumor necrosis factor (GO:0071356)   4/194     0.0197922464                    PSMA6;TNFSF15;CCL20;ZFP36L2
5  positive regulation of cytokine production involved in inflammatory response (GO:1900017)    2/17     0.0280585219                                    CARD9;STAT3
6                                             regulation of MAP kinase activity (GO:0043405)    3/97     0.0280585219                               RGS14;EDN3;LRRK2
7              positive regulation of DNA-binding transcription factor activity (GO:0051091)   4/246     0.0280585219                        PSMA6;CRTC3;CARD9;STAT3
8                                           positive regulation of MAPK cascade (GO:0043410)   4/274     0.0296416358                         EDN3;CCL20;LRRK2;CARD9
9                                                   cellular response to lectin (GO:1990858)   3/115     0.0296416358                               PSMA6;MUC1;CARD9
10                         stimulatory C-type lectin receptor signaling pathway (GO:0002223)   3/115     0.0296416358                               PSMA6;MUC1;CARD9
11    innate immune response activating cell surface receptor signaling pathway (GO:0002220)   3/119     0.0296416358                               PSMA6;MUC1;CARD9
12                                        cellular response to interferon-gamma (GO:0071346)   3/121     0.0296416358                              CCL20;IFNGR2;IRF8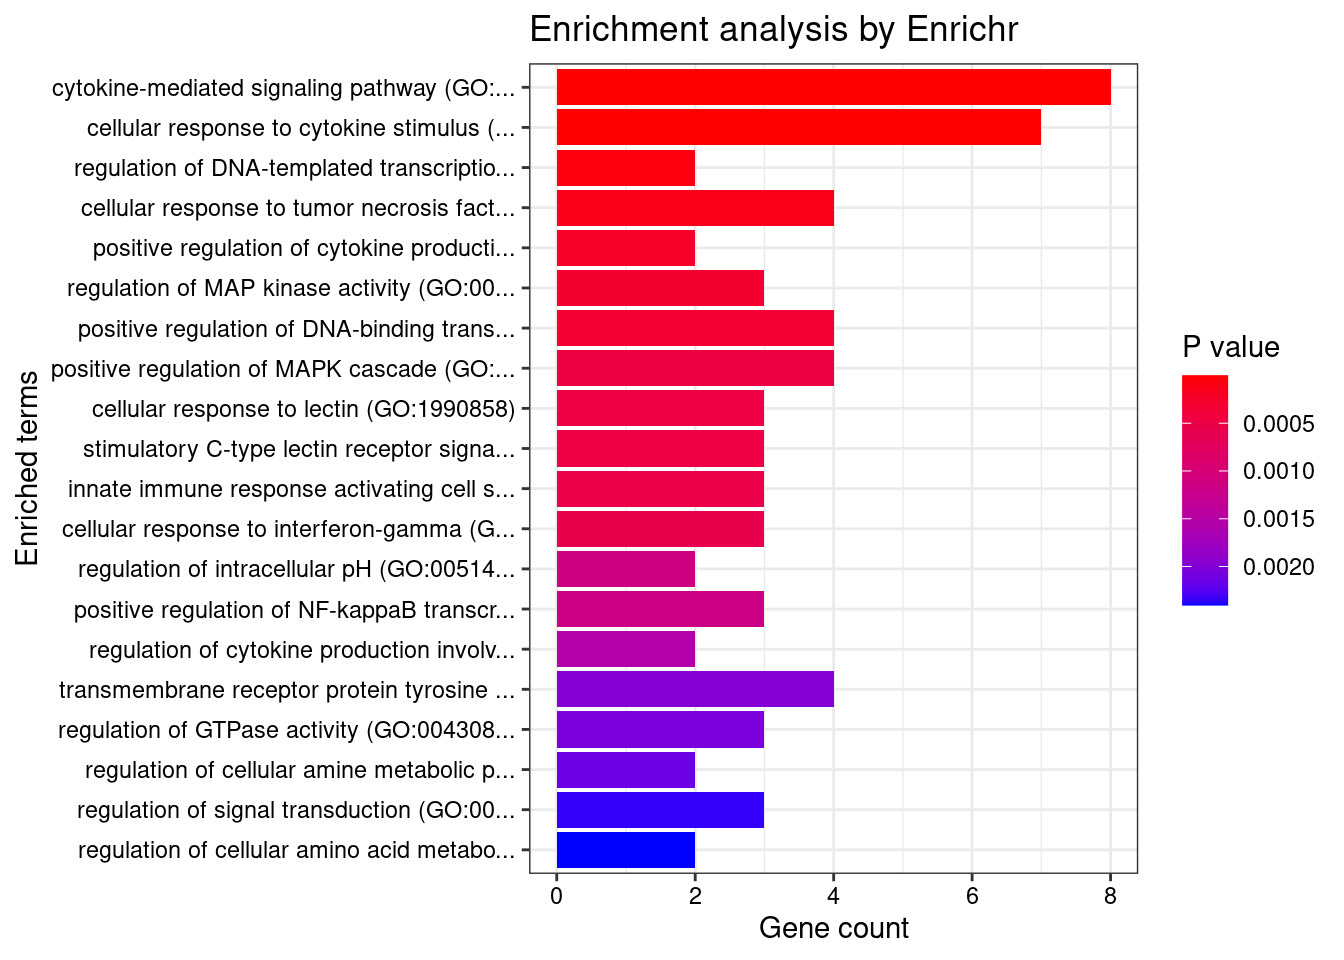
| Version | Author | Date |
|---|---|---|
| 397176f | wesleycrouse | 2022-06-10 |
Skin
Number of cTWAS Genes in Tissue Group: 17
Uploading data to Enrichr... Done.
Querying GO_Biological_Process_2021... Done.
Parsing results... Done.
GO_Biological_Process_2021
Term Overlap Adjusted.P.value Genes
1 regulation of receptor binding (GO:1900120) 2/10 0.01142916 ADAM15;MMP9
2 extracellular matrix organization (GO:0030198) 4/300 0.01897861 ADAM15;P4HA2;ITGAL;MMP9
3 transmembrane receptor protein tyrosine kinase signaling pathway (GO:0007169) 4/404 0.03049768 RGS14;STAT3;MMP9;PTPN2
4 regulation of vascular associated smooth muscle cell proliferation (GO:1904705) 2/37 0.03049768 EFEMP2;MMP9
5 response to peptide (GO:1901652) 2/39 0.03049768 STAT3;MMP9
6 positive regulation of Notch signaling pathway (GO:0045747) 2/45 0.03049768 TSPAN14;STAT3
7 regulation of pri-miRNA transcription by RNA polymerase II (GO:1902893) 2/45 0.03049768 STAT3;POU5F1
8 extracellular structure organization (GO:0043062) 3/216 0.03049768 ADAM15;ITGAL;MMP9
9 external encapsulating structure organization (GO:0045229) 3/217 0.03049768 ADAM15;ITGAL;MMP9
10 negative regulation of ERK1 and ERK2 cascade (GO:0070373) 2/50 0.03049768 RGS14;PTPN2
11 extracellular matrix disassembly (GO:0022617) 2/66 0.03720416 ADAM15;MMP9
12 cellular component disassembly (GO:0022411) 2/66 0.03720416 ADAM15;MMP9
13 regulation of gene silencing by miRNA (GO:0060964) 2/67 0.03720416 STAT3;POU5F1
14 regulation of epidermal growth factor receptor signaling pathway (GO:0042058) 2/67 0.03720416 MMP9;PTPN2
15 regulation of tyrosine phosphorylation of STAT protein (GO:0042509) 2/68 0.03720416 STAT3;PTPN2
16 carbohydrate homeostasis (GO:0033500) 2/70 0.03720416 STAT3;PTPN2
17 regulation of Notch signaling pathway (GO:0008593) 2/83 0.04008602 TSPAN14;STAT3
18 glucose homeostasis (GO:0042593) 2/86 0.04008602 STAT3;PTPN2
19 negative regulation of MAPK cascade (GO:0043409) 2/94 0.04008602 RGS14;PTPN2
20 supramolecular fiber organization (GO:0097435) 3/351 0.04008602 TSPAN14;EFEMP2;P4HA2
21 cell-matrix adhesion (GO:0007160) 2/100 0.04008602 ADAM15;ITGAL
22 negative regulation of cysteine-type endopeptidase activity involved in apoptotic signaling pathway (GO:2001268) 1/5 0.04008602 MMP9
23 T cell extravasation (GO:0072683) 1/5 0.04008602 ITGAL
24 negative regulation of gene silencing by RNA (GO:0060967) 1/5 0.04008602 POU5F1
25 negative regulation of macrophage differentiation (GO:0045650) 1/5 0.04008602 PTPN2
26 regulation of platelet-derived growth factor receptor-beta signaling pathway (GO:2000586) 1/5 0.04008602 PTPN2
27 negative regulation of posttranscriptional gene silencing (GO:0060149) 1/5 0.04008602 POU5F1
28 positive regulation of metallopeptidase activity (GO:1905050) 1/5 0.04008602 STAT3
29 endodermal cell fate specification (GO:0001714) 1/5 0.04008602 POU5F1
30 regulation of cell migration (GO:0030334) 3/408 0.04008602 ADAM15;STAT3;MMP9
31 cellular response to organic substance (GO:0071310) 2/123 0.04008602 STAT3;PTPN2
32 negative regulation of T cell differentiation in thymus (GO:0033085) 1/6 0.04008602 PTPN2
33 negative regulation of transporter activity (GO:0032410) 1/6 0.04008602 NDFIP1
34 radial glial cell differentiation (GO:0060019) 1/6 0.04008602 STAT3
35 positive regulation of receptor binding (GO:1900122) 1/6 0.04008602 MMP9
36 T-helper 17 cell lineage commitment (GO:0072540) 1/6 0.04008602 STAT3
37 regulation of transmission of nerve impulse (GO:0051969) 1/6 0.04008602 TYMP
38 positive regulation of gluconeogenesis (GO:0045722) 1/6 0.04008602 PTPN2
39 regulation of collagen fibril organization (GO:1904026) 1/6 0.04008602 EFEMP2
40 regulation of digestive system process (GO:0044058) 1/6 0.04008602 TYMP
41 negative regulation of response to interferon-gamma (GO:0060331) 1/7 0.04008602 PTPN2
42 T-helper 17 cell differentiation (GO:0072539) 1/7 0.04008602 STAT3
43 astrocyte differentiation (GO:0048708) 1/7 0.04008602 STAT3
44 regulation of miRNA mediated inhibition of translation (GO:1905616) 1/7 0.04008602 STAT3
45 negative regulation of interferon-gamma-mediated signaling pathway (GO:0060336) 1/7 0.04008602 PTPN2
46 positive regulation of vascular associated smooth muscle cell differentiation (GO:1905065) 1/7 0.04008602 EFEMP2
47 vascular associated smooth muscle cell development (GO:0097084) 1/7 0.04008602 EFEMP2
48 photoreceptor cell differentiation (GO:0046530) 1/7 0.04008602 STAT3
49 positive regulation of miRNA mediated inhibition of translation (GO:1905618) 1/7 0.04008602 STAT3
50 cellular response to interleukin-21 (GO:0098757) 1/8 0.04008602 STAT3
51 T-helper cell lineage commitment (GO:0002295) 1/8 0.04008602 STAT3
52 vascular associated smooth muscle cell differentiation (GO:0035886) 1/8 0.04008602 EFEMP2
53 peptidyl-proline hydroxylation to 4-hydroxy-L-proline (GO:0018401) 1/8 0.04008602 P4HA2
54 elastic fiber assembly (GO:0048251) 1/8 0.04008602 EFEMP2
55 interleukin-21-mediated signaling pathway (GO:0038114) 1/8 0.04008602 STAT3
56 response to cytokine (GO:0034097) 2/150 0.04008602 STAT3;PTPN2
57 neutrophil degranulation (GO:0043312) 3/481 0.04008602 TSPAN14;ITGAL;MMP9
58 cellular response to cytokine stimulus (GO:0071345) 3/482 0.04008602 STAT3;MMP9;PTPN2
59 neutrophil activation involved in immune response (GO:0002283) 3/485 0.04008602 TSPAN14;ITGAL;MMP9
60 neutrophil mediated immunity (GO:0002446) 3/488 0.04008602 TSPAN14;ITGAL;MMP9
61 cellular response to interleukin-9 (GO:0071355) 1/9 0.04008602 STAT3
62 cellular response to leptin stimulus (GO:0044320) 1/9 0.04008602 STAT3
63 negative regulation of lipid localization (GO:1905953) 1/9 0.04008602 PTPN2
64 response to leptin (GO:0044321) 1/9 0.04008602 STAT3
65 regulation of DNA-templated transcription in response to stress (GO:0043620) 1/9 0.04008602 RGS14
66 interleukin-23-mediated signaling pathway (GO:0038155) 1/9 0.04008602 STAT3
67 interleukin-9-mediated signaling pathway (GO:0038113) 1/9 0.04008602 STAT3
68 smooth muscle tissue development (GO:0048745) 1/10 0.04008602 EFEMP2
69 leptin-mediated signaling pathway (GO:0033210) 1/10 0.04008602 STAT3
70 negative regulation of transmembrane transport (GO:0034763) 1/10 0.04008602 OAZ3
71 negative regulation of tyrosine phosphorylation of STAT protein (GO:0042532) 1/10 0.04008602 PTPN2
72 negative regulation of establishment of protein localization (GO:1904950) 1/10 0.04008602 NDFIP1
73 nucleoside metabolic process (GO:0009116) 1/10 0.04008602 TYMP
74 positive regulation of keratinocyte migration (GO:0051549) 1/10 0.04008602 MMP9
75 endodermal cell fate commitment (GO:0001711) 1/10 0.04008602 POU5F1
76 negative regulation of receptor binding (GO:1900121) 1/10 0.04008602 ADAM15
77 positive regulation of posttranscriptional gene silencing (GO:0060148) 1/11 0.04008602 STAT3
78 cellular response to UV-A (GO:0071492) 1/11 0.04008602 MMP9
79 pyrimidine nucleoside catabolic process (GO:0046135) 1/11 0.04008602 TYMP
80 pyrimidine nucleoside salvage (GO:0043097) 1/11 0.04008602 TYMP
81 pyrimidine-containing compound salvage (GO:0008655) 1/11 0.04008602 TYMP
82 peptidyl-proline hydroxylation (GO:0019511) 1/11 0.04008602 P4HA2
83 regulation of cysteine-type endopeptidase activity involved in apoptotic signaling pathway (GO:2001267) 1/11 0.04008602 MMP9
84 negative regulation of platelet-derived growth factor receptor signaling pathway (GO:0010642) 1/11 0.04008602 PTPN2
85 interleukin-35-mediated signaling pathway (GO:0070757) 1/11 0.04008602 STAT3
86 cellular response to growth hormone stimulus (GO:0071378) 1/12 0.04008602 STAT3
87 regulation of feeding behavior (GO:0060259) 1/12 0.04008602 STAT3
88 eye photoreceptor cell differentiation (GO:0001754) 1/12 0.04008602 STAT3
89 pyrimidine-containing compound metabolic process (GO:0072527) 1/12 0.04008602 TYMP
90 regulation of keratinocyte migration (GO:0051547) 1/12 0.04008602 MMP9
91 negative regulation of gene silencing by miRNA (GO:0060965) 1/12 0.04008602 POU5F1
92 nucleoside catabolic process (GO:0009164) 1/12 0.04008602 TYMP
93 nucleoside salvage (GO:0043174) 1/12 0.04008602 TYMP
94 mitochondrial genome maintenance (GO:0000002) 1/12 0.04008602 TYMP
95 negative regulation of production of miRNAs involved in gene silencing by miRNA (GO:1903799) 1/12 0.04008602 STAT3
96 cellular response to interleukin-15 (GO:0071350) 1/13 0.04188038 STAT3
97 negative regulation of locomotion (GO:0040013) 1/13 0.04188038 PTPN2
98 interleukin-15-mediated signaling pathway (GO:0035723) 1/13 0.04188038 STAT3
99 protein localization to membrane (GO:0072657) 2/195 0.04188038 TSPAN14;ITGAL
100 regulation of response to interferon-gamma (GO:0060330) 1/14 0.04188038 PTPN2
101 pyrimidine nucleoside biosynthetic process (GO:0046134) 1/14 0.04188038 TYMP
102 aorta development (GO:0035904) 1/14 0.04188038 EFEMP2
103 growth hormone receptor signaling pathway via JAK-STAT (GO:0060397) 1/14 0.04188038 STAT3
104 positive regulation of glucose metabolic process (GO:0010907) 1/14 0.04188038 PTPN2
105 response to UV-A (GO:0070141) 1/14 0.04188038 MMP9
106 negative regulation of pri-miRNA transcription by RNA polymerase II (GO:1902894) 1/14 0.04188038 POU5F1
107 regulation of signal transduction (GO:0009966) 2/198 0.04215093 RGS14;PTPN2
108 regulation of extracellular matrix organization (GO:1903053) 1/15 0.04245104 EFEMP2
109 pyrimidine nucleoside metabolic process (GO:0006213) 1/15 0.04245104 TYMP
110 macrophage differentiation (GO:0030225) 1/15 0.04245104 MMP9
111 regulation of macrophage differentiation (GO:0045649) 1/15 0.04245104 PTPN2
112 interleukin-27-mediated signaling pathway (GO:0070106) 1/15 0.04245104 STAT3
113 regulation of inflammatory response (GO:0050727) 2/206 0.04296152 MMP9;PTPN2
114 negative regulation of type I interferon-mediated signaling pathway (GO:0060339) 1/16 0.04296152 PTPN2
115 negative regulation of epithelial cell differentiation (GO:0030857) 1/16 0.04296152 MMP9
116 nuclear transport (GO:0051169) 1/16 0.04296152 RGS14
117 platelet-derived growth factor receptor signaling pathway (GO:0048008) 1/16 0.04296152 RGS14
118 negative regulation of receptor signaling pathway via JAK-STAT (GO:0046426) 1/16 0.04296152 PTPN2
119 negative regulation of vascular associated smooth muscle cell proliferation (GO:1904706) 1/17 0.04377358 EFEMP2
120 pyrimidine-containing compound catabolic process (GO:0072529) 1/17 0.04377358 TYMP
121 aorta morphogenesis (GO:0035909) 1/17 0.04377358 EFEMP2
122 positive regulation of cytokine production involved in inflammatory response (GO:1900017) 1/17 0.04377358 STAT3
123 muscle tissue morphogenesis (GO:0060415) 1/17 0.04377358 EFEMP2
124 cytokine-mediated signaling pathway (GO:0019221) 3/621 0.04417511 TNFRSF6B;STAT3;MMP9
125 positive regulation of cell motility (GO:2000147) 2/221 0.04417511 STAT3;MMP9
126 negative regulation of cation transmembrane transport (GO:1904063) 1/18 0.04417511 MMP9
127 negative regulation of tumor necrosis factor-mediated signaling pathway (GO:0010804) 1/18 0.04417511 PTPN2
128 positive regulation of extracellular matrix organization (GO:1903055) 1/18 0.04417511 EFEMP2
129 interleukin-6-mediated signaling pathway (GO:0070102) 1/18 0.04417511 STAT3
130 inflammatory response (GO:0006954) 2/230 0.04421160 STAT3;ITGAL
131 cellular response to interleukin-7 (GO:0098761) 1/19 0.04421160 STAT3
132 negative regulation of T cell receptor signaling pathway (GO:0050860) 1/19 0.04421160 PTPN2
133 long-term memory (GO:0007616) 1/19 0.04421160 RGS14
134 regulation of nervous system process (GO:0031644) 1/19 0.04421160 TYMP
135 regulation of neuroinflammatory response (GO:0150077) 1/19 0.04421160 MMP9
136 interleukin-7-mediated signaling pathway (GO:0038111) 1/19 0.04421160 STAT3
137 adaptive immune response based on somatic recombination of immune receptors built from immunoglobulin superfamily domains (GO:0002460) 1/20 0.04519081 STAT3
138 eye morphogenesis (GO:0048592) 1/20 0.04519081 STAT3
139 growth hormone receptor signaling pathway (GO:0060396) 1/20 0.04519081 STAT3
140 negative regulation of lipid storage (GO:0010888) 1/20 0.04519081 PTPN2
141 regulation of ERK1 and ERK2 cascade (GO:0070372) 2/238 0.04534477 RGS14;PTPN2
142 long-term synaptic potentiation (GO:0060291) 1/21 0.04611387 RGS14
143 negative regulation of ion transmembrane transporter activity (GO:0032413) 1/21 0.04611387 MMP9
144 positive regulation of vascular associated smooth muscle cell proliferation (GO:1904707) 1/21 0.04611387 MMP9
145 regulation of lipid storage (GO:0010883) 1/22 0.04795746 PTPN2
146 positive regulation of signal transduction (GO:0009967) 2/252 0.04844676 TSPAN14;STAT3
147 regulation of supramolecular fiber organization (GO:1902903) 1/23 0.04844676 EFEMP2
148 regulation of interferon-gamma-mediated signaling pathway (GO:0060334) 1/23 0.04844676 PTPN2
149 artery development (GO:0060840) 1/23 0.04844676 EFEMP2
150 negative regulation of G protein-coupled receptor signaling pathway (GO:0045744) 1/23 0.04844676 RGS14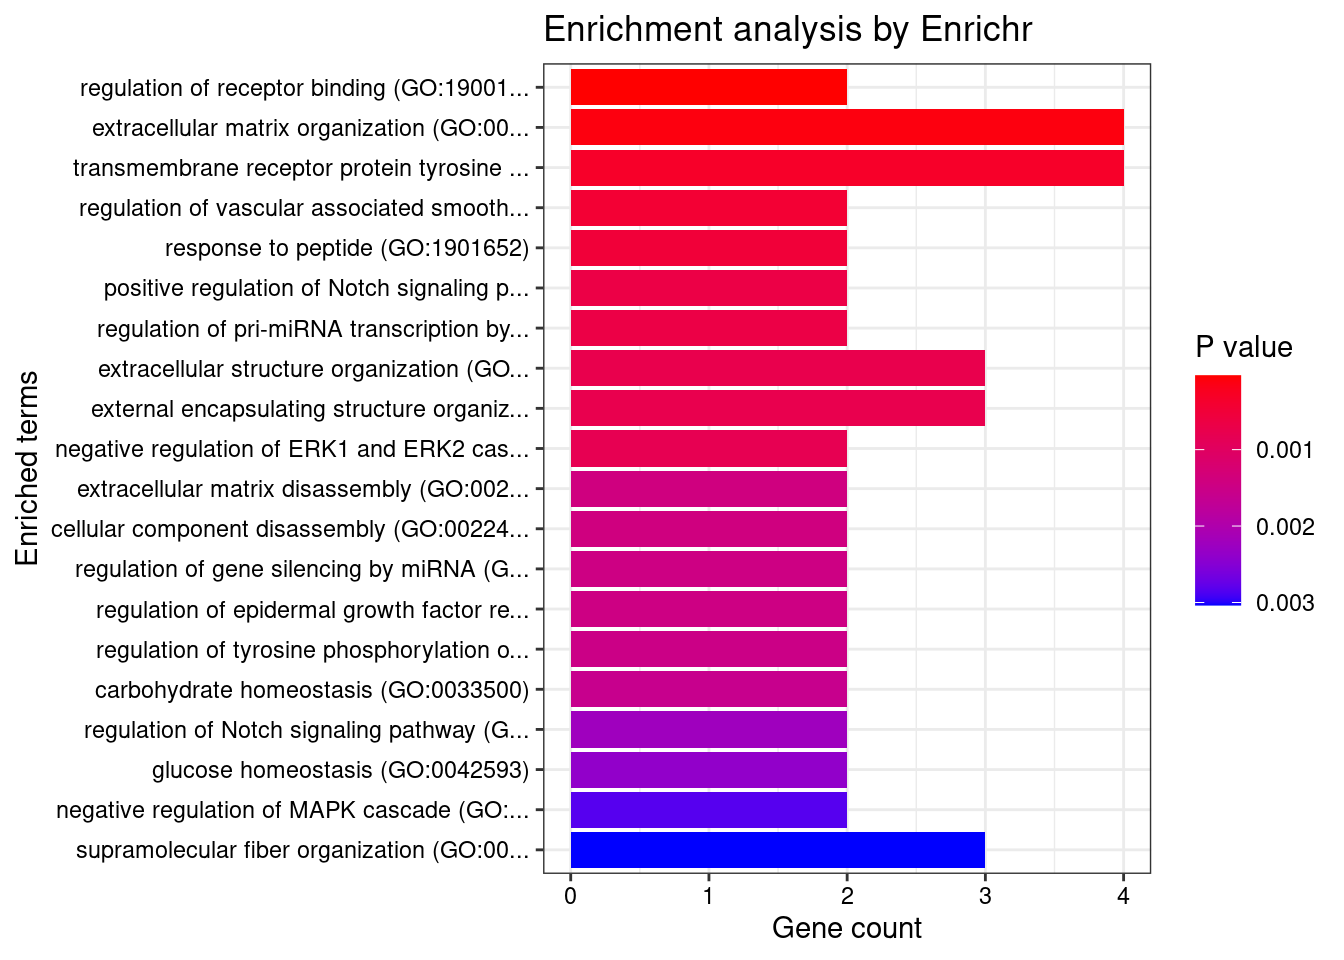
| Version | Author | Date |
|---|---|---|
| 397176f | wesleycrouse | 2022-06-10 |
Blood or Immune

Number of cTWAS Genes in Tissue Group: 20

Uploading data to Enrichr... Done.
  Querying GO_Biological_Process_2021... Done.
Parsing results... Done.

GO_Biological_Process_2021

                                                                                       Term Overlap Adjusted.P.value       Genes
1 positive regulation of cytokine production involved in inflammatory response (GO:1900017)    2/17       0.04402739 CARD9;STAT3
2                                   positive regulation of histone acetylation (GO:0035066)    2/23       0.04402739   MUC1;BRD7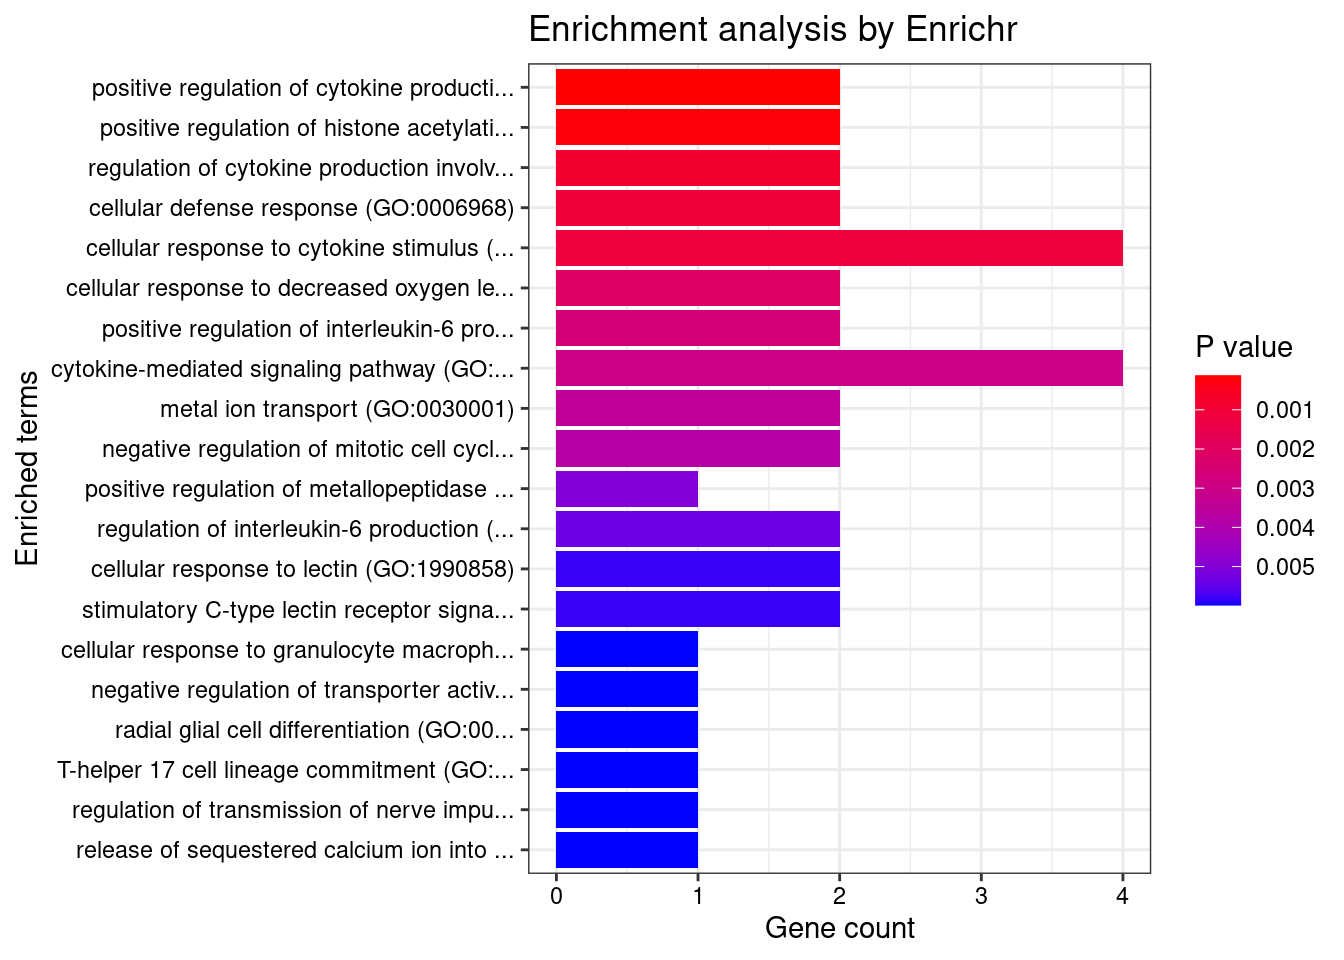
| Version | Author | Date |
|---|---|---|
| 397176f | wesleycrouse | 2022-06-10 |
Digestive

Number of cTWAS Genes in Tissue Group: 32

Uploading data to Enrichr... Done.
  Querying GO_Biological_Process_2021... Done.
Parsing results... Done.

GO_Biological_Process_2021

                                                  Term Overlap Adjusted.P.value      Genes
1          regulation of receptor binding (GO:1900120)    2/10        0.0261833 ADAM15;HFE
2 negative regulation of receptor binding (GO:1900121)    2/10        0.0261833 ADAM15;HFE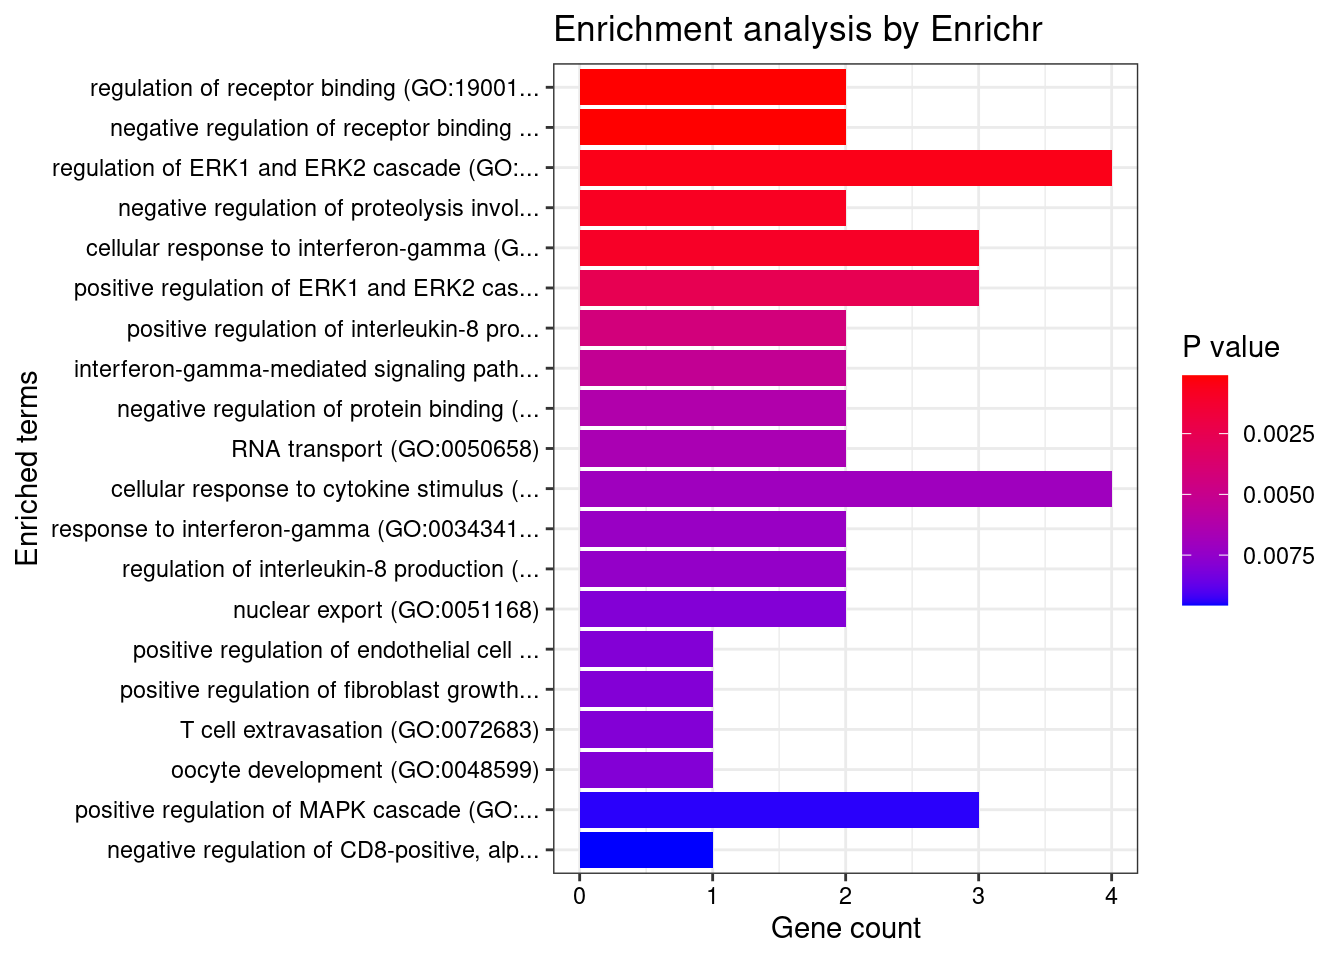
| Version | Author | Date |
|---|---|---|
| 397176f | wesleycrouse | 2022-06-10 |
if (exists("group_enrichment_results")){
  save(group_enrichment_results, file="group_enrichment_results.RData")
}
KEGG
for (group in names(df_group)){
  cat(paste0(group, "\n\n"))

  ctwas_genes_group <- df_group[[group]]$ctwas
  background_group <- df_group[[group]]$background

  cat(paste0("Number of cTWAS Genes in Tissue Group: ", length(ctwas_genes_group), "\n\n"))

  databases <- c("pathway_KEGG")

  enrichResult <- WebGestaltR(enrichMethod="ORA", organism="hsapiens",
                              interestGene=ctwas_genes_group, referenceGene=background_group,
                              enrichDatabase=databases, interestGeneType="genesymbol",
                              referenceGeneType="genesymbol", isOutput=F)

  if (!is.null(enrichResult)){
    print(enrichResult[,c("description", "size", "overlap", "FDR", "userId")])
  }

  cat("\n")
}
Adipose
Number of cTWAS Genes in Tissue Group: 17
Loading the functional categories...
Loading the ID list...
Loading the reference list...
Performing the enrichment analysis...
description size overlap FDR userId
1 Tuberculosis 122 4 0.02290424 HLA-DQA1;CARD9;LSP1;CIITA
Endocrine
Number of cTWAS Genes in Tissue Group: 22
Loading the functional categories...
Loading the ID list...
Loading the reference list...
Performing the enrichment analysis...
description size overlap FDR userId
1 Inflammatory bowel disease (IBD) 46 4 0.001388788 STAT3;IFNGR2;HLA-DMB;SMAD3
2 Leishmaniasis 53 4 0.001388788 PRKCB;IFNGR2;FCGR2A;HLA-DMB
3 Tuberculosis 135 5 0.001903198 CARD9;LSP1;IFNGR2;FCGR2A;HLA-DMB
4 Th17 cell differentiation 81 4 0.003775587 STAT3;IFNGR2;HLA-DMB;SMAD3
5 Hepatitis B 110 4 0.010013322 PRKCB;STAT3;SMAD3;IRF3
6 Influenza A 131 4 0.016383217 PRKCB;IFNGR2;HLA-DMB;IRF3
7 AGE-RAGE signaling pathway in diabetic complications 82 3 0.048617240 PRKCB;STAT3;SMAD3
8 HIF-1 signaling pathway 83 3 0.048617240 PRKCB;STAT3;IFNGR2
Cardiovascular
Number of cTWAS Genes in Tissue Group: 16
Loading the functional categories...
Loading the ID list...
Loading the reference list...
Performing the enrichment analysis...Warning in oraEnrichment(interestGeneList, referenceGeneList, geneSet, minNum = minNum, : No significant gene set is identified based on FDR 0.05!
CNS

Number of cTWAS Genes in Tissue Group: 29

Loading the functional categories...
Loading the ID list...
Loading the reference list...
Performing the enrichment analysis...
             description size overlap         FDR                             userId
1          Leishmaniasis   61       4 0.005912898       FCGR2A;HLA-DQA1;MAPK13;PRKCB
2           Tuberculosis  147       5 0.005912898 LSP1;FCGR2A;HLA-DQA1;MAPK13;FCER1G
3 Rap1 signaling pathway  181       5 0.010688524     PRKD2;MAPK13;EFNA1;PRKCB;RGS14

None

Number of cTWAS Genes in Tissue Group: 27

Loading the functional categories...
Loading the ID list...
Loading the reference list...
Performing the enrichment analysis...
Warning in oraEnrichment(interestGeneList, referenceGeneList, geneSet, minNum = minNum, : No significant gene set is identified based on FDR 0.05!
Skin

Number of cTWAS Genes in Tissue Group: 17

Loading the functional categories...
Loading the ID list...
Loading the reference list...
Performing the enrichment analysis...
Warning in oraEnrichment(interestGeneList, referenceGeneList, geneSet, minNum = minNum, : No significant gene set is identified based on FDR 0.05!
Blood or Immune

Number of cTWAS Genes in Tissue Group: 20

Loading the functional categories...
Loading the ID list...
Loading the reference list...
Performing the enrichment analysis...
Warning in oraEnrichment(interestGeneList, referenceGeneList, geneSet, minNum = minNum, : No significant gene set is identified based on FDR 0.05!
Digestive

Number of cTWAS Genes in Tissue Group: 32

Loading the functional categories...
Loading the ID list...
Loading the reference list...
Performing the enrichment analysis...
Warning in oraEnrichment(interestGeneList, referenceGeneList, geneSet, minNum = minNum, : No significant gene set is identified based on FDR 0.05!DisGeNET
for (group in names(df_group)){
  cat(paste0(group, "\n\n"))

  ctwas_genes_group <- df_group[[group]]$ctwas

  cat(paste0("Number of cTWAS Genes in Tissue Group: ", length(ctwas_genes_group), "\n\n"))

  res_enrich <- disease_enrichment(entities=ctwas_genes_group, vocabulary = "HGNC", database = "CURATED")

  if (any(res_enrich@qresult$FDR < 0.05)){
    print(res_enrich@qresult[res_enrich@qresult$FDR < 0.05, c("Description", "FDR", "Ratio",  "BgRatio")])
  }

  cat("\n")
}
Adipose
Number of cTWAS Genes in Tissue Group: 17SDCCAG3 gene(s) from the input list not found in DisGeNET CURATEDFGFR1OP gene(s) from the input list not found in DisGeNET CURATEDCDH24 gene(s) from the input list not found in DisGeNET CURATEDRGS14 gene(s) from the input list not found in DisGeNET CURATEDNPEPPS gene(s) from the input list not found in DisGeNET CURATEDADAM15 gene(s) from the input list not found in DisGeNET CURATED Description FDR Ratio BgRatio
31 Inflammatory Bowel Diseases 0.0007658602 3/11 35/9703
14 Ulcerative Colitis 0.0022833904 3/11 63/9703
2 Anovulation 0.0135185261 1/11 1/9703
11 Celiac Disease 0.0135185261 2/11 47/9703
21 Enteritis 0.0135185261 1/11 1/9703
87 Deep seated dermatophytosis 0.0135185261 1/11 1/9703
94 Bare Lymphocyte Syndrome, Type II, Complementation Group A 0.0135185261 1/11 1/9703
95 Medullary cystic kidney disease 1 0.0135185261 1/11 1/9703
97 Inflammatory Bowel Disease 10 0.0135185261 1/11 1/9703
102 Mycobacterium tuberculosis, susceptibility to infection by 0.0135185261 1/11 1/9703
36 Megaesophagus 0.0146649733 1/11 2/9703
51 Eosinophilia-Myalgia Syndrome 0.0146649733 1/11 2/9703
79 Eosinophilia-Myalgia Syndrome, L-Tryptophan-Related 0.0146649733 1/11 2/9703
92 Visceral myopathy familial external ophthalmoplegia 0.0146649733 1/11 2/9703
93 Candidiasis, Familial, 2 0.0146649733 1/11 2/9703
99 MITOCHONDRIAL DNA DEPLETION SYNDROME 5 (ENCEPHALOMYOPATHIC WITH OR WITHOUT METHYLMALONIC ACIDURIA) 0.0146649733 1/11 2/9703
108 Mitochondrial DNA Depletion Syndrome 1 0.0146649733 1/11 2/9703
1 Addison Disease 0.0196717946 1/11 3/9703
82 MITOCHONDRIAL NEUROGASTROINTESTINAL ENCEPHALOPATHY SYNDROME 0.0196717946 1/11 3/9703
22 Esophageal Achalasia 0.0207539720 1/11 4/9703
40 Oropharyngeal Neoplasms 0.0207539720 1/11 4/9703
80 Idiopathic achalasia of esophagus 0.0207539720 1/11 4/9703
98 Oropharyngeal Carcinoma 0.0207539720 1/11 4/9703
101 Bare lymphocyte syndrome 2 0.0207539720 1/11 4/9703
42 Pancreatic Neoplasm 0.0239464909 2/11 100/9703
71 Malignant neoplasm of pancreas 0.0239464909 2/11 102/9703
24 Membranous glomerulonephritis 0.0257370102 1/11 6/9703
52 Idiopathic Membranous Glomerulonephritis 0.0257370102 1/11 6/9703
90 Heymann Nephritis 0.0257370102 1/11 6/9703
44 Peritoneal Neoplasms 0.0400449872 1/11 10/9703
72 Carcinomatosis of peritoneal cavity 0.0400449872 1/11 10/9703
48 Ankylosing spondylitis 0.0413585123 1/11 11/9703
64 Leukoencephalopathy 0.0413585123 1/11 11/9703
32 Leishmaniasis, Visceral 0.0473918093 1/11 13/9703
3 Rheumatoid Arthritis 0.0497137020 2/11 174/9703
Endocrine
Number of cTWAS Genes in Tissue Group: 22GPR132 gene(s) from the input list not found in DisGeNET CURATEDPRM3 gene(s) from the input list not found in DisGeNET CURATEDADAM15 gene(s) from the input list not found in DisGeNET CURATEDCDH24 gene(s) from the input list not found in DisGeNET CURATEDHLA-DMB gene(s) from the input list not found in DisGeNET CURATEDRGS14 gene(s) from the input list not found in DisGeNET CURATED Description FDR Ratio BgRatio
22 Ulcerative Colitis 1.114592e-09 7/16 63/9703
27 Crohn Disease 1.012024e-02 3/16 50/9703
34 Enteritis 2.197629e-02 1/16 1/9703
51 Inflammatory Bowel Diseases 2.197629e-02 2/16 35/9703
60 Adult T-Cell Lymphoma/Leukemia 2.197629e-02 2/16 31/9703
76 Mesothelioma 2.197629e-02 2/16 41/9703
83 Niemann-Pick Diseases 2.197629e-02 1/16 1/9703
109 Ureteral obstruction 2.197629e-02 2/16 24/9703
122 Crohn's disease of large bowel 2.197629e-02 2/16 44/9703
133 Diabetes, Autoimmune 2.197629e-02 2/16 44/9703
149 Crohn's disease of the ileum 2.197629e-02 2/16 44/9703
150 Niemann-Pick Disease, Type A 2.197629e-02 1/16 1/9703
151 Niemann-Pick Disease, Type B 2.197629e-02 1/16 1/9703
152 Niemann-Pick Disease, Type E 2.197629e-02 1/16 1/9703
169 Brittle diabetes 2.197629e-02 2/16 44/9703
194 Regional enteritis 2.197629e-02 2/16 44/9703
229 IIeocolitis 2.197629e-02 2/16 44/9703
240 Deep seated dermatophytosis 2.197629e-02 1/16 1/9703
242 Chronic Lymphoproliferative Disorder of NK-Cells 2.197629e-02 1/16 1/9703
255 Medullary cystic kidney disease 1 2.197629e-02 1/16 1/9703
261 Neutropenia and hyperlymphocytosis with large granular lymphocytes 2.197629e-02 1/16 1/9703
264 LOEYS-DIETZ SYNDROME 3 2.197629e-02 1/16 1/9703
265 Hyper-Ige Recurrent Infection Syndrome, Autosomal Dominant 2.197629e-02 1/16 1/9703
270 Diabetes Mellitus, Ketosis-Prone 2.197629e-02 2/16 44/9703
272 IMMUNODEFICIENCY 28 2.197629e-02 1/16 1/9703
273 AUTOIMMUNE DISEASE, MULTISYSTEM, INFANTILE-ONSET, 1 2.197629e-02 1/16 1/9703
276 EPILEPSY, IDIOPATHIC GENERALIZED, SUSCEPTIBILITY TO, 14 2.197629e-02 1/16 1/9703
277 EPILEPTIC ENCEPHALOPATHY, EARLY INFANTILE, 34 2.197629e-02 1/16 1/9703
278 ENCEPHALOPATHY, ACUTE, INFECTION-INDUCED (HERPES-SPECIFIC), SUSCEPTIBILITY TO, 7 2.197629e-02 1/16 1/9703
286 Diabetes Mellitus, Sudden-Onset 2.197629e-02 2/16 44/9703
293 HYPER-IgE RECURRENT INFECTION SYNDROME 1, AUTOSOMAL DOMINANT 2.197629e-02 1/16 1/9703
31 Diabetes Mellitus, Insulin-Dependent 2.225834e-02 2/16 45/9703
254 Candidiasis, Familial, 2 2.849845e-02 1/16 2/9703
258 T-Cell Large Granular Lymphocyte Leukemia 2.849845e-02 1/16 2/9703
75 Meniere Disease 3.925128e-02 1/16 3/9703
259 Hyper-Immunoglobulin E Syndrome, Autosomal Recessive 3.925128e-02 1/16 3/9703
263 Hyper-Immunoglobulin E Syndrome, Autosomal Dominant 3.925128e-02 1/16 3/9703
77 Mucocutaneous Lymph Node Syndrome 4.837250e-02 1/16 4/9703
135 Ki-1+ Anaplastic Large Cell Lymphoma 4.837250e-02 1/16 4/9703
271 Job Syndrome 4.837250e-02 1/16 4/9703
1 Herpetic Acute Necrotizing Encephalitis 4.932156e-02 1/16 5/9703
4 Aneurysm, Dissecting 4.932156e-02 1/16 5/9703
41 Cardiomegaly 4.932156e-02 2/16 82/9703
59 Leukemia, T-Cell 4.932156e-02 1/16 5/9703
168 Dissection of aorta 4.932156e-02 1/16 5/9703
239 Cardiac Hypertrophy 4.932156e-02 2/16 82/9703
252 Loeys-Dietz Aortic Aneurysm Syndrome 4.932156e-02 1/16 5/9703
279 Dissection, Blood Vessel 4.932156e-02 1/16 5/9703
284 Loeys-Dietz Syndrome, Type 1a 4.932156e-02 1/16 5/9703
Cardiovascular
Number of cTWAS Genes in Tissue Group: 16RGS14 gene(s) from the input list not found in DisGeNET CURATEDADAM15 gene(s) from the input list not found in DisGeNET CURATEDBRD7 gene(s) from the input list not found in DisGeNET CURATED Description FDR Ratio BgRatio
20 Ulcerative Colitis 0.01347501 3/13 63/9703
36 Huntington Disease 0.02106591 2/13 17/9703
28 Enteritis 0.02302243 1/13 1/9703
38 Inflammatory Bowel Diseases 0.02302243 2/13 35/9703
154 Chronic Lymphoproliferative Disorder of NK-Cells 0.02302243 1/13 1/9703
167 Neutropenia and hyperlymphocytosis with large granular lymphocytes 0.02302243 1/13 1/9703
170 CUTIS LAXA, AUTOSOMAL RECESSIVE, TYPE IB 0.02302243 1/13 1/9703
171 Hyper-Ige Recurrent Infection Syndrome, Autosomal Dominant 0.02302243 1/13 1/9703
176 IMMUNODEFICIENCY 28 0.02302243 1/13 1/9703
177 AUTOIMMUNE DISEASE, MULTISYSTEM, INFANTILE-ONSET, 1 0.02302243 1/13 1/9703
188 HYPER-IgE RECURRENT INFECTION SYNDROME 1, AUTOSOMAL DOMINANT 0.02302243 1/13 1/9703
42 Acute Promyelocytic Leukemia 0.02614022 2/13 46/9703
104 Cutis Laxa, Autosomal Recessive, Type I 0.02812112 1/13 2/9703
116 Cutis laxa, recessive, type I 0.02812112 1/13 2/9703
160 Visceral myopathy familial external ophthalmoplegia 0.02812112 1/13 2/9703
163 T-Cell Large Granular Lymphocyte Leukemia 0.02812112 1/13 2/9703
166 MITOCHONDRIAL DNA DEPLETION SYNDROME 5 (ENCEPHALOMYOPATHIC WITH OR WITHOUT METHYLMALONIC ACIDURIA) 0.02812112 1/13 2/9703
179 Mitochondrial DNA Depletion Syndrome 1 0.02812112 1/13 2/9703
140 MITOCHONDRIAL NEUROGASTROINTESTINAL ENCEPHALOPATHY SYNDROME 0.03613337 1/13 3/9703
164 Hyper-Immunoglobulin E Syndrome, Autosomal Recessive 0.03613337 1/13 3/9703
168 Hyper-Immunoglobulin E Syndrome, Autosomal Dominant 0.03613337 1/13 3/9703
49 Lung diseases 0.04038151 2/13 78/9703
96 Ki-1+ Anaplastic Large Cell Lymphoma 0.04212954 1/13 4/9703
175 Job Syndrome 0.04212954 1/13 4/9703
CNS
Number of cTWAS Genes in Tissue Group: 29RAB29 gene(s) from the input list not found in DisGeNET CURATEDTSPAN14 gene(s) from the input list not found in DisGeNET CURATEDCASC3 gene(s) from the input list not found in DisGeNET CURATEDAPEH gene(s) from the input list not found in DisGeNET CURATEDSDCCAG3 gene(s) from the input list not found in DisGeNET CURATEDRGS14 gene(s) from the input list not found in DisGeNET CURATEDTTPAL gene(s) from the input list not found in DisGeNET CURATEDADAM15 gene(s) from the input list not found in DisGeNET CURATEDOAZ3 gene(s) from the input list not found in DisGeNET CURATEDPLEKHH2 gene(s) from the input list not found in DisGeNET CURATED Description FDR Ratio BgRatio
15 Ulcerative Colitis 0.00122878 4/19 63/9703
27 Enteritis 0.02754758 1/19 1/9703
108 Popliteal pterygium syndrome 0.02754758 1/19 1/9703
110 Congenital lip pits 0.02754758 1/19 1/9703
123 Lip pit 0.02754758 1/19 1/9703
174 Polio and Post-Polio Syndrome 0.02754758 1/19 1/9703
182 OROFACIAL CLEFT 6, SUSCEPTIBILITY TO 0.02754758 1/19 1/9703
187 Medullary cystic kidney disease 1 0.02754758 1/19 1/9703
190 Mycobacterium tuberculosis, susceptibility to infection by 0.02754758 1/19 1/9703
192 CUTIS LAXA, AUTOSOMAL RECESSIVE, TYPE IB 0.02754758 1/19 1/9703
195 SHORT-RIB THORACIC DYSPLASIA 10 WITH OR WITHOUT POLYDACTYLY 0.02754758 1/19 1/9703
199 EPILEPSY, IDIOPATHIC GENERALIZED, SUSCEPTIBILITY TO, 14 0.02754758 1/19 1/9703
200 EPILEPTIC ENCEPHALOPATHY, EARLY INFANTILE, 34 0.02754758 1/19 1/9703
201 RETINITIS PIGMENTOSA 71 0.02754758 1/19 1/9703
202 SPASTIC PARAPLEGIA 73, AUTOSOMAL DOMINANT 0.02754758 1/19 1/9703
24 Diabetes Mellitus, Insulin-Dependent 0.02948789 2/19 45/9703
54 Megaesophagus 0.02948789 1/19 2/9703
87 Eosinophilia-Myalgia Syndrome 0.02948789 1/19 2/9703
99 Van der Woude syndrome 0.02948789 1/19 2/9703
100 Diabetes, Autoimmune 0.02948789 2/19 44/9703
111 Cutis Laxa, Autosomal Recessive, Type I 0.02948789 1/19 2/9703
124 Brittle diabetes 0.02948789 2/19 44/9703
139 Cutis laxa, recessive, type I 0.02948789 1/19 2/9703
160 Eosinophilia-Myalgia Syndrome, L-Tryptophan-Related 0.02948789 1/19 2/9703
184 Mainzer-Saldino Disease 0.02948789 1/19 2/9703
196 Diabetes Mellitus, Ketosis-Prone 0.02948789 2/19 44/9703
207 VAN DER WOUDE SYNDROME 1 0.02948789 1/19 2/9703
208 Diabetes Mellitus, Sudden-Onset 0.02948789 2/19 44/9703
56 Meniere Disease 0.03991428 1/19 3/9703
106 Libman-Sacks Disease 0.03991428 2/19 58/9703
186 Rheumatoid Arthritis, Systemic Juvenile 0.03991428 1/19 3/9703
31 Esophageal Achalasia 0.04120650 1/19 4/9703
39 Hypersensitivity 0.04120650 2/19 64/9703
58 Mucocutaneous Lymph Node Syndrome 0.04120650 1/19 4/9703
62 Oropharyngeal Neoplasms 0.04120650 1/19 4/9703
165 Idiopathic achalasia of esophagus 0.04120650 1/19 4/9703
170 Cleft lip and alveolus 0.04120650 1/19 4/9703
173 Systemic onset juvenile chronic arthritis 0.04120650 1/19 4/9703
176 Allergic Reaction 0.04120650 2/19 63/9703
188 Oropharyngeal Carcinoma 0.04120650 1/19 4/9703
50 Lupus Erythematosus, Systemic 0.04288553 2/19 71/9703
164 Cleft Lip with or without Cleft Palate 0.04900989 1/19 5/9703
None
Number of cTWAS Genes in Tissue Group: 27CDH24 gene(s) from the input list not found in DisGeNET CURATEDRGS14 gene(s) from the input list not found in DisGeNET CURATEDOAZ3 gene(s) from the input list not found in DisGeNET CURATEDCRTC3 gene(s) from the input list not found in DisGeNET CURATEDAPEH gene(s) from the input list not found in DisGeNET CURATEDCASC3 gene(s) from the input list not found in DisGeNET CURATEDADAM15 gene(s) from the input list not found in DisGeNET CURATEDDDX39B gene(s) from the input list not found in DisGeNET CURATED Description FDR Ratio BgRatio
19 Ulcerative Colitis 4.078636e-09 7/19 63/9703
30 Enteritis 2.698184e-02 1/19 1/9703
56 Lung diseases 2.698184e-02 3/19 78/9703
128 Congenital chloride diarrhea 2.698184e-02 1/19 1/9703
196 Deep seated dermatophytosis 2.698184e-02 1/19 1/9703
198 Chronic Lymphoproliferative Disorder of NK-Cells 2.698184e-02 1/19 1/9703
207 PARKINSON DISEASE 8 (disorder) 2.698184e-02 1/19 1/9703
212 Medullary cystic kidney disease 1 2.698184e-02 1/19 1/9703
219 Waardenburg Syndrome, Type 4b 2.698184e-02 1/19 1/9703
220 Neutropenia and hyperlymphocytosis with large granular lymphocytes 2.698184e-02 1/19 1/9703
222 HIRSCHSPRUNG DISEASE, SUSCEPTIBILITY TO, 4 2.698184e-02 1/19 1/9703
224 CUTIS LAXA, AUTOSOMAL RECESSIVE, TYPE IB 2.698184e-02 1/19 1/9703
225 Hyper-Ige Recurrent Infection Syndrome, Autosomal Dominant 2.698184e-02 1/19 1/9703
231 IMMUNODEFICIENCY 32A 2.698184e-02 1/19 1/9703
234 IMMUNODEFICIENCY 28 2.698184e-02 1/19 1/9703
235 AUTOIMMUNE DISEASE, MULTISYSTEM, INFANTILE-ONSET, 1 2.698184e-02 1/19 1/9703
236 IMMUNODEFICIENCY 32B 2.698184e-02 1/19 1/9703
247 HYPER-IgE RECURRENT INFECTION SYNDROME 1, AUTOSOMAL DOMINANT 2.698184e-02 1/19 1/9703
46 Inflammatory Bowel Diseases 2.715909e-02 2/19 35/9703
28 Diabetes Mellitus, Insulin-Dependent 3.346362e-02 2/19 45/9703
68 Multiple Myeloma 3.346362e-02 2/19 42/9703
116 Diabetes, Autoimmune 3.346362e-02 2/19 44/9703
129 Cutis Laxa, Autosomal Recessive, Type I 3.346362e-02 1/19 2/9703
139 Brittle diabetes 3.346362e-02 2/19 44/9703
147 Cutis laxa, recessive, type I 3.346362e-02 1/19 2/9703
211 Candidiasis, Familial, 2 3.346362e-02 1/19 2/9703
216 T-Cell Large Granular Lymphocyte Leukemia 3.346362e-02 1/19 2/9703
232 Diabetes Mellitus, Ketosis-Prone 3.346362e-02 2/19 44/9703
240 Diabetes Mellitus, Sudden-Onset 3.346362e-02 2/19 44/9703
23 Crohn Disease 3.479938e-02 2/19 50/9703
209 Rheumatoid Arthritis, Systemic Juvenile 4.407022e-02 1/19 3/9703
218 Hyper-Immunoglobulin E Syndrome, Autosomal Recessive 4.407022e-02 1/19 3/9703
221 Hyper-Immunoglobulin E Syndrome, Autosomal Dominant 4.407022e-02 1/19 3/9703
Skin
Number of cTWAS Genes in Tissue Group: 17TNFRSF6B gene(s) from the input list not found in DisGeNET CURATEDRGS14 gene(s) from the input list not found in DisGeNET CURATEDTSPAN14 gene(s) from the input list not found in DisGeNET CURATEDHLA-DOB gene(s) from the input list not found in DisGeNET CURATEDNPEPPS gene(s) from the input list not found in DisGeNET CURATEDOAZ3 gene(s) from the input list not found in DisGeNET CURATEDNDFIP1 gene(s) from the input list not found in DisGeNET CURATEDADAM15 gene(s) from the input list not found in DisGeNET CURATED Description FDR Ratio BgRatio
4 Aortic Aneurysm 0.002019501 2/9 7/9703
30 Ulcerative Colitis 0.002019501 3/9 63/9703
58 Leukemia, T-Cell 0.002019501 2/9 5/9703
87 Pancreatic Neoplasm 0.005144710 3/9 100/9703
176 Malignant neoplasm of pancreas 0.005144710 3/9 102/9703
23 Malignant tumor of colon 0.007502662 3/9 159/9703
31 Colonic Neoplasms 0.007502662 3/9 152/9703
141 Middle Cerebral Artery Syndrome 0.007502662 2/9 34/9703
192 Middle Cerebral Artery Thrombosis 0.007502662 2/9 34/9703
193 Middle Cerebral Artery Occlusion 0.007502662 2/9 34/9703
194 Infarction, Middle Cerebral Artery 0.007502662 2/9 34/9703
208 Middle Cerebral Artery Embolus 0.007502662 2/9 34/9703
209 Left Middle Cerebral Artery Infarction 0.007502662 2/9 34/9703
210 Embolic Infarction, Middle Cerebral Artery 0.007502662 2/9 34/9703
211 Thrombotic Infarction, Middle Cerebral Artery 0.007502662 2/9 34/9703
212 Right Middle Cerebral Artery Infarction 0.007502662 2/9 34/9703
34 Crohn Disease 0.009084512 2/9 50/9703
57 Acute Promyelocytic Leukemia 0.009084512 2/9 46/9703
80 Neoplasm Metastasis 0.009084512 3/9 217/9703
223 Gestational Trophoblastic Neoplasms 0.009084512 1/9 1/9703
232 Chronic Lymphoproliferative Disorder of NK-Cells 0.009084512 1/9 1/9703
253 Metaphyseal Anadysplasia 2 0.009084512 1/9 1/9703
254 Neutropenia and hyperlymphocytosis with large granular lymphocytes 0.009084512 1/9 1/9703
256 Gestational trophoblastic disease 0.009084512 1/9 1/9703
261 CUTIS LAXA, AUTOSOMAL RECESSIVE, TYPE IB 0.009084512 1/9 1/9703
262 Hyper-Ige Recurrent Infection Syndrome, Autosomal Dominant 0.009084512 1/9 1/9703
268 AUTOIMMUNE DISEASE, MULTISYSTEM, INFANTILE-ONSET, 1 0.009084512 1/9 1/9703
272 MYOPIA 25, AUTOSOMAL DOMINANT 0.009084512 1/9 1/9703
282 HYPER-IgE RECURRENT INFECTION SYNDROME 1, AUTOSOMAL DOMINANT 0.009084512 1/9 1/9703
28 Brain Ischemia 0.012065511 2/9 60/9703
217 Cerebral Ischemia 0.012065511 2/9 60/9703
149 Cutis Laxa, Autosomal Recessive, Type I 0.013504729 1/9 2/9703
179 Metaphyseal anadysplasia 0.013504729 1/9 2/9703
180 Mandibuloacral dysostosis 0.013504729 1/9 2/9703
181 Cutis laxa, recessive, type I 0.013504729 1/9 2/9703
243 Visceral myopathy familial external ophthalmoplegia 0.013504729 1/9 2/9703
246 T-Cell Large Granular Lymphocyte Leukemia 0.013504729 1/9 2/9703
252 MITOCHONDRIAL DNA DEPLETION SYNDROME 5 (ENCEPHALOMYOPATHIC WITH OR WITHOUT METHYLMALONIC ACIDURIA) 0.013504729 1/9 2/9703
273 Mitochondrial DNA Depletion Syndrome 1 0.013504729 1/9 2/9703
64 Lung diseases 0.015727625 2/9 78/9703
42 Glioblastoma 0.015734986 2/9 79/9703
88 Pericementitis 0.016116345 1/9 3/9703
95 Pulmonary Fibrosis 0.016116345 2/9 85/9703
170 Giant Cell Glioblastoma 0.016116345 2/9 84/9703
172 Stable angina 0.016116345 1/9 3/9703
214 MITOCHONDRIAL NEUROGASTROINTESTINAL ENCEPHALOPATHY SYNDROME 0.016116345 1/9 3/9703
248 Hyper-Immunoglobulin E Syndrome, Autosomal Recessive 0.016116345 1/9 3/9703
259 Hyper-Immunoglobulin E Syndrome, Autosomal Dominant 0.016116345 1/9 3/9703
279 Alveolitis, Fibrosing 0.016116345 2/9 83/9703
97 Reperfusion Injury 0.016320681 2/9 89/9703
67 Lupus Nephritis 0.019490749 1/9 4/9703
89 Periodontitis 0.019490749 1/9 4/9703
134 Ki-1+ Anaplastic Large Cell Lymphoma 0.019490749 1/9 4/9703
267 Job Syndrome 0.019490749 1/9 4/9703
236 Glioblastoma Multiforme 0.022886690 2/9 111/9703
6 Aortic Rupture 0.023071635 1/9 5/9703
195 Aortic Aneurysm, Ruptured 0.023071635 1/9 5/9703
5 Aortic Diseases 0.023881048 1/9 6/9703
16 Malignant neoplasm of urinary bladder 0.023881048 2/9 141/9703
17 Bladder Neoplasm 0.023881048 2/9 140/9703
18 Bone neoplasms 0.023881048 1/9 8/9703
19 Cerebral Edema 0.023881048 1/9 8/9703
26 Squamous cell carcinoma 0.023881048 2/9 124/9703
27 Neoplastic Cell Transformation 0.023881048 2/9 139/9703
35 Cutis Laxa 0.023881048 1/9 6/9703
51 Inflammation 0.023881048 2/9 127/9703
53 Lead Poisoning 0.023881048 1/9 7/9703
75 Morphine Dependence 0.023881048 1/9 7/9703
76 Multiple Organ Failure 0.023881048 1/9 8/9703
112 Juvenile-Onset Still Disease 0.023881048 2/9 135/9703
119 Aortic Aneurysm, Thoracic 0.023881048 1/9 7/9703
159 Malignant Bone Neoplasm 0.023881048 1/9 8/9703
173 Aortic Aneurysm, Thoracoabdominal 0.023881048 1/9 7/9703
182 Vasogenic Cerebral Edema 0.023881048 1/9 8/9703
183 Cytotoxic Cerebral Edema 0.023881048 1/9 8/9703
188 Morphine Abuse 0.023881048 1/9 7/9703
198 Vasogenic Brain Edema 0.023881048 1/9 8/9703
199 Cytotoxic Brain Edema 0.023881048 1/9 8/9703
234 Brain Edema 0.023881048 1/9 8/9703
242 DIABETES MELLITUS, PERMANENT NEONATAL 0.023881048 1/9 7/9703
251 clinical depression 0.023881048 1/9 6/9703
255 Juvenile pauciarticular chronic arthritis 0.023881048 1/9 7/9703
257 Neointima 0.023881048 1/9 6/9703
258 Neointima Formation 0.023881048 1/9 6/9703
263 Juvenile arthritis 0.023881048 2/9 131/9703
265 Juvenile psoriatic arthritis 0.023881048 2/9 131/9703
274 Polyarthritis, Juvenile, Rheumatoid Factor Negative 0.023881048 2/9 131/9703
276 Polyarthritis, Juvenile, Rheumatoid Factor Positive 0.023881048 2/9 131/9703
283 Marfan Syndrome, Type I 0.026553364 1/9 9/9703
71 Mammary Neoplasms, Experimental 0.026768504 2/9 155/9703
25 Non-Small Cell Lung Carcinoma 0.026805232 2/9 156/9703
118 Aortic Aneurysm, Abdominal 0.027369624 1/9 10/9703
125 Anaplastic carcinoma 0.027369624 2/9 163/9703
126 Carcinoma, Spindle-Cell 0.027369624 2/9 163/9703
127 Undifferentiated carcinoma 0.027369624 2/9 163/9703
128 Carcinomatosis 0.027369624 2/9 163/9703
164 Atrophic 0.027369624 1/9 10/9703
22 Carcinoma 0.027411561 2/9 164/9703
72 Marfan Syndrome 0.028294470 1/9 11/9703
115 Premature Birth 0.028294470 1/9 11/9703
150 Leukoencephalopathy 0.028294470 1/9 11/9703
244 Copper-Overload Cirrhosis 0.028294470 1/9 11/9703
56 Precursor B-Cell Lymphoblastic Leukemia-Lymphoma 0.029689675 1/9 12/9703
135 Centriacinar Emphysema 0.029689675 1/9 12/9703
145 Panacinar Emphysema 0.029689675 1/9 12/9703
250 Focal Emphysema 0.029689675 1/9 12/9703
39 Diabetic Neuropathies 0.031900855 1/9 14/9703
151 Symmetric Diabetic Proximal Motor Neuropathy 0.031900855 1/9 14/9703
152 Asymmetric Diabetic Proximal Motor Neuropathy 0.031900855 1/9 14/9703
153 Diabetic Mononeuropathy 0.031900855 1/9 14/9703
154 Diabetic Polyneuropathies 0.031900855 1/9 14/9703
155 Diabetic Amyotrophy 0.031900855 1/9 14/9703
156 Diabetic Autonomic Neuropathy 0.031900855 1/9 14/9703
178 Diabetic Asymmetric Polyneuropathy 0.031900855 1/9 14/9703
200 Diabetic Neuralgia 0.031900855 1/9 14/9703
81 Embryonal Neoplasm 0.032205097 1/9 15/9703
82 Neoplasms, Germ Cell and Embryonal 0.032205097 1/9 15/9703
132 Germ cell tumor 0.032205097 1/9 15/9703
133 Neoplasms, Embryonal and Mixed 0.032205097 1/9 15/9703
191 Germ Cell Cancer 0.032205097 1/9 15/9703
206 Cancer, Embryonal 0.032205097 1/9 15/9703
207 Cancer, Embryonal and Mixed 0.032205097 1/9 15/9703
107 T-Cell Lymphoma 0.034058782 1/9 16/9703
94 Pulmonary Emphysema 0.035880836 1/9 17/9703
92 Prostatic Neoplasms 0.036154920 3/9 616/9703
177 Malignant neoplasm of prostate 0.036154920 3/9 616/9703
85 Oral Submucous Fibrosis 0.036789081 1/9 18/9703
104 Gastric ulcer 0.036789081 1/9 18/9703
146 Congenital hernia of foramen of Morgagni 0.037640655 1/9 19/9703
147 Congenital hernia of foramen of Bochdalek 0.037640655 1/9 19/9703
280 Hamman-Rich Disease 0.037640655 1/9 19/9703
281 Usual Interstitial Pneumonia 0.037640655 1/9 19/9703
284 Familial Idiopathic Pulmonary Fibrosis 0.039307641 1/9 20/9703
108 Ovarian Failure, Premature 0.040345967 1/9 21/9703
137 Congenital diaphragmatic hernia 0.040345967 1/9 21/9703
241 Idiopathic Pulmonary Fibrosis 0.040345967 1/9 21/9703
45 Hepatitis, Chronic 0.041042663 1/9 22/9703
114 Chronic Persistent Hepatitis 0.041042663 1/9 22/9703
184 Chronic active hepatitis 0.041042663 1/9 22/9703
186 Cryptogenic Chronic Hepatitis 0.041042663 1/9 22/9703
10 Astrocytoma 0.041804188 1/9 25/9703
13 Behcet Syndrome 0.041804188 1/9 24/9703
96 Pyemia 0.041804188 1/9 24/9703
101 Septicemia 0.041804188 1/9 24/9703
117 Neonatal diabetes mellitus 0.041804188 1/9 25/9703
130 Subependymal Giant Cell Astrocytoma 0.041804188 1/9 25/9703
143 Sepsis 0.041804188 1/9 24/9703
161 Juvenile Pilocytic Astrocytoma 0.041804188 1/9 25/9703
162 Diffuse Astrocytoma 0.041804188 1/9 25/9703
169 Pilocytic Astrocytoma 0.041804188 1/9 25/9703
171 Childhood Cerebral Astrocytoma 0.041804188 1/9 25/9703
187 Mixed oligoastrocytoma 0.041804188 1/9 25/9703
196 Cerebral Astrocytoma 0.041804188 1/9 25/9703
197 Intracranial Astrocytoma 0.041804188 1/9 25/9703
238 Grade I Astrocytoma 0.041804188 1/9 25/9703
240 Severe Sepsis 0.041804188 1/9 24/9703
68 Lymphatic Metastasis 0.042371997 1/9 26/9703
166 Protoplasmic astrocytoma 0.042371997 1/9 26/9703
167 Gemistocytic astrocytoma 0.042371997 1/9 26/9703
168 Fibrillary Astrocytoma 0.042371997 1/9 26/9703
40 Fever 0.043174064 1/9 27/9703
98 Retinal Diseases 0.043174064 1/9 27/9703
165 Anaplastic astrocytoma 0.043174064 1/9 27/9703
49 Hyperplasia 0.044212194 1/9 28/9703
260 Cerebral Hemorrhage 0.044212194 1/9 28/9703
59 Adult T-Cell Lymphoma/Leukemia 0.048373417 1/9 31/9703
239 Hereditary Diffuse Gastric Cancer 0.048373417 2/9 293/9703
14 Cholestasis, Extrahepatic 0.049251134 1/9 32/9703
103 Stomach Neoplasms 0.049251134 2/9 297/9703
65 Chronic Obstructive Airway Disease 0.049595477 1/9 33/9703
69 Malignant neoplasm of stomach 0.049595477 2/9 300/9703
219 Acute Coronary Syndrome 0.049595477 1/9 33/9703
233 Chronic Airflow Obstruction 0.049595477 1/9 33/9703
Blood or Immune
Number of cTWAS Genes in Tissue Group: 20OSER1 gene(s) from the input list not found in DisGeNET CURATEDCPEB4 gene(s) from the input list not found in DisGeNET CURATEDNPIPB3 gene(s) from the input list not found in DisGeNET CURATEDC10orf105 gene(s) from the input list not found in DisGeNET CURATEDNDFIP1 gene(s) from the input list not found in DisGeNET CURATEDBIK gene(s) from the input list not found in DisGeNET CURATEDNPEPPS gene(s) from the input list not found in DisGeNET CURATEDADAM15 gene(s) from the input list not found in DisGeNET CURATEDZNF300 gene(s) from the input list not found in DisGeNET CURATEDBRD7 gene(s) from the input list not found in DisGeNET CURATED Description FDR Ratio BgRatio
17 Ulcerative Colitis 6.131872e-05 4/10 63/9703
13 Neoplastic Cell Transformation 1.127724e-02 3/10 139/9703
26 Enteritis 1.127724e-02 1/10 1/9703
37 Inflammatory Bowel Diseases 1.127724e-02 2/10 35/9703
75 West Nile Fever 1.127724e-02 1/10 1/9703
126 Encephalitis, West Nile Fever 1.127724e-02 1/10 1/9703
127 West Nile Fever Meningitis 1.127724e-02 1/10 1/9703
128 West Nile Fever Meningoencephalitis 1.127724e-02 1/10 1/9703
129 West Nile Fever Myelitis 1.127724e-02 1/10 1/9703
148 Deep seated dermatophytosis 1.127724e-02 1/10 1/9703
150 Chronic Lymphoproliferative Disorder of NK-Cells 1.127724e-02 1/10 1/9703
159 Medullary cystic kidney disease 1 1.127724e-02 1/10 1/9703
166 DIABETES MELLITUS, INSULIN-DEPENDENT, 22 (disorder) 1.127724e-02 1/10 1/9703
168 Neutropenia and hyperlymphocytosis with large granular lymphocytes 1.127724e-02 1/10 1/9703
170 Hyper-Ige Recurrent Infection Syndrome, Autosomal Dominant 1.127724e-02 1/10 1/9703
175 AUTOIMMUNE DISEASE, MULTISYSTEM, INFANTILE-ONSET, 1 1.127724e-02 1/10 1/9703
185 HYPER-IgE RECURRENT INFECTION SYNDROME 1, AUTOSOMAL DOMINANT 1.127724e-02 1/10 1/9703
157 Visceral myopathy familial external ophthalmoplegia 1.742037e-02 1/10 2/9703
158 Candidiasis, Familial, 2 1.742037e-02 1/10 2/9703
162 T-Cell Large Granular Lymphocyte Leukemia 1.742037e-02 1/10 2/9703
167 MITOCHONDRIAL DNA DEPLETION SYNDROME 5 (ENCEPHALOMYOPATHIC WITH OR WITHOUT METHYLMALONIC ACIDURIA) 1.742037e-02 1/10 2/9703
177 Mitochondrial DNA Depletion Syndrome 1 1.742037e-02 1/10 2/9703
49 Malignant neoplasm of stomach 2.052163e-02 3/10 300/9703
74 Stomach Neoplasms 2.052163e-02 3/10 297/9703
135 MITOCHONDRIAL NEUROGASTROINTESTINAL ENCEPHALOPATHY SYNDROME 2.052163e-02 1/10 3/9703
154 Hereditary Diffuse Gastric Cancer 2.052163e-02 3/10 293/9703
164 Hyper-Immunoglobulin E Syndrome, Autosomal Recessive 2.052163e-02 1/10 3/9703
169 Hyper-Immunoglobulin E Syndrome, Autosomal Dominant 2.052163e-02 1/10 3/9703
94 Ki-1+ Anaplastic Large Cell Lymphoma 2.552619e-02 1/10 4/9703
174 Job Syndrome 2.552619e-02 1/10 4/9703
62 Pancreatic Neoplasm 2.691484e-02 2/10 100/9703
111 Malignant neoplasm of pancreas 2.710265e-02 2/10 102/9703
43 Leukemia, T-Cell 2.871301e-02 1/10 5/9703
65 Precancerous Conditions 2.871301e-02 2/10 110/9703
106 Condition, Preneoplastic 2.871301e-02 2/10 110/9703
36 Inflammation 3.616923e-02 2/10 127/9703
156 DIABETES MELLITUS, PERMANENT NEONATAL 3.616923e-02 1/10 7/9703
9 Carcinoma 4.264589e-02 2/10 164/9703
10 Malignant tumor of colon 4.264589e-02 2/10 159/9703
18 Colonic Neoplasms 4.264589e-02 2/10 152/9703
59 Nephritis 4.264589e-02 1/10 9/9703
63 Peritoneal Neoplasms 4.264589e-02 1/10 10/9703
73 Ankylosing spondylitis 4.264589e-02 1/10 11/9703
88 Anaplastic carcinoma 4.264589e-02 2/10 163/9703
89 Carcinoma, Spindle-Cell 4.264589e-02 2/10 163/9703
90 Undifferentiated carcinoma 4.264589e-02 2/10 163/9703
91 Carcinomatosis 4.264589e-02 2/10 163/9703
102 Leukoencephalopathy 4.264589e-02 1/10 11/9703
107 Atrophic 4.264589e-02 1/10 10/9703
112 Carcinomatosis of peritoneal cavity 4.264589e-02 1/10 10/9703
160 Copper-Overload Cirrhosis 4.264589e-02 1/10 11/9703
41 Precursor B-Cell Lymphoblastic Leukemia-Lymphoma 4.401635e-02 1/10 12/9703
Digestive
Number of cTWAS Genes in Tissue Group: 32RGS14 gene(s) from the input list not found in DisGeNET CURATEDPOM121C gene(s) from the input list not found in DisGeNET CURATEDOAZ3 gene(s) from the input list not found in DisGeNET CURATEDADAM15 gene(s) from the input list not found in DisGeNET CURATEDZGLP1 gene(s) from the input list not found in DisGeNET CURATEDRNF186 gene(s) from the input list not found in DisGeNET CURATEDUBE2W gene(s) from the input list not found in DisGeNET CURATEDOSER1 gene(s) from the input list not found in DisGeNET CURATEDCASC3 gene(s) from the input list not found in DisGeNET CURATED Description FDR Ratio BgRatio
15 Ulcerative Colitis 5.781608e-05 5/23 63/9703
37 Inflammatory Bowel Diseases 1.144545e-04 4/23 35/9703
4 Rheumatoid Arthritis 3.234237e-02 4/23 174/9703
25 Enteritis 3.234237e-02 1/23 1/9703
148 Deep seated dermatophytosis 3.234237e-02 1/23 1/9703
157 Retinitis Pigmentosa 14 3.234237e-02 1/23 1/9703
161 Inflammatory Bowel Disease 10 3.234237e-02 1/23 1/9703
164 MICROVASCULAR COMPLICATIONS OF DIABETES, SUSCEPTIBILITY TO, 7 (finding) 3.234237e-02 1/23 1/9703
171 LEBER CONGENITAL AMAUROSIS 15 3.234237e-02 1/23 1/9703
172 CUTIS LAXA, AUTOSOMAL RECESSIVE, TYPE IB 3.234237e-02 1/23 1/9703
179 IMMUNODEFICIENCY 32A 3.234237e-02 1/23 1/9703
181 IMMUNODEFICIENCY 28 3.234237e-02 1/23 1/9703
182 IMMUNODEFICIENCY 32B 3.234237e-02 1/23 1/9703
184 MITOCHONDRIAL DNA DEPLETION SYNDROME 15 (HEPATOCEREBRAL TYPE) 3.234237e-02 1/23 1/9703
82 Variegate Porphyria 4.111635e-02 1/23 2/9703
99 Cutis Laxa, Autosomal Recessive, Type I 4.111635e-02 1/23 2/9703
116 Cutis laxa, recessive, type I 4.111635e-02 1/23 2/9703
159 Visceral myopathy familial external ophthalmoplegia 4.111635e-02 1/23 2/9703
160 Candidiasis, Familial, 2 4.111635e-02 1/23 2/9703
166 MITOCHONDRIAL DNA DEPLETION SYNDROME 5 (ENCEPHALOMYOPATHIC WITH OR WITHOUT METHYLMALONIC ACIDURIA) 4.111635e-02 1/23 2/9703
170 Porphyria, South African type 4.111635e-02 1/23 2/9703
186 Mitochondrial DNA Depletion Syndrome 1 4.111635e-02 1/23 2/9703Gene sets curated by Macarthur Lab
gene_set_dir <- "/project2/mstephens/wcrouse/gene_sets/"
gene_set_files <- c("gwascatalog.tsv",
                    "mgi_essential.tsv",
                    "core_essentials_hart.tsv",
                    "clinvar_path_likelypath.tsv",
                    "fda_approved_drug_targets.tsv")

for (group in names(df_group)){
  cat(paste0(group, "\n\n"))

  ctwas_genes_group <- df_group[[group]]$ctwas
  background_group <- df_group[[group]]$background

  cat(paste0("Number of cTWAS Genes in Tissue Group: ", length(ctwas_genes_group), "\n\n"))

  gene_sets <- lapply(gene_set_files, function(x){as.character(read.table(paste0(gene_set_dir, x))[,1])})
  names(gene_sets) <- sapply(gene_set_files, function(x){unlist(strsplit(x, "[.]"))[1]})

  gene_lists <- list(ctwas_genes_group=ctwas_genes_group)

  #genes in gene_sets filtered to ensure inclusion in background
  gene_sets <- lapply(gene_sets, function(x){x[x %in% background_group]})

  #hypergeometric test
  hyp_score <- data.frame()
  size <- c()
  ngenes <- c()

  for (i in 1:length(gene_sets)) {
    for (j in 1:length(gene_lists)){
      group1 <- length(gene_sets[[i]])
      group2 <- length(as.vector(gene_lists[[j]]))
      size <- c(size, group1)
      Overlap <- length(intersect(gene_sets[[i]],as.vector(gene_lists[[j]])))
      ngenes <- c(ngenes, Overlap)
      Total <- length(background_group)
      hyp_score[i,j] <- phyper(Overlap-1, group2, Total-group2, group1,lower.tail=F)
    }
  }
  rownames(hyp_score) <- names(gene_sets)
  colnames(hyp_score) <- names(gene_lists)

  #multiple testing correction
  hyp_score_padj <- apply(hyp_score,2, p.adjust, method="BH", n=(nrow(hyp_score)*ncol(hyp_score)))
  hyp_score_padj <- as.data.frame(hyp_score_padj)
  hyp_score_padj$gene_set <- rownames(hyp_score_padj)
  hyp_score_padj$nset <- size
  hyp_score_padj$ngenes <- ngenes
  hyp_score_padj$percent <- ngenes/size

  hyp_score_padj <- hyp_score_padj[order(hyp_score_padj$ctwas_genes),]
  colnames(hyp_score_padj)[1] <- "padj"
  hyp_score_padj <- hyp_score_padj[,c(2:5,1)]
  rownames(hyp_score_padj)<- NULL

  print(hyp_score_padj)

  cat("\n")
}
Adipose
Number of cTWAS Genes in Tissue Group: 17
gene_set nset ngenes percent padj
1 gwascatalog 4575 14 0.003060109 0.0004982032
2 mgi_essential 1715 5 0.002915452 0.1612476176
3 clinvar_path_likelypath 2136 4 0.001872659 0.3827256017
4 fda_approved_drug_targets 258 1 0.003875969 0.3827256017
5 core_essentials_hart 207 0 0.000000000 1.0000000000
Endocrine
Number of cTWAS Genes in Tissue Group: 22
gene_set nset ngenes percent padj
1 gwascatalog 5392 14 0.002596439 0.0302385
2 clinvar_path_likelypath 2486 6 0.002413516 0.3330133
3 mgi_essential 2020 4 0.001980198 0.5468197
4 core_essentials_hart 234 0 0.000000000 1.0000000
5 fda_approved_drug_targets 304 0 0.000000000 1.0000000
Cardiovascular
Number of cTWAS Genes in Tissue Group: 16
gene_set nset ngenes percent padj
1 gwascatalog 5192 9 0.001733436 0.1288534
2 mgi_essential 1971 5 0.002536783 0.1288534
3 fda_approved_drug_targets 287 2 0.006968641 0.1288534
4 clinvar_path_likelypath 2404 4 0.001663894 0.3357102
5 core_essentials_hart 242 0 0.000000000 1.0000000
CNS
Number of cTWAS Genes in Tissue Group: 29
gene_set nset ngenes percent padj
1 gwascatalog 5426 19 0.003501659 0.004639127
2 mgi_essential 2090 6 0.002870813 0.489011639
3 clinvar_path_likelypath 2530 5 0.001976285 0.669159936
4 fda_approved_drug_targets 316 1 0.003164557 0.669159936
5 core_essentials_hart 244 0 0.000000000 1.000000000
None
Number of cTWAS Genes in Tissue Group: 27
gene_set nset ngenes percent padj
1 gwascatalog 5631 18 0.003196590 0.004818173
2 mgi_essential 2145 8 0.003729604 0.040463504
3 clinvar_path_likelypath 2608 9 0.003450920 0.040463504
4 core_essentials_hart 255 1 0.003921569 0.443478275
5 fda_approved_drug_targets 323 0 0.000000000 1.000000000
Skin
Number of cTWAS Genes in Tissue Group: 17
gene_set nset ngenes percent padj
1 gwascatalog 5102 12 0.002352019 0.009826073
2 fda_approved_drug_targets 276 3 0.010869565 0.009826073
3 mgi_essential 1923 6 0.003120125 0.031907640
4 clinvar_path_likelypath 2341 4 0.001708672 0.371804161
5 core_essentials_hart 227 0 0.000000000 1.000000000
Blood or Immune
Number of cTWAS Genes in Tissue Group: 20
gene_set nset ngenes percent padj
1 gwascatalog 4760 11 0.002310924 0.1521885
2 fda_approved_drug_targets 255 2 0.007843137 0.1521885
3 mgi_essential 1774 4 0.002254791 0.3392836
4 clinvar_path_likelypath 2188 5 0.002285192 0.3392836
5 core_essentials_hart 217 0 0.000000000 1.0000000
Digestive
Number of cTWAS Genes in Tissue Group: 32
gene_set nset ngenes percent padj
1 gwascatalog 5396 23 0.004262417 0.0001503306
2 clinvar_path_likelypath 2489 9 0.003615910 0.1657457551
3 fda_approved_drug_targets 307 2 0.006514658 0.2266826568
4 mgi_essential 2053 6 0.002922552 0.3226070733
5 core_essentials_hart 243 0 0.000000000 1.0000000000Analysis of TWAS False Positives by Region
library(ggplot2)

pip_threshold <- 0.5

df_plot <- data.frame(Outcome=c("SNPs", "Genes", "Both", "Neither"), Frequency=rep(0,4))

for (i in 1:length(df)){
  gene_pips <- df[[i]]$gene_pips[df[[i]]$gene_pips$genename %in% df[[i]]$twas,,drop=F]
  gene_pips <- gene_pips[gene_pips$susie_pip < pip_threshold,,drop=F]

  region_pips <- df[[i]]$region_pips
  rownames(region_pips) <- region_pips$region

  gene_pips <- cbind(gene_pips, t(sapply(gene_pips$region_tag, function(x){unlist(region_pips[x,c("gene_pip", "snp_pip")])})))
  gene_pips$gene_pip <- gene_pips$gene_pip - gene_pips$susie_pip #subtract gene pip from region total to get combined pip for other genes in region

  df_plot$Frequency[df_plot$Outcome=="Neither"] <- df_plot$Frequency[df_plot$Outcome=="Neither"] + sum(gene_pips$gene_pip < 0.5 & gene_pips$snp_pip < 0.5)
  df_plot$Frequency[df_plot$Outcome=="Both"] <- df_plot$Frequency[df_plot$Outcome=="Both"] + sum(gene_pips$gene_pip > 0.5 & gene_pips$snp_pip > 0.5)
  df_plot$Frequency[df_plot$Outcome=="SNPs"] <- df_plot$Frequency[df_plot$Outcome=="SNPs"] + sum(gene_pips$gene_pip < 0.5 & gene_pips$snp_pip > 0.5)
  df_plot$Frequency[df_plot$Outcome=="Genes"] <- df_plot$Frequency[df_plot$Outcome=="Genes"] + sum(gene_pips$gene_pip > 0.5 & gene_pips$snp_pip < 0.5)
}

pie <- ggplot(df_plot, aes(x="", y=Frequency, fill=Outcome)) + geom_bar(width = 1, stat = "identity")
pie <- pie + coord_polar("y", start=0) + theme_minimal() + theme(axis.title.y=element_blank())
pie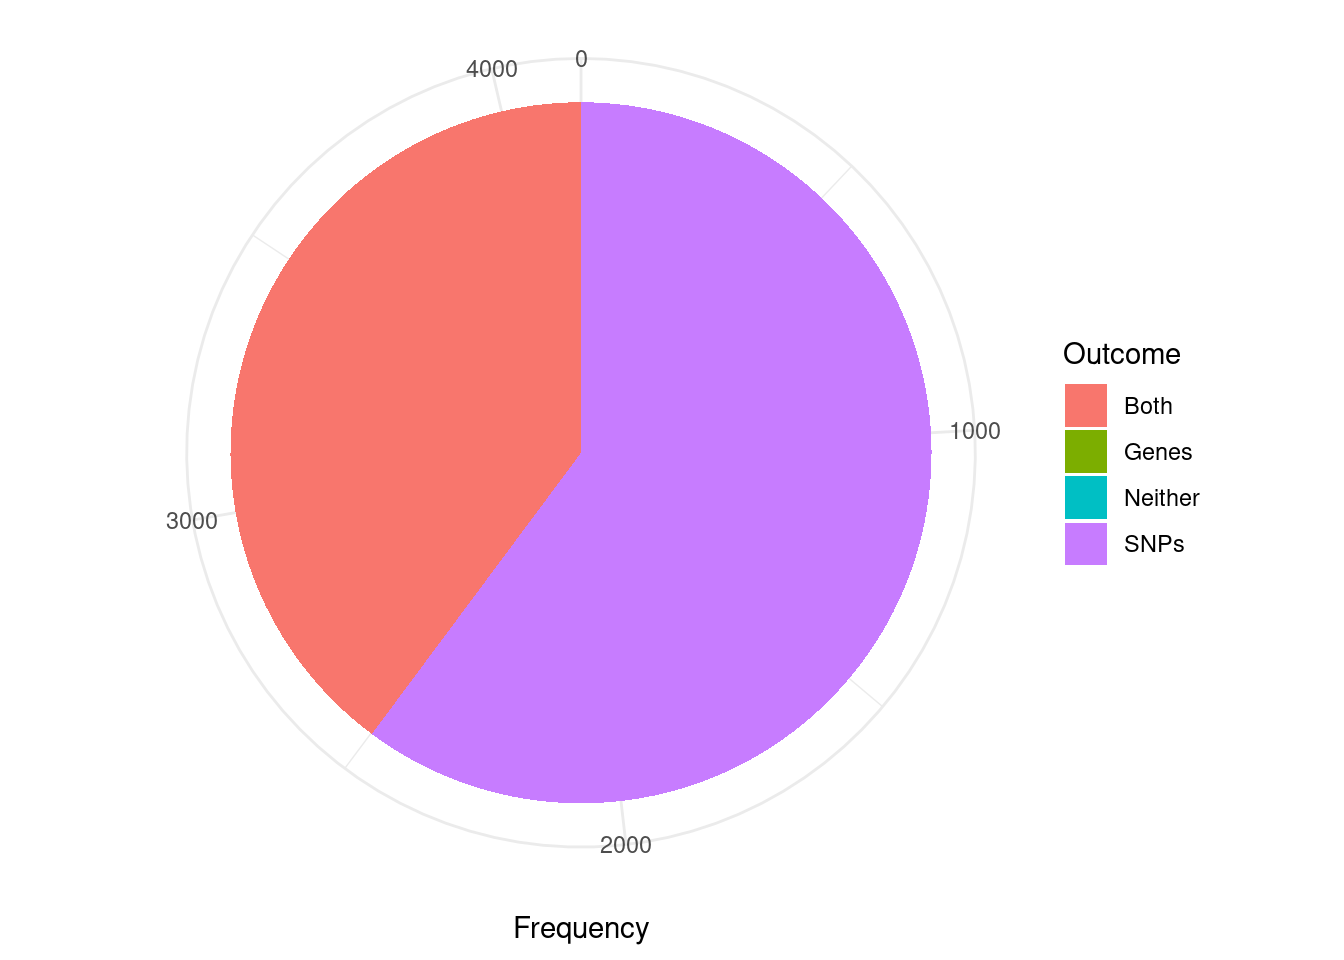
| Version | Author | Date |
|---|---|---|
| 397176f | wesleycrouse | 2022-06-10 |
Analysis of TWAS False Positives by Credible Set
cTWAS is using susie settings that mask credible sets consisting of variables with minimum pairwise correlations below a specified threshold. The default threshold is 0.5. I think this is intended to mask credible sets with “diffuse” support. As a consequence, many of the genes considered here (TWAS false positives; significant z score but low PIP) are not assigned to a credible set (have cs_index=0). For this reason, the first figure is not really appropriate for answering the question “are TWAS false positives due to SNPs or genes”.
The second figure includes only TWAS genes that are assigned to a reported causal set (i.e. they are in a “pure” causal set with high pairwise correlations). I think that this figure is closer to the intended analysis. However, it may be biased in some way because we have excluded many TWAS false positive genes that are in “impure” credible sets.
Some alternatives to these figures include the region-based analysis in the previous section; or re-analysis with lower/no minimum pairwise correlation threshold (“min_abs_corr” option in susie_get_cs) for reporting credible sets.
library(ggplot2)

####################
#using only genes assigned to a credible set

pip_threshold <- 0.5

df_plot <- data.frame(Outcome=c("SNPs", "Genes", "Both", "Neither"), Frequency=rep(0,4))

for (i in 1:length(df)){
  gene_pips <- df[[i]]$gene_pips[df[[i]]$gene_pips$genename %in% df[[i]]$twas,,drop=F]
  gene_pips <- gene_pips[gene_pips$susie_pip < pip_threshold,,drop=F]

  #exclude genes that are not assigned to a credible set, cs_index==0
  gene_pips <- gene_pips[as.numeric(sapply(gene_pips$region_cs_tag, function(x){rev(unlist(strsplit(x, "_")))[1]}))!=0,]

  region_cs_pips <- df[[i]]$region_cs_pips
  rownames(region_cs_pips) <- region_cs_pips$region_cs

  gene_pips <- cbind(gene_pips, t(sapply(gene_pips$region_cs_tag, function(x){unlist(region_cs_pips[x,c("gene_pip", "snp_pip")])})))
  gene_pips$gene_pip <- gene_pips$gene_pip - gene_pips$susie_pip #subtract gene pip from causal set total to get combined pip for other genes in causal set

  plot_cutoff <- 0.5

  df_plot$Frequency[df_plot$Outcome=="Neither"] <- df_plot$Frequency[df_plot$Outcome=="Neither"] + sum(gene_pips$gene_pip < plot_cutoff & gene_pips$snp_pip < plot_cutoff)
  df_plot$Frequency[df_plot$Outcome=="Both"] <- df_plot$Frequency[df_plot$Outcome=="Both"] + sum(gene_pips$gene_pip > plot_cutoff & gene_pips$snp_pip > plot_cutoff)
  df_plot$Frequency[df_plot$Outcome=="SNPs"] <- df_plot$Frequency[df_plot$Outcome=="SNPs"] + sum(gene_pips$gene_pip < plot_cutoff & gene_pips$snp_pip > plot_cutoff)
  df_plot$Frequency[df_plot$Outcome=="Genes"] <- df_plot$Frequency[df_plot$Outcome=="Genes"] + sum(gene_pips$gene_pip > plot_cutoff & gene_pips$snp_pip < plot_cutoff)
}

pie <- ggplot(df_plot, aes(x="", y=Frequency, fill=Outcome)) + geom_bar(width = 1, stat = "identity")
pie <- pie + coord_polar("y", start=0) + theme_minimal() + theme(axis.title.y=element_blank())
pie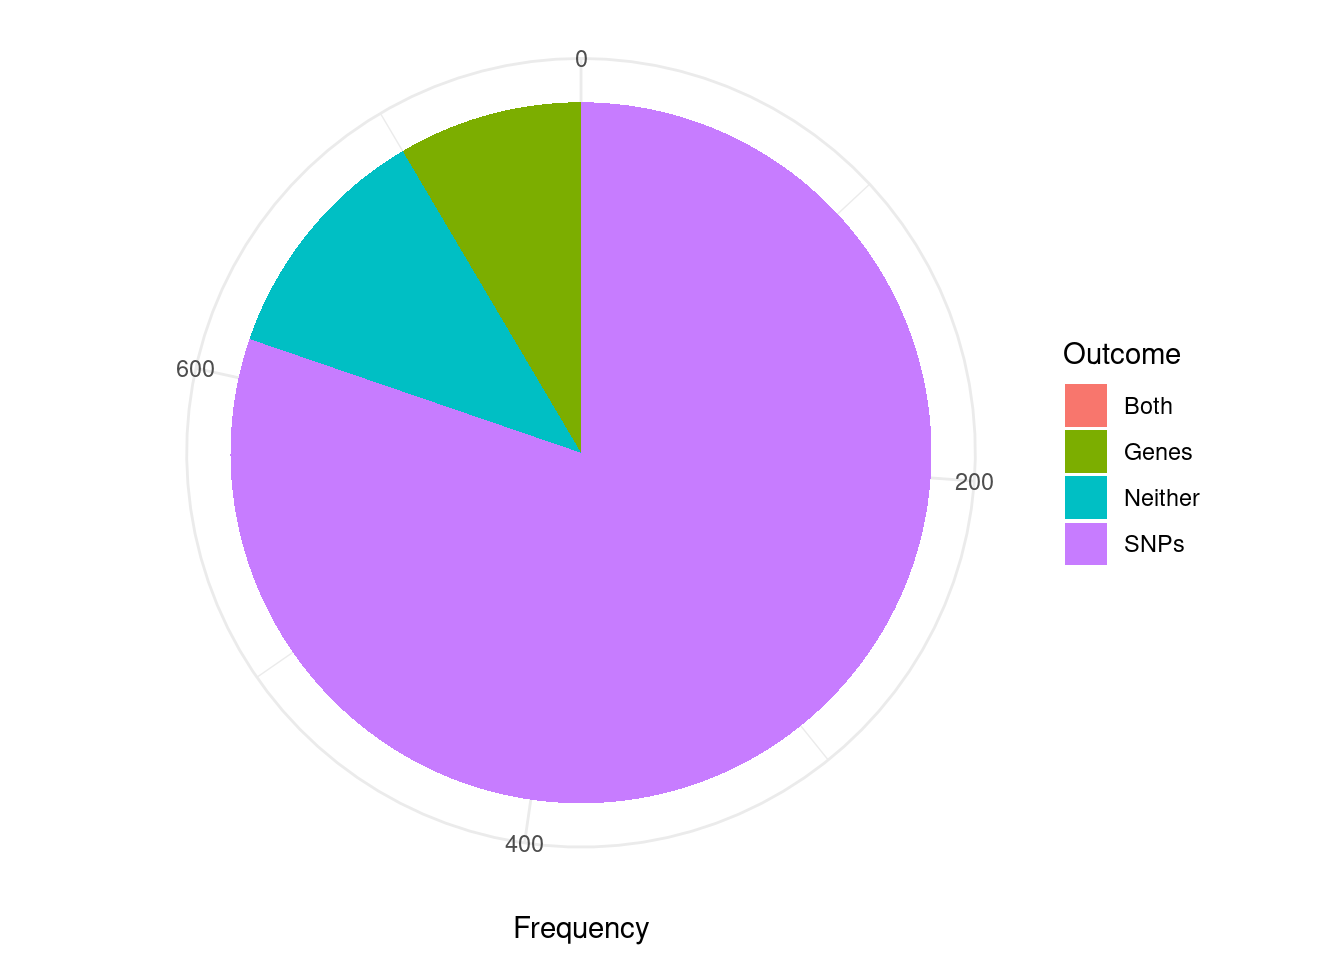
| Version | Author | Date |
|---|---|---|
| 397176f | wesleycrouse | 2022-06-10 |
cTWAS genes without genome-wide significant SNP nearby
novel_genes <- data.frame(genename=as.character(), weight=as.character(), susie_pip=as.numeric(), snp_maxz=as.numeric())

for (i in 1:length(df)){
  gene_pips <- df[[i]]$gene_pips[df[[i]]$gene_pips$genename %in% df[[i]]$ctwas,,drop=F]

  region_pips <- df[[i]]$region_pips
  rownames(region_pips) <- region_pips$region

  gene_pips <- cbind(gene_pips, sapply(gene_pips$region_tag, function(x){region_pips[x,"snp_maxz"]}))
  names(gene_pips)[ncol(gene_pips)] <- "snp_maxz"

  if (nrow(gene_pips)>0){
    gene_pips$weight <- names(df)[i]
    gene_pips <- gene_pips[gene_pips$snp_maxz < qnorm(1-(5E-8/2), lower=T),c("genename", "weight", "susie_pip", "snp_maxz")]

    novel_genes <- rbind(novel_genes, gene_pips)
  }
}

novel_genes_summary <- data.frame(genename=unique(novel_genes$genename))
novel_genes_summary$nweights <- sapply(novel_genes_summary$genename, function(x){length(novel_genes$weight[novel_genes$genename==x])})
novel_genes_summary$weights <- sapply(novel_genes_summary$genename, function(x){paste(novel_genes$weight[novel_genes$genename==x],collapse=", ")})

novel_genes_summary <- novel_genes_summary[order(-novel_genes_summary$nweights),]
novel_genes_summary[,c("genename","nweights")]
genename nweights
1 LSP1 18
7 CCL20 9
6 EFEMP2 8
3 TYMP 6
2 CDH24 4
4 NPEPPS 3
5 ITGAL 3
19 RASA2 3
9 PRKD2 2
21 TMEM151B 2
8 RAB29 1
10 CD6 1
11 IFT172 1
12 MAPK13 1
13 CPT1C 1
14 SH2D3A 1
15 HFE 1
16 POM121C 1
17 UBE2W 1
18 HOXD1 1
20 TULP1 1
22 SLC2A3 1
23 CRTC3 1
24 CNKSR1 1
25 PSMA6 1
26 CRK 1
27 ANKRD55 1
28 TFAM 1
29 SIX5 1
30 SMPD1 1
31 GPR132 1
32 IRF3 1
33 CCR5 1
34 CPEB4 1
35 C10orf105 1
36 NPIPB3 1
37 BIK 1Tissue-specificity for cTWAS genes
gene_pips_by_weight <- data.frame(genename=as.character(ctwas_genes))

for (i in 1:length(df)){
  gene_pips <- df[[i]]$gene_pips
  gene_pips <- gene_pips[match(ctwas_genes, gene_pips$genename),,drop=F]

  gene_pips_by_weight <- cbind(gene_pips_by_weight, gene_pips$susie_pip)
  names(gene_pips_by_weight)[ncol(gene_pips_by_weight)] <- names(df)[i]
}

gene_pips_by_weight <- as.matrix(gene_pips_by_weight[,-1])
rownames(gene_pips_by_weight) <- ctwas_genes

#handing missing values
gene_pips_by_weight_bkup <- gene_pips_by_weight
gene_pips_by_weight[is.na(gene_pips_by_weight)] <- 0

#number of tissues with PIP>0.5 for cTWAS genes
ctwas_frequency <- rowSums(gene_pips_by_weight>0.5)
hist(ctwas_frequency, col="grey", breaks=0:max(ctwas_frequency), xlim=c(0,ncol(gene_pips_by_weight)),
     xlab="Number of Tissues with PIP>0.5",
     ylab="Number of cTWAS Genes",
     main="Tissue Specificity for cTWAS Genes")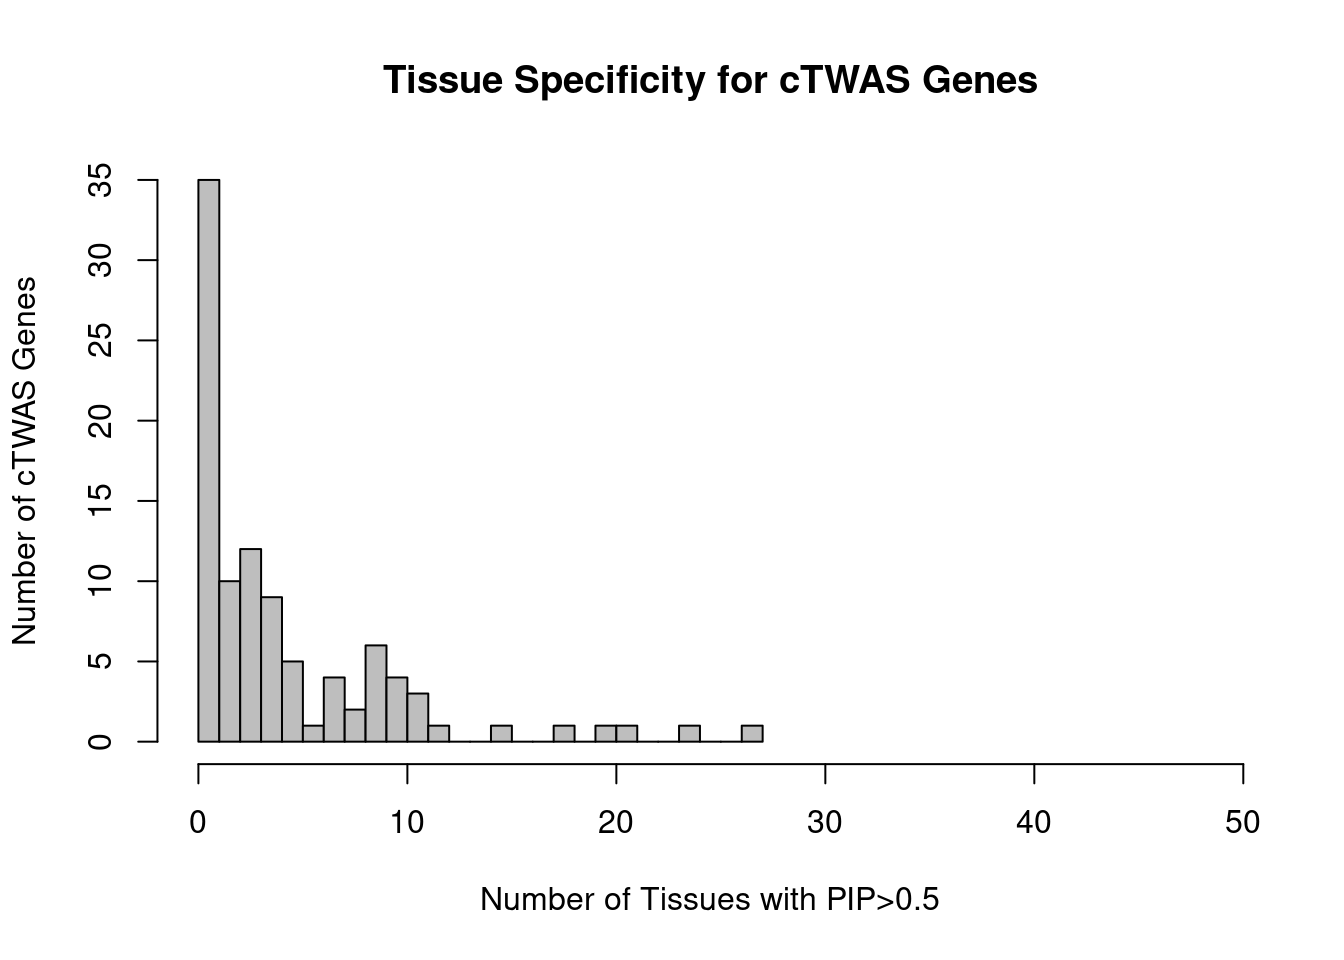
| Version | Author | Date |
|---|---|---|
| 397176f | wesleycrouse | 2022-06-10 |
#heatmap of gene PIPs
cluster_ctwas_genes <- hclust(dist(gene_pips_by_weight))
cluster_ctwas_weights <- hclust(dist(t(gene_pips_by_weight)))

plot(cluster_ctwas_weights, cex=0.6)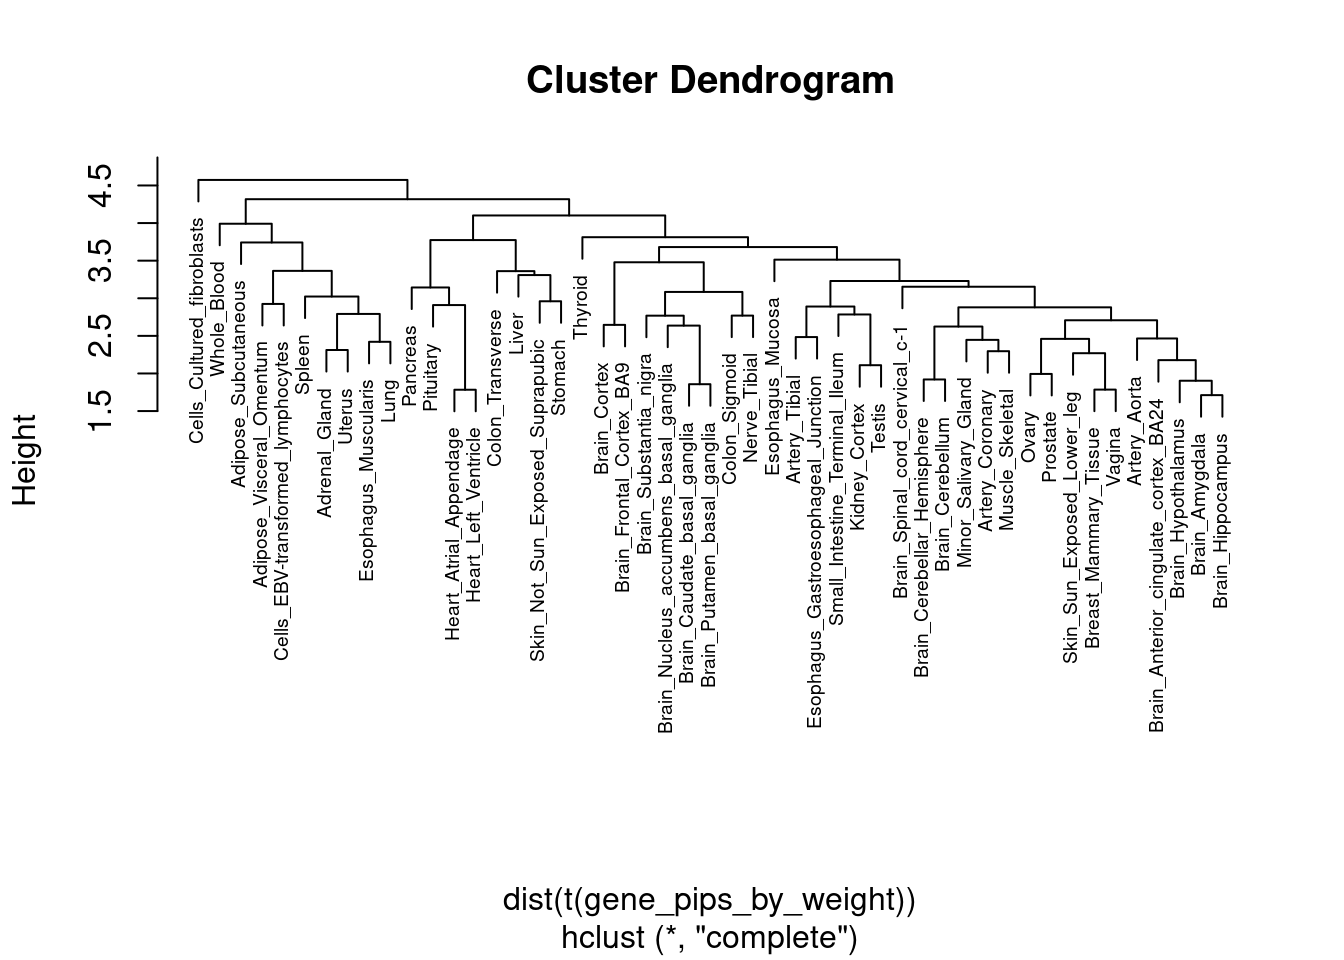
| Version | Author | Date |
|---|---|---|
| 397176f | wesleycrouse | 2022-06-10 |
plot(cluster_ctwas_genes, cex=0.6, labels=F)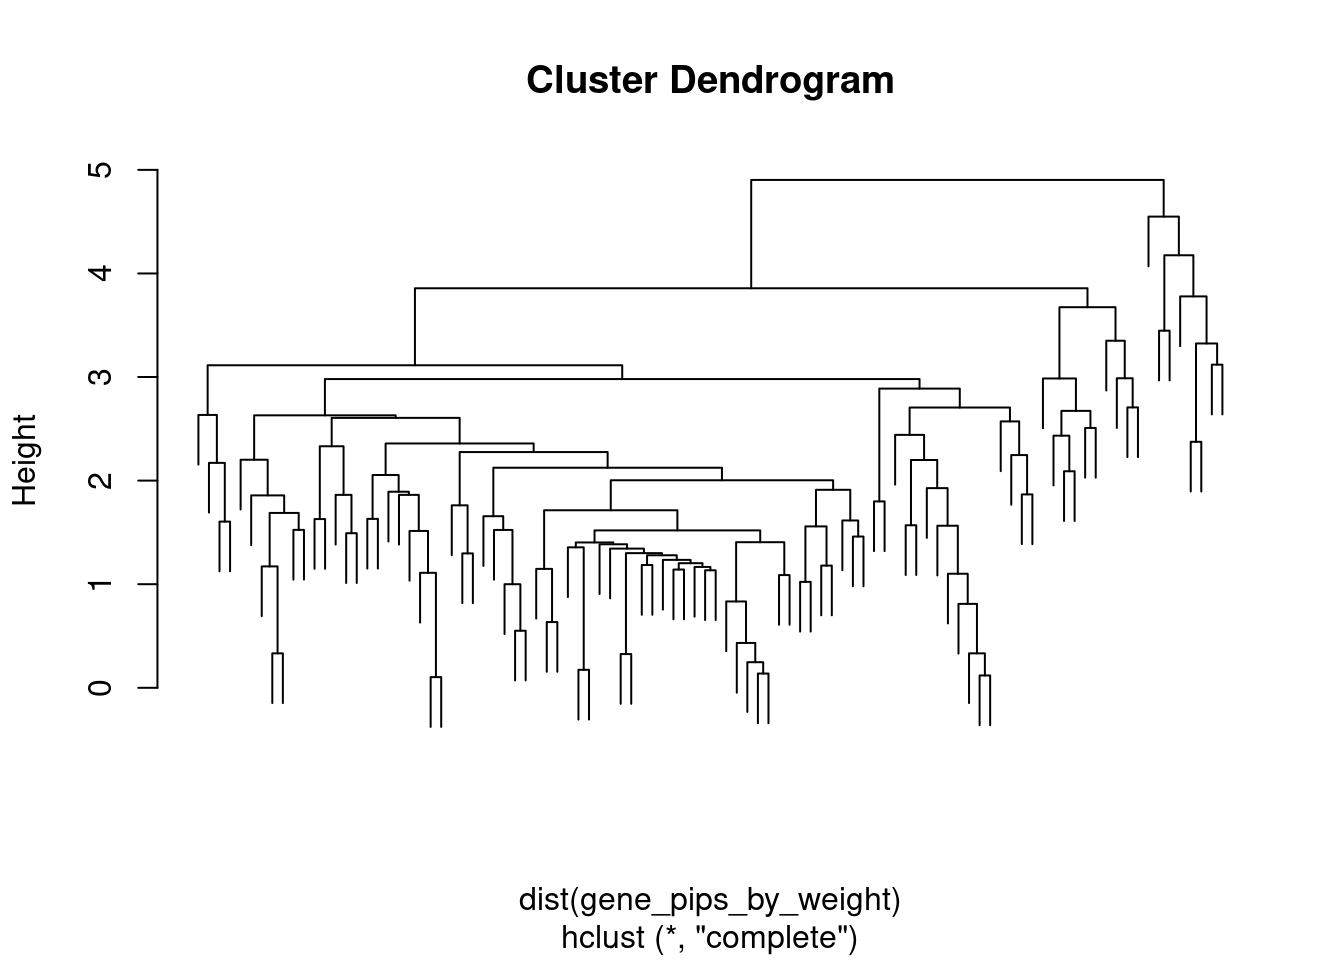
| Version | Author | Date |
|---|---|---|
| 397176f | wesleycrouse | 2022-06-10 |
par(mar=c(14.1, 4.1, 4.1, 2.1))

image(t(gene_pips_by_weight[rev(cluster_ctwas_genes$order),rev(cluster_ctwas_weights$order)]),
      axes=F)
mtext(text=colnames(gene_pips_by_weight)[cluster_ctwas_weights$order], side=1, line=0.3, at=seq(0,1,1/(ncol(gene_pips_by_weight)-1)), las=2, cex=0.8)
mtext(text=rownames(gene_pips_by_weight)[cluster_ctwas_genes$order], side=2, line=0.3, at=seq(0,1,1/(nrow(gene_pips_by_weight)-1)), las=1, cex=0.4)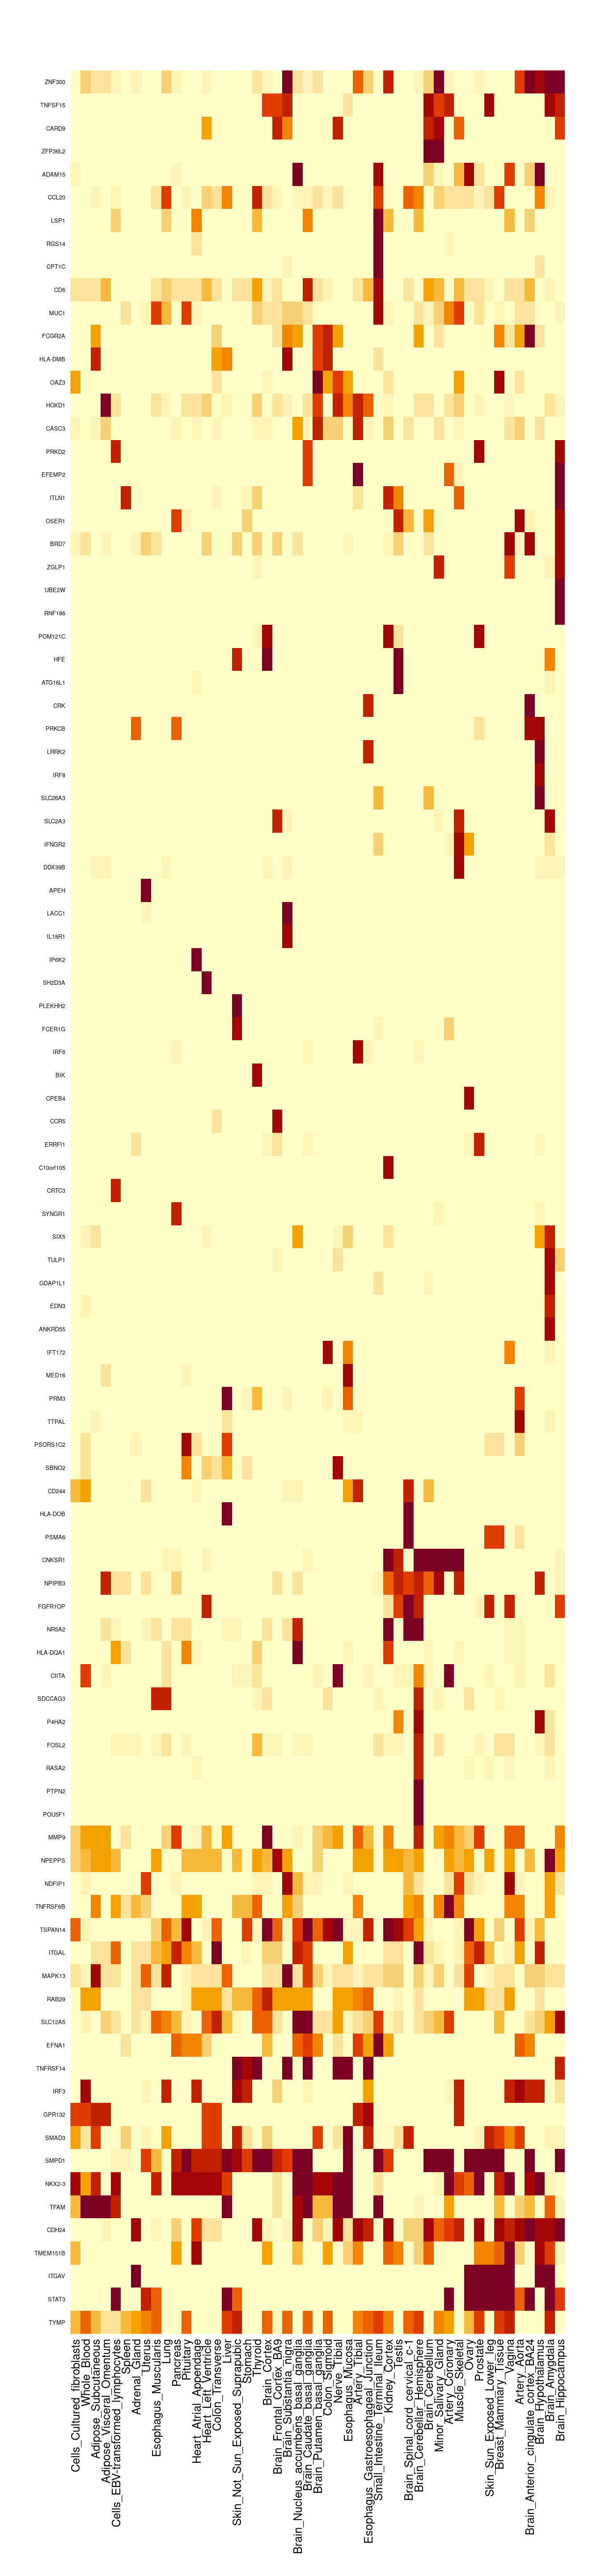
| Version | Author | Date |
|---|---|---|
| 397176f | wesleycrouse | 2022-06-10 |
cTWAS genes with highest proportion of total PIP on a single tissue
#genes with highest proportion of PIP on a single tissue
gene_pips_proportion <- gene_pips_by_weight/rowSums(gene_pips_by_weight)

proportion_table <- data.frame(genename=as.character(rownames(gene_pips_proportion)))
proportion_table$max_pip_prop <- apply(gene_pips_proportion,1,max)
proportion_table$max_weight <- colnames(gene_pips_proportion)[apply(gene_pips_proportion,1,which.max)]

proportion_table[order(-proportion_table$max_pip_prop),]
genename max_pip_prop max_weight
84 PRM3 1.00000000 Testis
72 PSORS1C2 0.99885694 Minor_Salivary_Gland
52 RNF186 0.98868018 Colon_Transverse
46 POU5F1 0.95958877 Cells_Cultured_fibroblasts
80 HLA-DOB 0.95130741 Skin_Sun_Exposed_Lower_leg
30 TTPAL 0.86243562 Brain_Cerebellum
63 SBNO2 0.85536596 Esophagus_Mucosa
48 PTPN2 0.80282195 Cells_Cultured_fibroblasts
2 NR5A2 0.80114489 Adipose_Subcutaneous
20 SYNGR1 0.77559069 Artery_Aorta
55 UBE2W 0.75982553 Colon_Transverse
24 GDAP1L1 0.75571944 Artery_Tibial
62 CD244 0.71158736 Esophagus_Mucosa
71 EDN3 0.64941432 Lung
83 SIX5 0.64222471 Stomach
98 BIK 0.62817229 Whole_Blood
95 CPEB4 0.55225488 Whole_Blood
43 FCER1G 0.54874432 Brain_Substantia_nigra
5 HLA-DQA1 0.54533753 Adipose_Subcutaneous
79 P4HA2 0.51104285 Skin_Not_Sun_Exposed_Suprapubic
90 SMAD3 0.50317856 Thyroid
81 ANKRD55 0.49177315 Small_Intestine_Terminal_Ileum
33 IFT172 0.48818562 Brain_Frontal_Cortex_BA9
85 MED16 0.47896250 Testis
16 SDCCAG3 0.47611711 Adipose_Visceral_Omentum
67 TMEM151B 0.46541823 Heart_Left_Ventricle
6 FGFR1OP 0.46117977 Adipose_Subcutaneous
93 CCR5 0.44841818 Whole_Blood
73 CRTC3 0.43464171 Muscle_Skeletal
54 POM121C 0.40823368 Colon_Transverse
88 SMPD1 0.40369451 Thyroid
69 DDX39B 0.36706341 Liver
51 SH2D3A 0.35496475 Cells_EBV-transformed_lymphocytes
27 IRF6 0.34612596 Brain_Caudate_basal_ganglia
42 APEH 0.34039702 Brain_Spinal_cord_cervical_c-1
92 ERRFI1 0.33940151 Whole_Blood
75 CNKSR1 0.32667368 Pancreas
4 ATG16L1 0.31635542 Colon_Transverse
97 NPIPB3 0.29831631 Whole_Blood
76 PSMA6 0.28597379 Pancreas
65 TULP1 0.28122230 Esophagus_Muscularis
58 FOSL2 0.27993429 Skin_Not_Sun_Exposed_Suprapubic
10 CIITA 0.26725151 Adipose_Subcutaneous
39 IL18R1 0.26125614 Brain_Nucleus_accumbens_basal_ganglia
21 IP6K2 0.25927145 Artery_Coronary
41 PLEKHH2 0.25189097 Brain_Spinal_cord_cervical_c-1
35 TSPAN14 0.25162731 Cells_Cultured_fibroblasts
96 C10orf105 0.23620072 Whole_Blood
19 ITGAL 0.23532126 Cells_Cultured_fibroblasts
87 NKX2-3 0.22314256 Thyroid
78 CRK 0.21579609 Prostate
50 TNFRSF6B 0.21228714 Cells_Cultured_fibroblasts
60 RASA2 0.20498692 Stomach
49 MMP9 0.19932676 Cells_Cultured_fibroblasts
74 LRRK2 0.19497960 Nerve_Tibial
36 LACC1 0.19065414 Brain_Frontal_Cortex_BA9
53 HFE 0.17588142 Colon_Transverse
40 PRKCB 0.17093942 Brain_Nucleus_accumbens_basal_ganglia
45 NDFIP1 0.16649425 Cells_Cultured_fibroblasts
37 EFNA1 0.16017741 Esophagus_Mucosa
56 IRF8 0.15935403 Stomach
18 SLC12A5 0.15621855 Brain_Putamen_basal_ganglia
70 SLC26A3 0.15457605 Liver
66 ITGAV 0.14130250 Heart_Atrial_Appendage
9 CDH24 0.13863526 Nerve_Tibial
17 NPEPPS 0.13639755 Cells_Cultured_fibroblasts
12 TNFRSF14 0.13515533 Adipose_Visceral_Omentum
32 CD6 0.13251639 Brain_Cortex
57 IFNGR2 0.13214170 Stomach
34 MAPK13 0.13007802 Brain_Frontal_Cortex_BA9
64 OSER1 0.12636175 Esophagus_Mucosa
7 CARD9 0.11772782 Spleen
47 STAT3 0.11685243 Whole_Blood
86 HLA-DMB 0.10821488 Thyroid
31 FCGR2A 0.10766168 Brain_Nucleus_accumbens_basal_ganglia
91 IRF3 0.10700146 Thyroid
26 RAB29 0.10277979 Brain_Anterior_cingulate_cortex_BA24
68 SLC2A3 0.09811261 Heart_Atrial_Appendage
89 GPR132 0.09680589 Thyroid
77 ITLN1 0.09472400 Pituitary
13 MUC1 0.09160045 Brain_Amygdala
3 ZFP36L2 0.08862925 Spleen
11 TYMP 0.08618924 Esophagus_Mucosa
82 TFAM 0.08514381 Small_Intestine_Terminal_Ileum
44 CPT1C 0.08076325 Brain_Substantia_nigra
38 CASC3 0.07970885 Esophagus_Mucosa
61 ZGLP1 0.07870285 Esophagus_Gastroesophageal_Junction
15 TNFSF15 0.07546612 Esophagus_Muscularis
25 CCL20 0.07449482 Brain_Nucleus_accumbens_basal_ganglia
23 BRD7 0.07309303 Whole_Blood
29 PRKD2 0.07221276 Colon_Transverse
59 HOXD1 0.06949920 Esophagus_Gastroesophageal_Junction
28 OAZ3 0.06819868 Nerve_Tibial
22 EFEMP2 0.05239241 Esophagus_Gastroesophageal_Junction
1 ADAM15 0.05116376 Cells_Cultured_fibroblasts
94 ZNF300 0.04765344 Whole_Blood
8 LSP1 0.04262846 Esophagus_Muscularis
14 RGS14 0.03896629 Uterussave.image("workspace2.RData")Genes nearby and nearest to GWAS peaks
#####load positions for all genes on autosomes in ENSEMBL, subset to only protein coding and lncRNA with non-missing HGNC symbol
# library(biomaRt)
#
# ensembl <- useEnsembl(biomart="ENSEMBL_MART_ENSEMBL", dataset="hsapiens_gene_ensembl")
# G_list <- getBM(filters= "chromosome_name", attributes= c("hgnc_symbol","chromosome_name","start_position","end_position","gene_biotype", "ensembl_gene_id"), values=1:22, mart=ensembl)
#
# save(G_list, file=paste0("G_list_", trait_id, ".RData"))
load(paste0("G_list_", trait_id, ".RData"))

G_list <- G_list[G_list$gene_biotype %in% c("protein_coding"),]
G_list$hgnc_symbol[G_list$hgnc_symbol==""] <- "-"

#####load z scores from the analysis and add positions from the LD reference
# results_dir <- results_dirs[1]
# load(paste0(results_dir, "/", analysis_id, "_expr_z_snp.Rd"))
#
# LDR_dir <- "/project2/mstephens/wcrouse/UKB_LDR_0.1/"
# LDR_files <- list.files(LDR_dir)
# LDR_files <- LDR_files[grep(".Rvar" ,LDR_files)]
#
# z_snp$chrom <- as.integer(NA)
# z_snp$pos <- as.integer(NA)
#
# for (i in 1:length(LDR_files)){
#   print(i)
#
#   LDR_info <- read.table(paste0(LDR_dir, LDR_files[i]), header=T)
#   z_snp_index <- which(z_snp$id %in% LDR_info$id)
#   z_snp[z_snp_index,c("chrom", "pos")] <- t(sapply(z_snp_index, function(x){unlist(LDR_info[match(z_snp$id[x], LDR_info$id),c("chrom", "pos")])}))
# }
#
# z_snp <- z_snp[,c("id", "z", "chrom","pos")]
# save(z_snp, file=paste0("z_snp_pos_", trait_id, ".RData"))
load(paste0("z_snp_pos_", trait_id, ".RData"))

####################
#identify genes within 500kb of genome-wide significant variant ("nearby")
G_list$nearby <- NA

window_size <- 500000

for (chr in 1:22){
  #index genes on chromosome
  G_list_index <- which(G_list$chromosome_name==chr)

  #subset z_snp to chromosome, then subset to significant genome-wide significant variants
  z_snp_chr <- z_snp[z_snp$chrom==chr,,drop=F]
  z_snp_chr <- z_snp_chr[abs(z_snp_chr$z)>qnorm(1-(5E-8/2), lower=T),,drop=F]

  #iterate over genes on chromsome and check if a genome-wide significant SNP is within the window
  for (i in G_list_index){
    window_start <- G_list$start_position[i] - window_size
    window_end <- G_list$end_position[i] + window_size
    G_list$nearby[i] <- any(z_snp_chr$pos>=window_start & z_snp_chr$pos<=window_end)
  }
}

####################
#identify genes that are nearest to lead genome-wide significant variant ("nearest")
G_list$nearest <- F
G_list$distance <- Inf
G_list$which_nearest <- NA

window_size <- 500000

n_peaks <- 0

for (chr in 1:22){
  #index genes on chromosome
  G_list_index <- which(G_list$chromosome_name==chr & G_list$gene_biotype=="protein_coding")

  #subset z_snp to chromosome, then subset to significant genome-wide significant variants
  z_snp_chr <- z_snp[z_snp$chrom==chr,,drop=F]
  z_snp_chr <- z_snp_chr[abs(z_snp_chr$z)>qnorm(1-(5E-8/2), lower=T),,drop=F]

  while (nrow(z_snp_chr)>0){
    n_peaks <- n_peaks + 1

    lead_index <- which.max(abs(z_snp_chr$z))
    lead_position <- z_snp_chr$pos[lead_index]

    distances <- sapply(G_list_index, function(i){
      if (lead_position >= G_list$start_position[i] & lead_position <= G_list$end_position[i]){
        distance <- 0
      } else {
        distance <- min(abs(G_list$start_position[i] - lead_position), abs(G_list$end_position[i] - lead_position))
      }
      distance
    })

    min_distance <- min(distances)

    G_list$nearest[G_list_index[distances==min_distance]] <- T

    nearest_genes <- paste0(G_list$hgnc_symbol[G_list_index[distances==min_distance]], collapse=", ")

    update_index <- which(G_list$distance[G_list_index] > distances)
    G_list$distance[G_list_index][update_index] <- distances[update_index]
    G_list$which_nearest[G_list_index][update_index] <- nearest_genes

    window_start <- lead_position - window_size
    window_end <- lead_position + window_size
    z_snp_chr <- z_snp_chr[!(z_snp_chr$pos>=window_start & z_snp_chr$pos<=window_end),,drop=F]
  }
}

G_list$distance[G_list$distance==Inf] <- NA

#report number of GWAS peaks
sum(n_peaks)
[1] 131Enrichment analysis using known IBD genes from ABC paper
known_genes <- data.table::fread("nasser_2021_ABC_IBD_genes.txt")
known_genes <- unique(known_genes$KnownGene)

# dbs <- c("GO_Biological_Process_2021")
# GO_enrichment <- enrichr(known_genes, dbs)
#
# for (db in dbs){
#   cat(paste0(db, "\n\n"))
#   enrich_results <- GO_enrichment[[db]]
#   enrich_results <- enrich_results[enrich_results$Adjusted.P.value<0.05,c("Term", "Overlap", "Adjusted.P.value", "Genes")]
#   print(enrich_results)
#   print(plotEnrich(GO_enrichment[[db]]))
# }
#
# save(enrich_results, file="ABC_IBD_genes_enrichment.RData")
# write.csv(enrich_results, file="ABC_IBD_genes_enrichment.csv")

enrich_results <- as.data.frame(data.table::fread("ABC_IBD_genes_enrichment.csv"))

#report number of known IBD genes in annotations
length(known_genes)
[1] 26Summary table for selected tissue groups
#mapping genename to ensembl
genename_mapping <- data.frame(genename=as.character(), ensembl_id=as.character(), weight=as.character())

for (i in 1:length(results_dirs)){
  results_dir <- results_dirs[i]
  weight <- rev(unlist(strsplit(results_dir, "/")))[1]
  analysis_id <- paste(trait_id, weight, sep="_")

  sqlite <- RSQLite::dbDriver("SQLite")
  db = RSQLite::dbConnect(sqlite, paste0("/project2/mstephens/wcrouse/predictdb_nolnc/mashr_", weight, ".db"))
  query <- function(...) RSQLite::dbGetQuery(db, ...)
  gene_info <- query("select gene, genename, gene_type from extra")
  RSQLite::dbDisconnect(db)

  genename_mapping <- rbind(genename_mapping, cbind(gene_info[,c("gene","genename")],weight))
}

genename_mapping <- genename_mapping[,c("gene","genename"),drop=F]
genename_mapping <- genename_mapping[!duplicated(genename_mapping),]
selected_groups <- c("Blood or Immune", "Digestive")
selected_genes <- unique(unlist(sapply(df_group[selected_groups], function(x){x$ctwas})))
weight_groups <- weight_groups[order(weight_groups$group),]
selected_weights <- weight_groups$weight[weight_groups$group %in% selected_groups]
gene_pips_by_weight <- gene_pips_by_weight_bkup
results_table <- as.data.frame(round(gene_pips_by_weight[selected_genes,selected_weights],3))
results_table$n_discovered <- apply(results_table>0.8,1,sum,na.rm=T)
results_table$n_imputed <- apply(results_table, 1, function(x){sum(!is.na(x))-1})
results_table$ensembl_gene_id <- genename_mapping$gene[sapply(rownames(results_table), match, table=genename_mapping$genename)]
results_table$ensembl_gene_id <- sapply(results_table$ensembl_gene_id, function(x){unlist(strsplit(x, "[.]"))[1]})
results_table <- cbind(results_table, G_list[sapply(results_table$ensembl_gene_id, match, table=G_list$ensembl_gene_id),c("chromosome_name","start_position","end_position","nearby","nearest","distance","which_nearest")])
results_table$known <- rownames(results_table) %in% known_genes
load("group_enrichment_results.RData")
group_enrichment_results$group <- as.character(group_enrichment_results$group)
group_enrichment_results$db <- as.character(group_enrichment_results$db)
group_enrichment_results <- group_enrichment_results[group_enrichment_results$group %in% selected_groups,,drop=F]
results_table$enriched_terms <- sapply(rownames(results_table), function(x){paste(group_enrichment_results$Term[grep(x, group_enrichment_results$Genes)],collapse="; ")})
write.csv(results_table, file=paste0("summary_table_inflammatory_bowel_disease_nolnc.csv"))Overlap of enrichment analysis
#collect GO terms for selected genes
db <- "GO_Biological_Process_2021"
GO_enrichment <- enrichr(selected_genes, db)
Uploading data to Enrichr... Done.
Querying GO_Biological_Process_2021... Done.
Parsing results... Done.enrich_results_selected_genes <- GO_enrichment[[db]]
load("ABC_IBD_genes_enrichment.RData")
enrich_results_known_genes <- enrich_results
overlap_table <- as.data.frame(matrix(F, nrow(enrich_results_known_genes), length(selected_genes)))
overlap_table <- cbind(enrich_results_known_genes$Term, overlap_table)
colnames(overlap_table) <- c("Term", selected_genes)
for (i in 1:nrow(overlap_table)){
Term <- overlap_table$Term[i]
if (Term %in% enrich_results_selected_genes$Term){
Term_genes <- enrich_results_selected_genes$Genes[enrich_results_selected_genes$Term==Term]
overlap_table[i, unlist(strsplit(Term_genes, ";"))] <- T
}
}
write.csv(overlap_table, file="GO_overlap_inflammatory_bowel_disease_nolnc.csv")Results and figures for the paper
Gene expression explains a small proportion of heritability
Note that the published MESC results in Yao et al. analyzed the same traits from Finucane 2015, which used ulcerative colitis summary statistics from Jostin’s 2012. We used more recent results from de Lange 2017. MESC also used prediction models from GTEx v7 while we used prediction models from GTEx v8.
Trend lines are fit with (red) and without (blue) an intercept.
library(ggrepel)

mesc_results <- as.data.frame(readxl::read_xlsx("MESC_published_results.xlsx", sheet="Table S4", skip=1))
mesc_results <- mesc_results[mesc_results$Trait %in% "Ulcerative Colitis",]
rownames(mesc_results) <- mesc_results$`Expression score tissue`
mesc_results <- mesc_results[sapply(selected_weights, function(x){paste(unlist(strsplit(x,"_")),collapse=" ")}),]


output$pve_med <- output$pve_g / (output$pve_g + output$pve_s)
rownames(output) <- output$weight
df_plot <- output[selected_weights,]

df_plot <- data.frame(tissue=as.character(mesc_results$`Expression score tissue`),  mesc=as.numeric(mesc_results$`h2med/h2g`), ctwas=(df_plot$pve_med))

p <- ggplot(df_plot, aes(mesc, ctwas, label = tissue)) + geom_point(color = "blue", size=3)
p <- p + geom_text_repel() + labs(title = "Heritability Explained by Gene Expression in Tissues") + ylab("(Gene PVE) / (Total PVE) using cTWAS") + xlab("(h2med) / (h2g) using MESC")
p <- p + geom_abline(slope=1, intercept=0, linetype=3)
p <- p + xlim(0,0.2) + ylim(0,0.2)

fit <- lm(ctwas~0+mesc, data=df_plot)
p <- p + geom_abline(slope=summary(fit)$coefficients["mesc","Estimate"], intercept=0, linetype=2, color="blue")

fit <- lm(ctwas~mesc, data=df_plot)
p <- p + geom_abline(slope=summary(fit)$coefficients["mesc","Estimate"], intercept=summary(fit)$coefficients["(Intercept)","Estimate"], linetype=3, color="red")

p <- p + theme_bw()

p

#report correlation between cTWAS and MESC
cor(df_plot$mesc, df_plot$ctwas)
cTWAS finds fewer genes than TWAS
Trend lines are fit with (red) and without (blue) an intercept.
library(ggrepel)

df_plot <- output
#df_plot <- df_plot[selected_weights,,drop=F]
df_plot$tissue <- sapply(df_plot$weight, function(x){paste(unlist(strsplit(x,"_")),collapse=" ")})

p <- ggplot(df_plot, aes(n_twas, n_ctwas, label = tissue)) + geom_point(color = "blue", size=3)
p <- p + geom_text_repel(size=3) + labs(title = "Number of Genes Discovered using cTWAS and TWAS by Tissue") + ylab("Number of cTWAS genes") + xlab("Number of TWAS genes")
p <- p + scale_y_continuous(breaks=seq(0,max(df_plot$n_ctwas),2))
p <- p + scale_x_continuous(breaks=seq(0,max(df_plot$n_twas),5))
p <- p + theme_bw()

fit <- lm(n_ctwas~0+n_twas, data=df_plot)
p <- p + geom_abline(slope=summary(fit)$coefficients["n_twas","Estimate"], intercept=0, linetype=2, color="blue")

p
Warning: ggrepel: 2 unlabeled data points (too many overlaps). Consider increasing max.overlaps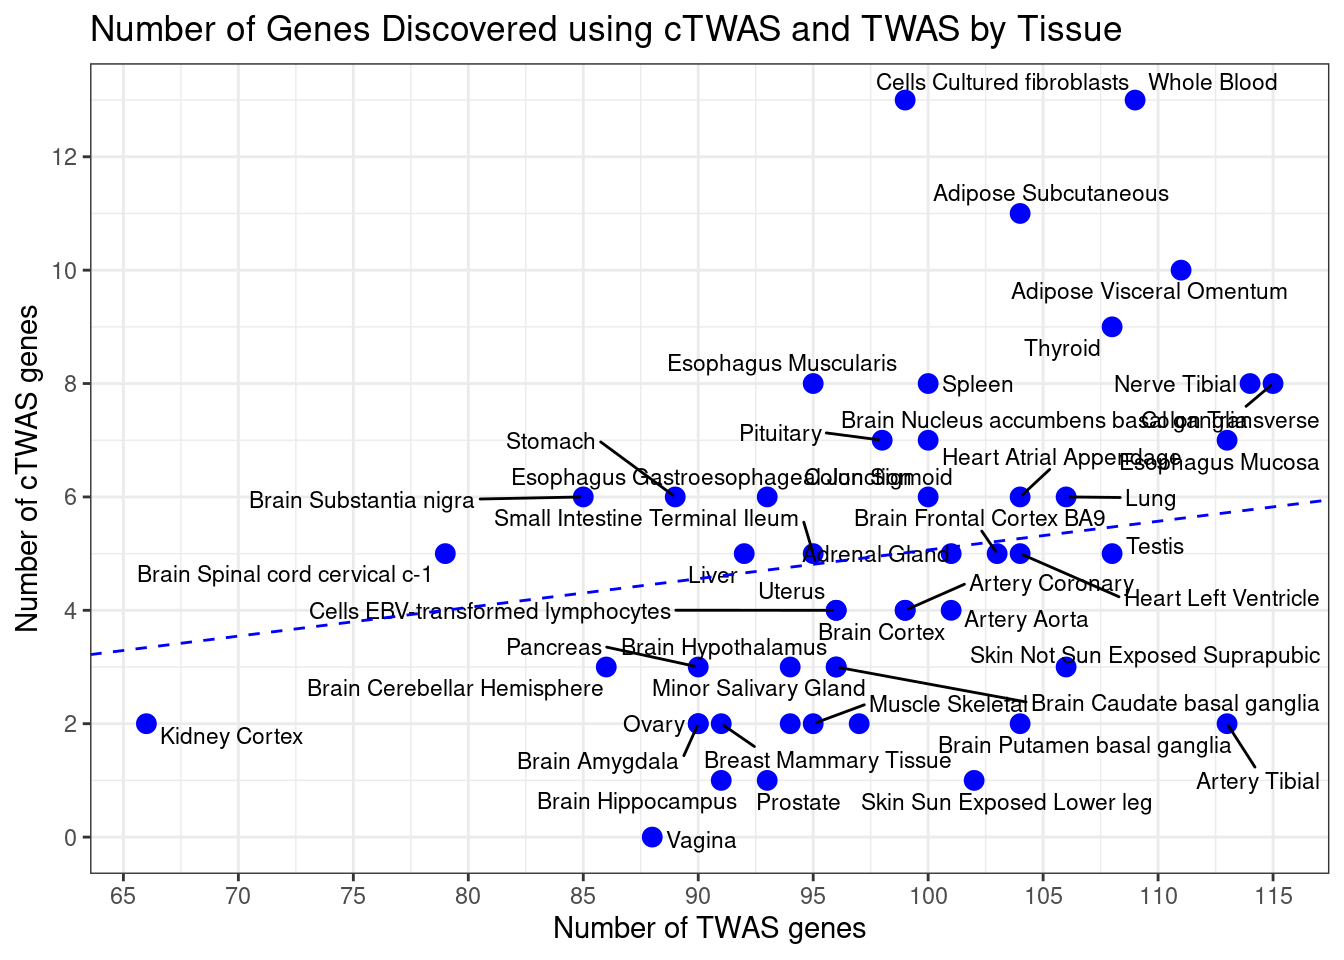
| Version | Author | Date |
|---|---|---|
| 397176f | wesleycrouse | 2022-06-10 |
#report correlation between cTWAS and TWAS
cor(df_plot$n_ctwas, df_plot$n_twas)
[1] 0.4446113####################
#using cutpoint for number of ctwas and twas genes to determine which tissues to label
df_plot <- output
df_plot$tissue <- sapply(df_plot$weight, function(x){paste(unlist(strsplit(x,"_")),collapse=" ")})
df_plot$tissue[df_plot$n_ctwas < 7.5 & df_plot$n_twas < 115] <- ""
p <- ggplot(df_plot, aes(n_twas, n_ctwas, label = tissue)) + geom_point(color = "blue", size=3)
p <- p + geom_text_repel(size=3) + labs(title = "Number of Genes Discovered using cTWAS and TWAS by Tissue") + ylab("Number of cTWAS genes") + xlab("Number of TWAS genes")
p <- p + scale_y_continuous(breaks=seq(0,max(df_plot$n_ctwas),2))
p <- p + scale_x_continuous(breaks=seq(0,max(df_plot$n_twas),5))
p <- p + theme_bw()
fit <- lm(n_ctwas~0+n_twas, data=df_plot)
p <- p + geom_abline(slope=summary(fit)$coefficients["n_twas","Estimate"], intercept=0, linetype=2, color="blue")
p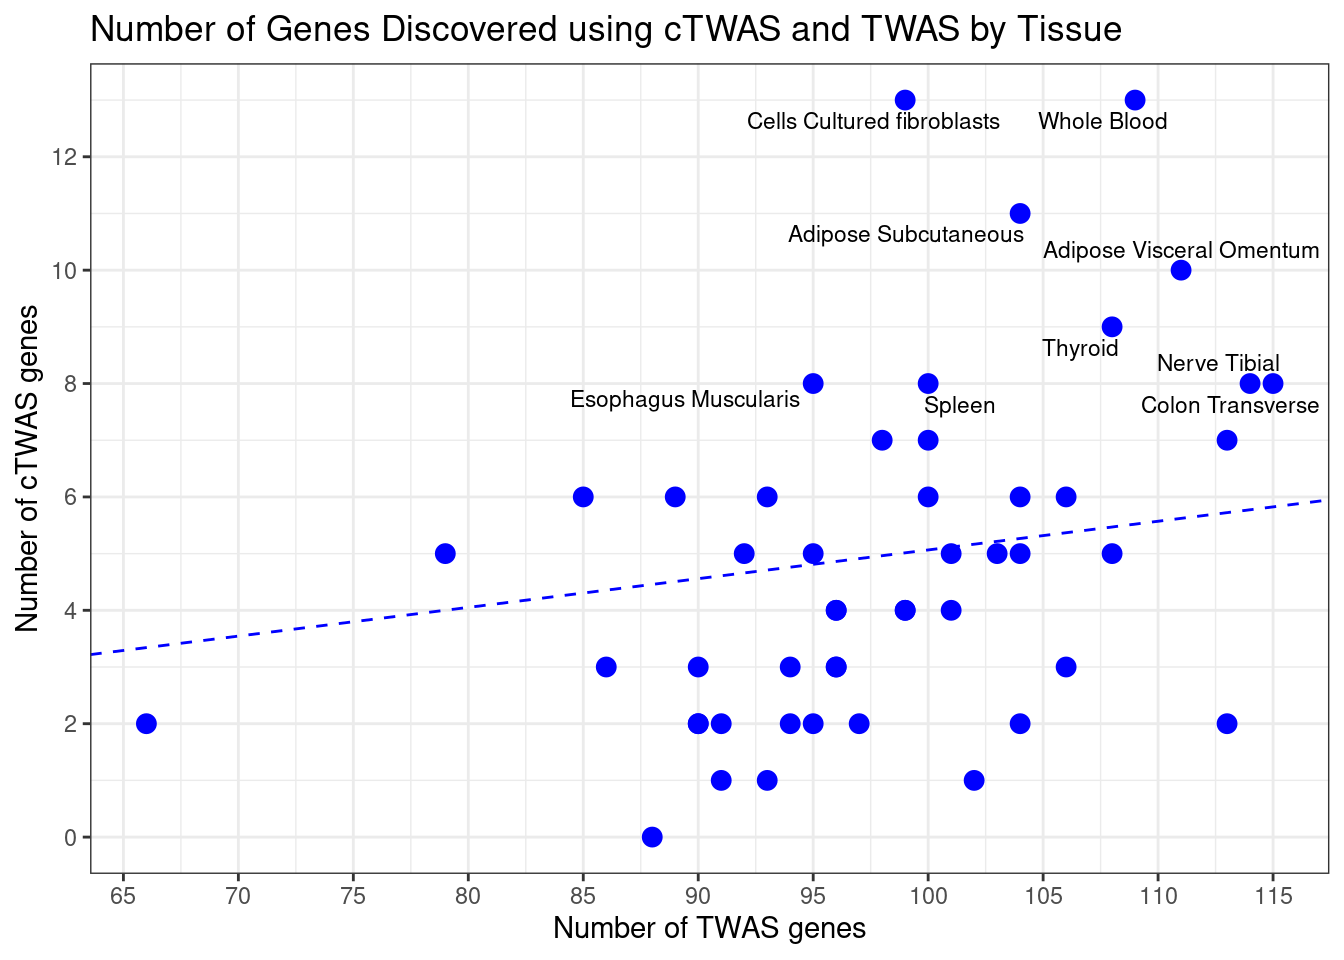
| Version | Author | Date |
|---|---|---|
| 397176f | wesleycrouse | 2022-06-10 |
####################
#only labeling genes in "Blood or Immune" or "Digestive" groups

df_plot <- output
df_plot$tissue <- sapply(df_plot$weight, function(x){paste(unlist(strsplit(x,"_")),collapse=" ")})

df_plot[!(df_plot$weight %in% selected_weights),"tissue"] <- ""

p <- ggplot(df_plot, aes(n_twas, n_ctwas, label = tissue)) + geom_point(color = "blue", size=3)
p <- p + geom_text_repel(size=3) + labs(title = "Number of Genes Discovered using cTWAS and TWAS by Tissue") + ylab("Number of cTWAS genes") + xlab("Number of TWAS genes")
p <- p + scale_y_continuous(breaks=seq(0,max(df_plot$n_ctwas),2))
p <- p + scale_x_continuous(breaks=seq(0,max(df_plot$n_twas),5))
p <- p + theme_bw()

fit <- lm(n_ctwas~0+n_twas, data=df_plot)
p <- p + geom_abline(slope=summary(fit)$coefficients["n_twas","Estimate"], intercept=0, linetype=2, color="blue")

p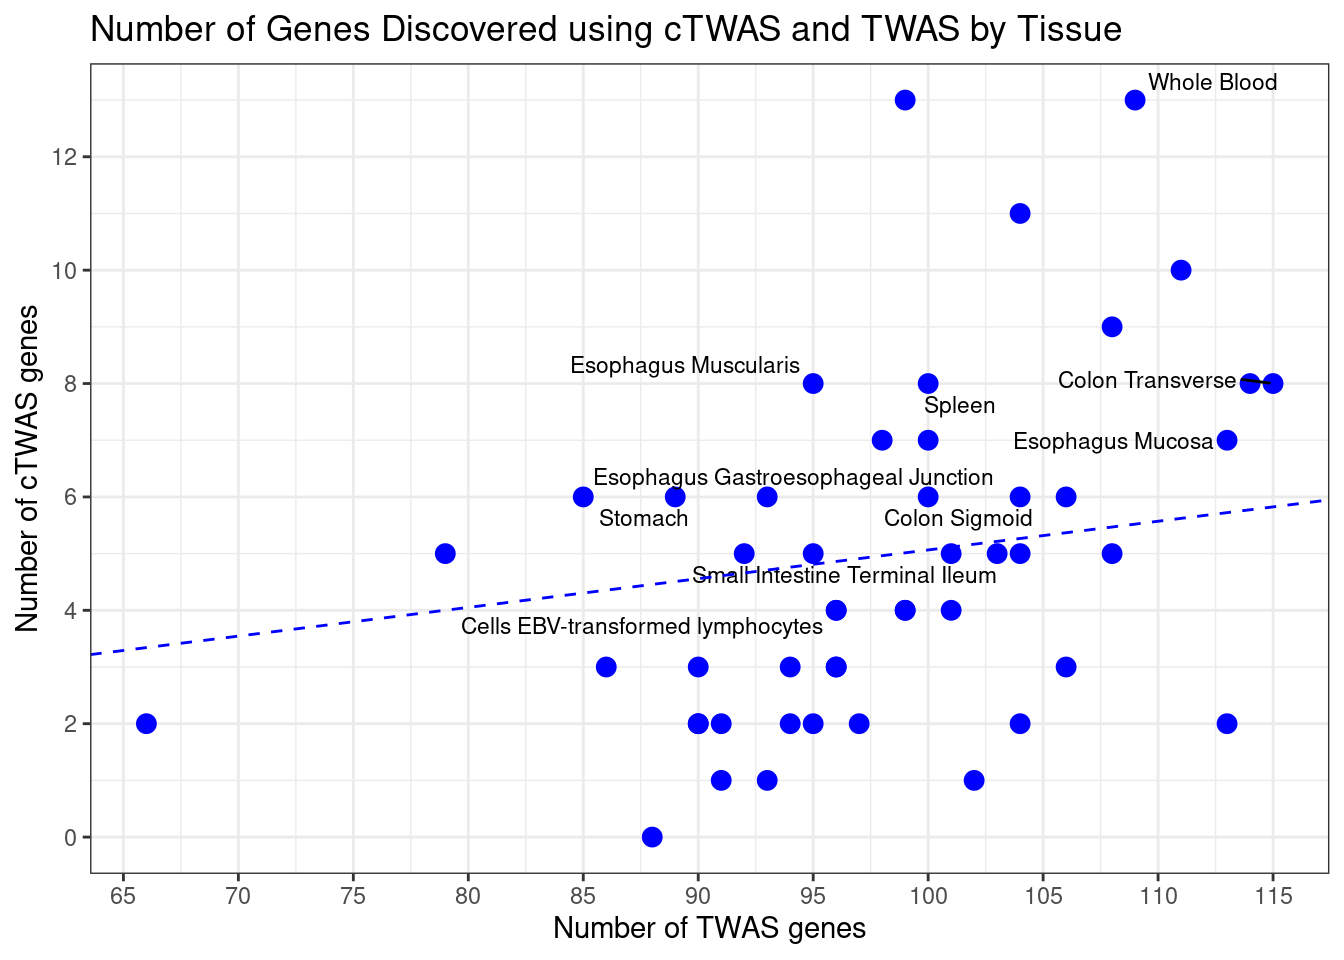
| Version | Author | Date |
|---|---|---|
| 397176f | wesleycrouse | 2022-06-10 |
Most cTWAS genes were found in a small number of tissues
#number of tissues with PIP>0.5 for cTWAS genes
gene_pips_by_weight_bkup <- gene_pips_by_weight
gene_pips_by_weight[is.na(gene_pips_by_weight)] <- 0

#gene_pips_by_weight <- gene_pips_by_weight[,selected_weights,drop=F]

ctwas_frequency <- rowSums(gene_pips_by_weight>0.5)
hist(ctwas_frequency, col="grey", breaks=0:max(ctwas_frequency), xlim=c(0,ncol(gene_pips_by_weight)),
     xlab="Number of Tissues with PIP>0.5",
     ylab="Number of cTWAS Genes",
     main="Tissue Specificity for cTWAS Genes")
| Version | Author | Date |
|---|---|---|
| 397176f | wesleycrouse | 2022-06-10 |
#report number of genes in each tissue bin
table(ctwas_frequency)
ctwas_frequency
1 2 3 4 5 6 7 8 9 10 11 12 15 18 20 21 24 27
35 10 12 9 5 1 4 2 6 4 3 1 1 1 1 1 1 1 Many cTWAS genes are novel
“Novel” is defined as 1) not in the silver standard, and 2) not the gene nearest to a genome-wide significant GWAS peak
#barplot of number of cTWAS genes in each tissue
output <- output[output$weight %in% selected_weights,,drop=F]
output <- output[order(-output$n_ctwas),,drop=F]

output$tissue <- sapply(output$weight, function(x){paste(unlist(strsplit(x,"_")),collapse=" ")})

par(mar=c(10.1, 4.1, 4.1, 2.1))
barplot(output$n_ctwas, names.arg=output$tissue, las=2, ylab="Number of cTWAS Genes", cex.names=0.6, main="Number of cTWAS Genes by Tissue")


results_table$novel <- !(results_table$nearest | results_table$known)
output$n_novel <- sapply(output$weight, function(x){sum(results_table[df[[x]]$ctwas,"novel"], na.rm=T)})

barplot(output$n_novel, names.arg=output$tissue, las=2, col="blue", add=T, xaxt='n', yaxt='n')

legend("topright",
       legend = c("Silver Standard or\nNearest to GWAS Peak", "Novel"),
       fill = c("grey", "blue"))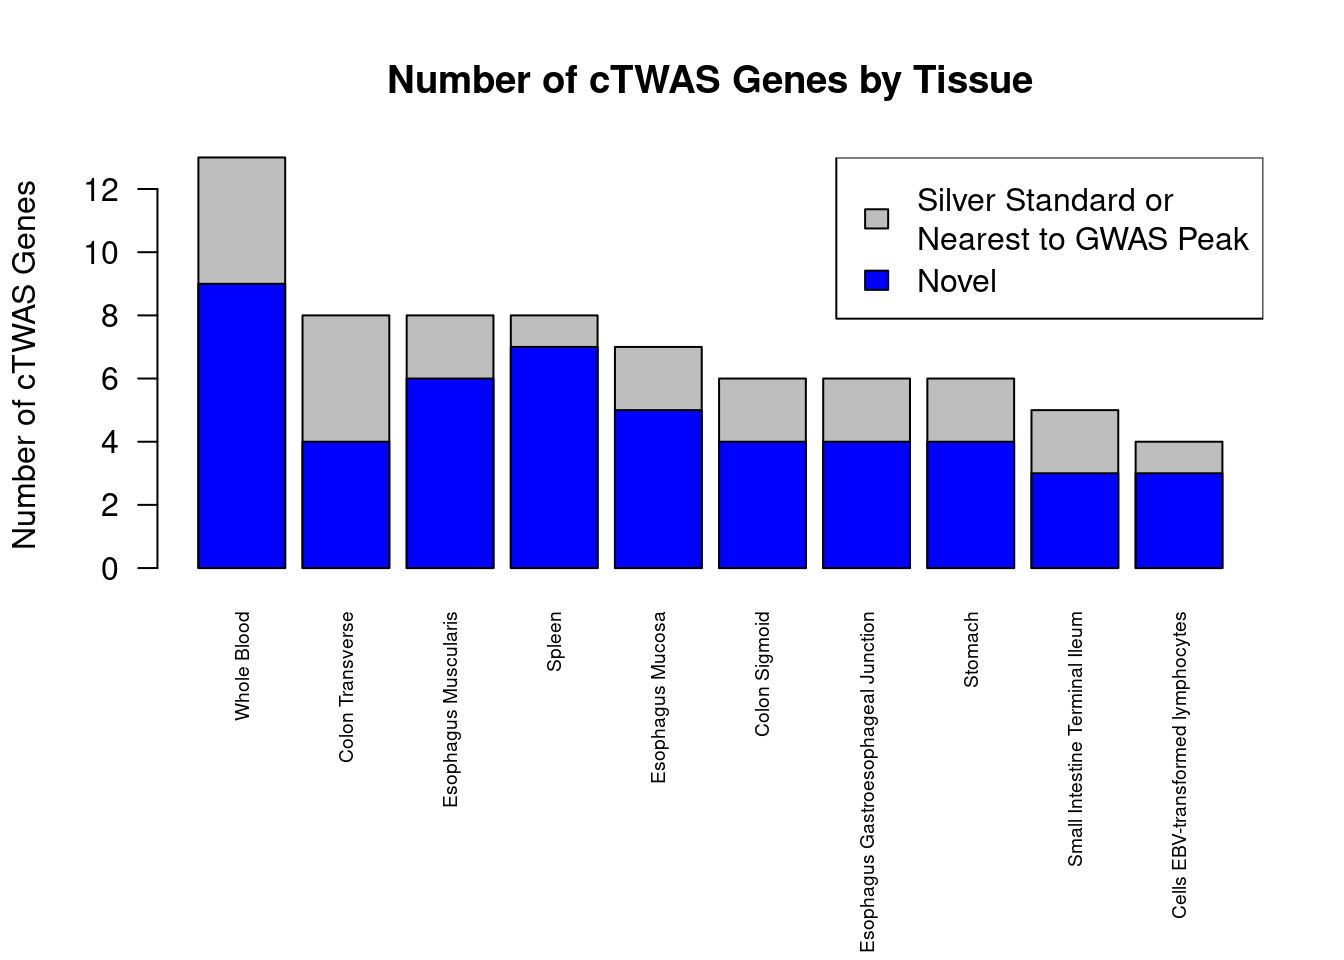
| Version | Author | Date |
|---|---|---|
| 397176f | wesleycrouse | 2022-06-10 |
Summary table of results
selected_weights_whitespace <- sapply(selected_weights, function(x){paste(unlist(strsplit(x, "_")), collapse=" ")})

results_summary <- data.frame(genename=as.character(rownames(results_table)),
                              ensembl_gene_id=results_table$ensembl_gene_id,
                              gene_biotype=G_list$gene_biotype[sapply(results_table$ensembl_gene_id, match, table=G_list$ensembl_gene_id)],
                              chromosome=results_table$chromosome_name,
                              start_position=results_table$start_position,
                              max_pip_tissue=selected_weights_whitespace[apply(results_table[,selected_weights], 1, which.max)],
                              max_pip=apply(results_table[,selected_weights], 1, max, na.rm=T),
                              other_tissues_detected=apply(results_table[,selected_weights],1,function(x){paste(selected_weights_whitespace[which(x>0.8 & x!=max(x,na.rm=T))], collapse="; ")}),
                              nearby=results_table$nearby,
                              nearest=results_table$nearest,
                              distance=G_list$distance[sapply(results_table$ensembl_gene_id, match, table=G_list$ensembl_gene_id)],
                              known=results_table$known,
                              enriched_terms=results_table$enriched_terms)

results_summary <- results_summary[order(results_summary$chromosome, results_summary$start_position),]

write.csv(results_summary, file=paste0("results_summary_inflammatory_bowel_disease_nolnc.csv"))
GO enrichment for genes in selected tissues
#enrichment for cTWAS genes using enrichR
library(enrichR)

dbs <- c("GO_Biological_Process_2021")

GO_enrichment <- enrichr(selected_genes, dbs)
Uploading data to Enrichr... Done.
Querying GO_Biological_Process_2021... Done.
Parsing results... Done.for (db in dbs){
cat(paste0(db, "\n\n"))
enrich_results <- GO_enrichment[[db]]
enrich_results <- enrich_results[enrich_results$Adjusted.P.value<0.05,c("Term", "Overlap", "Adjusted.P.value", "Genes")]
print(enrich_results)
print(plotEnrich(GO_enrichment[[db]]))
}GO_Biological_Process_2021
Term Overlap Adjusted.P.value Genes
1 cellular response to cytokine stimulus (GO:0071345) 8/482 0.00865750 MUC1;SBNO2;CCL20;IFNGR2;STAT3;IRF8;CCR5;ZFP36L2
2 regulation of DNA-templated transcription in response to stress (GO:0043620) 2/9 0.03976039 MUC1;RGS14
3 regulation of receptor binding (GO:1900120) 2/10 0.03976039 ADAM15;HFE
4 negative regulation of receptor binding (GO:1900121) 2/10 0.03976039 ADAM15;HFE
5 eye photoreceptor cell differentiation (GO:0001754) 2/12 0.04298499 STAT3;TULP1
6 positive regulation of interleukin-8 production (GO:0032757) 3/61 0.04298499 STAT3;PRKD2;CD244
7 cytokine-mediated signaling pathway (GO:0019221) 7/621 0.04959639 MUC1;TNFSF15;CCL20;IFNGR2;STAT3;IRF8;CCR5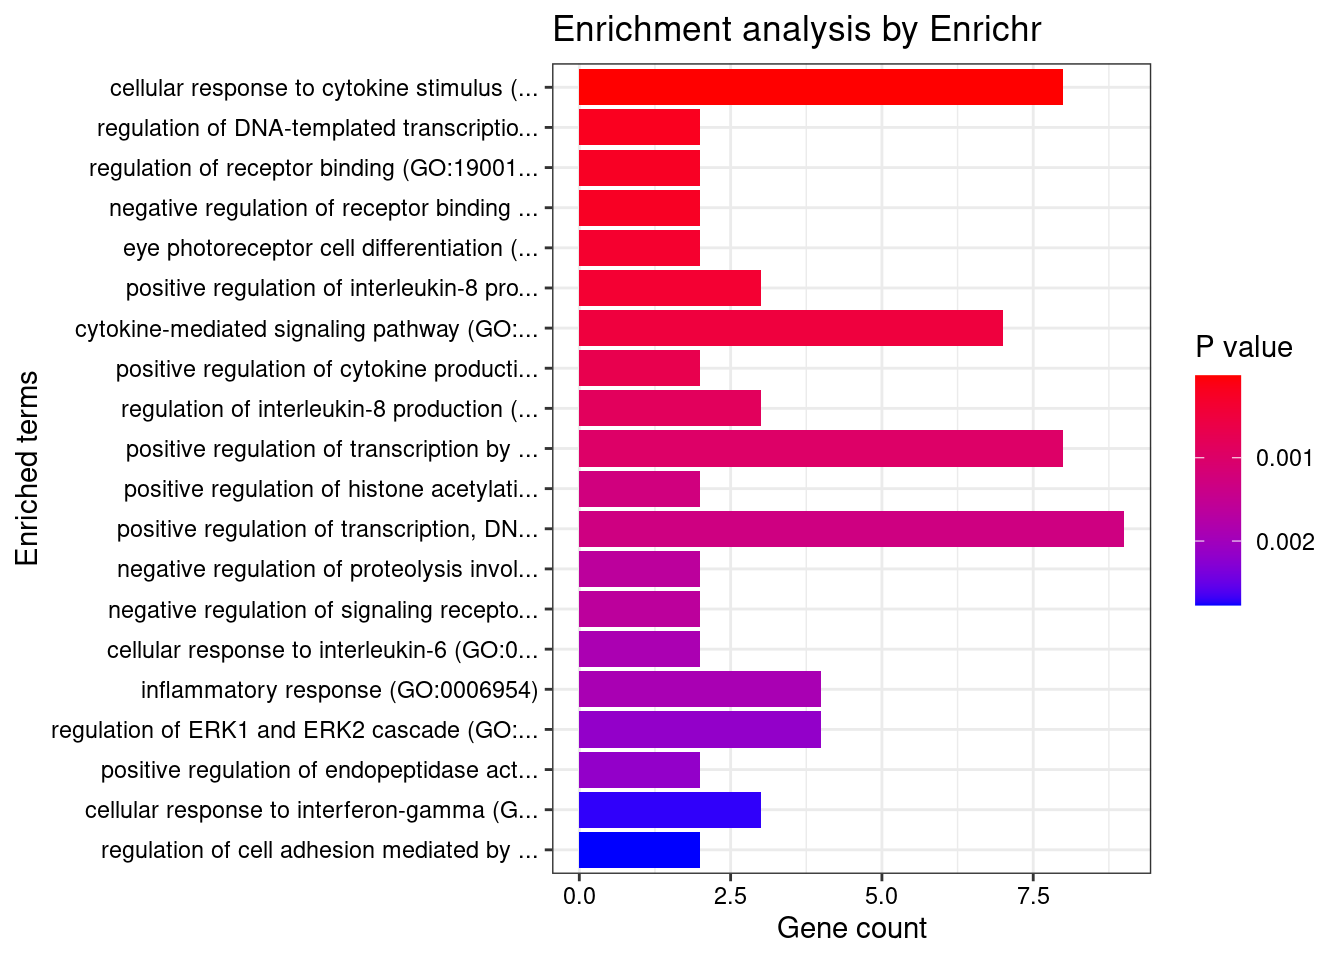
| Version | Author | Date |
|---|---|---|
| 397176f | wesleycrouse | 2022-06-10 |
Locus plots for HSPA6
locus_plot <- function(genename, tissue, plot_eqtl = T, label="cTWAS", xlim=NULL){
  results_dir <- results_dirs[grep(tissue, results_dirs)]
  weight <- rev(unlist(strsplit(results_dir, "/")))[1]
  analysis_id <- paste(trait_id, weight, sep="_")

  #load ctwas results
  ctwas_res <- data.table::fread(paste0(results_dir, "/", analysis_id, "_ctwas.susieIrss.txt"))

  #make unique identifier for regions and effects
  ctwas_res$region_tag <- paste(ctwas_res$region_tag1, ctwas_res$region_tag2, sep="_")
  ctwas_res$region_cs_tag <- paste(ctwas_res$region_tag, ctwas_res$cs_index, sep="_")

  #load z scores for SNPs
  load(paste0(results_dir, "/", analysis_id, "_expr_z_snp.Rd"))

  #separate gene and SNP results
  ctwas_gene_res <- ctwas_res[ctwas_res$type == "gene", ]
  ctwas_gene_res <- data.frame(ctwas_gene_res)
  ctwas_snp_res <- ctwas_res[ctwas_res$type == "SNP", ]
  ctwas_snp_res <- data.frame(ctwas_snp_res)

  #add gene information to results
  sqlite <- RSQLite::dbDriver("SQLite")
  db = RSQLite::dbConnect(sqlite, paste0("/project2/mstephens/wcrouse/predictdb_nolnc/mashr_", weight, ".db"))
  query <- function(...) RSQLite::dbGetQuery(db, ...)
  gene_info <- query("select gene, genename, gene_type from extra")
  RSQLite::dbDisconnect(db)

  ctwas_gene_res <- cbind(ctwas_gene_res, gene_info[sapply(ctwas_gene_res$id, match, gene_info$gene), c("genename", "gene_type")])

  #add z scores to results
  load(paste0(results_dir, "/", analysis_id, "_expr_z_gene.Rd"))
  ctwas_gene_res$z <- z_gene[ctwas_gene_res$id,]$z

  z_snp <- z_snp[z_snp$id %in% ctwas_snp_res$id,]
  ctwas_snp_res$z <- z_snp$z[match(ctwas_snp_res$id, z_snp$id)]

  #merge gene and snp results with added information
  ctwas_snp_res$genename=NA
  ctwas_snp_res$gene_type=NA

  ctwas_res <- rbind(ctwas_gene_res, ctwas_snp_res[,colnames(ctwas_gene_res)])

  region_tag <- ctwas_res$region_tag[which(ctwas_res$genename==genename)]

  region_tag1 <- unlist(strsplit(region_tag, "_"))[1]
  region_tag2 <- unlist(strsplit(region_tag, "_"))[2]

  a <- ctwas_res[ctwas_res$region_tag==region_tag,]

  rm(ctwas_res)

  regionlist <- readRDS(paste0(results_dir, "/", analysis_id, "_ctwas.regionlist.RDS"))
  region <- regionlist[[as.numeric(region_tag1)]][[region_tag2]]

  R_snp_info <- do.call(rbind, lapply(region$regRDS, function(x){data.table::fread(paste0(tools::file_path_sans_ext(x), ".Rvar"))}))

  a$pos[a$type=="gene"] <- G_list$start_position[match(sapply(a$id[a$type=="gene"], function(x){unlist(strsplit(x, "[.]"))[1]}) ,G_list$ensembl_gene_id)]
  a$pos <- a$pos/1000000

  if (!is.null(xlim)){
    if (is.na(xlim[1])){
      xlim[1] <- min(a$pos)
    }
    if (is.na(xlim[2])){
      xlim[2] <- max(a$pos)
    }
    a <- a[a$pos>=xlim[1] & a$pos<=xlim[2],,drop=F]
  }

  focus <- a$id[which(a$genename==genename)]
  a$iffocus <- as.numeric(a$id==focus)

  a$PVALUE <- (-log(2) - pnorm(abs(a$z), lower.tail=F, log.p=T))/log(10)

  R_gene <- readRDS(region$R_g_file)
  R_snp_gene <- readRDS(region$R_sg_file)
  R_snp <- as.matrix(Matrix::bdiag(lapply(region$regRDS, readRDS)))

  rownames(R_gene) <- region$gid
  colnames(R_gene) <- region$gid
  rownames(R_snp_gene) <- R_snp_info$id
  colnames(R_snp_gene) <- region$gid
  rownames(R_snp) <- R_snp_info$id
  colnames(R_snp) <- R_snp_info$id

  a$r2max <- NA

  a$r2max[a$type=="gene"] <- R_gene[focus,a$id[a$type=="gene"]]
  a$r2max[a$type=="SNP"] <- R_snp_gene[a$id[a$type=="SNP"],focus]

  r2cut <- 0.4
  colorsall <- c("#7fc97f", "#beaed4", "#fdc086")

  layout(matrix(1:2, ncol = 1), widths = 1, heights = c(1.5,1.5), respect = FALSE)
  par(mar = c(0, 4.1, 4.1, 2.1))

  plot(a$pos[a$type=="SNP"], a$PVALUE[a$type == "SNP"], pch = 21, xlab=paste0("Chromosome ", region_tag1, " position (Mb)"), frame.plot=FALSE, bg = colorsall[1], ylab = "-log10(p value)", panel.first = grid(), ylim =c(-(1/6)*max(a$PVALUE), max(a$PVALUE)*1.2), xaxt = 'n')

  points(a$pos[a$type=="SNP" & a$r2max > r2cut], a$PVALUE[a$type == "SNP"  & a$r2max > r2cut], pch = 21, bg = "purple")
  points(a$pos[a$type=="SNP" & a$iffocus == 1], a$PVALUE[a$type == "SNP" & a$iffocus == 1], pch = 21, bg = "salmon")
  points(a$pos[a$type=="gene"], a$PVALUE[a$type == "gene"], pch = 22, bg = colorsall[1], cex = 2)
  points(a$pos[a$type=="gene" & a$r2max > r2cut], a$PVALUE[a$type == "gene"  & a$r2max > r2cut], pch = 22, bg = "purple", cex = 2)
  points(a$pos[a$type=="gene" & a$iffocus == 1], a$PVALUE[a$type == "gene" & a$iffocus == 1], pch = 22, bg = "salmon", cex = 2)

  alpha=0.05
  abline(h=-log10(alpha/nrow(ctwas_gene_res)), col ="red", lty = 2)

  if (isTRUE(plot_eqtl)){
    for (cgene in a[a$type=="gene" & a$iffocus == 1, ]$id){
      load(paste0(results_dir, "/",analysis_id, "_expr_chr", region_tag1, ".exprqc.Rd"))
      eqtls <- rownames(wgtlist[[cgene]])
      points(a[a$id %in% eqtls,]$pos, rep( -(1/6)*max(a$PVALUE), nrow(a[a$id %in% eqtls,])), pch = "|", col = "salmon", cex = 1.5)
    }
  }

  if (label=="TWAS"){
    text(a$pos[a$id==focus], a$PVALUE[a$id==focus], labels=ctwas_gene_res$genename[ctwas_gene_res$id==focus], pos=3, cex=0.6)
  }

  par(mar = c(4.1, 4.1, 0.5, 2.1))

  plot(a$pos[a$type=="SNP"], a$PVALUE[a$type == "SNP"], pch = 19, xlab=paste0("Chromosome ", region_tag1, " position (Mb)"),frame.plot=FALSE, col = "white", ylim= c(0,1.1), ylab = "cTWAS PIP")

  grid()
  points(a$pos[a$type=="SNP"], a$susie_pip[a$type == "SNP"], pch = 21, xlab="Genomic position", bg = colorsall[1])
  points(a$pos[a$type=="SNP" & a$r2max > r2cut], a$susie_pip[a$type == "SNP"  & a$r2max >r2cut], pch = 21, bg = "purple")
  points(a$pos[a$type=="SNP" & a$iffocus == 1], a$susie_pip[a$type == "SNP" & a$iffocus == 1], pch = 21, bg = "salmon")
  points(a$pos[a$type=="gene"], a$susie_pip[a$type == "gene"], pch = 22, bg = colorsall[1], cex = 2)
  points(a$pos[a$type=="gene" & a$r2max > r2cut], a$susie_pip[a$type == "gene"  & a$r2max > r2cut], pch = 22, bg = "purple", cex = 2)
  points(a$pos[a$type=="gene" & a$iffocus == 1], a$susie_pip[a$type == "gene" & a$iffocus == 1], pch = 22, bg = "salmon", cex = 2)

  legend(max(a$pos)-0.2*(max(a$pos)-min(a$pos)), y= 1 ,c("Gene", "SNP","Lead TWAS Gene", "R2 > 0.4", "R2 <= 0.4"), pch = c(22,21,19,19,19), col = c("black", "black", "salmon", "purple", colorsall[1]), cex=0.7, title.adj = 0)

  if (label=="cTWAS"){
    text(a$pos[a$id==focus], a$susie_pip[a$id==focus], labels=ctwas_gene_res$genename[ctwas_gene_res$id==focus], pos=3, cex=0.6)
  }

  return(a)
}
genename <- "HSPA6"
tissue <- "Esophagus_Muscularis"
a <- locus_plot(genename, tissue, xlim=c(161.25, 161.75))
#ctwas results
head(a[order(-a$susie_pip), c("chrom", "pos", "id", "genename", "type", "susie_pip", "PVALUE") ], 10)
#nearest gene to GWAS peak
G_list[G_list$chromosome_name==unique(a$chrom) & G_list$start_position > min(a$pos*1000000) & G_list$end_position < max(a$pos*1000000),]
####################
#checking additional tissue
a <- locus_plot(genename, "Esophagus_Mucosa", xlim=c(161.25, 161.75))
#ctwas results
head(a[order(-a$susie_pip), c("chrom", "pos", "id", "genename", "type", "susie_pip", "PVALUE") ], 10)Locus plots for IRF8
genename <- "IRF8"
tissue <- names(which.max(results_table[genename,selected_weights]))

print(tissue)

a <- locus_plot(genename, tissue, xlim=c(85.75, 86.25))

#ctwas results
head(a[order(-a$susie_pip), c("chrom", "pos", "id", "genename", "type", "susie_pip", "PVALUE") ], 10)

#nearest gene to GWAS peak
G_list[G_list$chromosome_name==unique(a$chrom) & G_list$start_position > min(a$pos*1000000) & G_list$end_position < max(a$pos*1000000),]
Locus plots for CERKL
genename <- "CERKL"

tissue <- "Colon_Transverse"

print(tissue)

a <- locus_plot(genename, tissue, xlim=c(NA, 181.75))

#ctwas results
head(a[order(-a$susie_pip), c("chrom", "pos", "id", "genename", "type", "susie_pip", "PVALUE") ], 10)

#nearest gene to GWAS peak
G_list[G_list$chromosome_name==unique(a$chrom) & G_list$start_position > min(a$pos*1000000) & G_list$end_position < max(a$pos*1000000),]
Summary table of results - version 2
save.image("workspace3.RData")
#load("workspace3.RData")


results_summary <- data.frame(genename=as.character(rownames(results_table)),
                              ensembl_gene_id=results_table$ensembl_gene_id,
                              chromosome=results_table$chromosome_name,
                              start_position=results_table$start_position,
                              max_pip_tissue=selected_weights_whitespace[apply(results_table[,selected_weights], 1, which.max)],
                              max_pip_tissue_nospace=selected_weights[apply(results_table[,selected_weights], 1, which.max)],
                              max_pip=apply(results_table[,selected_weights], 1, max, na.rm=T),
                              other_tissues_detected=apply(results_table[,selected_weights],1,function(x){paste(selected_weights_whitespace[which(x>0.8 & x!=max(x,na.rm=T))], collapse="; ")}),
                              region_tag_tissue=NA,
                              z_tissue=NA,
                              num_eqtl_tissue=NA,
                              twas_fp_tissue=NA,
                              gene_nearest_region_peak_tissue=NA,
                              nearby=results_table$nearby,
                              nearest=results_table$nearest,
                              distance=results_table$distance,
                              which_nearest=results_table$which_nearest,
                              known=results_table$known,
                              stringsAsFactors=F)

for (i in 1:nrow(results_summary)){
  tissue <- results_summary$max_pip_tissue_nospace[i]
  gene <- results_summary$genename[i]
  gene_pips <- df[[tissue]]$gene_pips
  results_summary[i,c("region_tag_tissue", "z_tissue")] <- gene_pips[gene_pips$genename==gene,c("region_tag", "z")]
  region_tag <- results_summary$region_tag_tissue[i]
  results_summary$twas_fp_tissue[i] <- any(gene_pips$genename[gene_pips$region_tag==region_tag & gene_pips$genename!=gene] %in% df[[tissue]]$twas)
}

####################
#GO enrichment of cTWAS genes
# genes <- results_summary$genename
#
# dbs <- c("GO_Biological_Process_2021", "GO_Cellular_Component_2021", "GO_Molecular_Function_2021")
# GO_enrichment <- enrichr(genes, dbs)
#
# save(GO_enrichment, file=paste0(trait_id, "_enrichment_results.RData"))

####################
#enrichment of silver standard genes
# genes <- known_genes
#
# dbs <- c("GO_Biological_Process_2021", "GO_Cellular_Component_2021", "GO_Molecular_Function_2021")
# GO_enrichment_silver_standard <- enrichr(genes, dbs)
#
# save(GO_enrichment_silver_standard, file=paste0(trait_id, "silver_standard_enrichment_results.RData"))


####################
#report GO cTWAS

load(paste0(trait_id, "_enrichment_results.RData"))

GO_enrichment <- do.call(rbind, GO_enrichment)
GO_enrichment$db <- sapply(rownames(GO_enrichment), function(x){unlist(strsplit(x, split="[.]"))[1]})
rownames(GO_enrichment) <- NULL

GO_enrichment <- GO_enrichment[GO_enrichment$Adjusted.P.value < 0.05,]
GO_enrichment <- GO_enrichment[order(-GO_enrichment$Odds.Ratio),]

results_summary$GO <- sapply(results_summary$genename, function(x){terms <- GO_enrichment$Term[grep(x, GO_enrichment$Genes)];
                                             if (length(terms)>0){terms <- terms[1:min(length(terms),5)]};
                                             paste0(terms, collapse="; ")})


####################
#report GO silver standard

load(paste0(trait_id, "silver_standard_enrichment_results.RData"))

GO_enrichment_silver_standard <- do.call(rbind, GO_enrichment_silver_standard)
GO_enrichment_silver_standard$db <- sapply(rownames(GO_enrichment_silver_standard), function(x){unlist(strsplit(x, split="[.]"))[1]})
rownames(GO_enrichment_silver_standard) <- NULL

GO_enrichment_silver_standard <- GO_enrichment_silver_standard[GO_enrichment_silver_standard$Adjusted.P.value < 0.05,]
GO_enrichment_silver_standard <- GO_enrichment_silver_standard[order(-GO_enrichment_silver_standard$Odds.Ratio),]

#reload GO cTWAS for GO crosswalk
load(paste0(trait_id, "_enrichment_results.RData"))

GO_enrichment <- do.call(rbind, GO_enrichment)
GO_enrichment$db <- sapply(rownames(GO_enrichment), function(x){unlist(strsplit(x, split="[.]"))[1]})
rownames(GO_enrichment) <- NULL

#overlap between sets
GO_enrichment <- GO_enrichment[GO_enrichment$Term %in% GO_enrichment_silver_standard$Term,,drop=F]
GO_enrichment_silver_standard <- GO_enrichment_silver_standard[GO_enrichment_silver_standard$Term %in% GO_enrichment$Term,,drop=F]
GO_enrichment <- GO_enrichment[match(GO_enrichment_silver_standard$Term, GO_enrichment$Term),]

results_summary$GO_silver <- sapply(results_summary$genename, function(x){terms <- GO_enrichment$Term[grep(x, GO_enrichment$Genes)];
                                                                          if (length(terms)>0){terms <- terms[1:min(length(terms),5)]};
                                                                          paste0(terms, collapse="; ")})

####################
#report FUMA

FUMA <- data.table::fread(paste0("/project2/xinhe/shengqian/cTWAS/cTWAS_analysis/data/FUMA_output/", trait_id, "/GS.txt"))
FUMA <- FUMA[FUMA$Category %in% c("GO_bp", "GO_cc", "GO_mf"),,drop=F]
FUMA <- FUMA[order(FUMA$p),]

#reload GO cTWAS for GO crosswalk
load(paste0(trait_id, "_enrichment_results.RData"))
GO_enrichment <- do.call(rbind, GO_enrichment)
GO_enrichment$db <- sapply(rownames(GO_enrichment), function(x){unlist(strsplit(x, split="[.]"))[1]})
rownames(GO_enrichment) <- NULL

GO_enrichment$Term_FUMA <- sapply(GO_enrichment$Term, function(x){rev(rev(unlist(strsplit(x, split=" [(]GO")))[-1])})
GO_enrichment$Term_FUMA <- paste0("GO_", toupper(gsub(" ", "_", GO_enrichment$Term_FUMA)))

#overlap between sets
GO_enrichment <- GO_enrichment[GO_enrichment$Term_FUMA %in% FUMA$GeneSet,,drop=F]
FUMA <- FUMA[FUMA$GeneSet %in% GO_enrichment$Term_FUMA]
GO_enrichment <- GO_enrichment[match(FUMA$GeneSet, GO_enrichment$Term_FUMA),]

results_summary$GO_MAGMA <- sapply(results_summary$genename, function(x){terms <- GO_enrichment$Term[grep(x, GO_enrichment$Genes)];
                                                                         if (length(terms)>0){terms <- terms[1:min(length(terms),5)]};
                                                                         paste0(terms, collapse="; ")})

write.csv(results_summary, file=paste0("results_summary_inflammatory_bowel_disease_nolnc_v2.csv"))
sessionInfo()R version 3.6.1 (2019-07-05)
Platform: x86_64-pc-linux-gnu (64-bit)
Running under: Scientific Linux 7.4 (Nitrogen)
Matrix products: default
BLAS/LAPACK: /software/openblas-0.2.19-el7-x86_64/lib/libopenblas_haswellp-r0.2.19.so
locale:
[1] LC_CTYPE=en_US.UTF-8 LC_NUMERIC=C LC_TIME=en_US.UTF-8 LC_COLLATE=en_US.UTF-8 LC_MONETARY=en_US.UTF-8 LC_MESSAGES=en_US.UTF-8 LC_PAPER=en_US.UTF-8 LC_NAME=C LC_ADDRESS=C LC_TELEPHONE=C LC_MEASUREMENT=en_US.UTF-8 LC_IDENTIFICATION=C
attached base packages:
[1] stats graphics grDevices utils datasets methods base
other attached packages:
[1] ggrepel_0.9.1 ggplot2_3.3.5 disgenet2r_0.99.2 WebGestaltR_0.4.4 enrichR_3.0
loaded via a namespace (and not attached):
[1] Rcpp_1.0.6 svglite_1.2.2 lattice_0.20-38 rprojroot_2.0.2 digest_0.6.20 foreach_1.5.1 utf8_1.2.1 plyr_1.8.4 R6_2.5.0 RSQLite_2.2.7 evaluate_0.14 httr_1.4.1 pillar_1.7.0 gdtools_0.1.9 rlang_1.0.2 curl_3.3 data.table_1.14.0 whisker_0.3-2 blob_1.2.1 Matrix_1.2-18 rmarkdown_1.13 apcluster_1.4.8 labeling_0.3 readr_1.4.0 stringr_1.4.0 igraph_1.2.4.1 bit_4.0.4 munsell_0.5.0 compiler_3.6.1 httpuv_1.5.1 xfun_0.8 pkgconfig_2.0.3 htmltools_0.5.2 tidyselect_1.1.2 tibble_3.1.7 workflowr_1.6.2 codetools_0.2-16 fansi_0.5.0 withr_2.4.1 crayon_1.4.1 dplyr_1.0.9 later_0.8.0 grid_3.6.1 jsonlite_1.6 gtable_0.3.0 lifecycle_1.0.1 DBI_1.1.1 git2r_0.26.1 magrittr_2.0.3 scales_1.2.0 cli_3.3.0 stringi_1.4.3 cachem_1.0.5 reshape2_1.4.3 farver_2.1.0
[56] fs_1.5.2 promises_1.0.1 doRNG_1.8.2 doParallel_1.0.16 ellipsis_0.3.2 generics_0.0.2 vctrs_0.4.1 rjson_0.2.20 iterators_1.0.13 tools_3.6.1 bit64_4.0.5 glue_1.6.2 purrr_0.3.4 hms_1.1.0 rngtools_1.5 parallel_3.6.1 fastmap_1.1.0 yaml_2.2.0 colorspace_1.4-1 memoise_2.0.0 knitr_1.23