Inflammatory bowel disease - all weights
wesleycrouse
2022-04-04
Last updated: 2022-06-03
Checks: 7 0
Knit directory: ctwas_applied/
This reproducible R Markdown analysis was created with workflowr (version 1.6.2). The Checks tab describes the reproducibility checks that were applied when the results were created. The Past versions tab lists the development history.
Great! Since the R Markdown file has been committed to the Git repository, you know the exact version of the code that produced these results.
Great job! The global environment was empty. Objects defined in the global environment can affect the analysis in your R Markdown file in unknown ways. For reproduciblity it’s best to always run the code in an empty environment.
The command set.seed(20210726) was run prior to running the code in the R Markdown file. Setting a seed ensures that any results that rely on randomness, e.g. subsampling or permutations, are reproducible.
Great job! Recording the operating system, R version, and package versions is critical for reproducibility.
Nice! There were no cached chunks for this analysis, so you can be confident that you successfully produced the results during this run.
Great job! Using relative paths to the files within your workflowr project makes it easier to run your code on other machines.
Great! You are using Git for version control. Tracking code development and connecting the code version to the results is critical for reproducibility.
The results in this page were generated with repository version 37b2a2c. See the Past versions tab to see a history of the changes made to the R Markdown and HTML files.
Note that you need to be careful to ensure that all relevant files for the analysis have been committed to Git prior to generating the results (you can use wflow_publish or wflow_git_commit). workflowr only checks the R Markdown file, but you know if there are other scripts or data files that it depends on. Below is the status of the Git repository when the results were generated:
Untracked files:
    Untracked:  code/collect_ctwas_genes.R
    Untracked:  group_enrichment_results.RData
    Untracked:  temp.regionlist.RDS
    Untracked:  temp.regions.txt
    Untracked:  temp.susieIrss.txt
    Untracked:  temp.temp.susieIrssres.Rd
    Untracked:  temp_LDR/
    Untracked:  temp_ld_R_chr1.txt
    Untracked:  temp_ld_R_chr10.txt
    Untracked:  temp_ld_R_chr11.txt
    Untracked:  temp_ld_R_chr12.txt
    Untracked:  temp_ld_R_chr13.txt
    Untracked:  temp_ld_R_chr14.txt
    Untracked:  temp_ld_R_chr15.txt
    Untracked:  temp_ld_R_chr16.txt
    Untracked:  temp_ld_R_chr17.txt
    Untracked:  temp_ld_R_chr18.txt
    Untracked:  temp_ld_R_chr19.txt
    Untracked:  temp_ld_R_chr2.txt
    Untracked:  temp_ld_R_chr20.txt
    Untracked:  temp_ld_R_chr21.txt
    Untracked:  temp_ld_R_chr22.txt
    Untracked:  temp_ld_R_chr3.txt
    Untracked:  temp_ld_R_chr4.txt
    Untracked:  temp_ld_R_chr5.txt
    Untracked:  temp_ld_R_chr6.txt
    Untracked:  temp_ld_R_chr7.txt
    Untracked:  temp_ld_R_chr8.txt
    Untracked:  temp_ld_R_chr9.txt
    Untracked:  temp_reg.txt
    Untracked:  workspace.RData
    Untracked:  z_snp_pos_ebi-a-GCST004131.RData
    Untracked:  z_snp_pos_ebi-a-GCST004132.RData
    Untracked:  z_snp_pos_ebi-a-GCST004133.RData

Unstaged changes:
    Modified:   analysis/ukb-d-30780_irnt_Liver_nolnc_known.Rmd
Note that any generated files, e.g. HTML, png, CSS, etc., are not included in this status report because it is ok for generated content to have uncommitted changes.
These are the previous versions of the repository in which changes were made to the R Markdown (analysis/ebi-a-GCST004131_allweights.Rmd) and HTML (docs/ebi-a-GCST004131_allweights.html) files. If you’ve configured a remote Git repository (see ?wflow_git_remote), click on the hyperlinks in the table below to view the files as they were in that past version.
| File | Version | Author | Date | Message |
|---|---|---|---|---|
| Rmd | 37b2a2c | wesleycrouse | 2022-05-29 | dropping lncRNAs |
| html | 37b2a2c | wesleycrouse | 2022-05-29 | dropping lncRNAs |
| Rmd | 0105a21 | wesleycrouse | 2022-05-24 | fixing TWAS v cTWAS plot |
| html | 0105a21 | wesleycrouse | 2022-05-24 | fixing TWAS v cTWAS plot |
| Rmd | 1a96504 | wesleycrouse | 2022-05-24 | IBD results |
| html | 1a96504 | wesleycrouse | 2022-05-24 | IBD results |
| Rmd | d46127d | wesleycrouse | 2022-05-24 | IBD |
| html | d46127d | wesleycrouse | 2022-05-24 | IBD |
| Rmd | fddd181 | wesleycrouse | 2022-05-23 | locus plots, finally |
options(width=1000)trait_id <- "ebi-a-GCST004131"
trait_name <- "Inflammatory bowel disease"
source("/project2/mstephens/wcrouse/UKB_analysis_allweights/ctwas_config.R")
trait_dir <- paste0("/project2/mstephens/wcrouse/UKB_analysis_allweights/", trait_id)
results_dirs <- list.dirs(trait_dir, recursive=F)Load cTWAS results for all weights
# df <- list()
#
# for (i in 1:length(results_dirs)){
#   print(i)
#
#   results_dir <- results_dirs[i]
#   weight <- rev(unlist(strsplit(results_dir, "/")))[1]
#   analysis_id <- paste(trait_id, weight, sep="_")
#
#   #load ctwas results
#   ctwas_res <- data.table::fread(paste0(results_dir, "/", analysis_id, "_ctwas.susieIrss.txt"))
#
#   #make unique identifier for regions and effects
#   ctwas_res$region_tag <- paste(ctwas_res$region_tag1, ctwas_res$region_tag2, sep="_")
#   ctwas_res$region_cs_tag <- paste(ctwas_res$region_tag, ctwas_res$cs_index, sep="_")
#
#   #load z scores for SNPs and collect sample size
#   load(paste0(results_dir, "/", analysis_id, "_expr_z_snp.Rd"))
#
#   sample_size <- z_snp$ss
#   sample_size <- as.numeric(names(which.max(table(sample_size))))
#
#   #separate gene and SNP results
#   ctwas_gene_res <- ctwas_res[ctwas_res$type == "gene", ]
#   ctwas_gene_res <- data.frame(ctwas_gene_res)
#   ctwas_snp_res <- ctwas_res[ctwas_res$type == "SNP", ]
#   ctwas_snp_res <- data.frame(ctwas_snp_res)
#
#   #add gene information to results
#   sqlite <- RSQLite::dbDriver("SQLite")
#   db = RSQLite::dbConnect(sqlite, paste0("/project2/compbio/predictdb/mashr_models/mashr_", weight, ".db"))
#   query <- function(...) RSQLite::dbGetQuery(db, ...)
#   gene_info <- query("select gene, genename, gene_type from extra")
#   RSQLite::dbDisconnect(db)
#
#   ctwas_gene_res <- cbind(ctwas_gene_res, gene_info[sapply(ctwas_gene_res$id, match, gene_info$gene), c("genename", "gene_type")])
#
#   #add z scores to results
#   load(paste0(results_dir, "/", analysis_id, "_expr_z_gene.Rd"))
#   ctwas_gene_res$z <- z_gene[ctwas_gene_res$id,]$z
#
#   z_snp <- z_snp[z_snp$id %in% ctwas_snp_res$id,]
#   ctwas_snp_res$z <- z_snp$z[match(ctwas_snp_res$id, z_snp$id)]
#
#   #merge gene and snp results with added information
#   ctwas_snp_res$genename=NA
#   ctwas_snp_res$gene_type=NA
#
#   ctwas_res <- rbind(ctwas_gene_res,
#                    ctwas_snp_res[,colnames(ctwas_gene_res)])
#
#   #get number of SNPs from s1 results; adjust for thin argument
#   ctwas_res_s1 <- data.table::fread(paste0(results_dir, "/", analysis_id, "_ctwas.s1.susieIrss.txt"))
#   n_snps <- sum(ctwas_res_s1$type=="SNP")/thin
#   rm(ctwas_res_s1)
#
#   #load estimated parameters
#   load(paste0(results_dir, "/", analysis_id, "_ctwas.s2.susieIrssres.Rd"))
#
#   #estimated group prior
#   estimated_group_prior <- group_prior_rec[,ncol(group_prior_rec)]
#   names(estimated_group_prior) <- c("gene", "snp")
#   estimated_group_prior["snp"] <- estimated_group_prior["snp"]*thin #adjust parameter to account for thin argument
#
#   #estimated group prior variance
#   estimated_group_prior_var <- group_prior_var_rec[,ncol(group_prior_var_rec)]
#   names(estimated_group_prior_var) <- c("gene", "snp")
#
#   #report group size
#   group_size <- c(nrow(ctwas_gene_res), n_snps)
#
#   #estimated group PVE
#   estimated_group_pve <- estimated_group_prior_var*estimated_group_prior*group_size/sample_size
#   names(estimated_group_pve) <- c("gene", "snp")
#
#   #ctwas genes using PIP>0.8
#   ctwas_genes_index <- ctwas_gene_res$susie_pip>0.8
#   ctwas_genes <- ctwas_gene_res$genename[ctwas_genes_index]
#
#   #twas genes using bonferroni threshold
#   alpha <- 0.05
#   sig_thresh <- qnorm(1-(alpha/nrow(ctwas_gene_res)/2), lower=T)
#
#   twas_genes_index <- abs(ctwas_gene_res$z) > sig_thresh
#   twas_genes <- ctwas_gene_res$genename[twas_genes_index]
#
#   #gene PIPs and z scores
#   gene_pips <- ctwas_gene_res[,c("genename", "region_tag", "susie_pip", "z", "region_cs_tag")]
#
#   #total PIPs by region
#   regions <- unique(ctwas_gene_res$region_tag)
#   region_pips <- data.frame(region=regions, stringsAsFactors=F)
#   region_pips$gene_pip <- sapply(regions, function(x){sum(ctwas_gene_res$susie_pip[ctwas_gene_res$region_tag==x])})
#   region_pips$snp_pip <- sapply(regions, function(x){sum(ctwas_snp_res$susie_pip[ctwas_snp_res$region_tag==x])})
#   region_pips$snp_maxz <- sapply(regions, function(x){max(abs(ctwas_snp_res$z[ctwas_snp_res$region_tag==x]))})
#
#   #total PIPs by causal set
#   regions_cs <- unique(ctwas_gene_res$region_cs_tag)
#   region_cs_pips <- data.frame(region_cs=regions_cs, stringsAsFactors=F)
#   region_cs_pips$gene_pip <- sapply(regions_cs, function(x){sum(ctwas_gene_res$susie_pip[ctwas_gene_res$region_cs_tag==x])})
#   region_cs_pips$snp_pip <- sapply(regions_cs, function(x){sum(ctwas_snp_res$susie_pip[ctwas_snp_res$region_cs_tag==x])})
#
#   df[[weight]] <- list(prior=estimated_group_prior,
#                      prior_var=estimated_group_prior_var,
#                      pve=estimated_group_pve,
#                      ctwas=ctwas_genes,
#                      twas=twas_genes,
#                      gene_pips=gene_pips,
#                      region_pips=region_pips,
#                      sig_thresh=sig_thresh,
#                      region_cs_pips=region_cs_pips)
# }
#
# save(df, file=paste(trait_dir, "results_df.RData", sep="/"))
load(paste(trait_dir, "results_df.RData", sep="/"))

output <- data.frame(weight=names(df),
                     prior_g=unlist(lapply(df, function(x){x$prior["gene"]})),
                     prior_s=unlist(lapply(df, function(x){x$prior["snp"]})),
                     prior_var_g=unlist(lapply(df, function(x){x$prior_var["gene"]})),
                     prior_var_s=unlist(lapply(df, function(x){x$prior_var["snp"]})),
                     pve_g=unlist(lapply(df, function(x){x$pve["gene"]})),
                     pve_s=unlist(lapply(df, function(x){x$pve["snp"]})),
                     n_ctwas=unlist(lapply(df, function(x){length(x$ctwas)})),
                     n_twas=unlist(lapply(df, function(x){length(x$twas)})),
                     row.names=NULL,
                     stringsAsFactors=F)
Plot estimated prior parameters and PVE
#plot estimated group prior

output <- output[order(-output$prior_g),]

par(mar=c(10.1, 4.1, 4.1, 2.1))

plot(output$prior_g, type="l", ylim=c(0, max(output$prior_g, output$prior_s)*1.1),
     xlab="", ylab="Estimated Group Prior", xaxt = "n", col="blue")
lines(output$prior_s)

axis(1, at = 1:nrow(output),
     labels = output$weight,
     las=2,
     cex.axis=0.6)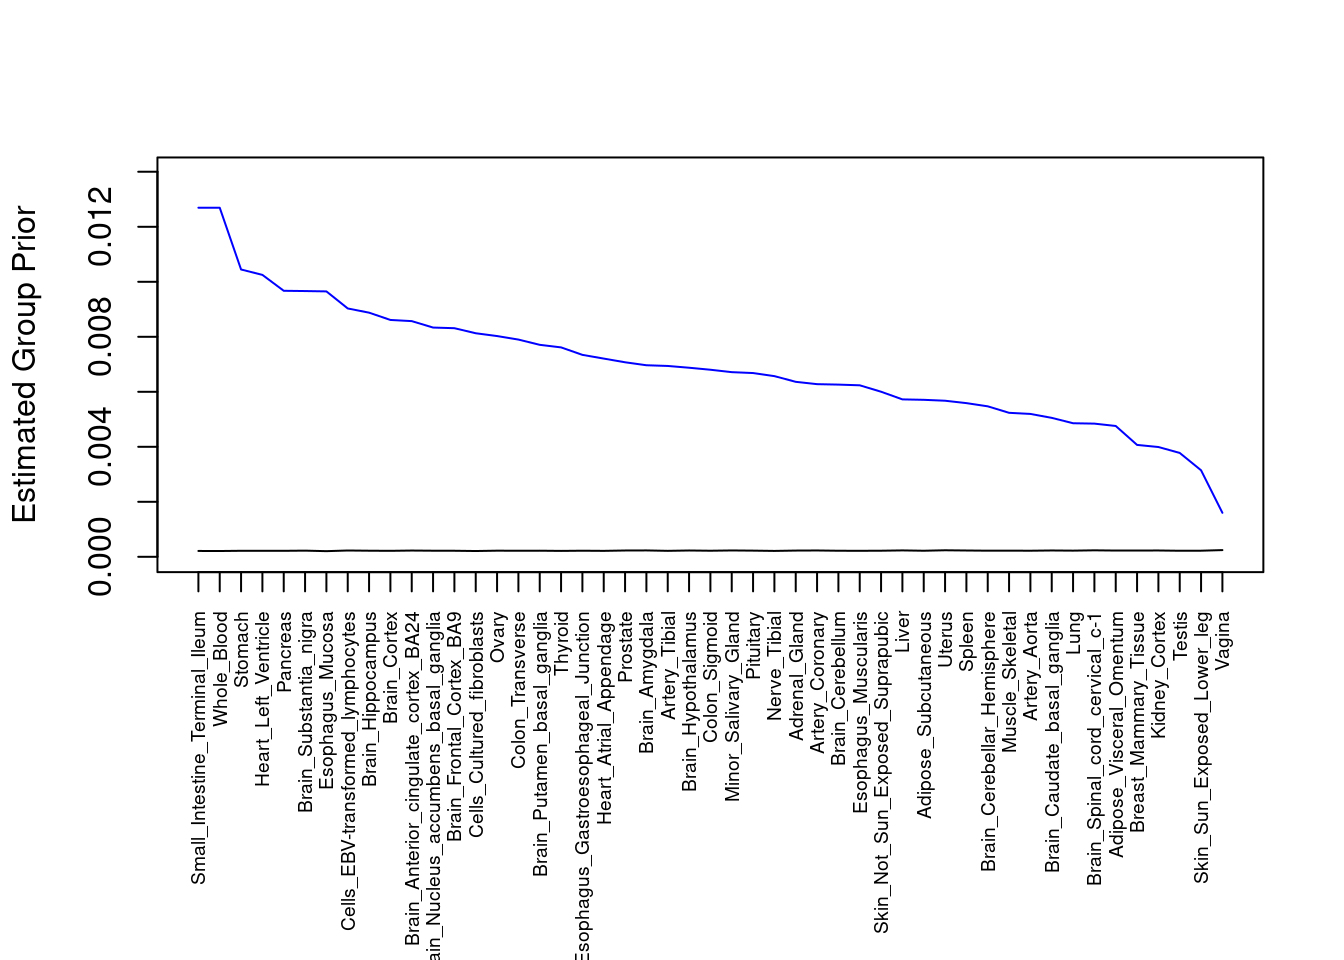
| Version | Author | Date |
|---|---|---|
| d46127d | wesleycrouse | 2022-05-24 |
####################
#plot estimated group prior variance

par(mar=c(10.1, 4.1, 4.1, 2.1))

plot(output$prior_var_g, type="l", ylim=c(0, max(output$prior_var_g, output$prior_var_s)*1.1),
     xlab="", ylab="Estimated Group Prior Variance", xaxt = "n", col="blue")
lines(output$prior_var_s)

axis(1, at = 1:nrow(output),
     labels = output$weight,
     las=2,
     cex.axis=0.6)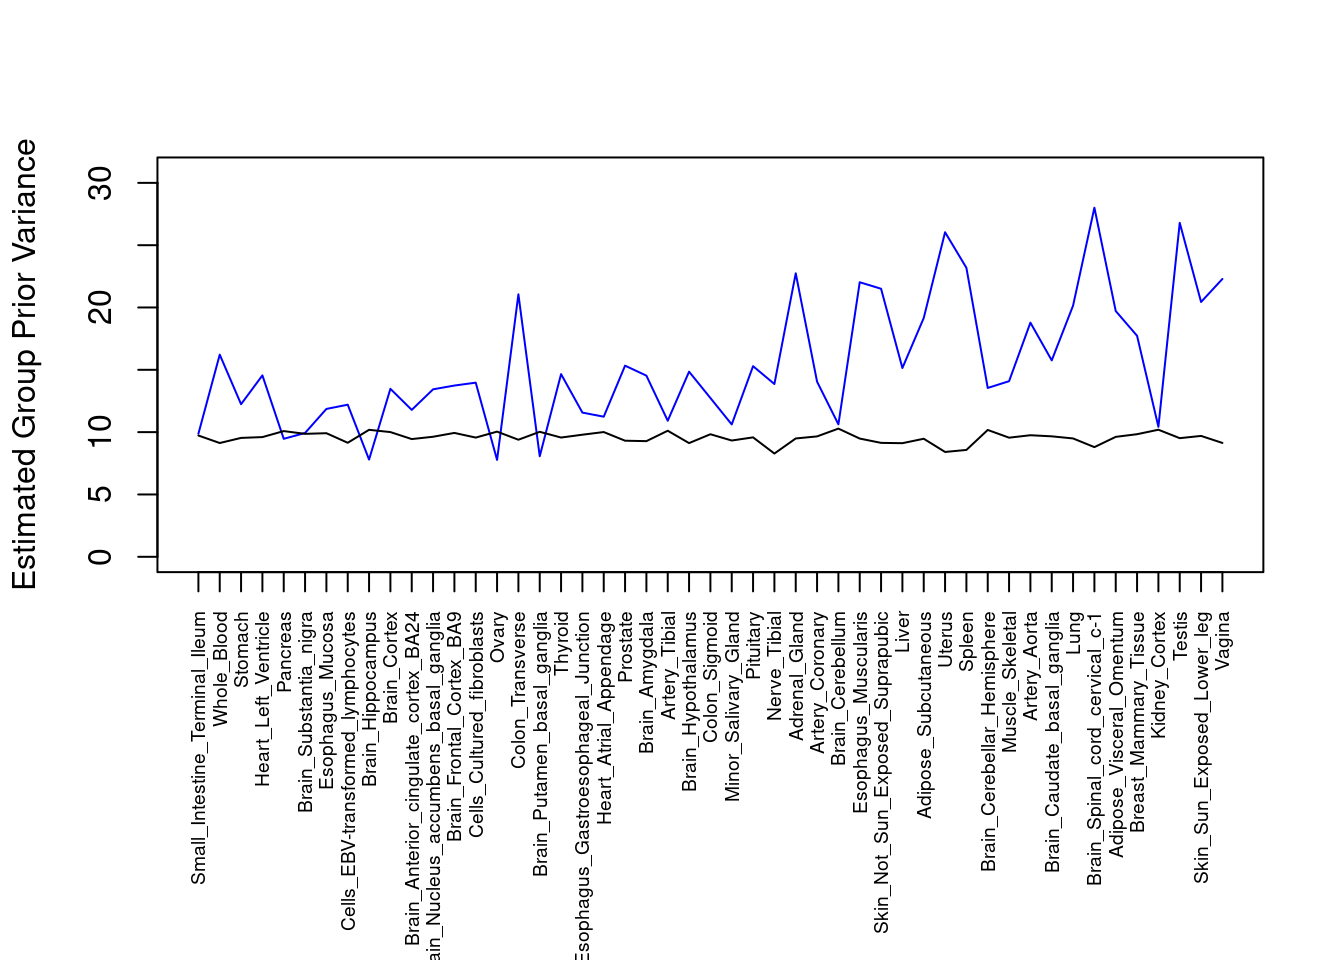
| Version | Author | Date |
|---|---|---|
| d46127d | wesleycrouse | 2022-05-24 |
####################
#plot PVE

output <- output[order(-output$pve_g),]

par(mar=c(10.1, 4.1, 4.1, 2.1))

plot(output$pve_g, type="l", ylim=c(0, max(output$pve_g+output$pve_s)*1.1),
     xlab="", ylab="Estimated PVE", xaxt = "n", col="blue")
lines(output$pve_s)
lines(output$pve_g+output$pve_s, lty=2)

axis(1, at = 1:nrow(output),
     labels = output$weight,
     las=2,
     cex.axis=0.6)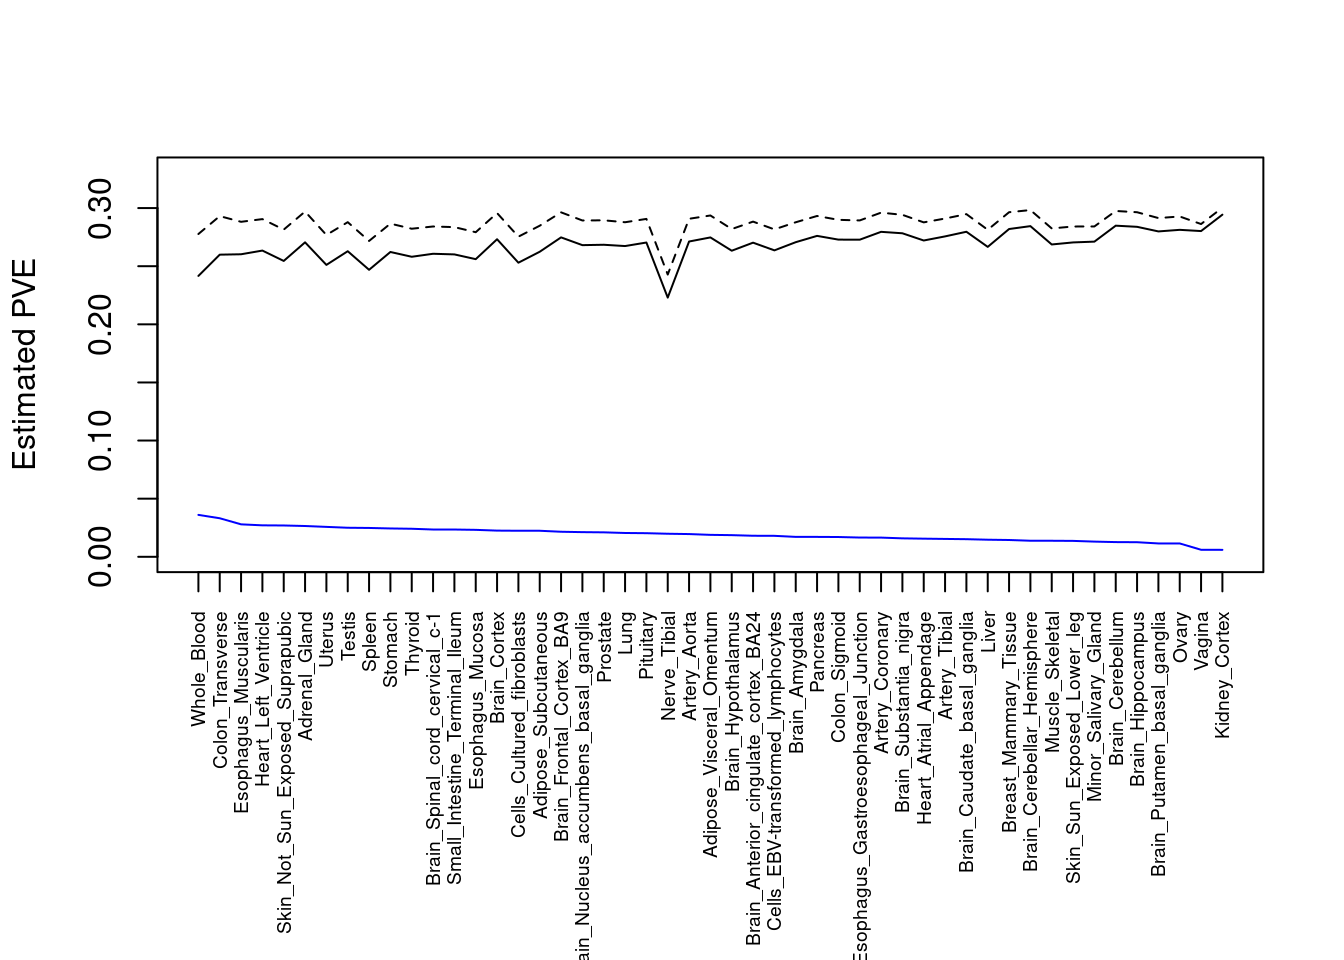
| Version | Author | Date |
|---|---|---|
| d46127d | wesleycrouse | 2022-05-24 |
Number of cTWAS and TWAS genes
cTWAS genes are the set of genes with PIP>0.8 in any tissue. TWAS genes are the set of genes with significant z score (Bonferroni within tissue) in any tissue.
#plot number of significant cTWAS and TWAS genes in each tissue
plot(output$n_ctwas, output$n_twas, xlab="Number of cTWAS Genes", ylab="Number of TWAS Genes")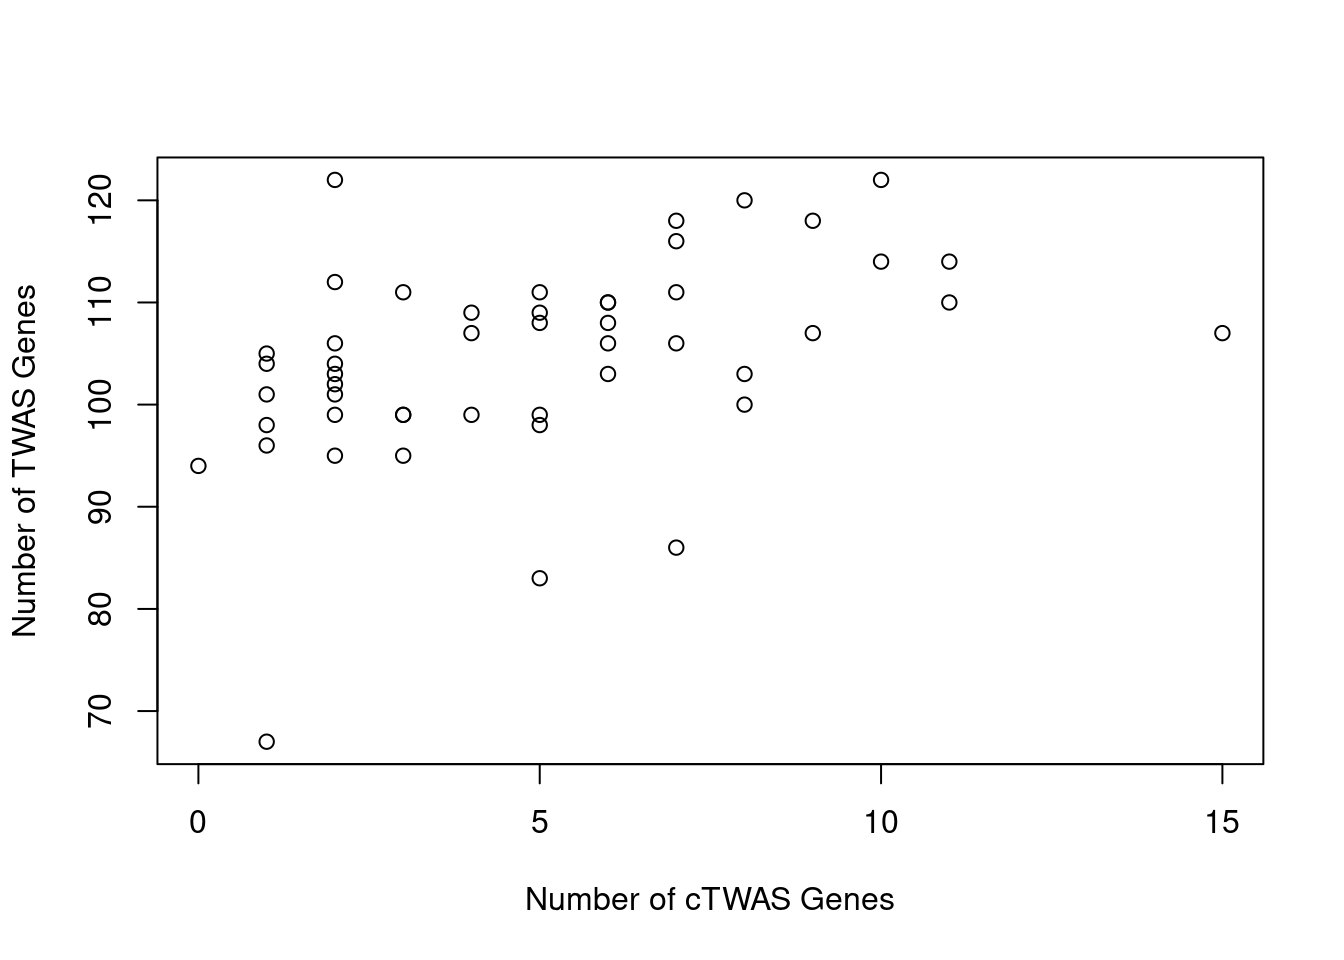
| Version | Author | Date |
|---|---|---|
| d46127d | wesleycrouse | 2022-05-24 |
#number of ctwas_genes
ctwas_genes <- unique(unlist(lapply(df, function(x){x$ctwas})))
length(ctwas_genes)
[1] 101#number of twas_genes
twas_genes <- unique(unlist(lapply(df, function(x){x$twas})))
length(twas_genes)[1] 520Enrichment analysis for cTWAS genes
GO
#enrichment for cTWAS genes using enrichR
library(enrichR)
Welcome to enrichR
Checking connection ... Enrichr ... Connection is Live!
FlyEnrichr ... Connection is available!
WormEnrichr ... Connection is available!
YeastEnrichr ... Connection is available!
FishEnrichr ... Connection is available!dbs <- c("GO_Biological_Process_2021", "GO_Cellular_Component_2021", "GO_Molecular_Function_2021")
GO_enrichment <- enrichr(ctwas_genes, dbs)Uploading data to Enrichr... Done.
Querying GO_Biological_Process_2021... Done.
Querying GO_Cellular_Component_2021... Done.
Querying GO_Molecular_Function_2021... Done.
Parsing results... Done.for (db in dbs){
cat(paste0(db, "\n\n"))
enrich_results <- GO_enrichment[[db]]
enrich_results <- enrich_results[enrich_results$Adjusted.P.value<0.05,c("Term", "Overlap", "Adjusted.P.value", "Genes")]
print(enrich_results)
print(plotEnrich(GO_enrichment[[db]]))
}GO_Biological_Process_2021
Term Overlap Adjusted.P.value Genes
1 cytokine-mediated signaling pathway (GO:0019221) 17/621 1.595928e-05 CIITA;TNFRSF6B;FCER1G;TNFSF15;CCL20;IFNGR2;STAT3;MMP9;PSMA6;MUC1;IRF3;IRF8;TNFRSF14;CCR5;HLA-DQA1;IL18R1;IP6K2
2 cellular response to cytokine stimulus (GO:0071345) 13/482 5.636910e-04 SMAD3;CCL20;IFNGR2;STAT3;MMP9;ZFP36L2;MAPK13;SBNO2;MUC1;IRF8;CCR5;IL18R1;PTPN2
3 positive regulation of cytokine production (GO:0001819) 10/335 3.054639e-03 LACC1;FCER1G;IRF3;CARD9;STAT3;PRKD2;TNFRSF14;IL18R1;CD244;MAPK13
4 regulation of receptor binding (GO:1900120) 3/10 4.418408e-03 ADAM15;HFE;MMP9
5 interferon-gamma-mediated signaling pathway (GO:0060333) 5/68 5.821798e-03 CIITA;IRF3;IFNGR2;IRF8;HLA-DQA1
6 cellular response to interferon-gamma (GO:0071346) 6/121 6.918784e-03 CIITA;IRF3;CCL20;IFNGR2;IRF8;HLA-DQA1
7 response to cytokine (GO:0034097) 6/150 1.961278e-02 CIITA;SMAD3;SMPD1;STAT3;IL18R1;PTPN2
8 positive regulation of NF-kappaB transcription factor activity (GO:0051092) 6/155 2.054121e-02 PSMA6;PRKCB;CARD9;STAT3;PRKD2;IL18R1
9 positive regulation of antigen receptor-mediated signaling pathway (GO:0050857) 3/21 2.090334e-02 PRKCB;RAB29;PRKD2
10 positive regulation of DNA-binding transcription factor activity (GO:0051091) 7/246 3.046144e-02 PSMA6;SMAD3;PRKCB;CARD9;STAT3;PRKD2;IL18R1
11 positive regulation of receptor binding (GO:1900122) 2/6 4.039442e-02 HFE;MMP9
12 cellular response to organic substance (GO:0071310) 5/123 4.039442e-02 SMAD3;LRRK2;STAT3;IL18R1;PTPN2
13 cellular response to tumor necrosis factor (GO:0071356) 6/194 4.233252e-02 PSMA6;TNFRSF6B;TNFSF15;CCL20;TNFRSF14;ZFP36L2
14 positive regulation of protein phosphorylation (GO:0001934) 8/371 4.613641e-02 EFNA1;SH2D3A;HFE;LRRK2;ITLN1;PRKD2;TNFRSF14;MMP9
15 regulation of inflammatory response (GO:0050727) 6/206 4.613641e-02 LACC1;PSMA6;SBNO2;MMP9;PTPN2;MAPK13
16 positive regulation of transcription by RNA polymerase II (GO:0045944) 13/908 4.613641e-02 CIITA;SMAD3;STAT3;POU5F1;FOSL2;SBNO2;MUC1;NR5A2;IRF3;ZGLP1;IRF8;PRKD2;ZNF300
17 regulation of T cell receptor signaling pathway (GO:0050856) 3/35 4.613641e-02 RAB29;PRKD2;PTPN2
18 neutrophil mediated immunity (GO:0002446) 9/488 4.613641e-02 TSPAN14;FCER1G;FCGR2A;CARD9;SLC2A3;ITGAV;APEH;ITGAL;MMP9
19 positive regulation of transcription, DNA-templated (GO:0045893) 15/1183 4.613641e-02 CIITA;SMAD3;STAT3;POU5F1;FOSL2;SBNO2;NR5A2;DDX39B;IRF3;ZGLP1;TFAM;IRF8;PRKD2;BRD7;ZNF300
20 MAPK cascade (GO:0000165) 7/303 4.613641e-02 PSMA6;LRRK2;RASA2;ITGAV;CCR5;ZFP36L2;MAPK13
21 negative regulation of lipid localization (GO:1905953) 2/9 4.613641e-02 ITGAV;PTPN2
22 regulation of DNA-templated transcription in response to stress (GO:0043620) 2/9 4.613641e-02 MUC1;RGS14
23 negative regulation of alpha-beta T cell activation (GO:0046636) 2/9 4.613641e-02 HFE;TNFRSF14
24 positive regulation of production of molecular mediator of immune response (GO:0002702) 3/38 4.613641e-02 LACC1;TNFRSF14;CD244
25 transmembrane receptor protein tyrosine kinase signaling pathway (GO:0007169) 8/404 4.613641e-02 EFNA1;CNKSR1;RGS14;STAT3;PRKD2;ITGAV;MMP9;PTPN2
26 negative regulation of receptor binding (GO:1900121) 2/10 4.613641e-02 ADAM15;HFE
27 negative regulation of transmembrane transport (GO:0034763) 2/10 4.613641e-02 PRKCB;OAZ3
28 immunoglobulin mediated immune response (GO:0016064) 2/10 4.613641e-02 FCER1G;CARD9
29 positive regulation of vascular endothelial growth factor receptor signaling pathway (GO:0030949) 2/10 4.613641e-02 PRKCB;PRKD2
30 T cell differentiation (GO:0030217) 3/41 4.671422e-02 FCER1G;ZFP36L2;PTPN2
31 negative regulation of mitotic cell cycle phase transition (GO:1901991) 4/92 4.750148e-02 PSMA6;GPR132;BRD7;ZFP36L2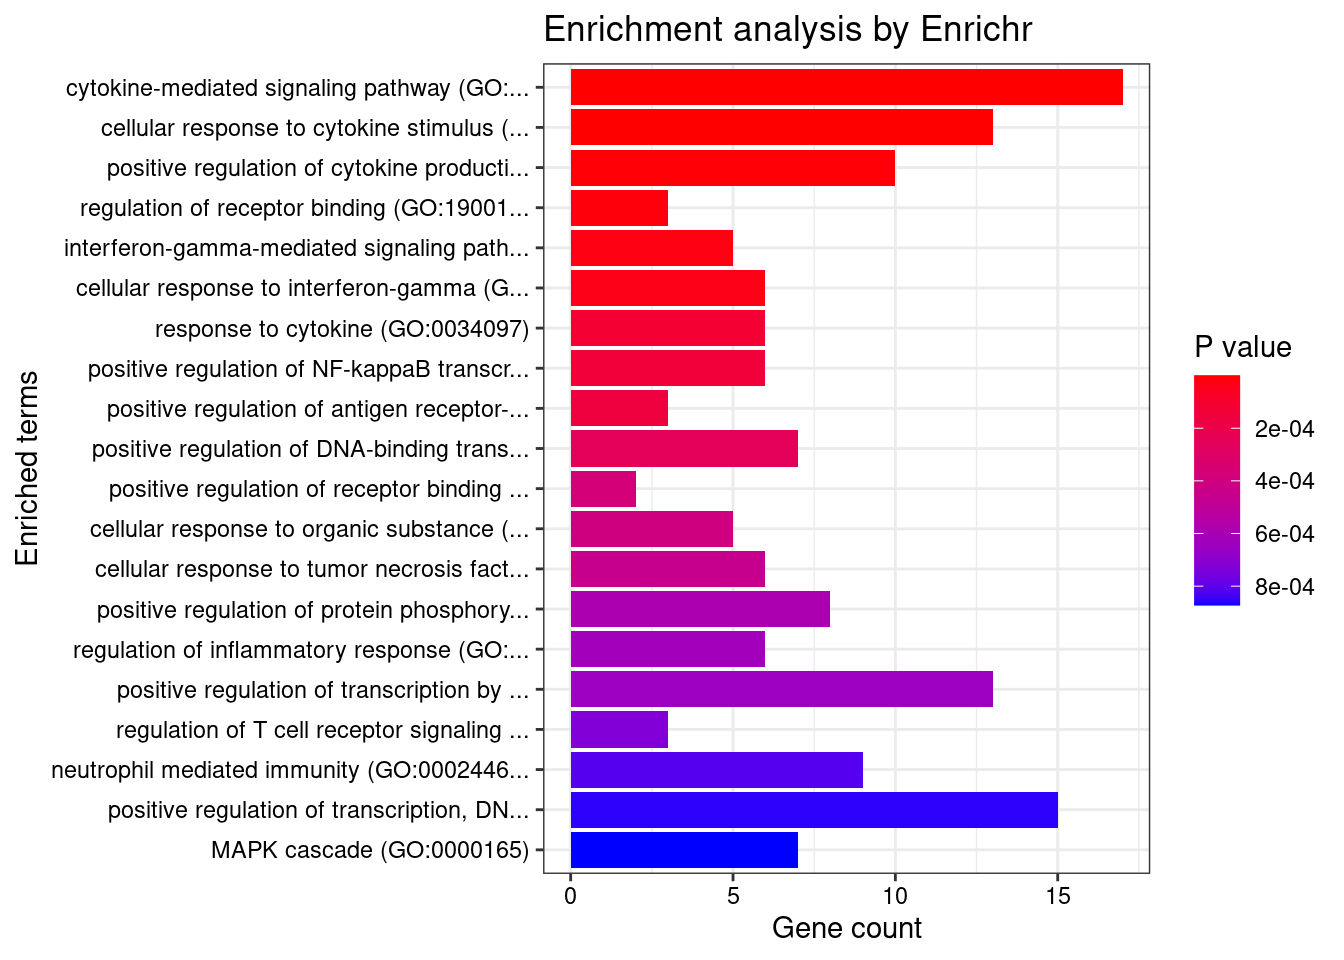
| Version | Author | Date |
|---|---|---|
| d46127d | wesleycrouse | 2022-05-24 |
GO_Cellular_Component_2021

                                       Term Overlap Adjusted.P.value                        Genes
1          MHC protein complex (GO:0042611)    4/20     0.0003235312 HLA-DMB;HFE;HLA-DOB;HLA-DQA1
2 MHC class II protein complex (GO:0042613)    3/13     0.0019986020     HLA-DMB;HLA-DOB;HLA-DQA1
3    specific granule membrane (GO:0035579)    4/91     0.0452213821   TSPAN14;SLC2A3;ITGAV;ITGAL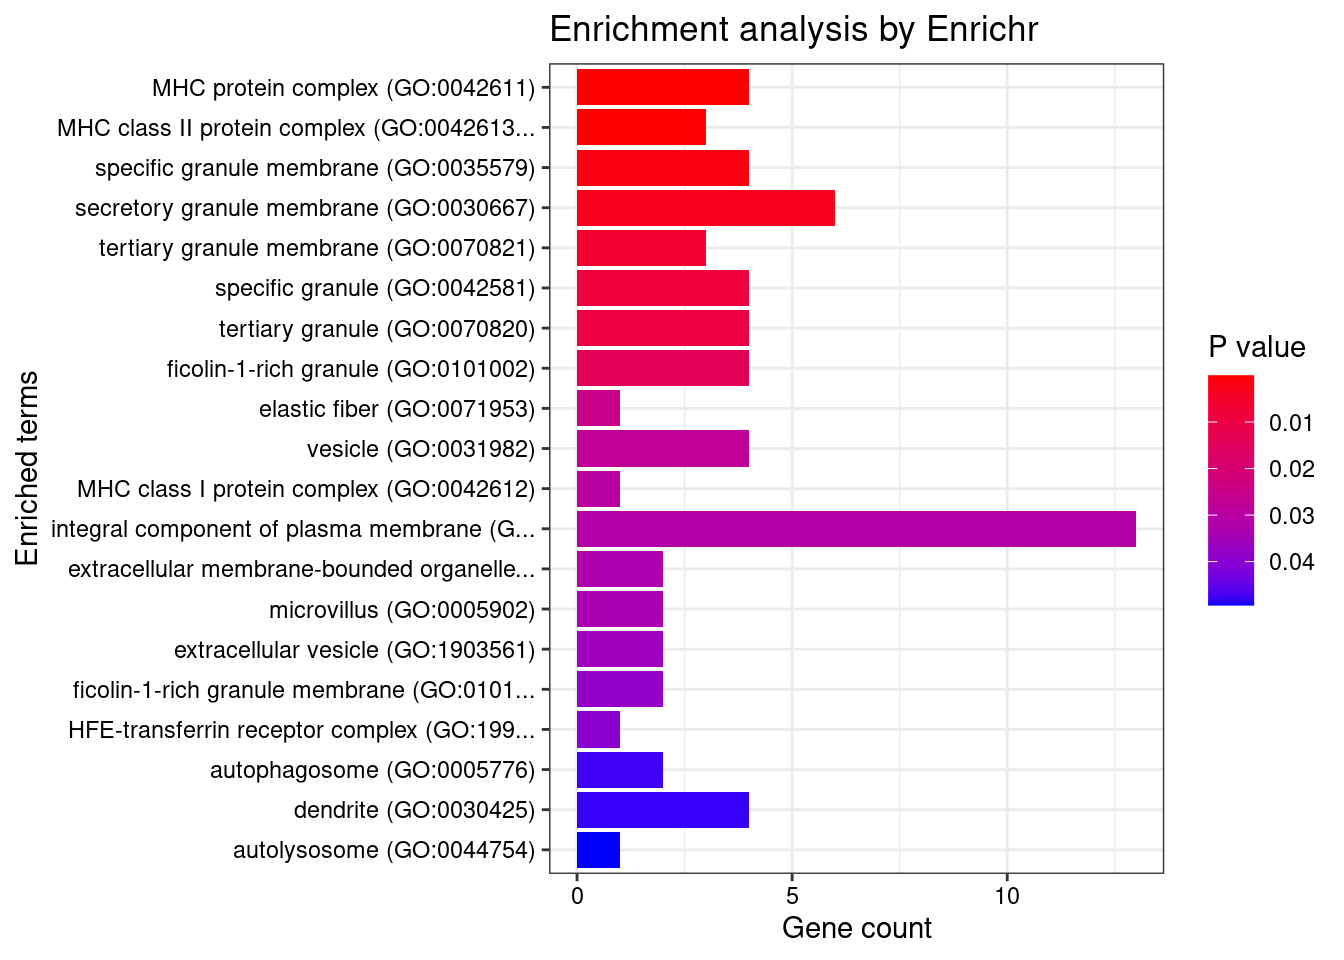
| Version | Author | Date |
|---|---|---|
| d46127d | wesleycrouse | 2022-05-24 |
GO_Molecular_Function_2021

                                                               Term Overlap Adjusted.P.value                                    Genes
1 transcription regulatory region nucleic acid binding (GO:0001067)   7/212       0.01693818 CIITA;SMAD3;NR5A2;STAT3;TFAM;BRD7;POU5F1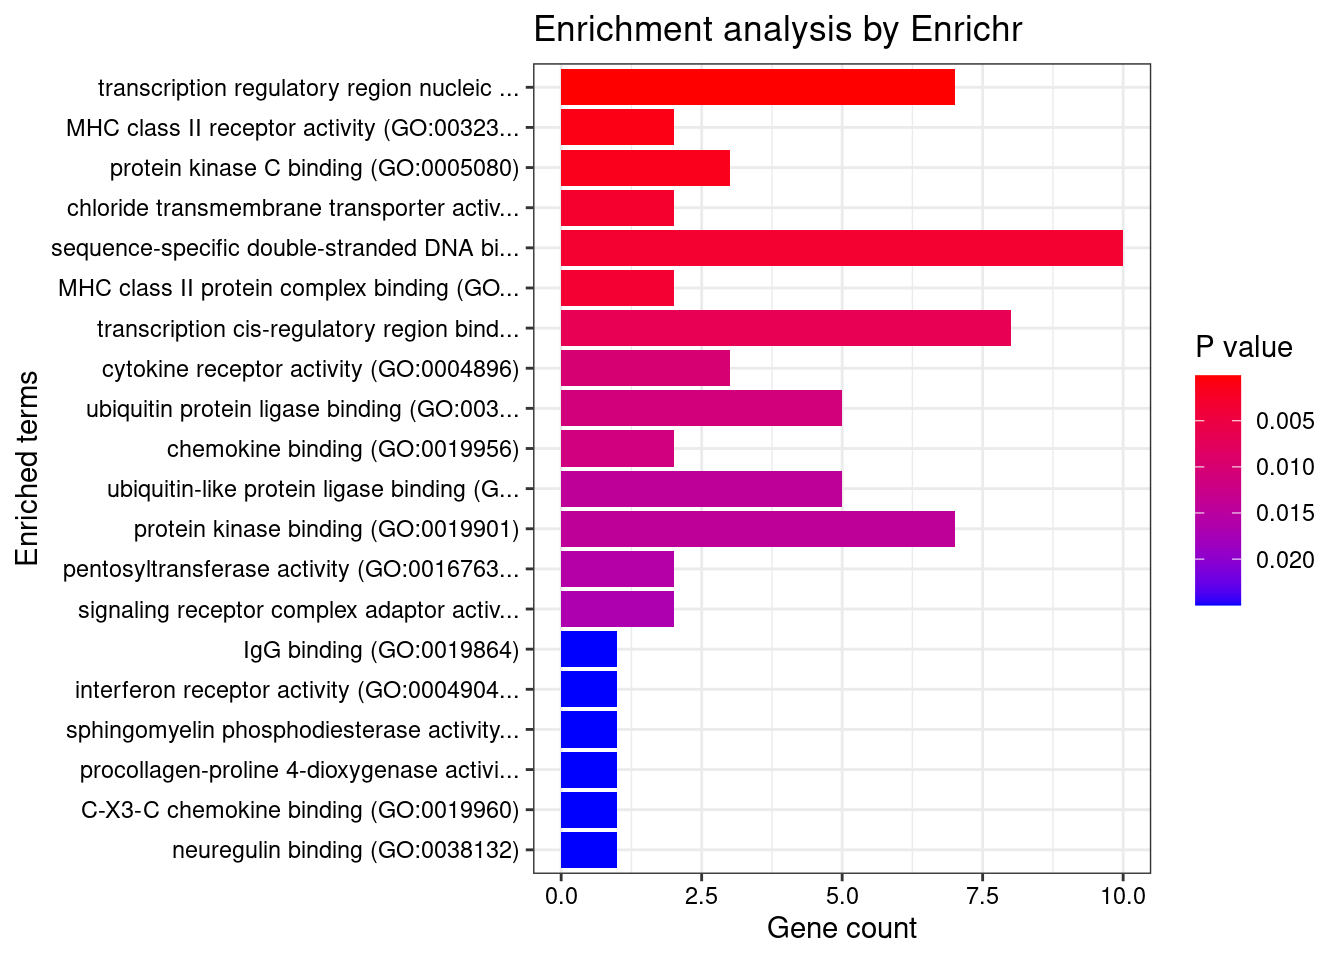
| Version | Author | Date |
|---|---|---|
| d46127d | wesleycrouse | 2022-05-24 |
KEGG
#enrichment for cTWAS genes using KEGG

library(WebGestaltR)******************************************* ** Welcome to WebGestaltR ! ** *******************************************background <- unique(unlist(lapply(df, function(x){x$gene_pips$genename})))
#listGeneSet()
databases <- c("pathway_KEGG")
enrichResult <- WebGestaltR(enrichMethod="ORA", organism="hsapiens",
interestGene=ctwas_genes, referenceGene=background,
enrichDatabase=databases, interestGeneType="genesymbol",
referenceGeneType="genesymbol", isOutput=F)Loading the functional categories...
Loading the ID list...
Loading the reference list...
Performing the enrichment analysis...enrichResult[,c("description", "size", "overlap", "FDR", "userId")] description size overlap FDR userId
1 Inflammatory bowel disease (IBD) 57 7 7.018795e-05 HLA-DQA1;IL18R1;STAT3;IFNGR2;HLA-DOB;HLA-DMB;SMAD3
2 Tuberculosis 157 10 7.018795e-05 HLA-DQA1;CARD9;LSP1;CIITA;FCGR2A;MAPK13;FCER1G;IFNGR2;HLA-DOB;HLA-DMB
3 Leishmaniasis 64 7 7.830541e-05 HLA-DQA1;FCGR2A;MAPK13;PRKCB;IFNGR2;HLA-DOB;HLA-DMB
4 Toxoplasmosis 104 8 1.366240e-04 HLA-DQA1;CIITA;MAPK13;STAT3;IFNGR2;HLA-DOB;HLA-DMB;CCR5
5 Influenza A 150 9 1.869865e-04 HLA-DQA1;CIITA;MAPK13;PRKCB;IFNGR2;DDX39B;HLA-DOB;HLA-DMB;IRF3
6 Th17 cell differentiation 97 7 6.578834e-04 HLA-DQA1;MAPK13;STAT3;IFNGR2;HLA-DOB;HLA-DMB;SMAD3
7 Asthma 25 4 2.069882e-03 HLA-DQA1;FCER1G;HLA-DOB;HLA-DMB
8 Staphylococcus aureus infection 51 5 2.187419e-03 HLA-DQA1;FCGR2A;ITGAL;HLA-DOB;HLA-DMB
9 Rheumatoid arthritis 80 5 1.661500e-02 HLA-DQA1;CCL20;ITGAL;HLA-DOB;HLA-DMB
10 Th1 and Th2 cell differentiation 84 5 1.847838e-02 HLA-DQA1;MAPK13;IFNGR2;HLA-DOB;HLA-DMB
11 Epstein-Barr virus infection 181 7 1.847838e-02 HLA-DQA1;MAPK13;ITGAL;STAT3;HLA-DOB;HLA-DMB;IRF3
12 Viral myocarditis 54 4 2.530155e-02 HLA-DQA1;ITGAL;HLA-DOB;HLA-DMB
13 Antigen processing and presentation 59 4 3.260623e-02 HLA-DQA1;CIITA;HLA-DOB;HLA-DMB
14 Natural killer cell mediated cytotoxicity 105 5 3.673555e-02 PRKCB;FCER1G;ITGAL;IFNGR2;CD244
15 Herpes simplex infection 162 6 4.125012e-02 HLA-DQA1;TNFRSF14;IFNGR2;HLA-DOB;HLA-DMB;IRF3
16 Allograft rejection 32 3 4.125012e-02 HLA-DQA1;HLA-DOB;HLA-DMB
17 Graft-versus-host disease 32 3 4.125012e-02 HLA-DQA1;HLA-DOB;HLA-DMBDisGeNET
#enrichment for cTWAS genes using DisGeNET
# devtools::install_bitbucket("ibi_group/disgenet2r")
library(disgenet2r)
disgenet_api_key <- get_disgenet_api_key(
email = "wesleycrouse@gmail.com",
password = "uchicago1" )
Sys.setenv(DISGENET_API_KEY= disgenet_api_key)
res_enrich <- disease_enrichment(entities=ctwas_genes, vocabulary = "HGNC", database = "CURATED")RAB29 gene(s) from the input list not found in DisGeNET CURATEDPRM3 gene(s) from the input list not found in DisGeNET CURATEDADAM15 gene(s) from the input list not found in DisGeNET CURATEDRNF186 gene(s) from the input list not found in DisGeNET CURATEDTTPAL gene(s) from the input list not found in DisGeNET CURATEDRP11-973H7.1 gene(s) from the input list not found in DisGeNET CURATEDFGFR1OP gene(s) from the input list not found in DisGeNET CURATEDNDFIP1 gene(s) from the input list not found in DisGeNET CURATEDHLA-DMB gene(s) from the input list not found in DisGeNET CURATEDTSPAN14 gene(s) from the input list not found in DisGeNET CURATEDBIK gene(s) from the input list not found in DisGeNET CURATEDTNFRSF6B gene(s) from the input list not found in DisGeNET CURATEDRP11-542M13.2 gene(s) from the input list not found in DisGeNET CURATEDCASC3 gene(s) from the input list not found in DisGeNET CURATEDLINC01700 gene(s) from the input list not found in DisGeNET CURATEDPOM121C gene(s) from the input list not found in DisGeNET CURATEDLINC01126 gene(s) from the input list not found in DisGeNET CURATEDRP11-373D23.3 gene(s) from the input list not found in DisGeNET CURATEDZNF300 gene(s) from the input list not found in DisGeNET CURATEDUBE2W gene(s) from the input list not found in DisGeNET CURATEDNPIPB3 gene(s) from the input list not found in DisGeNET CURATEDAP006621.5 gene(s) from the input list not found in DisGeNET CURATEDRP11-386E5.1 gene(s) from the input list not found in DisGeNET CURATEDDDX39B gene(s) from the input list not found in DisGeNET CURATEDBRD7 gene(s) from the input list not found in DisGeNET CURATEDNPEPPS gene(s) from the input list not found in DisGeNET CURATEDRGS14 gene(s) from the input list not found in DisGeNET CURATEDAC007383.3 gene(s) from the input list not found in DisGeNET CURATEDCDH24 gene(s) from the input list not found in DisGeNET CURATEDC10orf105 gene(s) from the input list not found in DisGeNET CURATEDHLA-DOB gene(s) from the input list not found in DisGeNET CURATEDGPR132 gene(s) from the input list not found in DisGeNET CURATEDSDCCAG3 gene(s) from the input list not found in DisGeNET CURATEDAPEH gene(s) from the input list not found in DisGeNET CURATEDCPEB4 gene(s) from the input list not found in DisGeNET CURATEDPLEKHH2 gene(s) from the input list not found in DisGeNET CURATEDRP11-107M16.2 gene(s) from the input list not found in DisGeNET CURATEDZGLP1 gene(s) from the input list not found in DisGeNET CURATEDOAZ3 gene(s) from the input list not found in DisGeNET CURATEDOSER1 gene(s) from the input list not found in DisGeNET CURATEDif (any(res_enrich@qresult$FDR < 0.05)){
print(res_enrich@qresult[res_enrich@qresult$FDR < 0.05, c("Description", "FDR", "Ratio", "BgRatio")])
} Description FDR Ratio BgRatio
44 Ulcerative Colitis 2.602363e-09 10/61 63/9703
49 Crohn Disease 1.806271e-04 6/61 50/9703
9 Aortic Aneurysm 1.586526e-03 3/61 7/9703
95 Inflammatory Bowel Diseases 9.372454e-03 4/61 35/9703
13 Rheumatoid Arthritis 1.035289e-02 7/61 174/9703
226 Crohn's disease of large bowel 1.035289e-02 4/61 44/9703
277 Crohn's disease of the ileum 1.035289e-02 4/61 44/9703
367 Regional enteritis 1.035289e-02 4/61 44/9703
438 IIeocolitis 1.035289e-02 4/61 44/9703
216 Juvenile-Onset Still Disease 1.128950e-02 6/61 135/9703
107 Leukemia, T-Cell 1.935432e-02 2/61 5/9703
158 Pancreatic Neoplasm 1.935432e-02 5/61 100/9703
327 Malignant neoplasm of pancreas 1.957610e-02 5/61 102/9703
99 Lead Poisoning 3.121478e-02 2/61 7/9703
518 Juvenile pauciarticular chronic arthritis 3.121478e-02 2/61 7/9703
539 Juvenile arthritis 4.164639e-02 5/61 131/9703
546 Juvenile psoriatic arthritis 4.164639e-02 5/61 131/9703
574 Polyarthritis, Juvenile, Rheumatoid Factor Negative 4.164639e-02 5/61 131/9703
576 Polyarthritis, Juvenile, Rheumatoid Factor Positive 4.164639e-02 5/61 131/9703
8 Anovulation 4.776763e-02 1/61 1/9703
57 Diabetes Mellitus, Insulin-Dependent 4.776763e-02 3/61 45/9703
62 Enteritis 4.776763e-02 1/61 1/9703
78 Hepatitis C 4.776763e-02 2/61 15/9703
85 Huntington Disease 4.776763e-02 2/61 17/9703
145 Embryonal Neoplasm 4.776763e-02 2/61 15/9703
146 Neoplasms, Germ Cell and Embryonal 4.776763e-02 2/61 15/9703
150 Niemann-Pick Diseases 4.776763e-02 1/61 1/9703
173 Pulmonary Emphysema 4.776763e-02 2/61 17/9703
201 West Nile Fever 4.776763e-02 1/61 1/9703
243 Diabetes, Autoimmune 4.776763e-02 3/61 44/9703
246 Germ cell tumor 4.776763e-02 2/61 15/9703
247 Neoplasms, Embryonal and Mixed 4.776763e-02 2/61 15/9703
278 Congenital chloride diarrhea 4.776763e-02 1/61 1/9703
279 Niemann-Pick Disease, Type A 4.776763e-02 1/61 1/9703
280 Niemann-Pick Disease, Type B 4.776763e-02 1/61 1/9703
281 Niemann-Pick Disease, Type E 4.776763e-02 1/61 1/9703
324 Brittle diabetes 4.776763e-02 3/61 44/9703
369 Germ Cell Cancer 4.776763e-02 2/61 15/9703
397 Cancer, Embryonal 4.776763e-02 2/61 15/9703
398 Cancer, Embryonal and Mixed 4.776763e-02 2/61 15/9703
407 Encephalitis, West Nile Fever 4.776763e-02 1/61 1/9703
408 West Nile Fever Meningitis 4.776763e-02 1/61 1/9703
409 West Nile Fever Meningoencephalitis 4.776763e-02 1/61 1/9703
410 West Nile Fever Myelitis 4.776763e-02 1/61 1/9703
441 Gestational Trophoblastic Neoplasms 4.776763e-02 1/61 1/9703
463 Deep seated dermatophytosis 4.776763e-02 1/61 1/9703
467 Chronic Lymphoproliferative Disorder of NK-Cells 4.776763e-02 1/61 1/9703
485 PARKINSON DISEASE 8 (disorder) 4.776763e-02 1/61 1/9703
493 Bare Lymphocyte Syndrome, Type II, Complementation Group A 4.776763e-02 1/61 1/9703
494 Medullary cystic kidney disease 1 4.776763e-02 1/61 1/9703
501 Inflammatory Bowel Disease 10 4.776763e-02 1/61 1/9703
509 MICROVASCULAR COMPLICATIONS OF DIABETES, SUSCEPTIBILITY TO, 7 (finding) 4.776763e-02 1/61 1/9703
510 DIABETES MELLITUS, INSULIN-DEPENDENT, 22 (disorder) 4.776763e-02 1/61 1/9703
514 Waardenburg Syndrome, Type 4b 4.776763e-02 1/61 1/9703
515 Metaphyseal Anadysplasia 2 4.776763e-02 1/61 1/9703
516 Neutropenia and hyperlymphocytosis with large granular lymphocytes 4.776763e-02 1/61 1/9703
520 Gestational trophoblastic disease 4.776763e-02 1/61 1/9703
526 Mycobacterium tuberculosis, susceptibility to infection by 4.776763e-02 1/61 1/9703
529 HIRSCHSPRUNG DISEASE, SUSCEPTIBILITY TO, 4 4.776763e-02 1/61 1/9703
530 LOEYS-DIETZ SYNDROME 3 4.776763e-02 1/61 1/9703
534 CUTIS LAXA, AUTOSOMAL RECESSIVE, TYPE IB 4.776763e-02 1/61 1/9703
538 Hyper-Ige Recurrent Infection Syndrome, Autosomal Dominant 4.776763e-02 1/61 1/9703
547 IMMUNODEFICIENCY 32A 4.776763e-02 1/61 1/9703
548 SHORT-RIB THORACIC DYSPLASIA 10 WITH OR WITHOUT POLYDACTYLY 4.776763e-02 1/61 1/9703
549 Diabetes Mellitus, Ketosis-Prone 4.776763e-02 3/61 44/9703
551 IMMUNODEFICIENCY 28 4.776763e-02 1/61 1/9703
552 AUTOIMMUNE DISEASE, MULTISYSTEM, INFANTILE-ONSET, 1 4.776763e-02 1/61 1/9703
553 IMMUNODEFICIENCY 32B 4.776763e-02 1/61 1/9703
556 EPILEPSY, IDIOPATHIC GENERALIZED, SUSCEPTIBILITY TO, 14 4.776763e-02 1/61 1/9703
557 EPILEPTIC ENCEPHALOPATHY, EARLY INFANTILE, 34 4.776763e-02 1/61 1/9703
558 ENCEPHALOPATHY, ACUTE, INFECTION-INDUCED (HERPES-SPECIFIC), SUSCEPTIBILITY TO, 7 4.776763e-02 1/61 1/9703
559 RETINITIS PIGMENTOSA 71 4.776763e-02 1/61 1/9703
560 SPASTIC PARAPLEGIA 73, AUTOSOMAL DOMINANT 4.776763e-02 1/61 1/9703
564 MYOPIA 25, AUTOSOMAL DOMINANT 4.776763e-02 1/61 1/9703
565 MITOCHONDRIAL DNA DEPLETION SYNDROME 15 (HEPATOCEREBRAL TYPE) 4.776763e-02 1/61 1/9703
575 Diabetes Mellitus, Sudden-Onset 4.776763e-02 3/61 44/9703
583 HYPER-IgE RECURRENT INFECTION SYNDROME 1, AUTOSOMAL DOMINANT 4.776763e-02 1/61 1/9703Gene sets curated by Macarthur Lab
gene_set_dir <- "/project2/mstephens/wcrouse/gene_sets/"
gene_set_files <- c("gwascatalog.tsv",
"mgi_essential.tsv",
"core_essentials_hart.tsv",
"clinvar_path_likelypath.tsv",
"fda_approved_drug_targets.tsv")
gene_sets <- lapply(gene_set_files, function(x){as.character(read.table(paste0(gene_set_dir, x))[,1])})
names(gene_sets) <- sapply(gene_set_files, function(x){unlist(strsplit(x, "[.]"))[1]})
gene_lists <- list(ctwas_genes=ctwas_genes)
#background is union of genes analyzed in all tissue
background <- unique(unlist(lapply(df, function(x){x$gene_pips$genename})))
#genes in gene_sets filtered to ensure inclusion in background
gene_sets <- lapply(gene_sets, function(x){x[x %in% background]})
####################
hyp_score <- data.frame()
size <- c()
ngenes <- c()
for (i in 1:length(gene_sets)) {
for (j in 1:length(gene_lists)){
group1 <- length(gene_sets[[i]])
group2 <- length(as.vector(gene_lists[[j]]))
size <- c(size, group1)
Overlap <- length(intersect(gene_sets[[i]],as.vector(gene_lists[[j]])))
ngenes <- c(ngenes, Overlap)
Total <- length(background)
hyp_score[i,j] <- phyper(Overlap-1, group2, Total-group2, group1,lower.tail=F)
}
}
rownames(hyp_score) <- names(gene_sets)
colnames(hyp_score) <- names(gene_lists)
hyp_score_padj <- apply(hyp_score,2, p.adjust, method="BH", n=(nrow(hyp_score)*ncol(hyp_score)))
hyp_score_padj <- as.data.frame(hyp_score_padj)
hyp_score_padj$gene_set <- rownames(hyp_score_padj)
hyp_score_padj$nset <- size
hyp_score_padj$ngenes <- ngenes
hyp_score_padj$percent <- ngenes/size
hyp_score_padj <- hyp_score_padj[order(hyp_score_padj$ctwas_genes),]
colnames(hyp_score_padj)[1] <- "padj"
hyp_score_padj <- hyp_score_padj[,c(2:5,1)]
rownames(hyp_score_padj)<- NULL
hyp_score_padj gene_set nset ngenes percent padj
1 gwascatalog 5969 56 0.009381806 1.616742e-08
2 mgi_essential 2304 20 0.008680556 1.112790e-02
3 fda_approved_drug_targets 352 5 0.014204545 4.098206e-02
4 clinvar_path_likelypath 2771 19 0.006856730 6.660608e-02
5 core_essentials_hart 265 1 0.003773585 7.123894e-01Enrichment analysis for TWAS genes
#enrichment for TWAS genes
dbs <- c("GO_Biological_Process_2021", "GO_Cellular_Component_2021", "GO_Molecular_Function_2021")
GO_enrichment <- enrichr(twas_genes, dbs)Uploading data to Enrichr... Done.
Querying GO_Biological_Process_2021... Done.
Querying GO_Cellular_Component_2021... Done.
Querying GO_Molecular_Function_2021... Done.
Parsing results... Done.for (db in dbs){
cat(paste0(db, "\n\n"))
enrich_results <- GO_enrichment[[db]]
enrich_results <- enrich_results[enrich_results$Adjusted.P.value<0.05,c("Term", "Overlap", "Adjusted.P.value", "Genes")]
print(enrich_results)
print(plotEnrich(GO_enrichment[[db]]))
}GO_Biological_Process_2021
Term Overlap Adjusted.P.value Genes
1 cytokine-mediated signaling pathway (GO:0019221) 64/621 7.876884e-18 CSF3;CIITA;CD40;TNFRSF6B;IL23R;RORC;IL27;IFI35;IL18RAP;PSMD3;MAP3K8;JAK2;FCER1G;GPR35;IL1R1;IFNGR2;IL1R2;IL13;HLA-B;HLA-C;TYK2;HLA-G;MMP9;PSMA6;IRF1;LTA;IRF8;IRF6;HLA-DQB2;HLA-DQB1;CCL13;NUMBL;CAMK2A;PDGFB;CUL1;NOD2;IL1RL1;MUC1;BCL2L11;SOCS1;CXCR2;TNFRSF14;HLA-DQA2;CAMK2G;HLA-DQA1;IL12RB2;IP6K2;STAT5A;STAT5B;HLA-DRB5;CCL20;TNFSF15;STAT3;LIF;PSMB9;IL4;POMC;IL2RA;HLA-DPB1;HLA-DRA;TNFSF8;TRIM31;HLA-DRB1;IL18R1
2 interferon-gamma-mediated signaling pathway (GO:0060333) 20/68 4.884378e-13 CIITA;HLA-DRB5;IFNGR2;CAMK2A;HLA-B;HLA-C;HLA-G;IRF1;HLA-DPB1;IRF8;HLA-DRA;IRF6;JAK2;TRIM31;CAMK2G;HLA-DQA2;HLA-DQB2;HLA-DQA1;HLA-DRB1;HLA-DQB1
3 cellular response to interferon-gamma (GO:0071346) 24/121 6.385127e-12 CCL13;HLA-DRB5;CIITA;CCL20;IFNGR2;CAMK2A;HLA-B;HLA-C;HLA-G;AIF1;IRF1;HLA-DPB1;HLA-DRA;IRF8;IRF6;JAK2;TRIM31;HLA-DQA2;CAMK2G;HLA-DQA1;HLA-DRB1;SLC26A6;HLA-DQB2;HLA-DQB1
4 cellular response to cytokine stimulus (GO:0071345) 38/482 9.581725e-07 CCL13;CSF3;NUMBL;CD40;IL23R;GBA;RORC;AIF1;ZFP36L2;ZFP36L1;MUC1;BCL2L11;SOCS1;HYAL1;JAK2;IL12RB2;STAT5A;STAT5B;SMAD3;CCL20;IL1R1;IFNGR2;IL1R2;STAT3;IL13;LIF;TYK2;MMP9;IRGM;RHOA;IL4;POMC;IL2RA;IRF1;IRF8;SLC26A6;PTPN2;IL18R1
5 antigen processing and presentation of exogenous peptide antigen via MHC class II (GO:0019886) 16/98 2.512845e-06 HLA-DRB5;FCER1G;KIF11;HLA-DMA;HLA-DMB;HLA-DPB1;HLA-DRA;HLA-DOA;FCGR2B;HLA-DOB;HLA-DQA2;AP1M2;HLA-DQA1;HLA-DRB1;HLA-DQB2;HLA-DQB1
6 antigen processing and presentation of peptide antigen via MHC class II (GO:0002495) 16/100 2.834527e-06 HLA-DRB5;FCER1G;KIF11;HLA-DMA;HLA-DMB;HLA-DPB1;HLA-DRA;HLA-DOA;FCGR2B;HLA-DOB;HLA-DQA2;AP1M2;HLA-DQA1;HLA-DRB1;HLA-DQB2;HLA-DQB1
7 antigen processing and presentation of exogenous peptide antigen (GO:0002478) 16/103 3.773011e-06 HLA-DRB5;FCER1G;KIF11;HLA-DMA;HLA-DMB;HLA-DPB1;HLA-DRA;HLA-DOA;FCGR2B;HLA-DOB;HLA-DQA2;AP1M2;HLA-DQA1;HLA-DRB1;HLA-DQB2;HLA-DQB1
8 antigen processing and presentation of endogenous peptide antigen (GO:0002483) 6/14 2.571855e-04 ERAP2;TAP2;TAP1;HLA-DRA;HLA-G;HLA-DRB1
9 antigen receptor-mediated signaling pathway (GO:0050851) 18/185 5.175565e-04 DENND1B;HLA-DRB5;PRKCB;CUL1;BTNL2;LIME1;PSMB9;PSMA6;PSMD3;HLA-DPB1;HLA-DRA;HLA-DQA2;ICOSLG;HLA-DQA1;HLA-DRB1;LAT;HLA-DQB2;HLA-DQB1
10 positive regulation of cytokine production (GO:0001819) 25/335 7.077114e-04 PTGER4;CD40;IL23R;IL27;PARK7;NOD2;AGPAT1;LY9;AIF1;POLR2E;TNFRSF14;IL12RB2;FCER1G;IL1R1;IL13;CARD9;STAT3;HLA-G;IL4;LACC1;CD6;IRF1;HLA-DPB1;IL18R1;CD244
11 T cell receptor signaling pathway (GO:0050852) 16/158 9.449894e-04 DENND1B;HLA-DRB5;CUL1;BTNL2;PSMB9;PSMA6;PSMD3;HLA-DPB1;HLA-DRA;HLA-DQA2;ICOSLG;HLA-DQA1;HLA-DRB1;LAT;HLA-DQB2;HLA-DQB1
12 regulation of immune response (GO:0050776) 17/179 1.043595e-03 DENND1B;CD40;ITGA4;HLA-B;HLA-C;ICAM5;HLA-G;ADCY7;IL4;FCGR3A;NCR3;FCGR2A;IRF1;HLA-DRA;FCGR2B;HLA-DRB1;MICB
13 antigen processing and presentation of exogenous peptide antigen via MHC class I (GO:0042590) 11/78 1.116685e-03 PSMA6;FCER1G;PSMD3;HLA-B;TAP2;HLA-C;TAP1;ITGAV;LNPEP;HLA-G;PSMB9
14 peptide antigen assembly with MHC protein complex (GO:0002501) 4/6 1.265754e-03 HLA-DMA;HLA-DMB;HLA-DRA;HLA-DRB1
15 antigen processing and presentation of peptide antigen via MHC class I (GO:0002474) 7/33 3.080482e-03 FCER1G;ERAP2;HLA-B;TAP2;HLA-C;TAP1;HLA-G
16 regulation of response to interferon-gamma (GO:0060330) 5/14 3.080482e-03 SOCS1;IFNGR2;CDC37;JAK2;PTPN2
17 immune response-regulating cell surface receptor signaling pathway (GO:0002768) 5/14 3.080482e-03 BAG6;CD40;NCR3;HLA-G;MICB
18 regulation of interferon-gamma-mediated signaling pathway (GO:0060334) 6/23 3.147680e-03 SOCS1;IFNGR2;CDC37;JAK2;IRGM;PTPN2
19 regulation of T cell proliferation (GO:0042129) 10/76 3.806385e-03 IL4;HLA-DMB;CD6;IL23R;HLA-DPB1;IL27;TNFSF8;HLA-G;AIF1;HLA-DRB1
20 antigen processing and presentation of exogenous peptide antigen via MHC class I, TAP-independent (GO:0002480) 4/8 3.966252e-03 HLA-B;HLA-C;LNPEP;HLA-G
21 regulation of MAP kinase activity (GO:0043405) 11/97 5.260685e-03 CD40;EDN3;RGS14;LRRK2;GBA;ERBB2;PDGFB;MST1R;NOD2;TRIB1;LIME1
22 cellular response to type I interferon (GO:0071357) 9/65 5.260685e-03 IRF1;HLA-B;HLA-C;IRF8;IFI35;TYK2;IRF6;HLA-G;IP6K2
23 type I interferon signaling pathway (GO:0060337) 9/65 5.260685e-03 IRF1;HLA-B;HLA-C;IRF8;IFI35;TYK2;IRF6;HLA-G;IP6K2
24 cellular response to tumor necrosis factor (GO:0071356) 16/194 5.593924e-03 CCL13;CD40;TNFRSF6B;TNFSF15;CCL20;GBA;ZFP36L2;PSMB9;ZFP36L1;PSMA6;HYAL1;PSMD3;LTA;TNFSF8;TNFRSF14;JAK2
25 interleukin-23-mediated signaling pathway (GO:0038155) 4/9 5.593924e-03 IL23R;STAT3;TYK2;JAK2
26 regulation of immune effector process (GO:0002697) 8/53 6.570833e-03 C4B;C4A;C7;HLA-DRA;FCGR2B;CFB;HLA-DRB1;C2
27 regulation of B cell activation (GO:0050864) 6/28 7.012653e-03 IL4;NOD2;FCGR2B;IKZF3;ZFP36L2;ZFP36L1
28 antigen processing and presentation of exogenous peptide antigen via MHC class I, TAP-dependent (GO:0002479) 9/73 1.092112e-02 PSMA6;PSMD3;HLA-B;TAP2;HLA-C;TAP1;ITGAV;HLA-G;PSMB9
29 B cell mediated immunity (GO:0019724) 4/11 1.113681e-02 FCER1G;CARD9;FCGR2B;HLA-G
30 inositol phosphate biosynthetic process (GO:0032958) 4/11 1.113681e-02 ITPKC;IPMK;IP6K1;IP6K2
31 positive regulation of cellular respiration (GO:1901857) 4/11 1.113681e-02 IL4;PRELID1;NUPR1;PARK7
32 regulation of T cell migration (GO:2000404) 5/20 1.113681e-02 CCL20;TNFRSF14;CCR6;AIF1;RHOA
33 regulation of interleukin-10 production (GO:0032653) 7/48 1.843603e-02 IL4;IL23R;IL13;STAT3;NOD2;FCGR2B;HLA-DRB1
34 negative regulation of inflammatory response to antigenic stimulus (GO:0002862) 12/136 1.843603e-02 PTGER4;POMC;GPR25;FCGR3A;PTGIR;FCGR2A;PRKAR2A;GPBAR1;ADCY3;FCGR2B;ADCY7;HLA-DRB1
35 positive regulation of DNA-binding transcription factor activity (GO:0051091) 17/246 2.009118e-02 CD40;CSF3;CRTC3;SMAD3;PRKCB;CARD9;STAT3;CAMK2A;ARID5B;PARK7;NOD2;PSMA6;IL18RAP;HSF1;PLPP3;TRIM31;IL18R1
36 macrophage activation (GO:0042116) 6/36 2.157014e-02 IL4;CRTC3;IL13;IFI35;JAK2;AIF1
37 regulation of defense response (GO:0031347) 9/83 2.157014e-02 PSMA6;CYLD;LACC1;IL1R1;IRF1;PARK7;NOD2;JAK2;FCGR2B
38 regulation of T-helper cell differentiation (GO:0045622) 3/6 2.157014e-02 HLA-DRA;IL27;HLA-DRB1
39 intracellular pH elevation (GO:0051454) 3/6 2.157014e-02 CLN3;SLC26A3;SLC26A6
40 regulation of intracellular pH (GO:0051453) 6/37 2.157014e-02 CLN3;SLC9A4;LRRK2;SLC26A3;TM9SF4;SLC26A6
41 inflammatory response (GO:0006954) 16/230 2.157014e-02 PTGER4;CCL13;CD40;CIITA;PTGIR;CCL20;STAT3;AIF1;IL4;NCR3;HYAL1;IL2RA;CXCR2;REL;FCGR2B;LAT
42 growth hormone receptor signaling pathway via JAK-STAT (GO:0060397) 4/14 2.157014e-02 STAT5A;STAT5B;STAT3;JAK2
43 T-helper cell differentiation (GO:0042093) 4/14 2.157014e-02 PTGER4;IL4;GPR183;RORC
44 positive regulation of lymphocyte migration (GO:2000403) 4/14 2.157014e-02 CCL20;TNFRSF14;AIF1;RHOA
45 positive regulation of regulatory T cell differentiation (GO:0045591) 4/14 2.157014e-02 SOCS1;HLA-DRA;HLA-G;HLA-DRB1
46 cellular response to organic substance (GO:0071310) 11/123 2.157014e-02 STAT5B;CSF3;SMAD3;LRRK2;ERBB2;STAT3;PDGFB;PARK7;RHOA;IL18R1;PTPN2
47 regulation of tyrosine phosphorylation of STAT protein (GO:0042509) 8/68 2.157014e-02 IL4;CD40;SOCS1;IL23R;STAT3;LIF;JAK2;PTPN2
48 positive regulation of protein serine/threonine kinase activity (GO:0071902) 10/106 2.513215e-02 CD40;CCNY;EDN3;LRRK2;ERBB2;PDGFB;MST1R;NOD2;IRGM;RHOA
49 negative regulation of inflammatory response (GO:0050728) 15/212 2.539613e-02 PTGER4;GPR25;PTGIR;IL13;GBA;GPBAR1;ADCY3;ADCY7;IL4;POMC;FCGR3A;FCGR2A;PRKAR2A;HLA-DRB1;PTPN2
50 positive regulation of T cell mediated cytotoxicity (GO:0001916) 5/26 2.613702e-02 IL23R;HLA-B;HLA-DRA;HLA-G;HLA-DRB1
51 interleukin-27-mediated signaling pathway (GO:0070106) 4/15 2.613702e-02 STAT3;IL27;TYK2;JAK2
52 response to cytokine (GO:0034097) 12/150 2.613702e-02 CSF3;CD40;CIITA;SMAD3;IL1R1;IL23R;STAT3;REL;JAK2;RHOA;IL18R1;PTPN2
53 antigen processing and presentation of endogenous peptide antigen via MHC class I via ER pathway (GO:0002484) 3/7 2.613702e-02 HLA-B;HLA-C;HLA-G
54 antigen processing and presentation of endogenous peptide antigen via MHC class I via ER pathway, TAP-independent (GO:0002486) 3/7 2.613702e-02 HLA-B;HLA-C;HLA-G
55 cellular response to interleukin-18 (GO:0071351) 3/7 2.613702e-02 IL18RAP;PDGFB;IL18R1
56 regulation of T cell tolerance induction (GO:0002664) 3/7 2.613702e-02 IL2RA;HLA-B;HLA-G
57 interleukin-18-mediated signaling pathway (GO:0035655) 3/7 2.613702e-02 IL18RAP;PDGFB;IL18R1
58 T-helper 17 cell differentiation (GO:0072539) 3/7 2.613702e-02 STAT3;RORC;LY9
59 nucleotide-binding oligomerization domain containing 2 signaling pathway (GO:0070431) 3/7 2.613702e-02 LACC1;NOD2;IRGM
60 response to glucocorticoid (GO:0051384) 5/27 2.661493e-02 BCL2L11;GOT1;ZFP36L2;UBE2L3;ZFP36L1
61 cellular response to corticosteroid stimulus (GO:0071384) 4/16 2.768175e-02 BCL2L11;ZFP36L2;UBE2L3;ZFP36L1
62 dendritic cell chemotaxis (GO:0002407) 4/16 2.768175e-02 CXCR1;GPR183;CXCR2;CCR6
63 polyol biosynthetic process (GO:0046173) 4/16 2.768175e-02 ITPKC;IPMK;IP6K1;IP6K2
64 negative regulation of mitotic cell cycle phase transition (GO:1901991) 9/92 2.768175e-02 PSMA6;GPR132;RFPL1;PSMD3;CUL1;BRD7;ZFP36L2;ZFP36L1;PSMB9
65 positive regulation of interferon-gamma production (GO:0032729) 7/57 2.777360e-02 IL1R1;IL23R;HLA-DPB1;IL27;CD244;IL18R1;IL12RB2
66 nucleotide-binding oligomerization domain containing signaling pathway (GO:0070423) 5/28 2.883163e-02 CYLD;LACC1;NOD2;AAMP;IRGM
67 positive regulation of lymphocyte proliferation (GO:0050671) 8/75 2.947973e-02 IL4;CD40;HLA-DMB;CD6;IL23R;GPR183;HLA-DPB1;AIF1
68 cellular response to interleukin-1 (GO:0071347) 12/155 3.027200e-02 PSMA6;CCL13;CD40;IL1R1;HYAL1;CCL20;IL1R2;PSMD3;CUL1;MAP3K8;NOD2;PSMB9
69 negative regulation of immune response (GO:0050777) 13/178 3.083113e-02 PTGER4;GPR25;PTGIR;GPBAR1;ADCY3;HLA-G;ADCY7;POMC;FCGR3A;FCGR2A;PRKAR2A;FCGR2B;HLA-DRB1
70 positive regulation of leukocyte mediated cytotoxicity (GO:0001912) 6/43 3.083113e-02 NCR3;IL23R;HLA-B;HLA-DRA;HLA-G;HLA-DRB1
71 positive regulation of T cell differentiation (GO:0045582) 6/43 3.083113e-02 IL4;SOCS1;IL23R;HLA-DRA;HLA-G;HLA-DRB1
72 positive regulation of cytokine production involved in inflammatory response (GO:1900017) 4/17 3.083113e-02 CD6;CARD9;STAT3;NOD2
73 regulation of T cell mediated cytotoxicity (GO:0001914) 5/29 3.083113e-02 IL23R;HLA-B;HLA-DRA;HLA-G;HLA-DRB1
74 antigen processing and presentation of endogenous peptide antigen via MHC class I (GO:0019885) 3/8 3.102238e-02 ERAP2;TAP2;TAP1
75 regulation of apoptotic cell clearance (GO:2000425) 3/8 3.102238e-02 C4B;C4A;C2
76 positive regulation of apoptotic cell clearance (GO:2000427) 3/8 3.102238e-02 C4B;C4A;C2
77 positive regulation of CD4-positive, alpha-beta T cell differentiation (GO:0043372) 3/8 3.102238e-02 SOCS1;HLA-DRA;HLA-DRB1
78 positive regulation of MHC class II biosynthetic process (GO:0045348) 3/8 3.102238e-02 IL4;CIITA;JAK2
79 tumor necrosis factor-mediated signaling pathway (GO:0033209) 10/116 3.106753e-02 PSMA6;CD40;TNFRSF6B;TNFSF15;PSMD3;LTA;TNFRSF14;TNFSF8;JAK2;PSMB9
80 regulation of inflammatory response to antigenic stimulus (GO:0002861) 11/137 3.129313e-02 PTGER4;POMC;GPR25;FCGR3A;PTGIR;FCGR2A;PRKAR2A;GPBAR1;ADCY3;ADCY7;HLA-DRB1
81 cellular response to glucocorticoid stimulus (GO:0071385) 4/18 3.357609e-02 BCL2L11;ZFP36L2;UBE2L3;ZFP36L1
82 dendritic cell migration (GO:0036336) 4/18 3.357609e-02 CXCR1;GPR183;CXCR2;CCR6
83 positive regulation of response to endoplasmic reticulum stress (GO:1905898) 4/18 3.357609e-02 BAG6;BCL2L11;FCGR2B;BOK
84 regulation of inflammatory response (GO:0050727) 14/206 3.357609e-02 PTGER4;IL1R1;IL13;GBA;IFI35;PARK7;NOD2;MMP9;IL4;CYLD;LACC1;PSMA6;JAK2;PTPN2
85 response to interferon-gamma (GO:0034341) 8/80 3.566602e-02 CCL13;CD40;CIITA;CCL20;IL23R;IRF8;AIF1;SLC26A6
86 regulation of cellular pH (GO:0030641) 5/31 3.587790e-02 CLN3;LACC1;SLC9A4;TM9SF4;SLC26A6
87 cellular response to interleukin-7 (GO:0098761) 4/19 3.869241e-02 STAT5A;STAT5B;SOCS1;STAT3
88 regulation of lymphocyte proliferation (GO:0050670) 4/19 3.869241e-02 LST1;IL27;TNFSF8;IKZF3
89 interleukin-7-mediated signaling pathway (GO:0038111) 4/19 3.869241e-02 STAT5A;STAT5B;SOCS1;STAT3
90 cellular response to interleukin-9 (GO:0071355) 3/9 3.869241e-02 STAT5A;STAT5B;STAT3
91 interleukin-9-mediated signaling pathway (GO:0038113) 3/9 3.869241e-02 STAT5A;STAT5B;STAT3
92 positive regulation of memory T cell differentiation (GO:0043382) 3/9 3.869241e-02 IL23R;HLA-DRA;HLA-DRB1
93 positive regulation of transcription, DNA-templated (GO:0045893) 48/1183 4.458811e-02 CSF3;CIITA;CD40;CRTC3;ELL;THRA;ATF6B;NOTCH4;SATB2;PDGFB;RORC;PARK7;NOD2;LITAF;ETS2;HHEX;NSD1;HSF1;ERBB2;NFATC2IP;MLX;TNNI2;BRD7;ZNF300;STAT5B;DR1;EGR2;SMAD3;RFPL1;STAT3;TET2;LIF;PBX2;POU5F1;FOSL2;IL4;POMC;MED24;NR5A2;DDX39B;TFR2;ZGLP1;IRF1;REL;IRF8;QRICH1;IRF6;HLA-DRB1
94 positive regulation of transcription by RNA polymerase II (GO:0045944) 39/908 4.461996e-02 CSF3;CIITA;CD40;CRTC3;ELL;THRA;ATF6B;NOTCH4;SATB2;PDGFB;PARK7;NOD2;LITAF;HHEX;MUC1;HSF1;NFATC2IP;MLX;ZNF300;STAT5B;DR1;EGR2;SMAD3;STAT3;TET2;LIF;PBX2;POU5F1;FOSL2;IL4;POMC;MED24;NR5A2;TFR2;ZGLP1;IRF1;REL;IRF8;IRF6
95 regulation of lymphocyte differentiation (GO:0045619) 4/20 4.461996e-02 PRELID1;IKZF3;ZFP36L2;ZFP36L1
96 growth hormone receptor signaling pathway (GO:0060396) 4/20 4.461996e-02 STAT5A;STAT5B;STAT3;JAK2
97 positive regulation of T cell proliferation (GO:0042102) 7/66 4.487089e-02 IL4;HLA-DMB;CD6;IL23R;HLA-DPB1;AIF1;ICOSLG
98 regulation of interferon-gamma production (GO:0032649) 8/86 4.938077e-02 IL1R1;IL23R;HLA-DPB1;IL27;CD244;HLA-DRB1;IL18R1;IL12RB2
99 regulation of epithelial cell apoptotic process (GO:1904035) 3/10 4.938077e-02 NUPR1;BOK;ZFP36L1
100 regulation of memory T cell differentiation (GO:0043380) 3/10 4.938077e-02 IL23R;HLA-DRA;HLA-DRB1
101 immunoglobulin mediated immune response (GO:0016064) 3/10 4.938077e-02 FCER1G;CARD9;FCGR2B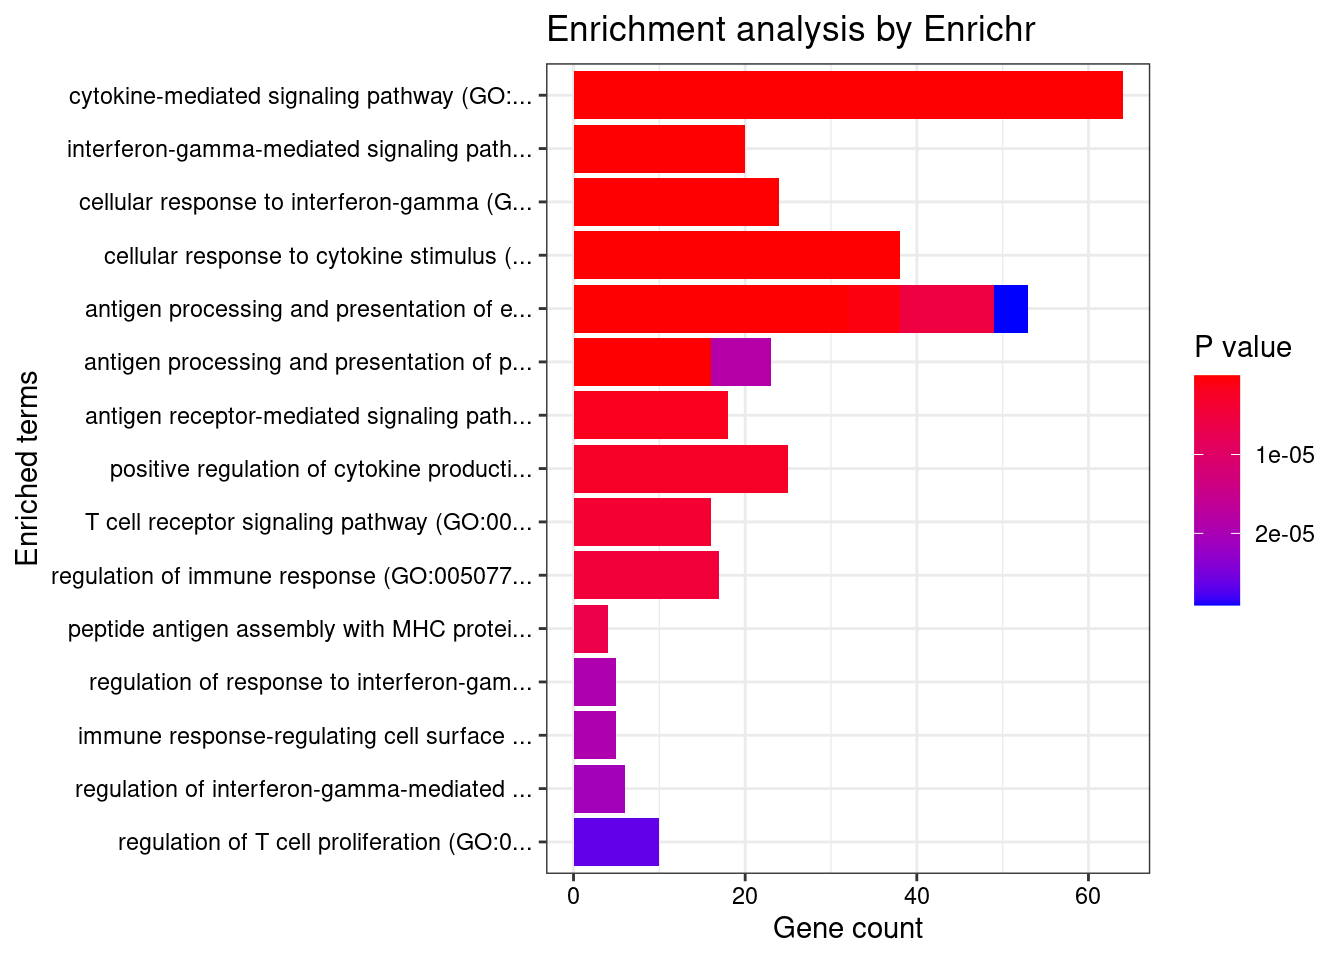
| Version | Author | Date |
|---|---|---|
| d46127d | wesleycrouse | 2022-05-24 |
GO_Cellular_Component_2021
Term Overlap Adjusted.P.value Genes
1 MHC protein complex (GO:0042611) 13/20 2.939916e-14 HLA-DRB5;HLA-B;HLA-C;HLA-DMA;HLA-DMB;HLA-DPB1;HLA-DRA;HLA-DOA;HLA-DOB;HLA-DQA1;HLA-DQB2;HLA-DRB1;HLA-DQB1
2 MHC class II protein complex (GO:0042613) 11/13 2.939916e-14 HLA-DRB5;HLA-DMA;HLA-DMB;HLA-DPB1;HLA-DRA;HLA-DOA;HLA-DOB;HLA-DQA1;HLA-DQB2;HLA-DRB1;HLA-DQB1
3 integral component of lumenal side of endoplasmic reticulum membrane (GO:0071556) 11/28 2.841760e-09 HLA-DRB5;HLA-B;HLA-DPB1;HLA-C;HLA-DRA;HLA-DQA2;HLA-G;HLA-DQA1;HLA-DQB2;HLA-DRB1;HLA-DQB1
4 lumenal side of endoplasmic reticulum membrane (GO:0098553) 11/28 2.841760e-09 HLA-DRB5;HLA-B;HLA-DPB1;HLA-C;HLA-DRA;HLA-DQA2;HLA-G;HLA-DQA1;HLA-DQB2;HLA-DRB1;HLA-DQB1
5 coated vesicle membrane (GO:0030662) 13/55 5.466271e-08 HLA-DRB5;SEC16A;HLA-B;HLA-C;HLA-G;HLA-DPB1;HLA-DRA;KDELR2;HLA-DQA2;HLA-DQB2;HLA-DQA1;HLA-DRB1;HLA-DQB1
6 ER to Golgi transport vesicle membrane (GO:0012507) 12/54 4.255588e-07 HLA-DRB5;SEC16A;HLA-B;HLA-DPB1;HLA-C;HLA-DRA;HLA-G;HLA-DQA2;HLA-DQB2;HLA-DQA1;HLA-DRB1;HLA-DQB1
7 COPII-coated ER to Golgi transport vesicle (GO:0030134) 14/79 4.892085e-07 HLA-DRB5;SEC16A;HLA-B;HLA-C;HLA-G;LMAN2;HLA-DPB1;HLA-DRA;HLA-DQA2;TMED5;HLA-DQB2;HLA-DQA1;HLA-DRB1;HLA-DQB1
8 transport vesicle membrane (GO:0030658) 12/60 1.130041e-06 HLA-DRB5;SEC16A;HLA-B;HLA-DPB1;HLA-C;HLA-DRA;HLA-G;HLA-DQA2;HLA-DQB2;HLA-DQA1;HLA-DRB1;HLA-DQB1
9 lysosome (GO:0005764) 32/477 2.922153e-05 RAB5C;LRRK2;GBA;LITAF;CLN3;HLA-DMA;HLA-DMB;NAGLU;HYAL1;NEU1;CXCR2;HLA-DOA;HLA-DQA2;HLA-DOB;HLA-DQA1;AP1M2;ATP6V0A1;STARD3;HLA-DRB5;USP4;RNASET2;LNPEP;GALC;SYT11;TMBIM1;HLA-DPB1;SPNS1;CSPG5;HLA-DRA;HLA-DRB1;HLA-DQB2;HLA-DQB1
10 lytic vacuole membrane (GO:0098852) 22/267 4.989171e-05 STARD3;HLA-DRB5;RAB5C;GBA;LNPEP;LITAF;CLN3;HLA-DMA;HLA-DMB;TMBIM1;HLA-DPB1;SPNS1;HLA-DRA;HLA-DOA;HLA-DQA2;HLA-DOB;HLA-DQA1;HLA-DRB1;HLA-DQB2;AP1M2;ATP6V0A1;HLA-DQB1
11 endocytic vesicle membrane (GO:0030666) 16/158 8.285123e-05 HLA-DRB5;CAMK2A;HLA-B;TAP2;HLA-C;TAP1;HLA-G;HLA-DPB1;HLA-DRA;HLA-DQA2;CAMK2G;HLA-DQA1;HLA-DRB1;HLA-DQB2;ATP6V0A1;HLA-DQB1
12 integral component of endoplasmic reticulum membrane (GO:0030176) 15/142 9.025155e-05 HLA-DRB5;ATF6B;HLA-B;TAP2;HLA-C;TAP1;HLA-G;CLN3;HLA-DPB1;HLA-DRA;HLA-DQA2;HLA-DQA1;HLA-DRB1;HLA-DQB2;HLA-DQB1
13 trans-Golgi network membrane (GO:0032588) 12/99 1.833119e-04 ARFRP1;HLA-DRB5;HLA-DPB1;HLA-DRA;HLA-DQA2;SCAMP3;AP1M2;HLA-DQA1;HLA-DRB1;HLA-DQB2;BOK;HLA-DQB1
14 lysosomal membrane (GO:0005765) 23/330 3.353469e-04 STARD3;HLA-DRB5;RAB5C;GBA;LNPEP;LITAF;CLN3;SYNGR1;HLA-DMA;HLA-DMB;TMBIM1;HLA-DPB1;SPNS1;HLA-DRA;HLA-DOA;HLA-DQA2;HLA-DOB;HLA-DQA1;HLA-DRB1;HLA-DQB2;AP1M2;ATP6V0A1;HLA-DQB1
15 bounding membrane of organelle (GO:0098588) 37/767 3.895241e-03 GPSM1;NOTCH4;CAMK2A;PDGFB;ATP2A1;FUT2;CLN3;CXCR1;LMAN2;ORMDL3;CXCR2;ERBB2;HLA-DQA2;CAMK2G;HLA-DQA1;AP1M2;BOK;ATP6V0A1;HLA-DRB5;TAP2;HLA-B;TAP1;HLA-C;B3GALT6;HLA-G;IRGM;RHOA;FCGR2A;TMBIM1;HLA-DPB1;HLA-DRA;CSPG5;KDELR2;PLPP3;HLA-DRB1;HLA-DQB2;HLA-DQB1
16 clathrin-coated endocytic vesicle membrane (GO:0030669) 8/69 5.882091e-03 HLA-DRB5;HLA-DPB1;HLA-DRA;HLA-DQA2;HLA-DQB2;HLA-DQA1;HLA-DRB1;HLA-DQB1
17 cytoplasmic vesicle membrane (GO:0030659) 22/380 5.882091e-03 HLA-DRB5;CAMK2A;HLA-B;HLA-C;RHOA;FCGR2A;CXCR1;CXCR2;ORMDL3;TMBIM1;ERBB2;HLA-DPB1;CSPG5;HLA-DRA;HLA-DQA2;CAMK2G;HLA-DQA1;HLA-DRB1;HLA-DQB2;AP1M2;ATP6V0A1;HLA-DQB1
18 endocytic vesicle (GO:0030139) 14/189 5.882091e-03 HLA-DRB5;RAB5C;CAMK2A;NOD2;SYT11;HLA-DPB1;HLA-DRA;ITGAV;HLA-DQA2;CAMK2G;HLA-DQA1;HLA-DRB1;HLA-DQB2;HLA-DQB1
19 trans-Golgi network (GO:0005802) 16/239 6.914445e-03 HLA-DRB5;GBA;SCAMP3;ARFRP1;CLN3;SYT11;HLA-DPB1;HLA-DRA;PLPP3;HLA-DQA2;HLA-DQA1;HLA-DRB1;HLA-DQB2;AP1M2;HLA-DQB1;BOK
20 secretory granule membrane (GO:0030667) 17/274 1.052042e-02 FCER1G;RAB5C;HLA-B;HLA-C;NBEAL2;RHOA;SYNGR1;TSPAN14;FCGR2A;CXCR1;PLAU;CXCR2;ORMDL3;TMBIM1;ITGAV;LY6G6F;ATP6V0A1
21 phagocytic vesicle membrane (GO:0030670) 6/45 1.176357e-02 HLA-B;TAP2;HLA-C;TAP1;HLA-G;ATP6V0A1
22 phagocytic vesicle (GO:0045335) 9/100 1.288226e-02 SYT11;HLA-B;TAP2;HLA-C;TAP1;ITGAV;NOD2;HLA-G;ATP6V0A1
23 integral component of plasma membrane (GO:0005887) 57/1454 1.296629e-02 DDR1;GPR25;CNTNAP1;CD40;GPR65;IL23R;ICAM5;SLC7A10;FCRLA;FCGR3A;IL18RAP;ITGAV;CCR6;PTGIR;FCER1G;GPR35;IL1R1;IFNGR2;HLA-B;HLA-C;NCR3;TFR2;CDHR4;PLPP3;SLC22A4;NOTCH4;ADCY3;SEMA3F;MST1R;ADCY7;MUC1;C7;LMAN2;CXCR2;ERBB2;SLC38A3;HLA-DQA2;HLA-DQA1;IL12RB2;GABBR1;KCNJ11;TNFSF15;LNPEP;SLC6A7;TSPAN14;FCGR2A;CD6;GPR183;IL2RA;HLA-DRA;CSPG5;TNFSF8;FCGR2B;SLC26A3;HLA-DRB1;SLC26A6;IL18R1
24 Golgi membrane (GO:0000139) 24/472 1.466226e-02 GPSM1;HLA-DRB5;NOTCH4;PDGFB;HLA-B;HLA-C;B3GALT6;FUT2;HLA-G;IRGM;SCAMP3;ARFRP1;CLN3;LMAN2;HLA-DPB1;HLA-DRA;KDELR2;HLA-DQA2;HLA-DQA1;HLA-DRB1;HLA-DQB2;AP1M2;HLA-DQB1;BOK
25 clathrin-coated endocytic vesicle (GO:0045334) 8/85 1.577076e-02 HLA-DRB5;HLA-DPB1;HLA-DRA;HLA-DQA2;HLA-DQB2;HLA-DQA1;HLA-DRB1;HLA-DQB1
26 late endosome membrane (GO:0031902) 7/68 1.747639e-02 STARD3;HLA-DMA;HLA-DRB5;HLA-DMB;HLA-DRA;LITAF;HLA-DRB1
27 clathrin-coated vesicle membrane (GO:0030665) 8/90 2.101993e-02 HLA-DRB5;HLA-DPB1;HLA-DRA;HLA-DQA2;HLA-DQB2;HLA-DQA1;HLA-DRB1;HLA-DQB1
28 early endosome membrane (GO:0031901) 8/97 3.229837e-02 CLN3;RAB5C;HLA-B;HLA-C;HLA-G;LITAF;SNX20;BOK
29 endosome membrane (GO:0010008) 17/325 4.296415e-02 STARD3;HLA-DRB5;RAB5C;HLA-B;HLA-C;HLA-G;SNX20;SCAMP3;CLN3;HLA-DMA;HLA-DMB;TMBIM1;ERBB2;HLA-DRA;HLA-DRB1;ATP6V0A1;BOK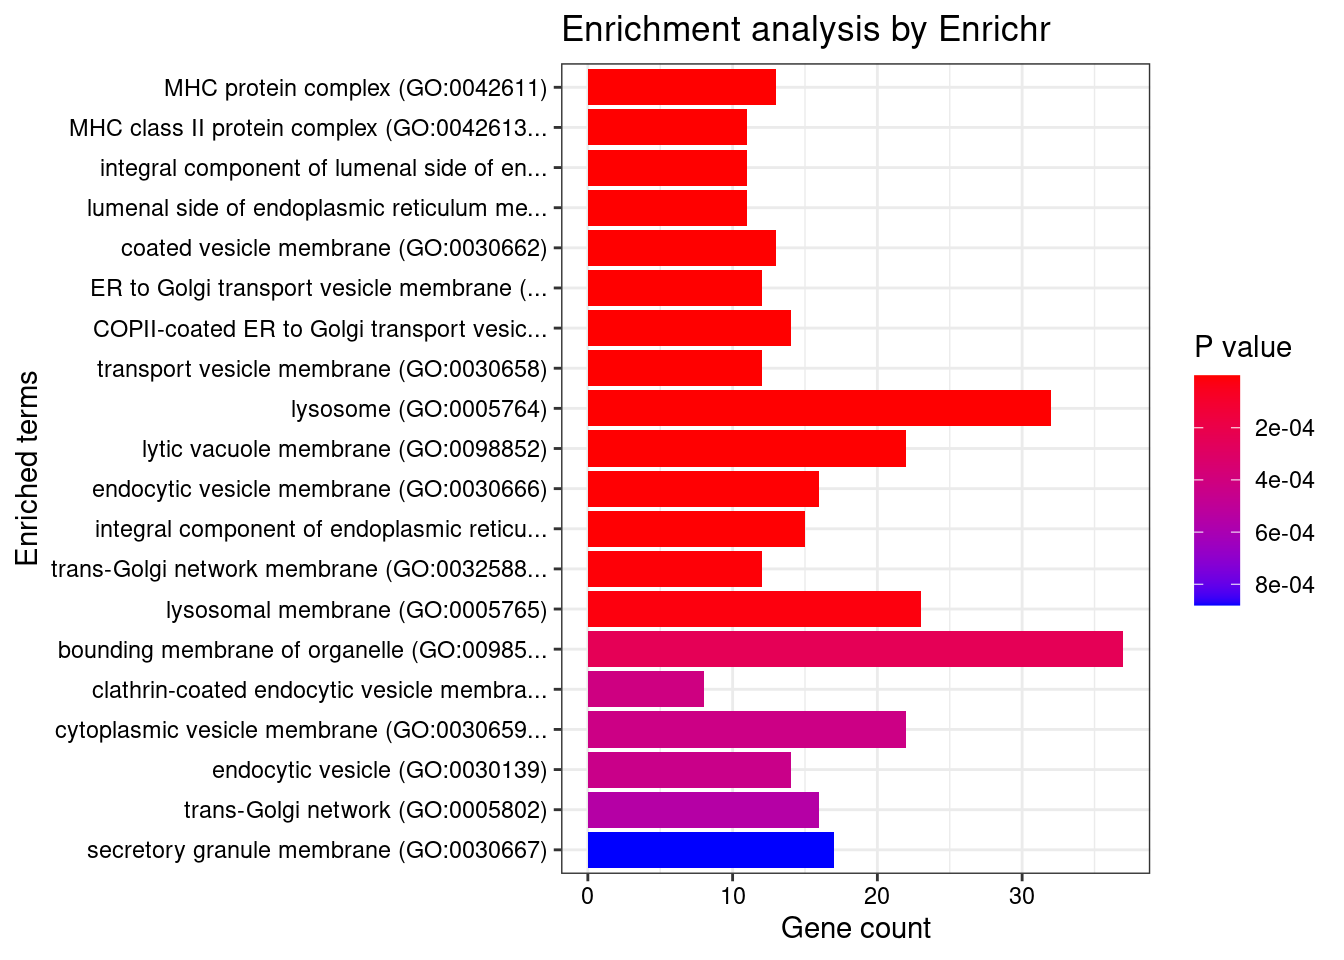
| Version | Author | Date |
|---|---|---|
| d46127d | wesleycrouse | 2022-05-24 |
GO_Molecular_Function_2021
Term Overlap Adjusted.P.value Genes
1 MHC class II receptor activity (GO:0032395) 8/10 3.736280e-09 HLA-DRA;HLA-DOA;HLA-DOB;HLA-DQA2;HLA-DQA1;HLA-DQB2;HLA-DRB1;HLA-DQB1
2 MHC class II protein complex binding (GO:0023026) 6/17 6.387956e-04 HLA-DMA;HLA-DMB;HLA-DRA;HLA-DOA;HLA-DOB;HLA-DRB1
3 cytokine receptor activity (GO:0004896) 11/88 2.538087e-03 IL1RL1;IL18RAP;CXCR1;IL1R1;IL23R;IFNGR2;IL1R2;IL2RA;CCR6;IL18R1;IL12RB2
4 kinase activity (GO:0016301) 11/112 1.475562e-02 CERKL;ITPKC;DGKD;LRRK2;IPMK;CAMK2A;COQ8B;IP6K1;NADK;COASY;IP6K2
5 C-X-C chemokine receptor activity (GO:0016494) 3/5 1.475562e-02 CXCR1;GPR35;CXCR2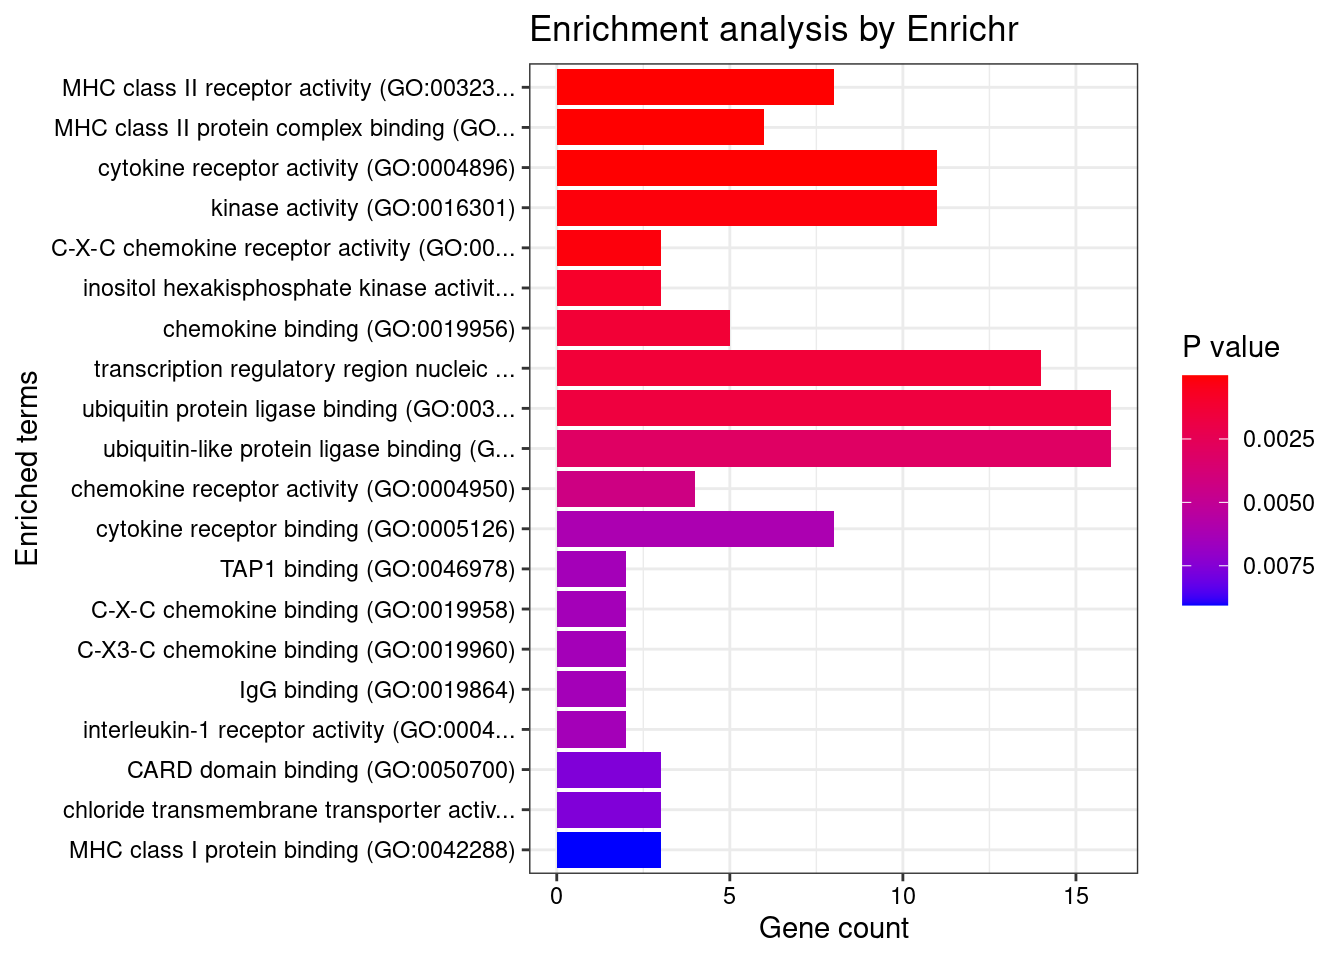
| Version | Author | Date |
|---|---|---|
| d46127d | wesleycrouse | 2022-05-24 |
Enrichment analysis for cTWAS genes in top tissues separately
GO
output <- output[order(-output$pve_g),]
top_tissues <- output$weight[1:5]
for (tissue in top_tissues){
cat(paste0(tissue, "\n\n"))
ctwas_genes_tissue <- df[[tissue]]$ctwas
cat(paste0("Number of cTWAS Genes in Tissue: ", length(ctwas_genes_tissue), "\n\n"))
dbs <- c("GO_Biological_Process_2021")
GO_enrichment <- enrichr(ctwas_genes_tissue, dbs)
for (db in dbs){
cat(paste0("\n", db, "\n\n"))
enrich_results <- GO_enrichment[[db]]
enrich_results <- enrich_results[enrich_results$Adjusted.P.value<0.05,c("Term", "Overlap", "Adjusted.P.value", "Genes")]
print(enrich_results)
print(plotEnrich(GO_enrichment[[db]]))
}
}Whole_Blood
Number of cTWAS Genes in Tissue: 11
Uploading data to Enrichr... Done.
Querying GO_Biological_Process_2021... Done.
Parsing results... Done.
GO_Biological_Process_2021
Term Overlap Adjusted.P.value Genes
1 positive regulation of cytokine production involved in inflammatory response (GO:1900017) 2/17 0.01020158 CARD9;STAT3
2 regulation of cytokine production involved in inflammatory response (GO:1900015) 2/43 0.02872366 CARD9;STAT3
3 positive regulation of interleukin-6 production (GO:0032755) 2/76 0.02872366 CARD9;STAT3
4 regulation of interleukin-6 production (GO:0032675) 2/110 0.02872366 CARD9;STAT3
5 positive regulation of metallopeptidase activity (GO:1905050) 1/5 0.02872366 STAT3
6 positive regulation of NF-kappaB transcription factor activity (GO:0051092) 2/155 0.02872366 CARD9;STAT3
7 radial glial cell differentiation (GO:0060019) 1/6 0.02872366 STAT3
8 T-helper 17 cell lineage commitment (GO:0072540) 1/6 0.02872366 STAT3
9 regulation of transmission of nerve impulse (GO:0051969) 1/6 0.02872366 TYMP
10 release of sequestered calcium ion into cytosol by sarcoplasmic reticulum (GO:0014808) 1/6 0.02872366 CCR5
11 regulation of digestive system process (GO:0044058) 1/6 0.02872366 TYMP
12 skin morphogenesis (GO:0043589) 1/7 0.02872366 ERRFI1
13 negative regulation of cytoplasmic translation (GO:2000766) 1/7 0.02872366 CPEB4
14 T-helper 17 cell differentiation (GO:0072539) 1/7 0.02872366 STAT3
15 astrocyte differentiation (GO:0048708) 1/7 0.02872366 STAT3
16 release of sequestered calcium ion into cytosol by endoplasmic reticulum (GO:1903514) 1/7 0.02872366 CCR5
17 regulation of miRNA mediated inhibition of translation (GO:1905616) 1/7 0.02872366 STAT3
18 photoreceptor cell differentiation (GO:0046530) 1/7 0.02872366 STAT3
19 positive regulation of miRNA mediated inhibition of translation (GO:1905618) 1/7 0.02872366 STAT3
20 mitochondrion organization (GO:0007005) 2/175 0.02872366 BIK;TYMP
21 cellular response to interleukin-21 (GO:0098757) 1/8 0.02872366 STAT3
22 fusion of virus membrane with host plasma membrane (GO:0019064) 1/8 0.02872366 CCR5
23 T-helper cell lineage commitment (GO:0002295) 1/8 0.02872366 STAT3
24 membrane fusion involved in viral entry into host cell (GO:0039663) 1/8 0.02872366 CCR5
25 myeloid leukocyte mediated immunity (GO:0002444) 1/8 0.02872366 CARD9
26 interleukin-21-mediated signaling pathway (GO:0038114) 1/8 0.02872366 STAT3
27 cellular response to interleukin-9 (GO:0071355) 1/9 0.02872366 STAT3
28 cellular response to leptin stimulus (GO:0044320) 1/9 0.02872366 STAT3
29 response to leptin (GO:0044321) 1/9 0.02872366 STAT3
30 interleukin-23-mediated signaling pathway (GO:0038155) 1/9 0.02872366 STAT3
31 interleukin-9-mediated signaling pathway (GO:0038113) 1/9 0.02872366 STAT3
32 ionotropic glutamate receptor signaling pathway (GO:0035235) 1/10 0.02872366 CPEB4
33 regulation of receptor binding (GO:1900120) 1/10 0.02872366 ADAM15
34 leptin-mediated signaling pathway (GO:0033210) 1/10 0.02872366 STAT3
35 cellular response to oxygen levels (GO:0071453) 1/10 0.02872366 CPEB4
36 lung epithelium development (GO:0060428) 1/10 0.02872366 ERRFI1
37 regulation of T-helper 17 type immune response (GO:2000316) 1/10 0.02872366 CARD9
38 nucleoside metabolic process (GO:0009116) 1/10 0.02872366 TYMP
39 immunoglobulin mediated immune response (GO:0016064) 1/10 0.02872366 CARD9
40 negative regulation of protein autophosphorylation (GO:0031953) 1/10 0.02872366 ERRFI1
41 sarcoplasmic reticulum calcium ion transport (GO:0070296) 1/10 0.02872366 CCR5
42 negative regulation of receptor binding (GO:1900121) 1/10 0.02872366 ADAM15
43 positive regulation of posttranscriptional gene silencing (GO:0060148) 1/11 0.02872366 STAT3
44 pyrimidine nucleoside catabolic process (GO:0046135) 1/11 0.02872366 TYMP
45 pyrimidine nucleoside salvage (GO:0043097) 1/11 0.02872366 TYMP
46 pyrimidine-containing compound salvage (GO:0008655) 1/11 0.02872366 TYMP
47 B cell mediated immunity (GO:0019724) 1/11 0.02872366 CARD9
48 response to sterol (GO:0036314) 1/11 0.02872366 CCR5
49 interleukin-35-mediated signaling pathway (GO:0070757) 1/11 0.02872366 STAT3
50 cellular response to lipid (GO:0071396) 2/219 0.02872366 ADAM15;CCR5
51 cellular response to growth hormone stimulus (GO:0071378) 1/12 0.02872366 STAT3
52 regulation of feeding behavior (GO:0060259) 1/12 0.02872366 STAT3
53 eye photoreceptor cell differentiation (GO:0001754) 1/12 0.02872366 STAT3
54 pyrimidine-containing compound metabolic process (GO:0072527) 1/12 0.02872366 TYMP
55 nucleoside catabolic process (GO:0009164) 1/12 0.02872366 TYMP
56 nucleoside salvage (GO:0043174) 1/12 0.02872366 TYMP
57 positive regulation of T-helper 17 type immune response (GO:2000318) 1/12 0.02872366 CARD9
58 mitochondrial genome maintenance (GO:0000002) 1/12 0.02872366 TYMP
59 negative regulation of production of miRNAs involved in gene silencing by miRNA (GO:1903799) 1/12 0.02872366 STAT3
60 inflammatory response (GO:0006954) 2/230 0.02872366 STAT3;CCR5
61 apoptotic process (GO:0006915) 2/231 0.02872366 ADAM15;BIK
62 positive regulation of adaptive immune response based on somatic recombination of immune receptors built from immunoglobulin superfamily domains (GO:0002824) 1/13 0.02872366 CARD9
63 cellular response to interleukin-15 (GO:0071350) 1/13 0.02872366 STAT3
64 antifungal innate immune response (GO:0061760) 1/13 0.02872366 CARD9
65 negative regulation of epidermal growth factor-activated receptor activity (GO:0007175) 1/13 0.02872366 ERRFI1
66 homeostasis of number of cells (GO:0048872) 1/13 0.02872366 CARD9
67 interleukin-15-mediated signaling pathway (GO:0035723) 1/13 0.02872366 STAT3
68 entry into host (GO:0044409) 1/13 0.02872366 CCR5
69 pyrimidine nucleoside biosynthetic process (GO:0046134) 1/14 0.02931177 TYMP
70 growth hormone receptor signaling pathway via JAK-STAT (GO:0060397) 1/14 0.02931177 STAT3
71 positive regulation of granulocyte macrophage colony-stimulating factor production (GO:0032725) 1/14 0.02931177 CARD9
72 positive regulation of DNA-binding transcription factor activity (GO:0051091) 2/246 0.02931177 CARD9;STAT3
73 pyrimidine nucleoside metabolic process (GO:0006213) 1/15 0.03003438 TYMP
74 regulation of cytoplasmic translation (GO:2000765) 1/15 0.03003438 CPEB4
75 interleukin-27-mediated signaling pathway (GO:0070106) 1/15 0.03003438 STAT3
76 regulation of granulocyte macrophage colony-stimulating factor production (GO:0032645) 1/16 0.03119676 CARD9
77 dendritic cell chemotaxis (GO:0002407) 1/16 0.03119676 CCR5
78 pyrimidine-containing compound catabolic process (GO:0072529) 1/17 0.03229934 TYMP
79 vasculature development (GO:0001944) 1/17 0.03229934 ERRFI1
80 positive regulation of stress-activated protein kinase signaling cascade (GO:0070304) 1/18 0.03293988 CARD9
81 dendritic cell migration (GO:0036336) 1/18 0.03293988 CCR5
82 interleukin-6-mediated signaling pathway (GO:0070102) 1/18 0.03293988 STAT3
83 cellular response to interleukin-7 (GO:0098761) 1/19 0.03314440 STAT3
84 response to cholesterol (GO:0070723) 1/19 0.03314440 CCR5
85 regulation of nervous system process (GO:0031644) 1/19 0.03314440 TYMP
86 interleukin-7-mediated signaling pathway (GO:0038111) 1/19 0.03314440 STAT3
87 adaptive immune response based on somatic recombination of immune receptors built from immunoglobulin superfamily domains (GO:0002460) 1/20 0.03332991 STAT3
88 positive regulation of peptidyl-lysine acetylation (GO:2000758) 1/20 0.03332991 BRD7
89 eye morphogenesis (GO:0048592) 1/20 0.03332991 STAT3
90 growth hormone receptor signaling pathway (GO:0060396) 1/20 0.03332991 STAT3
91 innate immune response (GO:0045087) 2/302 0.03439615 ADAM15;CARD9
92 positive regulation of histone acetylation (GO:0035066) 1/23 0.03706520 BRD7
93 positive regulation of interleukin-17 production (GO:0032740) 1/23 0.03706520 CARD9
94 cellular response to oxygen-containing compound (GO:1901701) 2/323 0.03745873 CCR5;CPEB4
95 defense response to fungus (GO:0050832) 1/24 0.03745873 CARD9
96 negative regulation of protein tyrosine kinase activity (GO:0061099) 1/24 0.03745873 ERRFI1
97 receptor signaling pathway via STAT (GO:0097696) 1/25 0.03782766 STAT3
98 positive regulation of release of cytochrome c from mitochondria (GO:0090200) 1/25 0.03782766 BIK
99 regulation of epidermal cell differentiation (GO:0045604) 1/25 0.03782766 ERRFI1
100 positive regulation of cytokine production (GO:0001819) 2/335 0.03814785 CARD9;STAT3
101 negative regulation of signaling receptor activity (GO:2000272) 1/26 0.03817415 ERRFI1
102 regulation of myelination (GO:0031641) 1/26 0.03817415 TYMP
103 positive regulation of erythrocyte differentiation (GO:0045648) 1/27 0.03850014 STAT3
104 positive regulation of gene silencing by miRNA (GO:2000637) 1/27 0.03850014 STAT3
105 regulation of epidermal growth factor-activated receptor activity (GO:0007176) 1/27 0.03850014 ERRFI1
106 cellular response to interleukin-6 (GO:0071354) 1/28 0.03917001 STAT3
107 cellular response to acid chemical (GO:0071229) 1/28 0.03917001 CPEB4
108 glial cell differentiation (GO:0010001) 1/29 0.04018327 STAT3
109 positive regulation of endopeptidase activity (GO:0010950) 1/30 0.04080292 STAT3
110 response to alcohol (GO:0097305) 1/30 0.04080292 CCR5
111 receptor signaling pathway via JAK-STAT (GO:0007259) 1/31 0.04145763 STAT3
112 negative regulation of cell-matrix adhesion (GO:0001953) 1/32 0.04145763 ADAM15
113 response to amino acid (GO:0043200) 1/32 0.04145763 CPEB4
114 positive regulation of interleukin-10 production (GO:0032733) 1/32 0.04145763 STAT3
115 modulation by host of symbiont process (GO:0051851) 1/32 0.04145763 CARD9
116 regulation of histone acetylation (GO:0035065) 1/33 0.04145763 BRD7
117 regulation of interleukin-17 production (GO:0032660) 1/33 0.04145763 CARD9
118 apoptotic mitochondrial changes (GO:0008637) 1/33 0.04145763 BIK
119 positive regulation of histone modification (GO:0031058) 1/33 0.04145763 BRD7
120 positive regulation of pri-miRNA transcription by RNA polymerase II (GO:1902895) 1/34 0.04165319 STAT3
121 regulation of keratinocyte differentiation (GO:0045616) 1/34 0.04165319 ERRFI1
122 cellular response to amino acid stimulus (GO:0071230) 1/34 0.04165319 CPEB4
123 negative regulation of cell cycle G1/S phase transition (GO:1902807) 1/35 0.04217617 BRD7
124 lung development (GO:0030324) 1/35 0.04217617 ERRFI1
125 positive regulation of myeloid cell differentiation (GO:0045639) 1/37 0.04260703 STAT3
126 negative regulation of G1/S transition of mitotic cell cycle (GO:2000134) 1/37 0.04260703 BRD7
127 glutamate receptor signaling pathway (GO:0007215) 1/37 0.04260703 CPEB4
128 regulation of protein autophosphorylation (GO:0031952) 1/37 0.04260703 ERRFI1
129 regulation of erythrocyte differentiation (GO:0045646) 1/37 0.04260703 STAT3
130 regulation of cell migration (GO:0030334) 2/408 0.04260703 ADAM15;STAT3
131 regulation of cell communication (GO:0010646) 1/38 0.04298386 TYMP
132 response to estradiol (GO:0032355) 1/38 0.04298386 STAT3
133 cellular response to ketone (GO:1901655) 1/39 0.04344574 ADAM15
134 response to peptide (GO:1901652) 1/39 0.04344574 STAT3
135 negative regulation of cell-substrate adhesion (GO:0010812) 1/40 0.04389349 ADAM15
136 negative regulation of ERBB signaling pathway (GO:1901185) 1/40 0.04389349 ERRFI1
137 regulation of release of cytochrome c from mitochondria (GO:0090199) 1/41 0.04465128 BIK
138 regulation of nervous system development (GO:0051960) 1/42 0.04539756 TYMP
139 cellular response to glucose starvation (GO:0042149) 1/43 0.04547821 CPEB4
140 male gonad development (GO:0008584) 1/43 0.04547821 BIK
141 development of primary male sexual characteristics (GO:0046546) 1/43 0.04547821 BIK
142 negative regulation of epidermal growth factor receptor signaling pathway (GO:0042059) 1/44 0.04619660 ERRFI1
143 positive regulation of Notch signaling pathway (GO:0045747) 1/45 0.04657870 STAT3
144 regulation of pri-miRNA transcription by RNA polymerase II (GO:1902893) 1/45 0.04657870 STAT3
145 regulation of interleukin-10 production (GO:0032653) 1/48 0.04896669 STAT3
146 cellular response to alcohol (GO:0097306) 1/48 0.04896669 ADAM15
147 regulation of stress-activated MAPK cascade (GO:0032872) 1/49 0.04929904 CARD9
148 cellular defense response (GO:0006968) 1/49 0.04929904 CCR5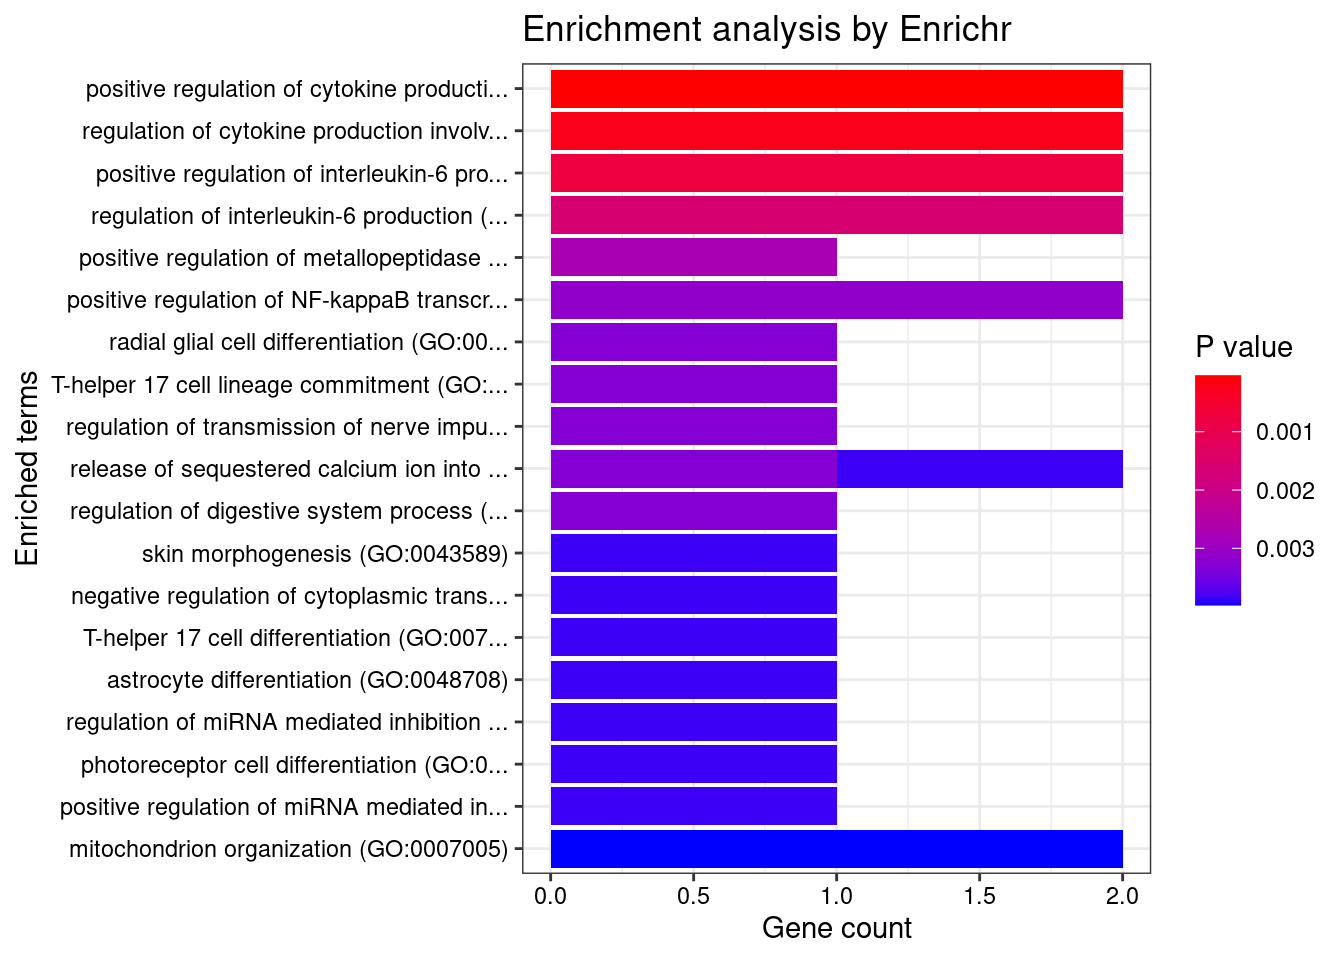
| Version | Author | Date |
|---|---|---|
| d46127d | wesleycrouse | 2022-05-24 |
Colon_Transverse
Number of cTWAS Genes in Tissue: 10
Uploading data to Enrichr... Done.
Querying GO_Biological_Process_2021... Done.
Parsing results... Done.
GO_Biological_Process_2021
Term Overlap Adjusted.P.value Genes
1 interferon-gamma-mediated signaling pathway (GO:0060333) 2/68 0.04425752 IFNGR2;IRF8
2 cellular response to interferon-gamma (GO:0071346) 2/121 0.04425752 IFNGR2;IRF8
3 positive regulation of endothelial cell chemotaxis by VEGF-activated vascular endothelial growth factor receptor signaling pathway (GO:0038033) 1/5 0.04425752 PRKD2
4 positive regulation of fibroblast growth factor receptor signaling pathway (GO:0045743) 1/5 0.04425752 PRKD2
5 oocyte development (GO:0048599) 1/5 0.04425752 ZGLP1
6 cellular response to iron ion (GO:0071281) 1/6 0.04425752 HFE
7 negative regulation of CD8-positive, alpha-beta T cell activation (GO:2001186) 1/6 0.04425752 HFE
8 positive regulation of receptor binding (GO:1900122) 1/6 0.04425752 HFE
9 positive regulation of deacetylase activity (GO:0090045) 1/6 0.04425752 PRKD2
10 morphogenesis of an endothelium (GO:0003159) 1/6 0.04425752 PRKD2
11 protein K29-linked ubiquitination (GO:0035519) 1/6 0.04425752 RNF186
12 regulation of histone deacetylase activity (GO:1901725) 1/7 0.04425752 PRKD2
13 positive regulation of peptide secretion (GO:0002793) 1/8 0.04425752 HFE
14 positive regulation of cell migration by vascular endothelial growth factor signaling pathway (GO:0038089) 1/8 0.04425752 PRKD2
15 proteasomal protein catabolic process (GO:0010498) 2/205 0.04425752 UBE2W;RNF186
16 negative regulation of T cell cytokine production (GO:0002725) 1/9 0.04425752 HFE
17 regulation of CD8-positive, alpha-beta T cell activation (GO:2001185) 1/9 0.04425752 HFE
18 response to misfolded protein (GO:0051788) 1/9 0.04425752 UBE2W
19 negative regulation of alpha-beta T cell activation (GO:0046636) 1/9 0.04425752 HFE
20 regulation of receptor binding (GO:1900120) 1/10 0.04425752 HFE
21 positive regulation of vascular endothelial growth factor receptor signaling pathway (GO:0030949) 1/10 0.04425752 PRKD2
22 endothelial tube morphogenesis (GO:0061154) 1/10 0.04425752 PRKD2
23 negative regulation of receptor binding (GO:1900121) 1/10 0.04425752 HFE
24 positive regulation of histone deacetylation (GO:0031065) 1/13 0.04909699 PRKD2
25 response to iron ion (GO:0010039) 1/13 0.04909699 HFE
26 protein localization to mitochondrion (GO:0070585) 1/13 0.04909699 RNF186
27 regulation of response to interferon-gamma (GO:0060330) 1/14 0.04909699 IFNGR2
28 negative regulation of T cell mediated immunity (GO:0002710) 1/14 0.04909699 HFE
29 positive regulation of T cell receptor signaling pathway (GO:0050862) 1/14 0.04909699 PRKD2
30 positive regulation of endothelial cell chemotaxis (GO:2001028) 1/15 0.04919906 PRKD2
31 regulation of endothelial cell chemotaxis (GO:2001026) 1/15 0.04919906 PRKD2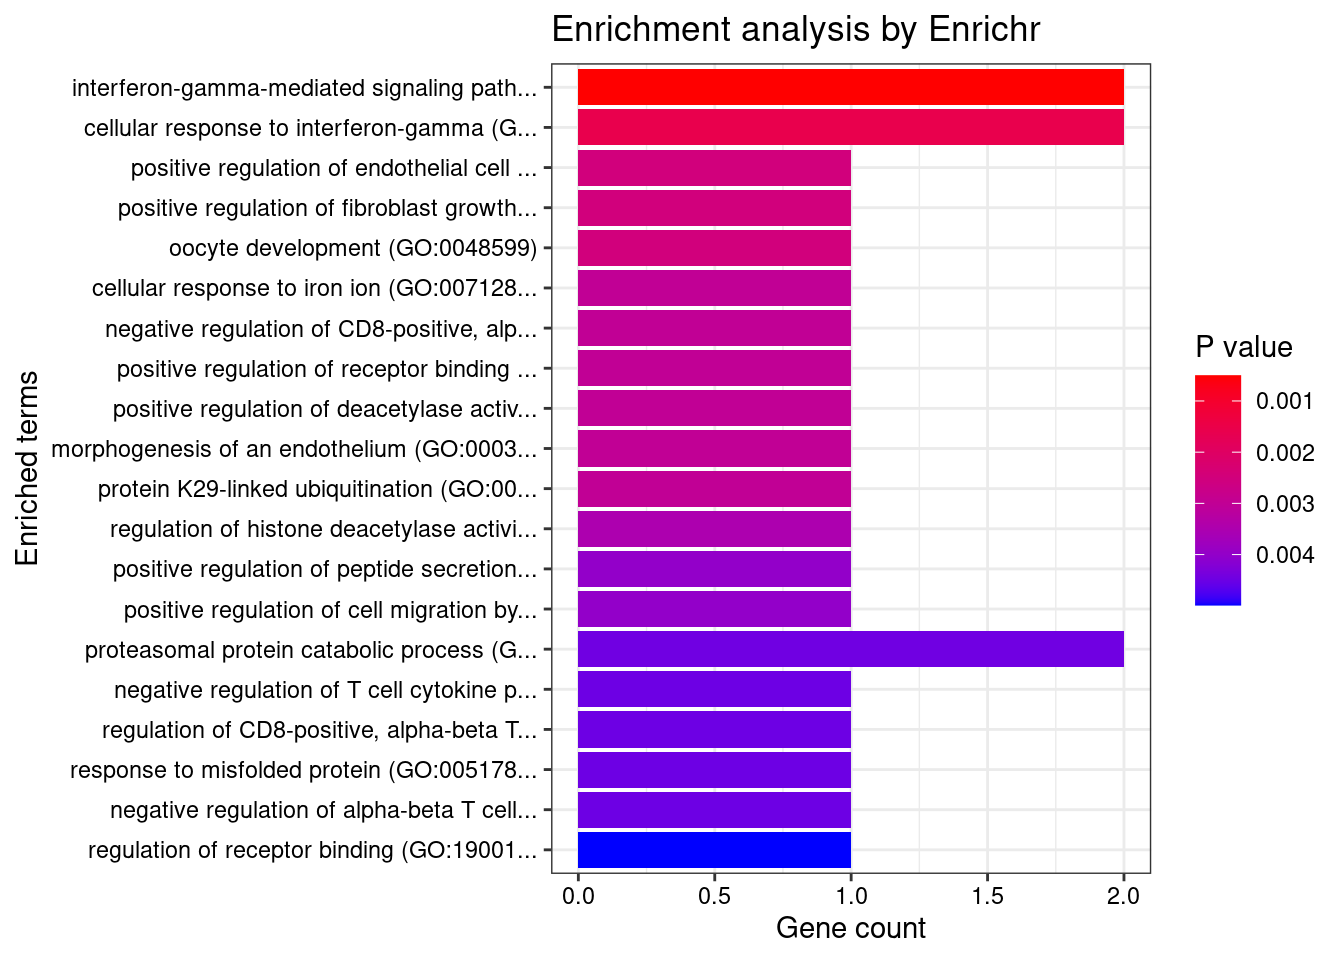
| Version | Author | Date |
|---|---|---|
| d46127d | wesleycrouse | 2022-05-24 |
Esophagus_Muscularis
Number of cTWAS Genes in Tissue: 8
Uploading data to Enrichr... Done.
Querying GO_Biological_Process_2021... Done.
Parsing results... Done.
GO_Biological_Process_2021
Term Overlap Adjusted.P.value Genes
1 cell-matrix adhesion (GO:0007160) 2/100 0.02978801 ADAM15;ITGAL
2 positive regulation of cysteine-type endopeptidase activity involved in apoptotic process (GO:0043280) 2/119 0.02978801 TNFSF15;CARD9
3 T cell extravasation (GO:0072683) 1/5 0.02978801 ITGAL
4 extracellular structure organization (GO:0043062) 2/216 0.02978801 ADAM15;ITGAL
5 external encapsulating structure organization (GO:0045229) 2/217 0.02978801 ADAM15;ITGAL
6 myeloid leukocyte mediated immunity (GO:0002444) 1/8 0.02978801 CARD9
7 regulation of DNA-templated transcription in response to stress (GO:0043620) 1/9 0.02978801 RGS14
8 regulation of ERK1 and ERK2 cascade (GO:0070372) 2/238 0.02978801 RGS14;CARD9
9 regulation of receptor binding (GO:1900120) 1/10 0.02978801 ADAM15
10 regulation of T-helper 17 type immune response (GO:2000316) 1/10 0.02978801 CARD9
11 immunoglobulin mediated immune response (GO:0016064) 1/10 0.02978801 CARD9
12 negative regulation of receptor binding (GO:1900121) 1/10 0.02978801 ADAM15
13 B cell mediated immunity (GO:0019724) 1/11 0.02978801 CARD9
14 positive regulation of T-helper 17 type immune response (GO:2000318) 1/12 0.02978801 CARD9
15 positive regulation of adaptive immune response based on somatic recombination of immune receptors built from immunoglobulin superfamily domains (GO:0002824) 1/13 0.02978801 CARD9
16 homeostasis of number of cells (GO:0048872) 1/13 0.02978801 CARD9
17 antifungal innate immune response (GO:0061760) 1/13 0.02978801 CARD9
18 positive regulation of granulocyte macrophage colony-stimulating factor production (GO:0032725) 1/14 0.02978801 CARD9
19 extracellular matrix organization (GO:0030198) 2/300 0.02978801 ADAM15;ITGAL
20 innate immune response (GO:0045087) 2/302 0.02978801 ADAM15;CARD9
21 activation of NF-kappaB-inducing kinase activity (GO:0007250) 1/16 0.02978801 TNFSF15
22 regulation of granulocyte macrophage colony-stimulating factor production (GO:0032645) 1/16 0.02978801 CARD9
23 platelet-derived growth factor receptor signaling pathway (GO:0048008) 1/16 0.02978801 RGS14
24 nuclear transport (GO:0051169) 1/16 0.02978801 RGS14
25 positive regulation of cytokine production involved in inflammatory response (GO:1900017) 1/17 0.03037846 CARD9
26 positive regulation of stress-activated protein kinase signaling cascade (GO:0070304) 1/18 0.03092289 CARD9
27 long-term memory (GO:0007616) 1/19 0.03142642 RGS14
28 long-term synaptic potentiation (GO:0060291) 1/21 0.03348225 RGS14
29 positive regulation of interleukin-17 production (GO:0032740) 1/23 0.03421434 CARD9
30 negative regulation of G protein-coupled receptor signaling pathway (GO:0045744) 1/23 0.03421434 RGS14
31 defense response to fungus (GO:0050832) 1/24 0.03454421 CARD9
32 leukocyte cell-cell adhesion (GO:0007159) 1/28 0.03671988 ITGAL
33 receptor clustering (GO:0043113) 1/28 0.03671988 ITGAL
34 T cell activation involved in immune response (GO:0002286) 1/28 0.03671988 ITGAL
35 negative regulation of cell-matrix adhesion (GO:0001953) 1/32 0.03960645 ADAM15
36 modulation by host of symbiont process (GO:0051851) 1/32 0.03960645 CARD9
37 regulation of interleukin-17 production (GO:0032660) 1/33 0.03973332 CARD9
38 neutrophil mediated immunity (GO:0002446) 2/488 0.04237620 CARD9;ITGAL
39 positive regulation of cell development (GO:0010720) 1/38 0.04237620 RGS14
40 cellular response to ketone (GO:1901655) 1/39 0.04237620 ADAM15
41 negative regulation of cell-substrate adhesion (GO:0010812) 1/40 0.04237620 ADAM15
42 nucleocytoplasmic transport (GO:0006913) 1/40 0.04237620 RGS14
43 heterophilic cell-cell adhesion via plasma membrane cell adhesion molecules (GO:0007157) 1/42 0.04344505 ITGAL
44 regulation of cytokine production involved in inflammatory response (GO:1900015) 1/43 0.04346097 CARD9
45 positive regulation of nervous system development (GO:0051962) 1/45 0.04441732 RGS14
46 negative regulation of MAP kinase activity (GO:0043407) 1/48 0.04441732 RGS14
47 cellular response to alcohol (GO:0097306) 1/48 0.04441732 ADAM15
48 regulation of stress-activated MAPK cascade (GO:0032872) 1/49 0.04441732 CARD9
49 cellular defense response (GO:0006968) 1/49 0.04441732 LSP1
50 negative regulation of ERK1 and ERK2 cascade (GO:0070373) 1/50 0.04441732 RGS14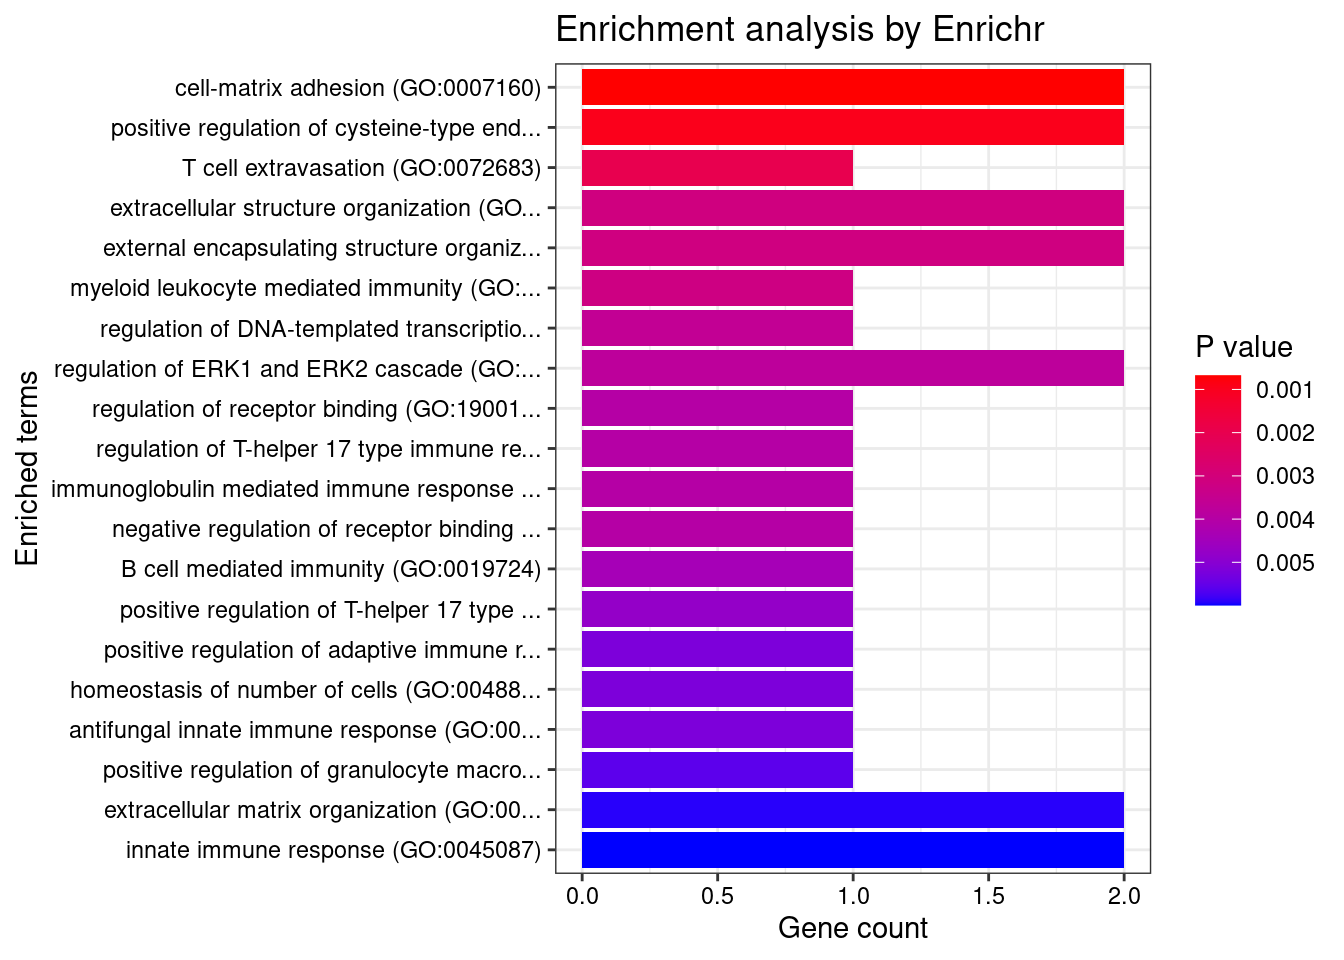
| Version | Author | Date |
|---|---|---|
| d46127d | wesleycrouse | 2022-05-24 |
Heart_Left_Ventricle
Number of cTWAS Genes in Tissue: 6
Uploading data to Enrichr... Done.
Querying GO_Biological_Process_2021... Done.
Parsing results... Done.
GO_Biological_Process_2021
Term Overlap Adjusted.P.value Genes
1 positive regulation of metallopeptidase activity (GO:1905050) 1/5 0.02239961 STAT3
2 radial glial cell differentiation (GO:0060019) 1/6 0.02239961 STAT3
3 T-helper 17 cell lineage commitment (GO:0072540) 1/6 0.02239961 STAT3
4 regulation of miRNA mediated inhibition of translation (GO:1905616) 1/7 0.02239961 STAT3
5 T-helper 17 cell differentiation (GO:0072539) 1/7 0.02239961 STAT3
6 photoreceptor cell differentiation (GO:0046530) 1/7 0.02239961 STAT3
7 astrocyte differentiation (GO:0048708) 1/7 0.02239961 STAT3
8 positive regulation of miRNA mediated inhibition of translation (GO:1905618) 1/7 0.02239961 STAT3
9 cellular response to interleukin-21 (GO:0098757) 1/8 0.02239961 STAT3
10 T-helper cell lineage commitment (GO:0002295) 1/8 0.02239961 STAT3
11 interleukin-21-mediated signaling pathway (GO:0038114) 1/8 0.02239961 STAT3
12 cellular response to interleukin-9 (GO:0071355) 1/9 0.02239961 STAT3
13 cellular response to leptin stimulus (GO:0044320) 1/9 0.02239961 STAT3
14 response to leptin (GO:0044321) 1/9 0.02239961 STAT3
15 regulation of DNA-templated transcription in response to stress (GO:0043620) 1/9 0.02239961 RGS14
16 interleukin-23-mediated signaling pathway (GO:0038155) 1/9 0.02239961 STAT3
17 interleukin-9-mediated signaling pathway (GO:0038113) 1/9 0.02239961 STAT3
18 regulation of receptor binding (GO:1900120) 1/10 0.02239961 ADAM15
19 leptin-mediated signaling pathway (GO:0033210) 1/10 0.02239961 STAT3
20 negative regulation of receptor binding (GO:1900121) 1/10 0.02239961 ADAM15
21 positive regulation of posttranscriptional gene silencing (GO:0060148) 1/11 0.02239961 STAT3
22 interleukin-35-mediated signaling pathway (GO:0070757) 1/11 0.02239961 STAT3
23 cellular response to growth hormone stimulus (GO:0071378) 1/12 0.02239961 STAT3
24 regulation of feeding behavior (GO:0060259) 1/12 0.02239961 STAT3
25 eye photoreceptor cell differentiation (GO:0001754) 1/12 0.02239961 STAT3
26 negative regulation of production of miRNAs involved in gene silencing by miRNA (GO:1903799) 1/12 0.02239961 STAT3
27 cellular response to interleukin-15 (GO:0071350) 1/13 0.02253013 STAT3
28 interleukin-15-mediated signaling pathway (GO:0035723) 1/13 0.02253013 STAT3
29 regulation of response to interferon-gamma (GO:0060330) 1/14 0.02255074 IFNGR2
30 growth hormone receptor signaling pathway via JAK-STAT (GO:0060397) 1/14 0.02255074 STAT3
31 interleukin-27-mediated signaling pathway (GO:0070106) 1/15 0.02255074 STAT3
32 platelet-derived growth factor receptor signaling pathway (GO:0048008) 1/16 0.02255074 RGS14
33 nuclear transport (GO:0051169) 1/16 0.02255074 RGS14
34 positive regulation of cytokine production involved in inflammatory response (GO:1900017) 1/17 0.02255074 STAT3
35 interleukin-6-mediated signaling pathway (GO:0070102) 1/18 0.02255074 STAT3
36 cellular response to interleukin-7 (GO:0098761) 1/19 0.02255074 STAT3
37 long-term memory (GO:0007616) 1/19 0.02255074 RGS14
38 interleukin-7-mediated signaling pathway (GO:0038111) 1/19 0.02255074 STAT3
39 transmembrane receptor protein tyrosine kinase signaling pathway (GO:0007169) 2/404 0.02255074 RGS14;STAT3
40 regulation of cell migration (GO:0030334) 2/408 0.02255074 ADAM15;STAT3
41 growth hormone receptor signaling pathway (GO:0060396) 1/20 0.02255074 STAT3
42 adaptive immune response based on somatic recombination of immune receptors built from immunoglobulin superfamily domains (GO:0002460) 1/20 0.02255074 STAT3
43 eye morphogenesis (GO:0048592) 1/20 0.02255074 STAT3
44 long-term synaptic potentiation (GO:0060291) 1/21 0.02313725 RGS14
45 regulation of interferon-gamma-mediated signaling pathway (GO:0060334) 1/23 0.02423298 IFNGR2
46 negative regulation of G protein-coupled receptor signaling pathway (GO:0045744) 1/23 0.02423298 RGS14
47 receptor signaling pathway via STAT (GO:0097696) 1/25 0.02577333 STAT3
48 positive regulation of erythrocyte differentiation (GO:0045648) 1/27 0.02641480 STAT3
49 positive regulation of gene silencing by miRNA (GO:2000637) 1/27 0.02641480 STAT3
50 cellular response to cytokine stimulus (GO:0071345) 2/482 0.02641480 IFNGR2;STAT3
51 cellular response to interleukin-6 (GO:0071354) 1/28 0.02659216 STAT3
52 glial cell differentiation (GO:0010001) 1/29 0.02700885 STAT3
53 positive regulation of endopeptidase activity (GO:0010950) 1/30 0.02740960 STAT3
54 receptor signaling pathway via JAK-STAT (GO:0007259) 1/31 0.02766373 STAT3
55 negative regulation of cell-matrix adhesion (GO:0001953) 1/32 0.02766373 ADAM15
56 positive regulation of interleukin-10 production (GO:0032733) 1/32 0.02766373 STAT3
57 positive regulation of pri-miRNA transcription by RNA polymerase II (GO:1902895) 1/34 0.02886985 STAT3
58 positive regulation of myeloid cell differentiation (GO:0045639) 1/37 0.02976197 STAT3
59 regulation of erythrocyte differentiation (GO:0045646) 1/37 0.02976197 STAT3
60 response to estradiol (GO:0032355) 1/38 0.02976197 STAT3
61 positive regulation of cell development (GO:0010720) 1/38 0.02976197 RGS14
62 cellular response to ketone (GO:1901655) 1/39 0.02976197 ADAM15
63 response to peptide (GO:1901652) 1/39 0.02976197 STAT3
64 negative regulation of cell-substrate adhesion (GO:0010812) 1/40 0.02976197 ADAM15
65 nucleocytoplasmic transport (GO:0006913) 1/40 0.02976197 RGS14
66 regulation of cytokine production involved in inflammatory response (GO:1900015) 1/43 0.03107122 STAT3
67 cytokine-mediated signaling pathway (GO:0019221) 2/621 0.03107122 IFNGR2;STAT3
68 positive regulation of nervous system development (GO:0051962) 1/45 0.03107122 RGS14
69 positive regulation of Notch signaling pathway (GO:0045747) 1/45 0.03107122 STAT3
70 regulation of pri-miRNA transcription by RNA polymerase II (GO:1902893) 1/45 0.03107122 STAT3
71 negative regulation of MAP kinase activity (GO:0043407) 1/48 0.03176871 RGS14
72 regulation of interleukin-10 production (GO:0032653) 1/48 0.03176871 STAT3
73 cellular response to alcohol (GO:0097306) 1/48 0.03176871 ADAM15
74 negative regulation of ERK1 and ERK2 cascade (GO:0070373) 1/50 0.03263706 RGS14
75 response to peptide hormone (GO:0043434) 1/52 0.03348161 STAT3
76 positive regulation of interleukin-1 beta production (GO:0032731) 1/56 0.03556491 STAT3
77 negative regulation of autophagy (GO:0010507) 1/59 0.03646697 STAT3
78 positive regulation of tyrosine phosphorylation of STAT protein (GO:0042531) 1/59 0.03646697 STAT3
79 response to organic cyclic compound (GO:0014070) 1/60 0.03646697 STAT3
80 positive regulation of interleukin-8 production (GO:0032757) 1/61 0.03646697 STAT3
81 regulation of neurogenesis (GO:0050767) 1/62 0.03646697 RGS14
82 positive regulation of interleukin-1 production (GO:0032732) 1/62 0.03646697 STAT3
83 regulation of cell-matrix adhesion (GO:0001952) 1/65 0.03670097 ADAM15
84 extracellular matrix disassembly (GO:0022617) 1/66 0.03670097 ADAM15
85 cellular component disassembly (GO:0022411) 1/66 0.03670097 ADAM15
86 regulation of gene silencing by miRNA (GO:0060964) 1/67 0.03670097 STAT3
87 interferon-gamma-mediated signaling pathway (GO:0060333) 1/68 0.03670097 IFNGR2
88 regulation of tyrosine phosphorylation of STAT protein (GO:0042509) 1/68 0.03670097 STAT3
89 negative regulation of cellular catabolic process (GO:0031330) 1/69 0.03670097 STAT3
90 carbohydrate homeostasis (GO:0033500) 1/70 0.03670097 STAT3
91 positive regulation of neurogenesis (GO:0050769) 1/72 0.03670097 RGS14
92 positive regulation of synaptic transmission (GO:0050806) 1/73 0.03670097 RGS14
93 regulation of cytokine-mediated signaling pathway (GO:0001959) 1/74 0.03670097 IFNGR2
94 negative regulation of protein binding (GO:0032091) 1/74 0.03670097 ADAM15
95 integrin-mediated signaling pathway (GO:0007229) 1/75 0.03670097 ADAM15
96 cellular response to hormone stimulus (GO:0032870) 1/76 0.03670097 STAT3
97 establishment of protein localization to organelle (GO:0072594) 1/76 0.03670097 STAT3
98 positive regulation of interleukin-6 production (GO:0032755) 1/76 0.03670097 STAT3
99 protein import into nucleus (GO:0006606) 1/76 0.03670097 STAT3
100 positive regulation of tumor necrosis factor production (GO:0032760) 1/77 0.03670097 STAT3
101 import into nucleus (GO:0051170) 1/77 0.03670097 STAT3
102 negative regulation of protein serine/threonine kinase activity (GO:0071901) 1/78 0.03680853 RGS14
103 positive regulation of tumor necrosis factor superfamily cytokine production (GO:1903557) 1/81 0.03731446 STAT3
104 regulation of interleukin-8 production (GO:0032677) 1/81 0.03731446 STAT3
105 regulation of G protein-coupled receptor signaling pathway (GO:0008277) 1/82 0.03731446 RGS14
106 regulation of Notch signaling pathway (GO:0008593) 1/83 0.03731446 STAT3
107 regulation of interleukin-1 beta production (GO:0032651) 1/83 0.03731446 STAT3
108 glucose homeostasis (GO:0042593) 1/86 0.03829083 STAT3
109 protein import (GO:0017038) 1/89 0.03924830 STAT3
110 negative regulation of MAPK cascade (GO:0043409) 1/94 0.04105078 RGS14
111 regulation of MAP kinase activity (GO:0043405) 1/97 0.04196355 RGS14
112 cell-matrix adhesion (GO:0007160) 1/100 0.04285907 ADAM15
113 protein localization to nucleus (GO:0034504) 1/106 0.04499485 STAT3
114 regulation of interleukin-6 production (GO:0032675) 1/110 0.04626007 STAT3
115 negative regulation of cell motility (GO:2000146) 1/114 0.04709214 ADAM15
116 response to lipid (GO:0033993) 1/114 0.04709214 STAT3
117 cellular response to interferon-gamma (GO:0071346) 1/121 0.04951325 IFNGR2
118 cellular response to organic substance (GO:0071310) 1/123 0.04982370 STAT3
119 regulation of tumor necrosis factor production (GO:0032680) 1/124 0.04982370 STAT3
120 negative regulation of cell growth (GO:0030308) 1/126 0.04982370 ADAM15
121 negative regulation of growth (GO:0045926) 1/126 0.04982370 ADAM15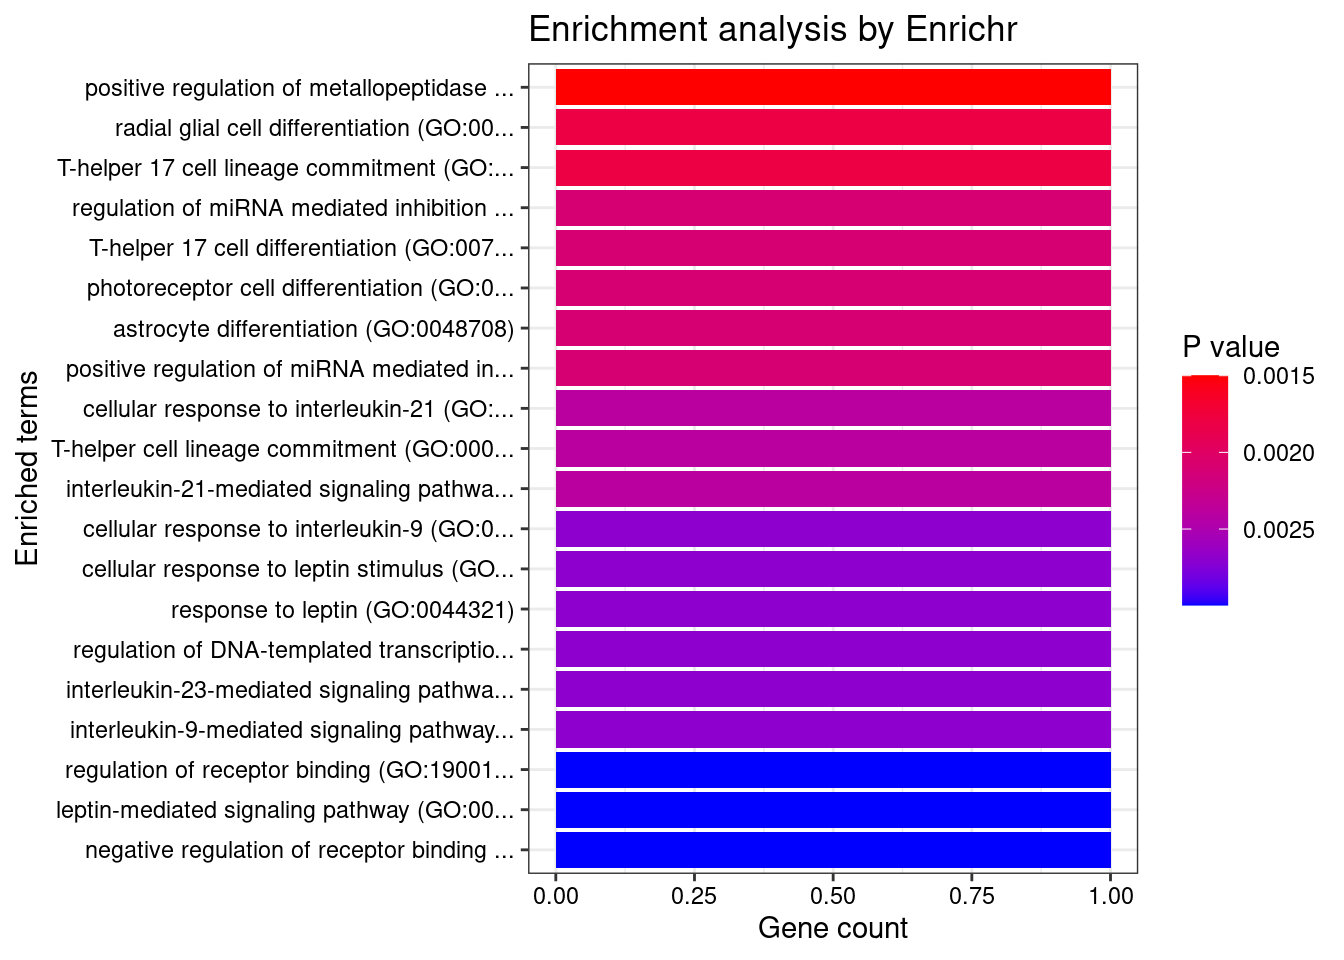
| Version | Author | Date |
|---|---|---|
| d46127d | wesleycrouse | 2022-05-24 |
Skin_Not_Sun_Exposed_Suprapubic
Number of cTWAS Genes in Tissue: 2
Uploading data to Enrichr... Done.
Querying GO_Biological_Process_2021... Done.
Parsing results... Done.
GO_Biological_Process_2021
Term Overlap Adjusted.P.value Genes
1 peptidyl-proline hydroxylation to 4-hydroxy-L-proline (GO:0018401) 1/8 0.004948653 P4HA2
2 peptidyl-proline hydroxylation (GO:0019511) 1/11 0.004948653 P4HA2
3 collagen fibril organization (GO:0030199) 1/89 0.026640971 P4HA2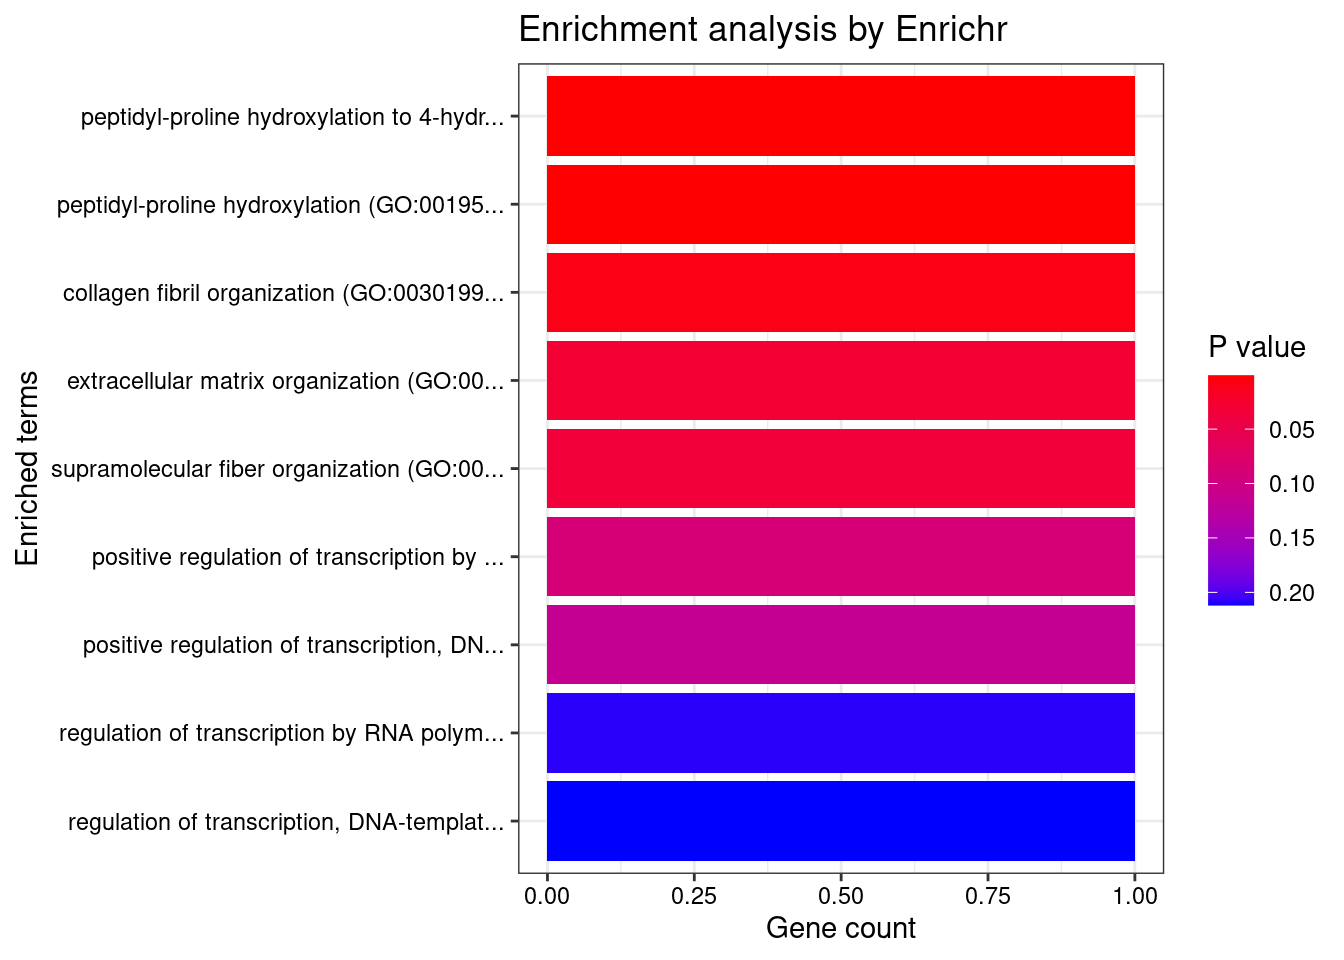
| Version | Author | Date |
|---|---|---|
| d46127d | wesleycrouse | 2022-05-24 |
KEGG
output <- output[order(-output$pve_g),]
top_tissues <- output$weight[1:5]
for (tissue in top_tissues){
cat(paste0(tissue, "\n\n"))
ctwas_genes_tissue <- df[[tissue]]$ctwas
background_tissue <- df[[tissue]]$gene_pips$genename
cat(paste0("Number of cTWAS Genes in Tissue: ", length(ctwas_genes_tissue), "\n\n"))
databases <- c("pathway_KEGG")
enrichResult <- NULL
try(enrichResult <- WebGestaltR(enrichMethod="ORA", organism="hsapiens",
interestGene=ctwas_genes_tissue, referenceGene=background_tissue,
enrichDatabase=databases, interestGeneType="genesymbol",
referenceGeneType="genesymbol", isOutput=F))
if (!is.null(enrichResult)){
print(enrichResult[,c("description", "size", "overlap", "FDR", "userId")])
}
cat("\n")
} Whole_Blood
Number of cTWAS Genes in Tissue: 11
Loading the functional categories...
Loading the ID list...
Loading the reference list...
Performing the enrichment analysis...Warning in oraEnrichment(interestGeneList, referenceGeneList, geneSet, minNum = minNum, : No significant gene set is identified based on FDR 0.05!
Colon_Transverse
Number of cTWAS Genes in Tissue: 10
Loading the functional categories...
Loading the ID list...
Loading the reference list...
Performing the enrichment analysis...Warning in oraEnrichment(interestGeneList, referenceGeneList, geneSet, minNum = minNum, : No significant gene set is identified based on FDR 0.05!
Esophagus_Muscularis
Number of cTWAS Genes in Tissue: 8
Loading the functional categories...
Loading the ID list...
Loading the reference list...
Performing the enrichment analysis...Warning in oraEnrichment(interestGeneList, referenceGeneList, geneSet, minNum = minNum, : No significant gene set is identified based on FDR 0.05!
Heart_Left_Ventricle
Number of cTWAS Genes in Tissue: 6
Loading the functional categories...
Loading the ID list...
Loading the reference list...
Performing the enrichment analysis...
description size overlap FDR userId
1 Inflammatory bowel disease (IBD) 25 2 0.03945314 STAT3;IFNGR2
2 HIF-1 signaling pathway 53 2 0.04809484 STAT3;IFNGR2
3 Th17 cell differentiation 54 2 0.04809484 STAT3;IFNGR2
4 Measles 62 2 0.04809484 STAT3;IFNGR2
5 JAK-STAT signaling pathway 65 2 0.04809484 STAT3;IFNGR2
6 Toxoplasmosis 67 2 0.04809484 STAT3;IFNGR2
Skin_Not_Sun_Exposed_Suprapubic
Number of cTWAS Genes in Tissue: 2
Loading the functional categories...
Loading the ID list...
Loading the reference list...
Performing the enrichment analysis...Warning in oraEnrichment(interestGeneList, referenceGeneList, geneSet, minNum = minNum, : No significant gene set is identified based on FDR 0.05!DisGeNET
output <- output[order(-output$pve_g),]
top_tissues <- output$weight[1:5]
for (tissue in top_tissues){
cat(paste0(tissue, "\n\n"))
ctwas_genes_tissue <- df[[tissue]]$ctwas
cat(paste0("Number of cTWAS Genes in Tissue: ", length(ctwas_genes_tissue), "\n\n"))
res_enrich <- disease_enrichment(entities=ctwas_genes_tissue, vocabulary = "HGNC", database = "CURATED")
if (any(res_enrich@qresult$FDR < 0.05)){
  print(res_enrich@qresult[res_enrich@qresult$FDR < 0.05, c("Description", "FDR", "Ratio",  "BgRatio")])
}
cat("\n")
} Whole_Blood
Number of cTWAS Genes in Tissue: 11C10orf105 gene(s) from the input list not found in DisGeNET CURATEDBRD7 gene(s) from the input list not found in DisGeNET CURATEDCPEB4 gene(s) from the input list not found in DisGeNET CURATEDNPIPB3 gene(s) from the input list not found in DisGeNET CURATEDADAM15 gene(s) from the input list not found in DisGeNET CURATEDBIK gene(s) from the input list not found in DisGeNET CURATED Description FDR Ratio BgRatio
15 Ulcerative Colitis 0.006778935 2/5 63/9703
67 West Nile Fever 0.006778935 1/5 1/9703
113 Encephalitis, West Nile Fever 0.006778935 1/5 1/9703
114 West Nile Fever Meningitis 0.006778935 1/5 1/9703
115 West Nile Fever Meningoencephalitis 0.006778935 1/5 1/9703
116 West Nile Fever Myelitis 0.006778935 1/5 1/9703
135 Deep seated dermatophytosis 0.006778935 1/5 1/9703
137 Chronic Lymphoproliferative Disorder of NK-Cells 0.006778935 1/5 1/9703
151 DIABETES MELLITUS, INSULIN-DEPENDENT, 22 (disorder) 0.006778935 1/5 1/9703
153 Neutropenia and hyperlymphocytosis with large granular lymphocytes 0.006778935 1/5 1/9703
155 Hyper-Ige Recurrent Infection Syndrome, Autosomal Dominant 0.006778935 1/5 1/9703
160 AUTOIMMUNE DISEASE, MULTISYSTEM, INFANTILE-ONSET, 1 0.006778935 1/5 1/9703
170 HYPER-IgE RECURRENT INFECTION SYNDROME 1, AUTOSOMAL DOMINANT 0.006778935 1/5 1/9703
55 Pancreatic Neoplasm 0.009168962 2/5 100/9703
100 Malignant neoplasm of pancreas 0.009168962 2/5 102/9703
144 Visceral myopathy familial external ophthalmoplegia 0.009168962 1/5 2/9703
145 Candidiasis, Familial, 2 0.009168962 1/5 2/9703
148 T-Cell Large Granular Lymphocyte Leukemia 0.009168962 1/5 2/9703
152 MITOCHONDRIAL DNA DEPLETION SYNDROME 5 (ENCEPHALOMYOPATHIC WITH OR WITHOUT METHYLMALONIC ACIDURIA) 0.009168962 1/5 2/9703
162 Mitochondrial DNA Depletion Syndrome 1 0.009168962 1/5 2/9703
122 MITOCHONDRIAL NEUROGASTROINTESTINAL ENCEPHALOPATHY SYNDROME 0.011489977 1/5 3/9703
149 Hyper-Immunoglobulin E Syndrome, Autosomal Recessive 0.011489977 1/5 3/9703
154 Hyper-Immunoglobulin E Syndrome, Autosomal Dominant 0.011489977 1/5 3/9703
12 Neoplastic Cell Transformation 0.013549487 2/5 139/9703
85 Ki-1+ Anaplastic Large Cell Lymphoma 0.013549487 1/5 4/9703
159 Job Syndrome 0.013549487 1/5 4/9703
8 Carcinoma 0.013816268 2/5 164/9703
9 Malignant tumor of colon 0.013816268 2/5 159/9703
16 Colonic Neoplasms 0.013816268 2/5 152/9703
39 Leukemia, T-Cell 0.013816268 1/5 5/9703
79 Anaplastic carcinoma 0.013816268 2/5 163/9703
80 Carcinoma, Spindle-Cell 0.013816268 2/5 163/9703
81 Undifferentiated carcinoma 0.013816268 2/5 163/9703
82 Carcinomatosis 0.013816268 2/5 163/9703
143 DIABETES MELLITUS, PERMANENT NEONATAL 0.017603441 1/5 7/9703
53 Nephritis 0.021995229 1/5 9/9703
51 Neoplasm Metastasis 0.022016938 2/5 217/9703
97 Atrophic 0.023148100 1/5 10/9703
65 Ankylosing spondylitis 0.023594904 1/5 11/9703
92 Leukoencephalopathy 0.023594904 1/5 11/9703
146 Copper-Overload Cirrhosis 0.023594904 1/5 11/9703
37 Precursor B-Cell Lymphoblastic Leukemia-Lymphoma 0.025121861 1/5 12/9703
29 Hepatitis C 0.030653073 1/5 15/9703
68 T-Cell Lymphoma 0.031946918 1/5 16/9703
141 Hereditary Diffuse Gastric Cancer 0.032522747 2/5 293/9703
45 Malignant neoplasm of stomach 0.032599230 2/5 300/9703
66 Stomach Neoplasms 0.032599230 2/5 297/9703
89 Congenital hernia of foramen of Morgagni 0.032709692 1/5 19/9703
90 Congenital hernia of foramen of Bochdalek 0.032709692 1/5 19/9703
168 Hamman-Rich Disease 0.032709692 1/5 19/9703
169 Usual Interstitial Pneumonia 0.032709692 1/5 19/9703
28 Hepatitis, Chronic 0.033282741 1/5 22/9703
72 Chronic Persistent Hepatitis 0.033282741 1/5 22/9703
87 Congenital diaphragmatic hernia 0.033282741 1/5 21/9703
102 Chronic active hepatitis 0.033282741 1/5 22/9703
103 Cryptogenic Chronic Hepatitis 0.033282741 1/5 22/9703
142 Idiopathic Pulmonary Fibrosis 0.033282741 1/5 21/9703
171 Familial Idiopathic Pulmonary Fibrosis 0.033282741 1/5 20/9703
73 Neonatal diabetes mellitus 0.037157267 1/5 25/9703
44 Lymphatic Metastasis 0.037991664 1/5 26/9703
24 Fever 0.038798113 1/5 27/9703
2 Arthritis, Adjuvant-Induced 0.040034633 1/5 40/9703
4 Autoimmune Diseases 0.040034633 1/5 42/9703
14 Uterine Cervical Neoplasm 0.040034633 1/5 35/9703
21 Dermatitis, Atopic 0.040034633 1/5 36/9703
26 IGA Glomerulonephritis 0.040034633 1/5 34/9703
33 Inflammatory Bowel Diseases 0.040034633 1/5 35/9703
40 Adult T-Cell Lymphoma/Leukemia 0.040034633 1/5 31/9703
49 Memory Disorders 0.040034633 1/5 43/9703
69 Eczema, Infantile 0.040034633 1/5 36/9703
83 Diabetes, Autoimmune 0.040034633 1/5 44/9703
84 Medullomyoblastoma 0.040034633 1/5 43/9703
86 Memory impairment 0.040034633 1/5 44/9703
88 Middle Cerebral Artery Syndrome 0.040034633 1/5 34/9703
93 Childhood Medulloblastoma 0.040034633 1/5 43/9703
94 Adult Medulloblastoma 0.040034633 1/5 43/9703
98 Brittle diabetes 0.040034633 1/5 44/9703
105 Middle Cerebral Artery Thrombosis 0.040034633 1/5 34/9703
106 Middle Cerebral Artery Occlusion 0.040034633 1/5 34/9703
107 Infarction, Middle Cerebral Artery 0.040034633 1/5 34/9703
108 Desmoplastic Medulloblastoma 0.040034633 1/5 43/9703
109 Age-Related Memory Disorders 0.040034633 1/5 43/9703
110 Memory Disorder, Semantic 0.040034633 1/5 43/9703
111 Memory Disorder, Spatial 0.040034633 1/5 43/9703
112 Memory Loss 0.040034633 1/5 43/9703
117 Middle Cerebral Artery Embolus 0.040034633 1/5 34/9703
118 Left Middle Cerebral Artery Infarction 0.040034633 1/5 34/9703
119 Embolic Infarction, Middle Cerebral Artery 0.040034633 1/5 34/9703
120 Thrombotic Infarction, Middle Cerebral Artery 0.040034633 1/5 34/9703
121 Right Middle Cerebral Artery Infarction 0.040034633 1/5 34/9703
126 Arthritis, Collagen-Induced 0.040034633 1/5 40/9703
127 Arthritis, Experimental 0.040034633 1/5 40/9703
133 Melanotic medulloblastoma 0.040034633 1/5 43/9703
158 Diabetes Mellitus, Ketosis-Prone 0.040034633 1/5 44/9703
161 cervical cancer 0.040034633 1/5 34/9703
164 Diabetes Mellitus, Sudden-Onset 0.040034633 1/5 44/9703
22 Diabetes Mellitus, Insulin-Dependent 0.040514049 1/5 45/9703
38 Acute Promyelocytic Leukemia 0.040983315 1/5 46/9703
19 Crohn Disease 0.042764853 1/5 50/9703
25 Fibrosis 0.042764853 1/5 50/9703
48 Medulloblastoma 0.042764853 1/5 50/9703
140 Cirrhosis 0.042764853 1/5 50/9703
130 Squamous cell carcinoma of the head and neck 0.044025488 1/5 52/9703
35 leukemia 0.046089158 1/5 55/9703
54 Pustulosis of Palms and Soles 0.046844578 1/5 57/9703
60 Psoriasis 0.046844578 1/5 57/9703
3 Atherosclerosis 0.047487606 1/5 59/9703
13 Brain Ischemia 0.047487606 1/5 60/9703
124 Cerebral Ischemia 0.047487606 1/5 60/9703
138 Atherogenesis 0.047487606 1/5 59/9703
Colon_Transverse
Number of cTWAS Genes in Tissue: 10UBE2W gene(s) from the input list not found in DisGeNET CURATEDZGLP1 gene(s) from the input list not found in DisGeNET CURATEDRP11-386E5.1 gene(s) from the input list not found in DisGeNET CURATEDPOM121C gene(s) from the input list not found in DisGeNET CURATEDRNF186 gene(s) from the input list not found in DisGeNET CURATED Description FDR Ratio BgRatio
39 Inflammatory Bowel Disease 10 0.004844362 1/5 1/9703
40 MICROVASCULAR COMPLICATIONS OF DIABETES, SUSCEPTIBILITY TO, 7 (finding) 0.004844362 1/5 1/9703
45 IMMUNODEFICIENCY 32A 0.004844362 1/5 1/9703
46 IMMUNODEFICIENCY 28 0.004844362 1/5 1/9703
47 IMMUNODEFICIENCY 32B 0.004844362 1/5 1/9703
21 Variegate Porphyria 0.006919090 1/5 2/9703
42 Porphyria, South African type 0.006919090 1/5 2/9703
44 HEMOCHROMATOSIS, TYPE 1 0.009079434 1/5 3/9703
22 Porphyria Cutanea Tarda 0.010758592 1/5 4/9703
10 Lead Poisoning 0.016934304 1/5 7/9703
7 Hemochromatosis 0.022436100 1/5 12/9703
26 Erythrocyte Mean Corpuscular Hemoglobin Test 0.022436100 1/5 13/9703
27 Hereditary hemochromatosis 0.022436100 1/5 12/9703
36 Finding of Mean Corpuscular Hemoglobin 0.022436100 1/5 13/9703
3 Birth Weight 0.022546508 1/5 14/9703
8 Hepatitis C 0.022642493 1/5 15/9703
14 Osteoarthritis of hip 0.028384831 1/5 20/9703
41 Hematopoetic Myelodysplasia 0.038799383 1/5 29/9703
9 Inflammatory Bowel Diseases 0.041543758 1/5 35/9703
13 Multiple Sclerosis 0.041543758 1/5 45/9703
20 Crohn's disease of large bowel 0.041543758 1/5 44/9703
23 Crohn's disease of the ileum 0.041543758 1/5 44/9703
25 Gastric Adenocarcinoma 0.041543758 1/5 45/9703
30 Regional enteritis 0.041543758 1/5 44/9703
33 Multiple Sclerosis, Acute Fulminating 0.041543758 1/5 45/9703
34 IIeocolitis 0.041543758 1/5 44/9703
5 Crohn Disease 0.042818443 1/5 50/9703
37 Cardiomyopathy, Familial Idiopathic 0.042818443 1/5 50/9703
11 Chronic Lymphocytic Leukemia 0.043914972 1/5 55/9703
17 Diffuse Large B-Cell Lymphoma 0.043914972 1/5 55/9703
Esophagus_Muscularis
Number of cTWAS Genes in Tissue: 8RP11-973H7.1 gene(s) from the input list not found in DisGeNET CURATEDADAM15 gene(s) from the input list not found in DisGeNET CURATEDRGS14 gene(s) from the input list not found in DisGeNET CURATED Description FDR Ratio BgRatio
10 Inflammatory Bowel Diseases 1.327668e-05 3/5 35/9703
5 Ulcerative Colitis 4.010266e-05 3/5 63/9703
6 Enteritis 3.994022e-03 1/5 1/9703
25 Deep seated dermatophytosis 3.994022e-03 1/5 1/9703
28 Candidiasis, Familial, 2 6.389117e-03 1/5 2/9703
29 clinical depression 1.595963e-02 1/5 6/9703
16 Ankylosing spondylitis 2.505357e-02 1/5 11/9703
1 Behcet Syndrome 2.725801e-02 1/5 24/9703
14 Noonan Syndrome 2.725801e-02 1/5 24/9703
18 LEOPARD Syndrome 2.725801e-02 1/5 22/9703
21 Costello syndrome (disorder) 2.725801e-02 1/5 19/9703
24 Cardio-facio-cutaneous syndrome 2.725801e-02 1/5 19/9703
27 Noonan syndrome-like disorder with loose anagen hair 2.725801e-02 1/5 19/9703
30 Noonan-Like Syndrome With Loose Anagen Hair 2.725801e-02 1/5 19/9703
8 Heart valve disease 2.754951e-02 1/5 26/9703
7 IGA Glomerulonephritis 3.371898e-02 1/5 34/9703
3 Calcinosis 3.501828e-02 1/5 42/9703
19 Tumoral calcinosis 3.501828e-02 1/5 42/9703
20 Microcalcification 3.501828e-02 1/5 42/9703
4 Primary biliary cirrhosis 3.541848e-02 1/5 47/9703
11 Acute Promyelocytic Leukemia 3.541848e-02 1/5 46/9703
Heart_Left_Ventricle
Number of cTWAS Genes in Tissue: 6RGS14 gene(s) from the input list not found in DisGeNET CURATEDRP11-373D23.3 gene(s) from the input list not found in DisGeNET CURATEDADAM15 gene(s) from the input list not found in DisGeNET CURATED Description FDR Ratio BgRatio
113 Chronic Lymphoproliferative Disorder of NK-Cells 0.007266543 1/3 1/9703
123 Neutropenia and hyperlymphocytosis with large granular lymphocytes 0.007266543 1/3 1/9703
125 Hyper-Ige Recurrent Infection Syndrome, Autosomal Dominant 0.007266543 1/3 1/9703
130 IMMUNODEFICIENCY 28 0.007266543 1/3 1/9703
131 AUTOIMMUNE DISEASE, MULTISYSTEM, INFANTILE-ONSET, 1 0.007266543 1/3 1/9703
140 HYPER-IgE RECURRENT INFECTION SYNDROME 1, AUTOSOMAL DOMINANT 0.007266543 1/3 1/9703
121 T-Cell Large Granular Lymphocyte Leukemia 0.012455647 1/3 2/9703
122 Hyper-Immunoglobulin E Syndrome, Autosomal Recessive 0.014530090 1/3 3/9703
124 Hyper-Immunoglobulin E Syndrome, Autosomal Dominant 0.014530090 1/3 3/9703
70 Ki-1+ Anaplastic Large Cell Lymphoma 0.015849373 1/3 4/9703
129 Job Syndrome 0.015849373 1/3 4/9703
29 Leukemia, T-Cell 0.018158868 1/3 5/9703
118 DIABETES MELLITUS, PERMANENT NEONATAL 0.023462006 1/3 7/9703
2 Arthritis, Adjuvant-Induced 0.030804458 1/3 40/9703
4 Autoimmune Diseases 0.030804458 1/3 42/9703
12 Uterine Cervical Neoplasm 0.030804458 1/3 35/9703
18 Fever 0.030804458 1/3 27/9703
21 Hepatitis, Chronic 0.030804458 1/3 22/9703
27 Precursor B-Cell Lymphoblastic Leukemia-Lymphoma 0.030804458 1/3 12/9703
30 Adult T-Cell Lymphoma/Leukemia 0.030804458 1/3 31/9703
34 Lymphatic Metastasis 0.030804458 1/3 26/9703
39 Memory Disorders 0.030804458 1/3 43/9703
54 T-Cell Lymphoma 0.030804458 1/3 16/9703
57 Chronic Persistent Hepatitis 0.030804458 1/3 22/9703
58 Neonatal diabetes mellitus 0.030804458 1/3 25/9703
68 Diabetes, Autoimmune 0.030804458 1/3 44/9703
69 Medullomyoblastoma 0.030804458 1/3 43/9703
71 Memory impairment 0.030804458 1/3 44/9703
72 Congenital diaphragmatic hernia 0.030804458 1/3 21/9703
73 Middle Cerebral Artery Syndrome 0.030804458 1/3 34/9703
74 Congenital hernia of foramen of Morgagni 0.030804458 1/3 19/9703
75 Congenital hernia of foramen of Bochdalek 0.030804458 1/3 19/9703
76 Childhood Medulloblastoma 0.030804458 1/3 43/9703
77 Adult Medulloblastoma 0.030804458 1/3 43/9703
79 Atrophic 0.030804458 1/3 10/9703
80 Brittle diabetes 0.030804458 1/3 44/9703
84 Chronic active hepatitis 0.030804458 1/3 22/9703
85 Cryptogenic Chronic Hepatitis 0.030804458 1/3 22/9703
87 Middle Cerebral Artery Thrombosis 0.030804458 1/3 34/9703
88 Middle Cerebral Artery Occlusion 0.030804458 1/3 34/9703
89 Infarction, Middle Cerebral Artery 0.030804458 1/3 34/9703
90 Desmoplastic Medulloblastoma 0.030804458 1/3 43/9703
91 Age-Related Memory Disorders 0.030804458 1/3 43/9703
92 Memory Disorder, Semantic 0.030804458 1/3 43/9703
93 Memory Disorder, Spatial 0.030804458 1/3 43/9703
94 Memory Loss 0.030804458 1/3 43/9703
95 Middle Cerebral Artery Embolus 0.030804458 1/3 34/9703
96 Left Middle Cerebral Artery Infarction 0.030804458 1/3 34/9703
97 Embolic Infarction, Middle Cerebral Artery 0.030804458 1/3 34/9703
98 Thrombotic Infarction, Middle Cerebral Artery 0.030804458 1/3 34/9703
99 Right Middle Cerebral Artery Infarction 0.030804458 1/3 34/9703
103 Arthritis, Collagen-Induced 0.030804458 1/3 40/9703
104 Arthritis, Experimental 0.030804458 1/3 40/9703
110 Melanotic medulloblastoma 0.030804458 1/3 43/9703
117 Idiopathic Pulmonary Fibrosis 0.030804458 1/3 21/9703
119 Copper-Overload Cirrhosis 0.030804458 1/3 11/9703
128 Diabetes Mellitus, Ketosis-Prone 0.030804458 1/3 44/9703
132 cervical cancer 0.030804458 1/3 34/9703
134 Diabetes Mellitus, Sudden-Onset 0.030804458 1/3 44/9703
138 Hamman-Rich Disease 0.030804458 1/3 19/9703
139 Usual Interstitial Pneumonia 0.030804458 1/3 19/9703
141 Familial Idiopathic Pulmonary Fibrosis 0.030804458 1/3 20/9703
17 Diabetes Mellitus, Insulin-Dependent 0.031001286 1/3 45/9703
28 Acute Promyelocytic Leukemia 0.031191824 1/3 46/9703
15 Crohn Disease 0.031896618 1/3 50/9703
19 Fibrosis 0.031896618 1/3 50/9703
38 Medulloblastoma 0.031896618 1/3 50/9703
115 Cirrhosis 0.031896618 1/3 50/9703
107 Squamous cell carcinoma of the head and neck 0.032684971 1/3 52/9703
25 leukemia 0.034066220 1/3 55/9703
3 Atherosclerosis 0.034211544 1/3 59/9703
11 Brain Ischemia 0.034211544 1/3 60/9703
43 Pustulosis of Palms and Soles 0.034211544 1/3 57/9703
49 Psoriasis 0.034211544 1/3 57/9703
101 Cerebral Ischemia 0.034211544 1/3 60/9703
114 Atherogenesis 0.034211544 1/3 59/9703
13 Ulcerative Colitis 0.035444614 1/3 63/9703
42 Neoplasms, Experimental 0.036645037 1/3 66/9703
47 Cardiomyopathies, Primary 0.037341376 1/3 69/9703
52 Myocardial Diseases, Secondary 0.037341376 1/3 69/9703
33 Lung diseases 0.041652096 1/3 78/9703
20 Cardiomegaly 0.042715302 1/3 82/9703
111 Cardiac Hypertrophy 0.042715302 1/3 82/9703
137 Alveolitis, Fibrosing 0.042717087 1/3 83/9703
50 Pulmonary Fibrosis 0.043222813 1/3 85/9703
51 Reperfusion Injury 0.044712091 1/3 89/9703
44 Pancreatic Neoplasm 0.049604391 1/3 100/9703
1 Adenocarcinoma 0.049977948 1/3 116/9703
22 Hepatoma, Morris 0.049977948 1/3 110/9703
23 Hepatoma, Novikoff 0.049977948 1/3 110/9703
32 Liver Neoplasms, Experimental 0.049977948 1/3 110/9703
46 Precancerous Conditions 0.049977948 1/3 110/9703
55 Experimental Hepatoma 0.049977948 1/3 110/9703
59 Adenocarcinoma, Basal Cell 0.049977948 1/3 116/9703
60 Adenocarcinoma, Oxyphilic 0.049977948 1/3 116/9703
61 Carcinoma, Cribriform 0.049977948 1/3 116/9703
62 Carcinoma, Granular Cell 0.049977948 1/3 116/9703
63 Adenocarcinoma, Tubular 0.049977948 1/3 116/9703
78 Condition, Preneoplastic 0.049977948 1/3 110/9703
82 Malignant neoplasm of pancreas 0.049977948 1/3 102/9703
Skin_Not_Sun_Exposed_Suprapubic
Number of cTWAS Genes in Tissue: 2
Description FDR Ratio BgRatio
9 MYOPIA 25, AUTOSOMAL DOMINANT 0.002267574 1/2 1/9703
1 Glioblastoma 0.033778690 1/2 79/9703
3 Juvenile-Onset Still Disease 0.033778690 1/2 135/9703
5 Giant Cell Glioblastoma 0.033778690 1/2 84/9703
6 Glioblastoma Multiforme 0.033778690 1/2 111/9703
7 Juvenile arthritis 0.033778690 1/2 131/9703
8 Juvenile psoriatic arthritis 0.033778690 1/2 131/9703
10 Polyarthritis, Juvenile, Rheumatoid Factor Negative 0.033778690 1/2 131/9703
11 Polyarthritis, Juvenile, Rheumatoid Factor Positive 0.033778690 1/2 131/9703Gene sets curated by Macarthur Lab
output <- output[order(-output$pve_g),]
top_tissues <- output$weight[1:5]

gene_set_dir <- "/project2/mstephens/wcrouse/gene_sets/"
gene_set_files <- c("gwascatalog.tsv",
                    "mgi_essential.tsv",
                    "core_essentials_hart.tsv",
                    "clinvar_path_likelypath.tsv",
                    "fda_approved_drug_targets.tsv")

for (tissue in top_tissues){
  cat(paste0(tissue, "\n\n"))

  ctwas_genes_tissue <- df[[tissue]]$ctwas
  background_tissue <- df[[tissue]]$gene_pips$genename

  cat(paste0("Number of cTWAS Genes in Tissue: ", length(ctwas_genes_tissue), "\n\n"))

  gene_sets <- lapply(gene_set_files, function(x){as.character(read.table(paste0(gene_set_dir, x))[,1])})
  names(gene_sets) <- sapply(gene_set_files, function(x){unlist(strsplit(x, "[.]"))[1]})

  gene_lists <- list(ctwas_genes_tissue=ctwas_genes_tissue)

  #genes in gene_sets filtered to ensure inclusion in background
  gene_sets <- lapply(gene_sets, function(x){x[x %in% background_tissue]})

  ##########
  hyp_score <- data.frame()
  size <- c()
  ngenes <- c()

  for (i in 1:length(gene_sets)) {
    for (j in 1:length(gene_lists)){
      group1 <- length(gene_sets[[i]])
      group2 <- length(as.vector(gene_lists[[j]]))
      size <- c(size, group1)
      Overlap <- length(intersect(gene_sets[[i]],as.vector(gene_lists[[j]])))
      ngenes <- c(ngenes, Overlap)
      Total <- length(background_tissue)
      hyp_score[i,j] <- phyper(Overlap-1, group2, Total-group2, group1,lower.tail=F)
    }
  }
  rownames(hyp_score) <- names(gene_sets)
  colnames(hyp_score) <- names(gene_lists)

  hyp_score_padj <- apply(hyp_score,2, p.adjust, method="BH", n=(nrow(hyp_score)*ncol(hyp_score)))
  hyp_score_padj <- as.data.frame(hyp_score_padj)
  hyp_score_padj$gene_set <- rownames(hyp_score_padj)
  hyp_score_padj$nset <- size
  hyp_score_padj$ngenes <- ngenes
  hyp_score_padj$percent <- ngenes/size

  hyp_score_padj <- hyp_score_padj[order(hyp_score_padj$ctwas_genes),]
  colnames(hyp_score_padj)[1] <- "padj"
  hyp_score_padj <- hyp_score_padj[,c(2:5,1)]
  rownames(hyp_score_padj)<- NULL

  print(hyp_score_padj)

  cat("\n")
}
Whole_Blood
Number of cTWAS Genes in Tissue: 11
gene_set nset ngenes percent padj
1 fda_approved_drug_targets 177 2 0.011299435 0.07026224
2 clinvar_path_likelypath 1605 4 0.002492212 0.18351144
3 mgi_essential 1255 2 0.001593625 0.64192688
4 gwascatalog 3492 4 0.001145475 0.65617931
5 core_essentials_hart 154 0 0.000000000 1.00000000
Colon_Transverse
Number of cTWAS Genes in Tissue: 10
gene_set nset ngenes percent padj
1 gwascatalog 3741 7 0.001871157 0.0678073
2 clinvar_path_likelypath 1760 4 0.002272727 0.1174430
3 mgi_essential 1374 2 0.001455604 0.5366855
4 core_essentials_hart 177 0 0.000000000 1.0000000
5 fda_approved_drug_targets 197 0 0.000000000 1.0000000
Esophagus_Muscularis
Number of cTWAS Genes in Tissue: 8
gene_set nset ngenes percent padj
1 gwascatalog 3892 6 0.0015416238 0.07832236
2 fda_approved_drug_targets 194 1 0.0051546392 0.30119923
3 mgi_essential 1413 1 0.0007077141 0.89601634
4 clinvar_path_likelypath 1778 1 0.0005624297 0.89601634
5 core_essentials_hart 175 0 0.0000000000 1.00000000
Heart_Left_Ventricle
Number of cTWAS Genes in Tissue: 6
gene_set nset ngenes percent padj
1 gwascatalog 3529 3 0.0008500992 0.5033884
2 mgi_essential 1252 2 0.0015974441 0.5033884
3 clinvar_path_likelypath 1646 2 0.0012150668 0.5033884
4 core_essentials_hart 173 0 0.0000000000 1.0000000
5 fda_approved_drug_targets 181 0 0.0000000000 1.0000000
Skin_Not_Sun_Exposed_Suprapubic
Number of cTWAS Genes in Tissue: 2
gene_set nset ngenes percent padj
1 gwascatalog 3932 2 0.0005086470 0.4932321
2 mgi_essential 1462 1 0.0006839945 0.5498789
3 core_essentials_hart 172 0 0.0000000000 1.0000000
4 clinvar_path_likelypath 1830 0 0.0000000000 1.0000000
5 fda_approved_drug_targets 207 0 0.0000000000 1.0000000Summary of results across tissues
weight_groups <- as.data.frame(matrix(c("Adipose_Subcutaneous", "Adipose",
                                        "Adipose_Visceral_Omentum", "Adipose",
                                        "Adrenal_Gland", "Endocrine",
                                        "Artery_Aorta", "Cardiovascular",
                                        "Artery_Coronary", "Cardiovascular",
                                        "Artery_Tibial", "Cardiovascular",
                                        "Brain_Amygdala", "CNS",
                                        "Brain_Anterior_cingulate_cortex_BA24", "CNS",
                                        "Brain_Caudate_basal_ganglia", "CNS",
                                        "Brain_Cerebellar_Hemisphere", "CNS",
                                        "Brain_Cerebellum", "CNS",
                                        "Brain_Cortex", "CNS",
                                        "Brain_Frontal_Cortex_BA9", "CNS",
                                        "Brain_Hippocampus", "CNS",
                                        "Brain_Hypothalamus", "CNS",
                                        "Brain_Nucleus_accumbens_basal_ganglia", "CNS",
                                        "Brain_Putamen_basal_ganglia", "CNS",
                                        "Brain_Spinal_cord_cervical_c-1", "CNS",
                                        "Brain_Substantia_nigra", "CNS",
                                        "Breast_Mammary_Tissue", "None",
                                        "Cells_Cultured_fibroblasts", "Skin",
                                        "Cells_EBV-transformed_lymphocytes", "Blood or Immune",
                                        "Colon_Sigmoid", "Digestive",
                                        "Colon_Transverse", "Digestive",
                                        "Esophagus_Gastroesophageal_Junction", "Digestive",
                                        "Esophagus_Mucosa", "Digestive",
                                        "Esophagus_Muscularis", "Digestive",
                                        "Heart_Atrial_Appendage", "Cardiovascular",
                                        "Heart_Left_Ventricle", "Cardiovascular",
                                        "Kidney_Cortex", "None",
                                        "Liver", "None",
                                        "Lung", "None",
                                        "Minor_Salivary_Gland", "None",
                                        "Muscle_Skeletal", "None",
                                        "Nerve_Tibial", "None",
                                        "Ovary", "None",
                                        "Pancreas", "None",
                                        "Pituitary", "Endocrine",
                                        "Prostate", "None",
                                        "Skin_Not_Sun_Exposed_Suprapubic", "Skin",
                                        "Skin_Sun_Exposed_Lower_leg", "Skin",
                                        "Small_Intestine_Terminal_Ileum", "Digestive",
                                        "Spleen", "Blood or Immune",
                                        "Stomach", "Digestive",
                                        "Testis", "Endocrine",
                                        "Thyroid", "Endocrine",
                                        "Uterus", "None",
                                        "Vagina", "None",
                                        "Whole_Blood", "Blood or Immune"),
                                      nrow=49, ncol=2, byrow=T), stringsAsFactors=F)
colnames(weight_groups) <- c("weight", "group")

#display tissue groups
print(weight_groups)
weight group
1 Adipose_Subcutaneous Adipose
2 Adipose_Visceral_Omentum Adipose
3 Adrenal_Gland Endocrine
4 Artery_Aorta Cardiovascular
5 Artery_Coronary Cardiovascular
6 Artery_Tibial Cardiovascular
7 Brain_Amygdala CNS
8 Brain_Anterior_cingulate_cortex_BA24 CNS
9 Brain_Caudate_basal_ganglia CNS
10 Brain_Cerebellar_Hemisphere CNS
11 Brain_Cerebellum CNS
12 Brain_Cortex CNS
13 Brain_Frontal_Cortex_BA9 CNS
14 Brain_Hippocampus CNS
15 Brain_Hypothalamus CNS
16 Brain_Nucleus_accumbens_basal_ganglia CNS
17 Brain_Putamen_basal_ganglia CNS
18 Brain_Spinal_cord_cervical_c-1 CNS
19 Brain_Substantia_nigra CNS
20 Breast_Mammary_Tissue None
21 Cells_Cultured_fibroblasts Skin
22 Cells_EBV-transformed_lymphocytes Blood or Immune
23 Colon_Sigmoid Digestive
24 Colon_Transverse Digestive
25 Esophagus_Gastroesophageal_Junction Digestive
26 Esophagus_Mucosa Digestive
27 Esophagus_Muscularis Digestive
28 Heart_Atrial_Appendage Cardiovascular
29 Heart_Left_Ventricle Cardiovascular
30 Kidney_Cortex None
31 Liver None
32 Lung None
33 Minor_Salivary_Gland None
34 Muscle_Skeletal None
35 Nerve_Tibial None
36 Ovary None
37 Pancreas None
38 Pituitary Endocrine
39 Prostate None
40 Skin_Not_Sun_Exposed_Suprapubic Skin
41 Skin_Sun_Exposed_Lower_leg Skin
42 Small_Intestine_Terminal_Ileum Digestive
43 Spleen Blood or Immune
44 Stomach Digestive
45 Testis Endocrine
46 Thyroid Endocrine
47 Uterus None
48 Vagina None
49 Whole_Blood Blood or Immunegroups <- unique(weight_groups$group)
df_group <- list()
for (i in 1:length(groups)){
group <- groups[i]
weights <- weight_groups$weight[weight_groups$group==group]
df_group[[group]] <- list(ctwas=unique(unlist(lapply(df[weights], function(x){x$ctwas}))),
background=unique(unlist(lapply(df[weights], function(x){x$gene_pips$genename}))))
}
output <- output[sapply(weight_groups$weight, match, output$weight),,drop=F]
output$group <- weight_groups$group
output$n_ctwas_group <- sapply(output$group, function(x){length(df_group[[x]][["ctwas"]])})
output$n_ctwas_group[output$group=="None"] <- 0
#barplot of number of cTWAS genes in each tissue
output <- output[order(-output$n_ctwas),,drop=F]
par(mar=c(10.1, 4.1, 4.1, 2.1))
barplot(output$n_ctwas, names.arg=output$weight, las=2, ylab="Number of cTWAS Genes", cex.names=0.6, main="Number of cTWAS Genes by Tissue")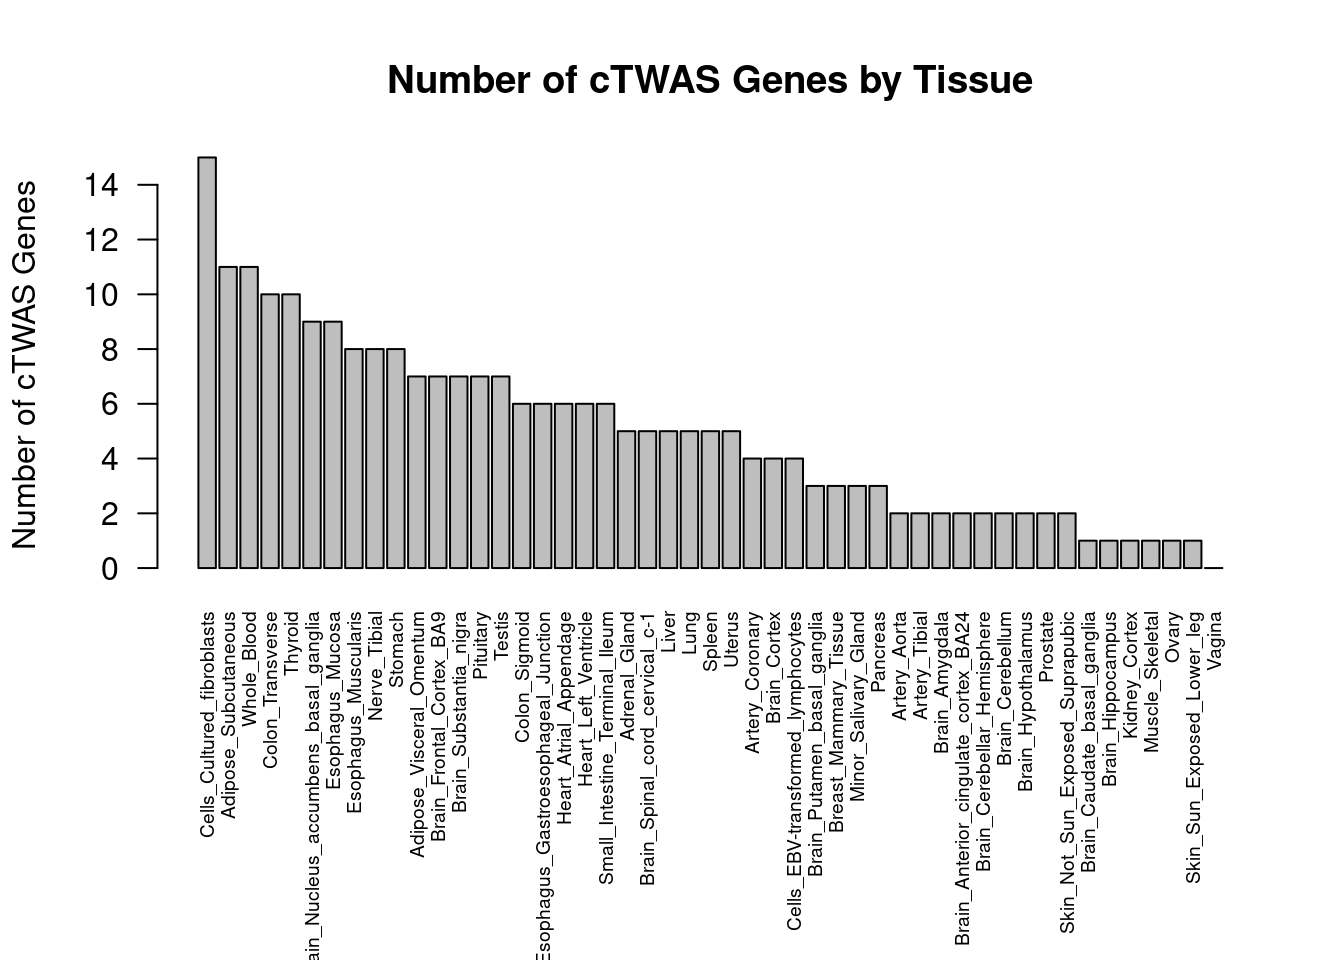
| Version | Author | Date |
|---|---|---|
| d46127d | wesleycrouse | 2022-05-24 |
#barplot of number of cTWAS genes in each tissue
df_plot <- -sort(-sapply(groups[groups!="None"], function(x){length(df_group[[x]][["ctwas"]])}))

par(mar=c(10.1, 4.1, 4.1, 2.1))
barplot(df_plot, las=2, ylab="Number of cTWAS Genes", main="Number of cTWAS Genes by Tissue Group")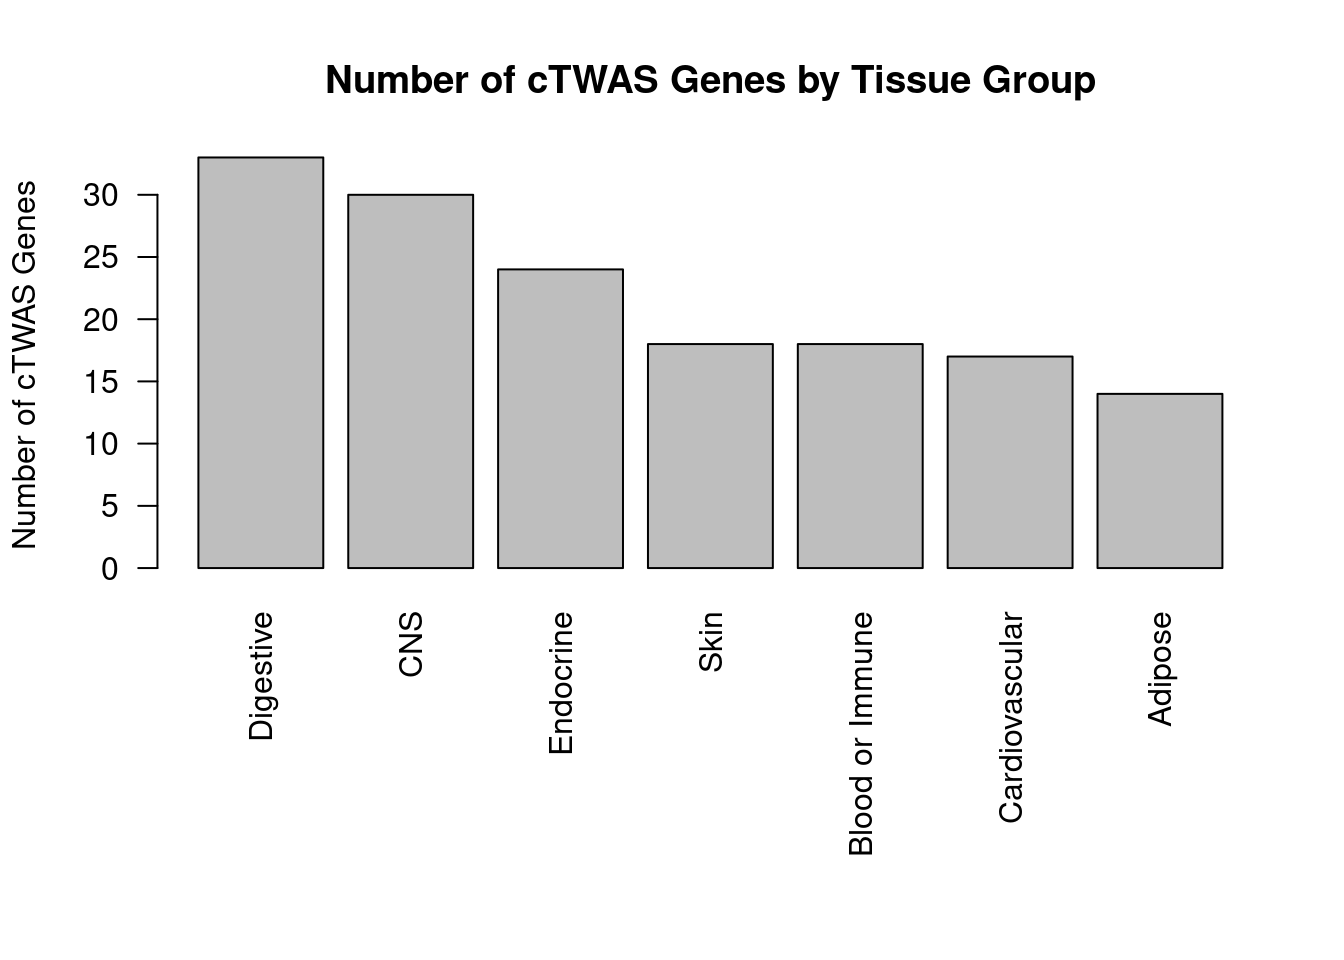
| Version | Author | Date |
|---|---|---|
| d46127d | wesleycrouse | 2022-05-24 |
Enrichment analysis for cTWAS genes in each tissue group
GO
suppressWarnings(rm(group_enrichment_results))

for (group in names(df_group)){
  cat(paste0(group, "\n\n"))

  ctwas_genes_group <- df_group[[group]]$ctwas

  cat(paste0("Number of cTWAS Genes in Tissue Group: ", length(ctwas_genes_group), "\n\n"))

  dbs <- c("GO_Biological_Process_2021")
  GO_enrichment <- enrichr(ctwas_genes_group, dbs)

  for (db in dbs){
    cat(paste0("\n", db, "\n\n"))
    enrich_results <- GO_enrichment[[db]]
    enrich_results <- enrich_results[enrich_results$Adjusted.P.value<0.05,c("Term", "Overlap", "Adjusted.P.value", "Genes")]
    print(enrich_results)
    print(plotEnrich(GO_enrichment[[db]]))

    if (nrow(enrich_results)>0){
      if (!exists("group_enrichment_results")){
        group_enrichment_results <- cbind(group, db, enrich_results)
      } else {
        group_enrichment_results <- rbind(group_enrichment_results, cbind(group, db, enrich_results))
      }
    }
  }

}
Adipose
Number of cTWAS Genes in Tissue Group: 14
Uploading data to Enrichr... Done.
Querying GO_Biological_Process_2021... Done.
Parsing results... Done.
GO_Biological_Process_2021
Term Overlap Adjusted.P.value Genes
1 cellular response to tumor necrosis factor (GO:0071356) 3/194 0.04290099 TNFSF15;TNFRSF14;ZFP36L2
2 cytokine-mediated signaling pathway (GO:0019221) 4/621 0.04290099 CIITA;TNFSF15;TNFRSF14;HLA-DQA1
3 interferon-gamma-mediated signaling pathway (GO:0060333) 2/68 0.04290099 CIITA;HLA-DQA1
4 innate immune response (GO:0045087) 3/302 0.04290099 CIITA;ADAM15;CARD9
5 tumor necrosis factor-mediated signaling pathway (GO:0033209) 2/116 0.04290099 TNFSF15;TNFRSF14
6 positive regulation of cysteine-type endopeptidase activity involved in apoptotic process (GO:0043280) 2/119 0.04290099 TNFSF15;CARD9
7 cellular response to interferon-gamma (GO:0071346) 2/121 0.04290099 CIITA;HLA-DQA1
8 positive regulation of MHC class I biosynthetic process (GO:0045345) 1/5 0.04290099 CIITA
9 negative regulation of adaptive immune response (GO:0002820) 1/5 0.04290099 TNFRSF14
10 cellular response to granulocyte macrophage colony-stimulating factor stimulus (GO:0097011) 1/6 0.04290099 ZFP36L2
11 regulation of transmission of nerve impulse (GO:0051969) 1/6 0.04290099 TYMP
12 response to granulocyte macrophage colony-stimulating factor (GO:0097012) 1/6 0.04290099 ZFP36L2
13 regulation of digestive system process (GO:0044058) 1/6 0.04290099 TYMP
14 negative regulation of cell cycle phase transition (GO:1901988) 1/7 0.04290099 ZFP36L2
15 regulation of MHC class I biosynthetic process (GO:0045343) 1/7 0.04290099 CIITA
16 definitive hemopoiesis (GO:0060216) 1/7 0.04290099 ZFP36L2
17 regulation of alpha-beta T cell proliferation (GO:0046640) 1/8 0.04290099 TNFRSF14
18 myeloid leukocyte mediated immunity (GO:0002444) 1/8 0.04290099 CARD9
19 positive regulation of MHC class II biosynthetic process (GO:0045348) 1/8 0.04290099 CIITA
20 negative regulation of alpha-beta T cell activation (GO:0046636) 1/9 0.04290099 TNFRSF14
21 regulation of receptor binding (GO:1900120) 1/10 0.04290099 ADAM15
22 regulation of T-helper 17 type immune response (GO:2000316) 1/10 0.04290099 CARD9
23 nucleoside metabolic process (GO:0009116) 1/10 0.04290099 TYMP
24 immunoglobulin mediated immune response (GO:0016064) 1/10 0.04290099 CARD9
25 negative regulation of receptor binding (GO:1900121) 1/10 0.04290099 ADAM15
26 negative regulation of alpha-beta T cell proliferation (GO:0046642) 1/10 0.04290099 TNFRSF14
27 pyrimidine nucleoside catabolic process (GO:0046135) 1/11 0.04290099 TYMP
28 pyrimidine nucleoside salvage (GO:0043097) 1/11 0.04290099 TYMP
29 pyrimidine-containing compound salvage (GO:0008655) 1/11 0.04290099 TYMP
30 B cell mediated immunity (GO:0019724) 1/11 0.04290099 CARD9
31 pyrimidine-containing compound metabolic process (GO:0072527) 1/12 0.04290099 TYMP
32 nucleoside catabolic process (GO:0009164) 1/12 0.04290099 TYMP
33 regulation of MHC class II biosynthetic process (GO:0045346) 1/12 0.04290099 CIITA
34 nucleoside salvage (GO:0043174) 1/12 0.04290099 TYMP
35 positive regulation of T-helper 17 type immune response (GO:2000318) 1/12 0.04290099 CARD9
36 mitochondrial genome maintenance (GO:0000002) 1/12 0.04290099 TYMP
37 positive regulation of adaptive immune response based on somatic recombination of immune receptors built from immunoglobulin superfamily domains (GO:0002824) 1/13 0.04290099 CARD9
38 negative regulation of stem cell differentiation (GO:2000737) 1/13 0.04290099 ZFP36L2
39 antifungal innate immune response (GO:0061760) 1/13 0.04290099 CARD9
40 homeostasis of number of cells (GO:0048872) 1/13 0.04290099 CARD9
41 pyrimidine nucleoside biosynthetic process (GO:0046134) 1/14 0.04290099 TYMP
42 T cell differentiation in thymus (GO:0033077) 1/14 0.04290099 ZFP36L2
43 positive regulation of granulocyte macrophage colony-stimulating factor production (GO:0032725) 1/14 0.04290099 CARD9
44 positive regulation of lymphocyte migration (GO:2000403) 1/14 0.04290099 TNFRSF14
45 positive regulation of nuclear-transcribed mRNA catabolic process, deadenylation-dependent decay (GO:1900153) 1/15 0.04290099 ZFP36L2
46 pyrimidine nucleoside metabolic process (GO:0006213) 1/15 0.04290099 TYMP
47 regulation of nuclear-transcribed mRNA catabolic process, deadenylation-dependent decay (GO:1900151) 1/15 0.04290099 ZFP36L2
48 3'-UTR-mediated mRNA destabilization (GO:0061158) 1/16 0.04290099 ZFP36L2
49 activation of NF-kappaB-inducing kinase activity (GO:0007250) 1/16 0.04290099 TNFSF15
50 regulation of granulocyte macrophage colony-stimulating factor production (GO:0032645) 1/16 0.04290099 CARD9
51 cellular response to corticosteroid stimulus (GO:0071384) 1/16 0.04290099 ZFP36L2
52 negative regulation of viral entry into host cell (GO:0046597) 1/17 0.04290099 CIITA
53 pyrimidine-containing compound catabolic process (GO:0072529) 1/17 0.04290099 TYMP
54 positive regulation of cytokine production involved in inflammatory response (GO:1900017) 1/17 0.04290099 CARD9
55 embryo development ending in birth or egg hatching (GO:0009792) 1/17 0.04290099 NR5A2
56 cellular response to glucocorticoid stimulus (GO:0071385) 1/18 0.04290099 ZFP36L2
57 negative regulation of biosynthetic process (GO:0009890) 1/18 0.04290099 CIITA
58 regulation of B cell differentiation (GO:0045577) 1/18 0.04290099 ZFP36L2
59 positive regulation of stress-activated protein kinase signaling cascade (GO:0070304) 1/18 0.04290099 CARD9
60 regulation of nervous system process (GO:0031644) 1/19 0.04378543 TYMP
61 regulation of collagen biosynthetic process (GO:0032965) 1/19 0.04378543 CIITA
62 negative regulation of viral life cycle (GO:1903901) 1/20 0.04391522 CIITA
63 regulation of T cell migration (GO:2000404) 1/20 0.04391522 TNFRSF14
64 regulation of lymphocyte differentiation (GO:0045619) 1/20 0.04391522 ZFP36L2
65 ERK1 and ERK2 cascade (GO:0070371) 1/23 0.04892448 ZFP36L2
66 positive regulation of interleukin-17 production (GO:0032740) 1/23 0.04892448 CARD9
67 defense response to fungus (GO:0050832) 1/24 0.04953405 CARD9
68 regulation of cytokine production involved in immune response (GO:0002718) 1/24 0.04953405 TNFRSF14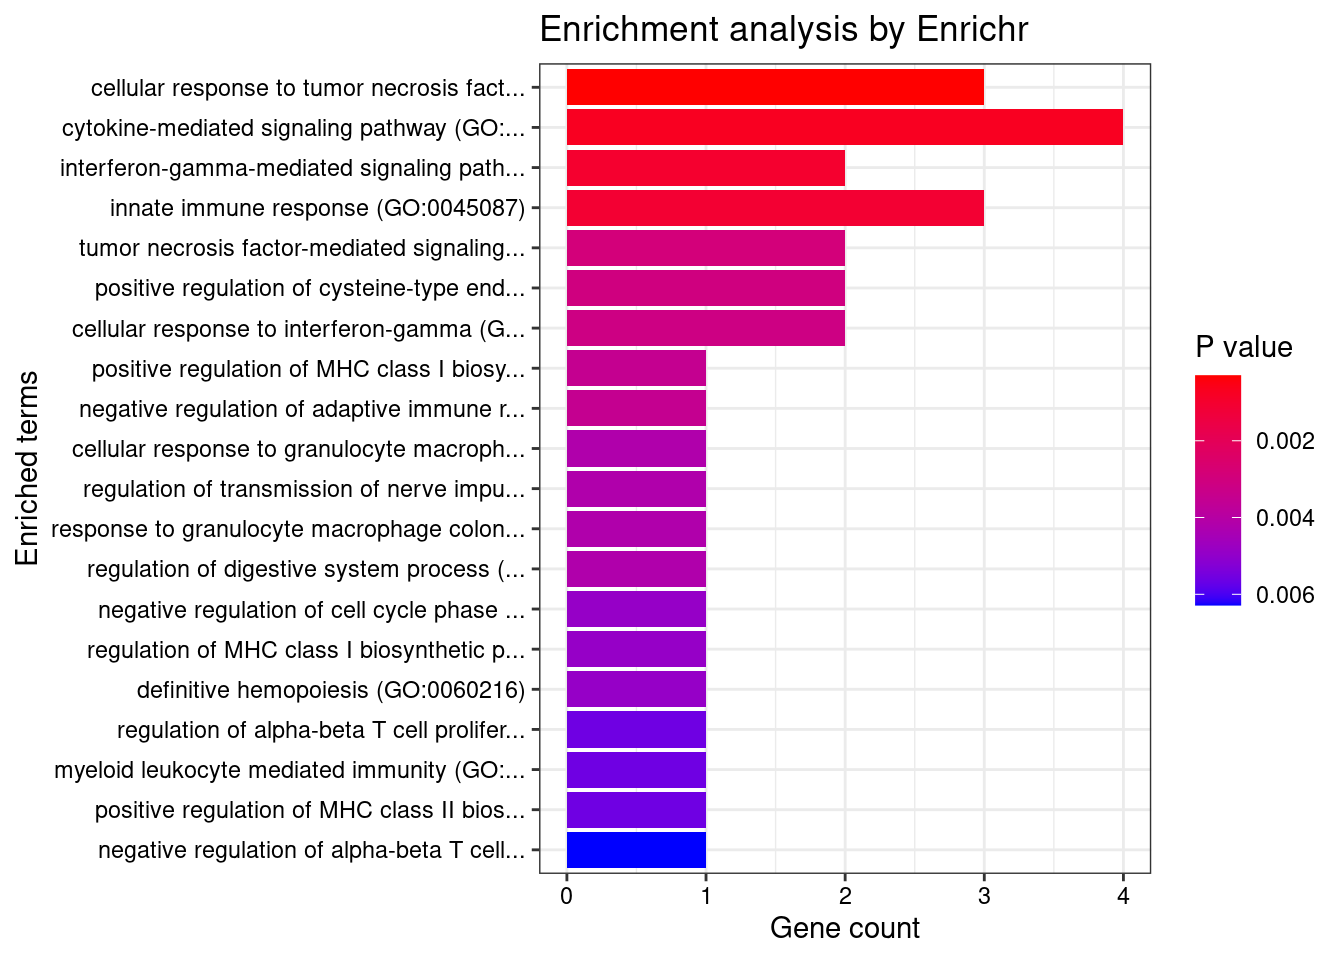
| Version | Author | Date |
|---|---|---|
| d46127d | wesleycrouse | 2022-05-24 |
Endocrine

Number of cTWAS Genes in Tissue Group: 24

Uploading data to Enrichr... Done.
  Querying GO_Biological_Process_2021... Done.
Parsing results... Done.

GO_Biological_Process_2021

                                                                                                    Term Overlap Adjusted.P.value               Genes
1                           regulation of DNA-templated transcription in response to stress (GO:0043620)     2/9       0.01759555          MUC1;RGS14
2 positive regulation of cysteine-type endopeptidase activity involved in apoptotic process (GO:0043280)   3/119       0.04727888 SMAD3;TNFSF15;CARD9
3                                                     cellular response to interferon-gamma (GO:0071346)   3/121       0.04727888   IRF3;CCL20;IFNGR2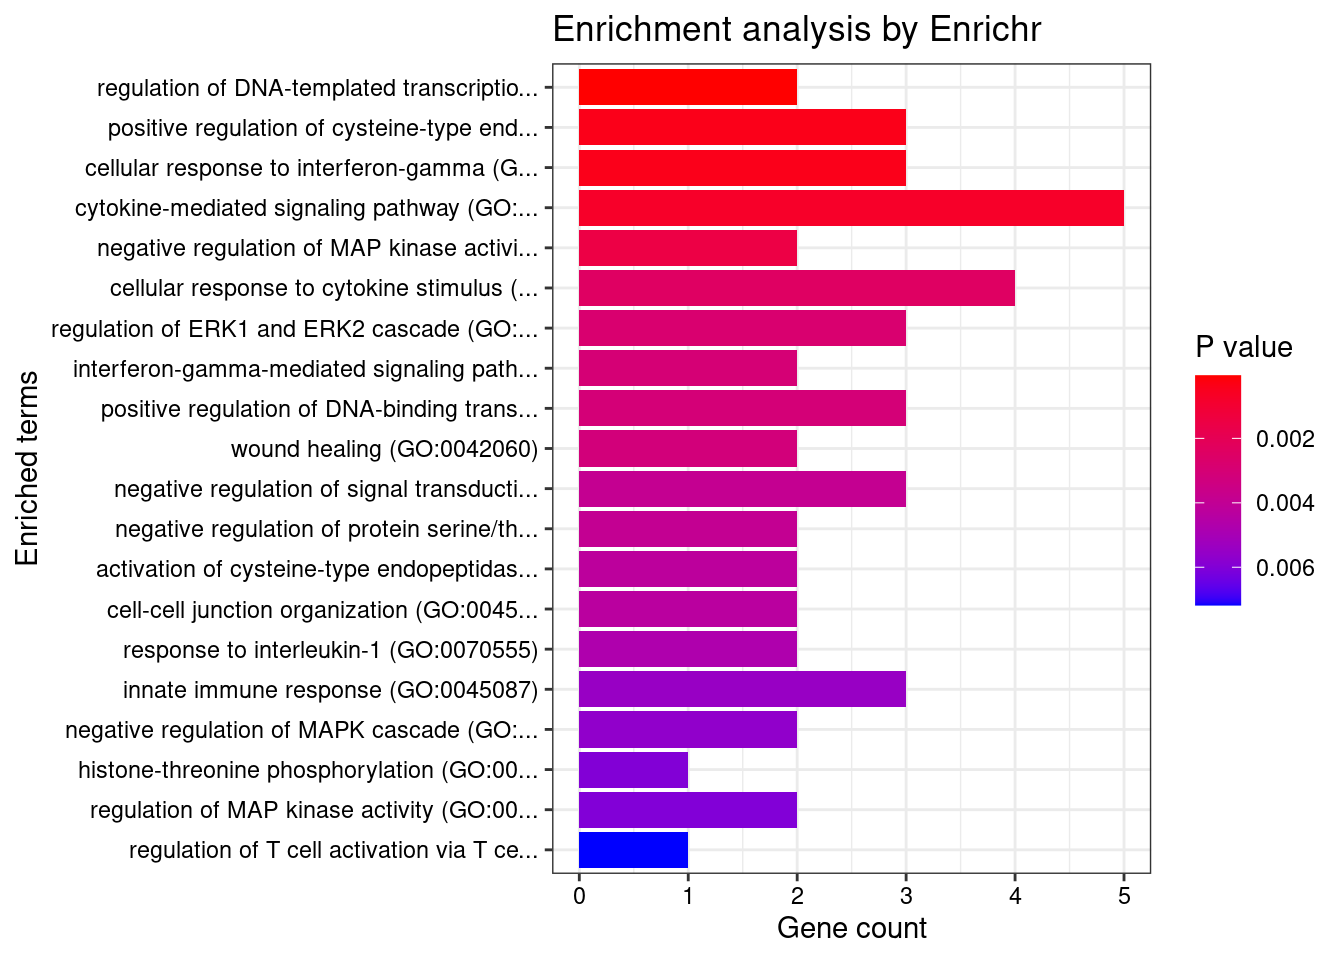
| Version | Author | Date |
|---|---|---|
| d46127d | wesleycrouse | 2022-05-24 |
Cardiovascular
Number of cTWAS Genes in Tissue Group: 17
Uploading data to Enrichr... Done.
Querying GO_Biological_Process_2021... Done.
Parsing results... Done.
GO_Biological_Process_2021
Term Overlap Adjusted.P.value Genes
1 regulation of receptor binding (GO:1900120) 2/10 0.01045387 ADAM15;MMP9
2 cytokine-mediated signaling pathway (GO:0019221) 5/621 0.02209605 TNFSF15;IFNGR2;STAT3;MMP9;IP6K2
3 transmembrane receptor protein tyrosine kinase signaling pathway (GO:0007169) 4/404 0.02423813 RGS14;STAT3;ITGAV;MMP9
4 endodermal cell differentiation (GO:0035987) 2/32 0.02423813 ITGAV;MMP9
5 endoderm formation (GO:0001706) 2/36 0.02423813 ITGAV;MMP9
6 regulation of vascular associated smooth muscle cell proliferation (GO:1904705) 2/37 0.02423813 EFEMP2;MMP9
7 response to peptide (GO:1901652) 2/39 0.02423813 STAT3;MMP9
8 extracellular structure organization (GO:0043062) 3/216 0.02917698 ADAM15;ITGAV;MMP9
9 external encapsulating structure organization (GO:0045229) 3/217 0.02917698 ADAM15;ITGAV;MMP9
10 extracellular matrix disassembly (GO:0022617) 2/66 0.04405132 ADAM15;MMP9
11 cellular component disassembly (GO:0022411) 2/66 0.04405132 ADAM15;MMP9
12 integrin-mediated signaling pathway (GO:0007229) 2/75 0.04409124 ADAM15;ITGAV
13 extracellular matrix organization (GO:0030198) 3/300 0.04409124 ADAM15;ITGAV;MMP9
14 negative regulation of apoptotic signaling pathway (GO:2001234) 2/78 0.04409124 ITGAV;MMP9
15 cell-matrix adhesion (GO:0007160) 2/100 0.04409124 ADAM15;ITGAV
16 negative regulation of cysteine-type endopeptidase activity involved in apoptotic signaling pathway (GO:2001268) 1/5 0.04409124 MMP9
17 glucose import across plasma membrane (GO:0098708) 1/5 0.04409124 SLC2A3
18 negative regulation of lipid transport (GO:0032369) 1/5 0.04409124 ITGAV
19 positive regulation of metallopeptidase activity (GO:1905050) 1/5 0.04409124 STAT3
20 regulation of cell migration (GO:0030334) 3/408 0.04409124 ADAM15;STAT3;MMP9
21 negative regulation of cell growth (GO:0030308) 2/126 0.04409124 ADAM15;IP6K2
22 negative regulation of growth (GO:0045926) 2/126 0.04409124 ADAM15;IP6K2
23 radial glial cell differentiation (GO:0060019) 1/6 0.04409124 STAT3
24 positive regulation of receptor binding (GO:1900122) 1/6 0.04409124 MMP9
25 T-helper 17 cell lineage commitment (GO:0072540) 1/6 0.04409124 STAT3
26 regulation of transmission of nerve impulse (GO:0051969) 1/6 0.04409124 TYMP
27 hexose import across plasma membrane (GO:0140271) 1/6 0.04409124 SLC2A3
28 regulation of collagen fibril organization (GO:1904026) 1/6 0.04409124 EFEMP2
29 regulation of digestive system process (GO:0044058) 1/6 0.04409124 TYMP
30 T-helper 17 cell differentiation (GO:0072539) 1/7 0.04409124 STAT3
31 regulation of transforming growth factor beta activation (GO:1901388) 1/7 0.04409124 ITGAV
32 astrocyte differentiation (GO:0048708) 1/7 0.04409124 STAT3
33 regulation of miRNA mediated inhibition of translation (GO:1905616) 1/7 0.04409124 STAT3
34 positive regulation of vascular associated smooth muscle cell differentiation (GO:1905065) 1/7 0.04409124 EFEMP2
35 negative regulation of low-density lipoprotein receptor activity (GO:1905598) 1/7 0.04409124 ITGAV
36 vascular associated smooth muscle cell development (GO:0097084) 1/7 0.04409124 EFEMP2
37 photoreceptor cell differentiation (GO:0046530) 1/7 0.04409124 STAT3
38 positive regulation of miRNA mediated inhibition of translation (GO:1905618) 1/7 0.04409124 STAT3
39 regulation of entry of bacterium into host cell (GO:2000535) 1/7 0.04409124 ITGAV
40 cellular response to interleukin-21 (GO:0098757) 1/8 0.04409124 STAT3
41 T-helper cell lineage commitment (GO:0002295) 1/8 0.04409124 STAT3
42 vascular associated smooth muscle cell differentiation (GO:0035886) 1/8 0.04409124 EFEMP2
43 elastic fiber assembly (GO:0048251) 1/8 0.04409124 EFEMP2
44 interleukin-21-mediated signaling pathway (GO:0038114) 1/8 0.04409124 STAT3
45 neutrophil degranulation (GO:0043312) 3/481 0.04409124 SLC2A3;ITGAV;MMP9
46 cellular response to cytokine stimulus (GO:0071345) 3/482 0.04409124 IFNGR2;STAT3;MMP9
47 neutrophil activation involved in immune response (GO:0002283) 3/485 0.04409124 SLC2A3;ITGAV;MMP9
48 neutrophil mediated immunity (GO:0002446) 3/488 0.04409124 SLC2A3;ITGAV;MMP9
49 cellular response to interleukin-9 (GO:0071355) 1/9 0.04409124 STAT3
50 cellular response to leptin stimulus (GO:0044320) 1/9 0.04409124 STAT3
51 L-ascorbic acid metabolic process (GO:0019852) 1/9 0.04409124 SLC2A3
52 regulation of lipid transport (GO:0032368) 1/9 0.04409124 ITGAV
53 negative regulation of lipid localization (GO:1905953) 1/9 0.04409124 ITGAV
54 response to leptin (GO:0044321) 1/9 0.04409124 STAT3
55 regulation of DNA-templated transcription in response to stress (GO:0043620) 1/9 0.04409124 RGS14
56 interleukin-23-mediated signaling pathway (GO:0038155) 1/9 0.04409124 STAT3
57 interleukin-9-mediated signaling pathway (GO:0038113) 1/9 0.04409124 STAT3
58 smooth muscle tissue development (GO:0048745) 1/10 0.04409124 EFEMP2
59 leptin-mediated signaling pathway (GO:0033210) 1/10 0.04409124 STAT3
60 nucleoside metabolic process (GO:0009116) 1/10 0.04409124 TYMP
61 positive regulation of keratinocyte migration (GO:0051549) 1/10 0.04409124 MMP9
62 negative regulation of receptor binding (GO:1900121) 1/10 0.04409124 ADAM15
63 positive regulation of posttranscriptional gene silencing (GO:0060148) 1/11 0.04409124 STAT3
64 cellular response to UV-A (GO:0071492) 1/11 0.04409124 MMP9
65 pyrimidine nucleoside catabolic process (GO:0046135) 1/11 0.04409124 TYMP
66 pyrimidine nucleoside salvage (GO:0043097) 1/11 0.04409124 TYMP
67 pyrimidine-containing compound salvage (GO:0008655) 1/11 0.04409124 TYMP
68 regulation of cysteine-type endopeptidase activity involved in apoptotic signaling pathway (GO:2001267) 1/11 0.04409124 MMP9
69 inositol phosphate biosynthetic process (GO:0032958) 1/11 0.04409124 IP6K2
70 interleukin-35-mediated signaling pathway (GO:0070757) 1/11 0.04409124 STAT3
71 cellular response to growth hormone stimulus (GO:0071378) 1/12 0.04409124 STAT3
72 regulation of feeding behavior (GO:0060259) 1/12 0.04409124 STAT3
73 eye photoreceptor cell differentiation (GO:0001754) 1/12 0.04409124 STAT3
74 pyrimidine-containing compound metabolic process (GO:0072527) 1/12 0.04409124 TYMP
75 regulation of keratinocyte migration (GO:0051547) 1/12 0.04409124 MMP9
76 nucleoside catabolic process (GO:0009164) 1/12 0.04409124 TYMP
77 nucleoside salvage (GO:0043174) 1/12 0.04409124 TYMP
78 mitochondrial genome maintenance (GO:0000002) 1/12 0.04409124 TYMP
79 negative regulation of production of miRNAs involved in gene silencing by miRNA (GO:1903799) 1/12 0.04409124 STAT3
80 cellular response to interleukin-15 (GO:0071350) 1/13 0.04490439 STAT3
81 glucose import (GO:0046323) 1/13 0.04490439 SLC2A3
82 negative regulation of macrophage derived foam cell differentiation (GO:0010745) 1/13 0.04490439 ITGAV
83 interleukin-15-mediated signaling pathway (GO:0035723) 1/13 0.04490439 STAT3
84 entry into host (GO:0044409) 1/13 0.04490439 ITGAV
85 negative regulation of cellular process (GO:0048523) 3/566 0.04511665 ADAM15;BRD7;IP6K2
86 regulation of response to interferon-gamma (GO:0060330) 1/14 0.04511665 IFNGR2
87 pyrimidine nucleoside biosynthetic process (GO:0046134) 1/14 0.04511665 TYMP
88 aorta development (GO:0035904) 1/14 0.04511665 EFEMP2
89 growth hormone receptor signaling pathway via JAK-STAT (GO:0060397) 1/14 0.04511665 STAT3
90 response to UV-A (GO:0070141) 1/14 0.04511665 MMP9
91 regulation of extracellular matrix organization (GO:1903053) 1/15 0.04626380 EFEMP2
92 pyrimidine nucleoside metabolic process (GO:0006213) 1/15 0.04626380 TYMP
93 macrophage differentiation (GO:0030225) 1/15 0.04626380 MMP9
94 interleukin-27-mediated signaling pathway (GO:0070106) 1/15 0.04626380 STAT3
95 activation of NF-kappaB-inducing kinase activity (GO:0007250) 1/16 0.04645946 TNFSF15
96 negative regulation of epithelial cell differentiation (GO:0030857) 1/16 0.04645946 MMP9
97 nuclear transport (GO:0051169) 1/16 0.04645946 RGS14
98 platelet-derived growth factor receptor signaling pathway (GO:0048008) 1/16 0.04645946 RGS14
99 polyol biosynthetic process (GO:0046173) 1/16 0.04645946 IP6K2
100 phosphate-containing compound metabolic process (GO:0006796) 2/212 0.04645946 STAT3;IP6K2
101 regulation of cell growth (GO:0001558) 2/217 0.04645946 ADAM15;IP6K2
102 negative regulation of vascular associated smooth muscle cell proliferation (GO:1904706) 1/17 0.04645946 EFEMP2
103 pyrimidine-containing compound catabolic process (GO:0072529) 1/17 0.04645946 TYMP
104 aorta morphogenesis (GO:0035909) 1/17 0.04645946 EFEMP2
105 positive regulation of cytokine production involved in inflammatory response (GO:1900017) 1/17 0.04645946 STAT3
106 muscle tissue morphogenesis (GO:0060415) 1/17 0.04645946 EFEMP2
107 positive regulation of cell motility (GO:2000147) 2/221 0.04695775 STAT3;MMP9
108 negative regulation of cation transmembrane transport (GO:1904063) 1/18 0.04695775 MMP9
109 regulation of transforming growth factor beta production (GO:0071634) 1/18 0.04695775 ITGAV
110 positive regulation of extracellular matrix organization (GO:1903055) 1/18 0.04695775 EFEMP2
111 interleukin-6-mediated signaling pathway (GO:0070102) 1/18 0.04695775 STAT3
112 cellular response to interleukin-7 (GO:0098761) 1/19 0.04741109 STAT3
113 long-term memory (GO:0007616) 1/19 0.04741109 RGS14
114 regulation of nervous system process (GO:0031644) 1/19 0.04741109 TYMP
115 regulation of neuroinflammatory response (GO:0150077) 1/19 0.04741109 MMP9
116 interleukin-7-mediated signaling pathway (GO:0038111) 1/19 0.04741109 STAT3
117 adaptive immune response based on somatic recombination of immune receptors built from immunoglobulin superfamily domains (GO:0002460) 1/20 0.04743306 STAT3
118 positive regulation of peptidyl-lysine acetylation (GO:2000758) 1/20 0.04743306 BRD7
119 eye morphogenesis (GO:0048592) 1/20 0.04743306 STAT3
120 glucose transmembrane transport (GO:1904659) 1/20 0.04743306 SLC2A3
121 growth hormone receptor signaling pathway (GO:0060396) 1/20 0.04743306 STAT3
122 negative regulation of lipid storage (GO:0010888) 1/20 0.04743306 ITGAV
123 extrinsic apoptotic signaling pathway in absence of ligand (GO:0097192) 1/21 0.04820437 ITGAV
124 long-term synaptic potentiation (GO:0060291) 1/21 0.04820437 RGS14
125 negative regulation of ion transmembrane transporter activity (GO:0032413) 1/21 0.04820437 MMP9
126 positive regulation of vascular associated smooth muscle cell proliferation (GO:1904707) 1/21 0.04820437 MMP9
127 regulation of lipid storage (GO:0010883) 1/22 0.04923626 ITGAV
128 positive regulation of signal transduction (GO:0009967) 2/252 0.04923626 STAT3;ITGAV
129 ERK1 and ERK2 cascade (GO:0070371) 1/23 0.04923626 ITGAV
130 regulation of supramolecular fiber organization (GO:1902903) 1/23 0.04923626 EFEMP2
131 regulation of interferon-gamma-mediated signaling pathway (GO:0060334) 1/23 0.04923626 IFNGR2
132 artery development (GO:0060840) 1/23 0.04923626 EFEMP2
133 negative regulation of G protein-coupled receptor signaling pathway (GO:0045744) 1/23 0.04923626 RGS14
134 positive regulation of histone acetylation (GO:0035066) 1/23 0.04923626 BRD7
135 hexose transmembrane transport (GO:0008645) 1/23 0.04923626 SLC2A3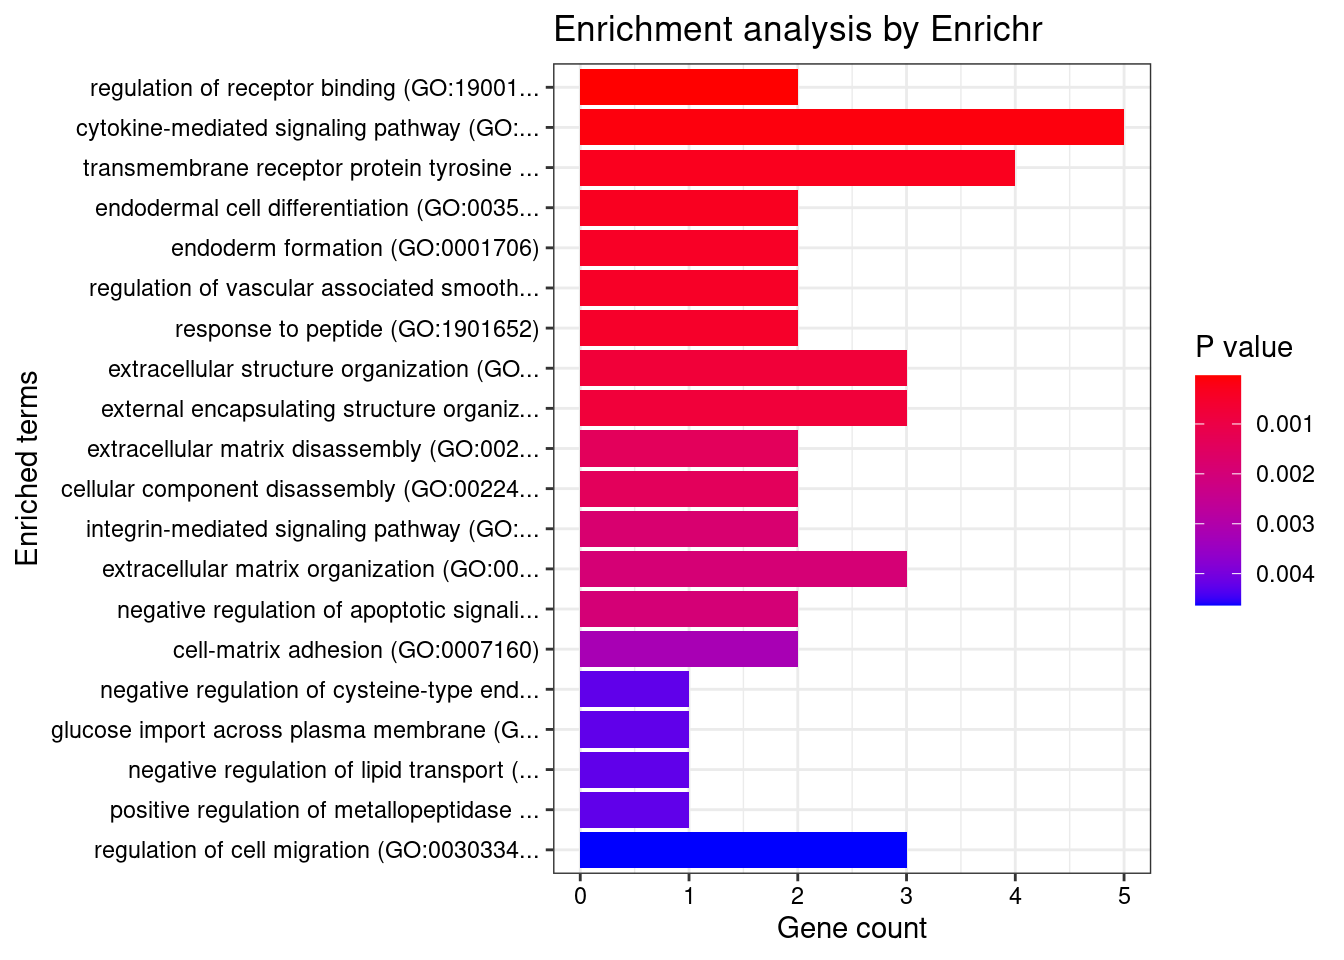
| Version | Author | Date |
|---|---|---|
| d46127d | wesleycrouse | 2022-05-24 |
CNS

Number of cTWAS Genes in Tissue Group: 30

Uploading data to Enrichr... Done.
  Querying GO_Biological_Process_2021... Done.
Parsing results... Done.

GO_Biological_Process_2021

                                                                                               Term Overlap Adjusted.P.value                                     Genes
1                   positive regulation of antigen receptor-mediated signaling pathway (GO:0050857)    3/21      0.001570907                         PRKCB;RAB29;PRKD2
2                      regulation of DNA-templated transcription in response to stress (GO:0043620)     2/9      0.012762094                                MUC1;RGS14
3 positive regulation of vascular endothelial growth factor receptor signaling pathway (GO:0030949)    2/10      0.012762094                               PRKCB;PRKD2
4                                           positive regulation of cytokine production (GO:0001819)   5/335      0.012762094          LACC1;FCER1G;PRKD2;IL18R1;MAPK13
5                             positive regulation of T cell receptor signaling pathway (GO:0050862)    2/14      0.015462136                               RAB29;PRKD2
6                                                  cytokine-mediated signaling pathway (GO:0019221)   6/621      0.018092373 MUC1;FCER1G;CCL20;TNFSF15;HLA-DQA1;IL18R1
7          regulation of vascular endothelial growth factor receptor signaling pathway (GO:0030947)    2/24      0.033186566                               PRKCB;PRKD2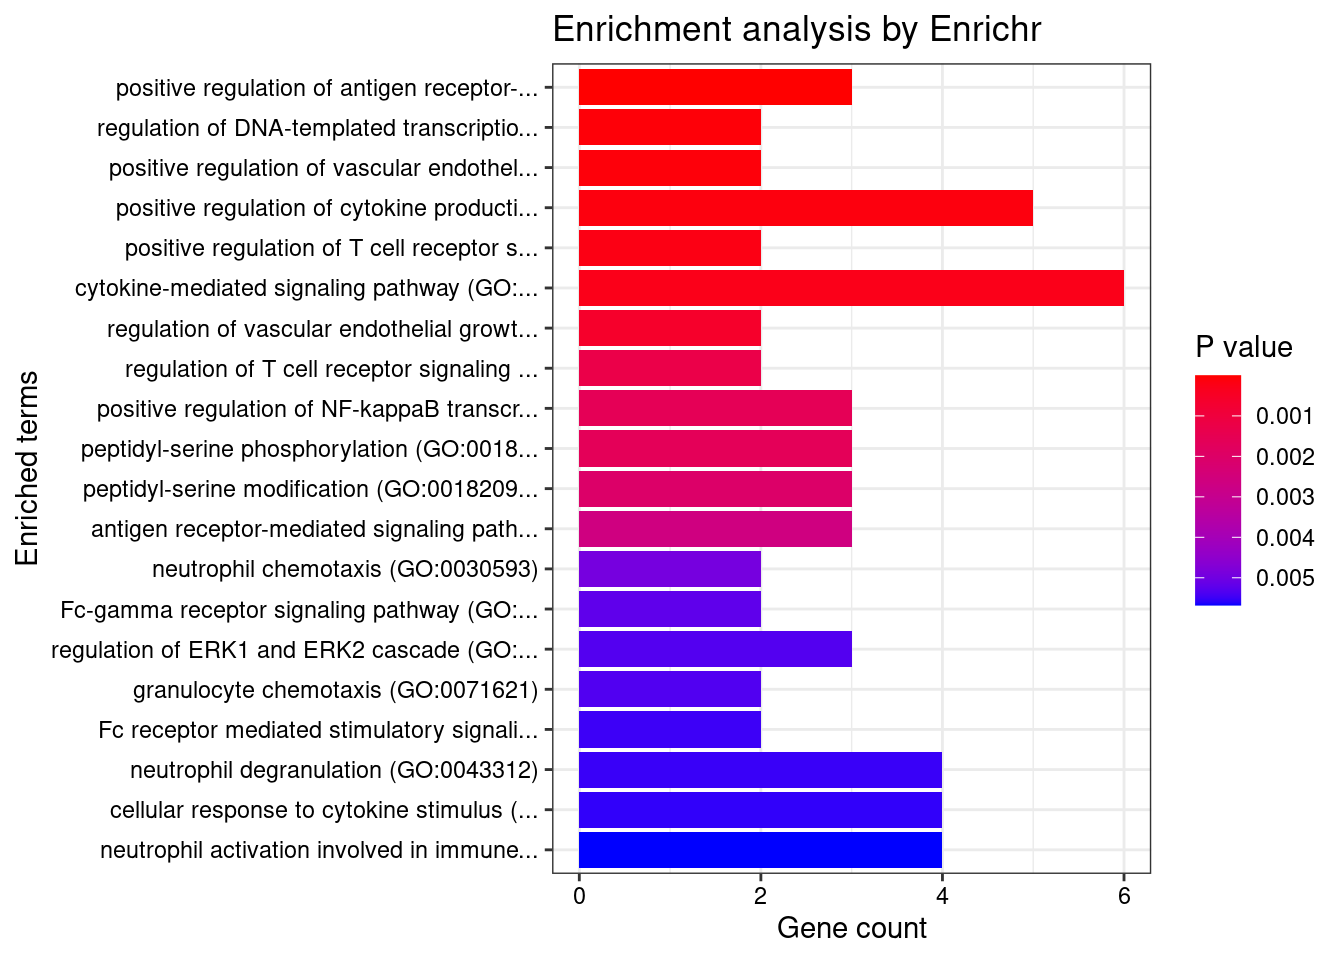
| Version | Author | Date |
|---|---|---|
| d46127d | wesleycrouse | 2022-05-24 |
None

Number of cTWAS Genes in Tissue Group: 25

Uploading data to Enrichr... Done.
  Querying GO_Biological_Process_2021... Done.
Parsing results... Done.

GO_Biological_Process_2021

                                                                                        Term Overlap Adjusted.P.value                                      Genes
1                                           cytokine-mediated signaling pathway (GO:0019221)   7/621      0.004716120 PSMA6;MUC1;TNFSF15;CCL20;IFNGR2;STAT3;IRF8
2                                        cellular response to cytokine stimulus (GO:0071345)   6/482      0.006765592       MUC1;CCL20;IFNGR2;STAT3;IRF8;ZFP36L2
3               regulation of DNA-templated transcription in response to stress (GO:0043620)     2/9      0.010634795                                 MUC1;RGS14
4                                    cellular response to tumor necrosis factor (GO:0071356)   4/194      0.013743796                PSMA6;TNFSF15;CCL20;ZFP36L2
5  positive regulation of cytokine production involved in inflammatory response (GO:1900017)    2/17      0.023303212                                CARD9;STAT3
6                                             regulation of MAP kinase activity (GO:0043405)    3/97      0.023303212                           RGS14;EDN3;LRRK2
7                                           positive regulation of MAPK cascade (GO:0043410)   4/274      0.024340759                     EDN3;CCL20;LRRK2;CARD9
8                                                   cellular response to lectin (GO:1990858)   3/115      0.024340759                           PSMA6;MUC1;CARD9
9                          stimulatory C-type lectin receptor signaling pathway (GO:0002223)   3/115      0.024340759                           PSMA6;MUC1;CARD9
10    innate immune response activating cell surface receptor signaling pathway (GO:0002220)   3/119      0.024340759                           PSMA6;MUC1;CARD9
11                                        cellular response to interferon-gamma (GO:0071346)   3/121      0.024340759                          CCL20;IFNGR2;IRF8
12               positive regulation of NF-kappaB transcription factor activity (GO:0051092)   3/155      0.044439843                          PSMA6;CARD9;STAT3
13                                               regulation of intracellular pH (GO:0051453)    2/37      0.044439843                              LRRK2;SLC26A3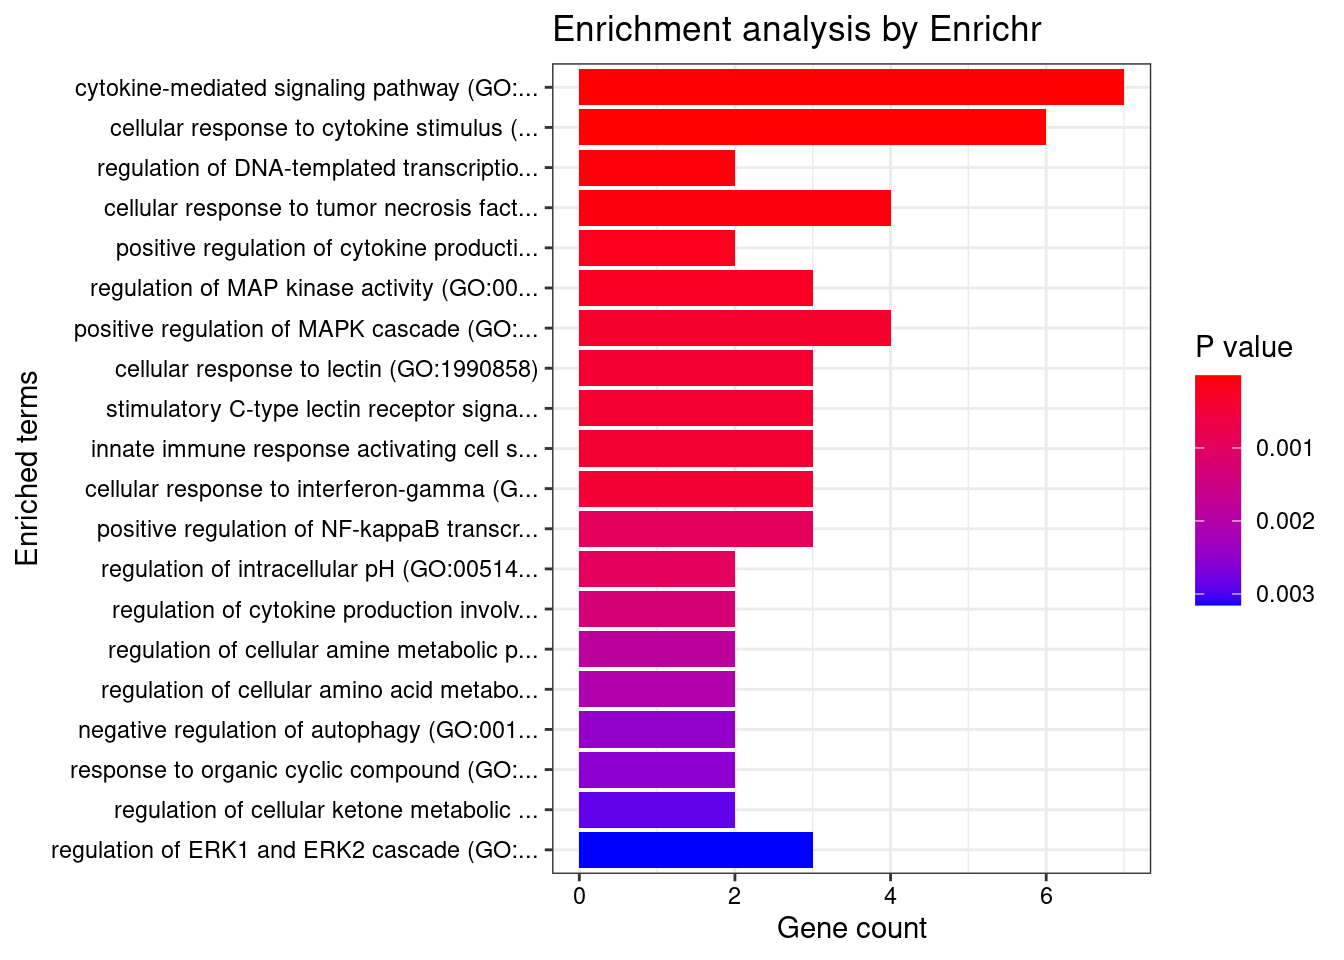
| Version | Author | Date |
|---|---|---|
| d46127d | wesleycrouse | 2022-05-24 |
Skin
Number of cTWAS Genes in Tissue Group: 18
Uploading data to Enrichr... Done.
Querying GO_Biological_Process_2021... Done.
Parsing results... Done.
GO_Biological_Process_2021
Term Overlap Adjusted.P.value Genes
1 regulation of receptor binding (GO:1900120) 2/10 0.01220310 ADAM15;MMP9
2 extracellular matrix organization (GO:0030198) 4/300 0.02289213 ADAM15;P4HA2;ITGAL;MMP9
3 transmembrane receptor protein tyrosine kinase signaling pathway (GO:0007169) 4/404 0.03613283 RGS14;STAT3;MMP9;PTPN2
4 response to peptide (GO:1901652) 2/39 0.03613283 STAT3;MMP9
5 positive regulation of Notch signaling pathway (GO:0045747) 2/45 0.03613283 TSPAN14;STAT3
6 regulation of pri-miRNA transcription by RNA polymerase II (GO:1902893) 2/45 0.03613283 STAT3;POU5F1
7 extracellular structure organization (GO:0043062) 3/216 0.03613283 ADAM15;ITGAL;MMP9
8 external encapsulating structure organization (GO:0045229) 3/217 0.03613283 ADAM15;ITGAL;MMP9
9 negative regulation of ERK1 and ERK2 cascade (GO:0070373) 2/50 0.03613283 RGS14;PTPN2
10 extracellular matrix disassembly (GO:0022617) 2/66 0.04228729 ADAM15;MMP9
11 cellular component disassembly (GO:0022411) 2/66 0.04228729 ADAM15;MMP9
12 regulation of gene silencing by miRNA (GO:0060964) 2/67 0.04228729 STAT3;POU5F1
13 regulation of epidermal growth factor receptor signaling pathway (GO:0042058) 2/67 0.04228729 MMP9;PTPN2
14 regulation of tyrosine phosphorylation of STAT protein (GO:0042509) 2/68 0.04228729 STAT3;PTPN2
15 carbohydrate homeostasis (GO:0033500) 2/70 0.04228729 STAT3;PTPN2
16 regulation of Notch signaling pathway (GO:0008593) 2/83 0.04398660 TSPAN14;STAT3
17 glucose homeostasis (GO:0042593) 2/86 0.04398660 STAT3;PTPN2
18 negative regulation of MAPK cascade (GO:0043409) 2/94 0.04398660 RGS14;PTPN2
19 cell-matrix adhesion (GO:0007160) 2/100 0.04398660 ADAM15;ITGAL
20 negative regulation of cysteine-type endopeptidase activity involved in apoptotic signaling pathway (GO:2001268) 1/5 0.04398660 MMP9
21 T cell extravasation (GO:0072683) 1/5 0.04398660 ITGAL
22 negative regulation of gene silencing by RNA (GO:0060967) 1/5 0.04398660 POU5F1
23 negative regulation of macrophage differentiation (GO:0045650) 1/5 0.04398660 PTPN2
24 regulation of platelet-derived growth factor receptor-beta signaling pathway (GO:2000586) 1/5 0.04398660 PTPN2
25 negative regulation of posttranscriptional gene silencing (GO:0060149) 1/5 0.04398660 POU5F1
26 positive regulation of metallopeptidase activity (GO:1905050) 1/5 0.04398660 STAT3
27 endodermal cell fate specification (GO:0001714) 1/5 0.04398660 POU5F1
28 cellular response to organic substance (GO:0071310) 2/123 0.04398660 STAT3;PTPN2
29 negative regulation of T cell differentiation in thymus (GO:0033085) 1/6 0.04398660 PTPN2
30 negative regulation of transporter activity (GO:0032410) 1/6 0.04398660 NDFIP1
31 radial glial cell differentiation (GO:0060019) 1/6 0.04398660 STAT3
32 positive regulation of receptor binding (GO:1900122) 1/6 0.04398660 MMP9
33 T-helper 17 cell lineage commitment (GO:0072540) 1/6 0.04398660 STAT3
34 regulation of transmission of nerve impulse (GO:0051969) 1/6 0.04398660 TYMP
35 positive regulation of gluconeogenesis (GO:0045722) 1/6 0.04398660 PTPN2
36 regulation of digestive system process (GO:0044058) 1/6 0.04398660 TYMP
37 regulation of cell migration (GO:0030334) 3/408 0.04398660 ADAM15;STAT3;MMP9
38 negative regulation of response to interferon-gamma (GO:0060331) 1/7 0.04398660 PTPN2
39 T-helper 17 cell differentiation (GO:0072539) 1/7 0.04398660 STAT3
40 astrocyte differentiation (GO:0048708) 1/7 0.04398660 STAT3
41 regulation of miRNA mediated inhibition of translation (GO:1905616) 1/7 0.04398660 STAT3
42 negative regulation of interferon-gamma-mediated signaling pathway (GO:0060336) 1/7 0.04398660 PTPN2
43 photoreceptor cell differentiation (GO:0046530) 1/7 0.04398660 STAT3
44 positive regulation of miRNA mediated inhibition of translation (GO:1905618) 1/7 0.04398660 STAT3
45 cellular response to interleukin-21 (GO:0098757) 1/8 0.04398660 STAT3
46 T-helper cell lineage commitment (GO:0002295) 1/8 0.04398660 STAT3
47 peptidyl-proline hydroxylation to 4-hydroxy-L-proline (GO:0018401) 1/8 0.04398660 P4HA2
48 interleukin-21-mediated signaling pathway (GO:0038114) 1/8 0.04398660 STAT3
49 response to cytokine (GO:0034097) 2/150 0.04398660 STAT3;PTPN2
50 cellular response to interleukin-9 (GO:0071355) 1/9 0.04398660 STAT3
51 cellular response to leptin stimulus (GO:0044320) 1/9 0.04398660 STAT3
52 negative regulation of lipid localization (GO:1905953) 1/9 0.04398660 PTPN2
53 response to leptin (GO:0044321) 1/9 0.04398660 STAT3
54 regulation of DNA-templated transcription in response to stress (GO:0043620) 1/9 0.04398660 RGS14
55 interleukin-23-mediated signaling pathway (GO:0038155) 1/9 0.04398660 STAT3
56 interleukin-9-mediated signaling pathway (GO:0038113) 1/9 0.04398660 STAT3
57 neutrophil degranulation (GO:0043312) 3/481 0.04398660 TSPAN14;ITGAL;MMP9
58 cellular response to cytokine stimulus (GO:0071345) 3/482 0.04398660 STAT3;MMP9;PTPN2
59 neutrophil activation involved in immune response (GO:0002283) 3/485 0.04398660 TSPAN14;ITGAL;MMP9
60 leptin-mediated signaling pathway (GO:0033210) 1/10 0.04398660 STAT3
61 negative regulation of transmembrane transport (GO:0034763) 1/10 0.04398660 OAZ3
62 negative regulation of tyrosine phosphorylation of STAT protein (GO:0042532) 1/10 0.04398660 PTPN2
63 negative regulation of establishment of protein localization (GO:1904950) 1/10 0.04398660 NDFIP1
64 nucleoside metabolic process (GO:0009116) 1/10 0.04398660 TYMP
65 positive regulation of keratinocyte migration (GO:0051549) 1/10 0.04398660 MMP9
66 endodermal cell fate commitment (GO:0001711) 1/10 0.04398660 POU5F1
67 negative regulation of receptor binding (GO:1900121) 1/10 0.04398660 ADAM15
68 neutrophil mediated immunity (GO:0002446) 3/488 0.04398660 TSPAN14;ITGAL;MMP9
69 positive regulation of posttranscriptional gene silencing (GO:0060148) 1/11 0.04398660 STAT3
70 cellular response to UV-A (GO:0071492) 1/11 0.04398660 MMP9
71 pyrimidine nucleoside catabolic process (GO:0046135) 1/11 0.04398660 TYMP
72 pyrimidine nucleoside salvage (GO:0043097) 1/11 0.04398660 TYMP
73 pyrimidine-containing compound salvage (GO:0008655) 1/11 0.04398660 TYMP
74 peptidyl-proline hydroxylation (GO:0019511) 1/11 0.04398660 P4HA2
75 regulation of cysteine-type endopeptidase activity involved in apoptotic signaling pathway (GO:2001267) 1/11 0.04398660 MMP9
76 negative regulation of platelet-derived growth factor receptor signaling pathway (GO:0010642) 1/11 0.04398660 PTPN2
77 interleukin-35-mediated signaling pathway (GO:0070757) 1/11 0.04398660 STAT3
78 cellular response to growth hormone stimulus (GO:0071378) 1/12 0.04398660 STAT3
79 regulation of feeding behavior (GO:0060259) 1/12 0.04398660 STAT3
80 eye photoreceptor cell differentiation (GO:0001754) 1/12 0.04398660 STAT3
81 pyrimidine-containing compound metabolic process (GO:0072527) 1/12 0.04398660 TYMP
82 regulation of keratinocyte migration (GO:0051547) 1/12 0.04398660 MMP9
83 negative regulation of gene silencing by miRNA (GO:0060965) 1/12 0.04398660 POU5F1
84 nucleoside catabolic process (GO:0009164) 1/12 0.04398660 TYMP
85 nucleoside salvage (GO:0043174) 1/12 0.04398660 TYMP
86 mitochondrial genome maintenance (GO:0000002) 1/12 0.04398660 TYMP
87 negative regulation of production of miRNAs involved in gene silencing by miRNA (GO:1903799) 1/12 0.04398660 STAT3
88 cellular response to interleukin-15 (GO:0071350) 1/13 0.04604421 STAT3
89 negative regulation of locomotion (GO:0040013) 1/13 0.04604421 PTPN2
90 interleukin-15-mediated signaling pathway (GO:0035723) 1/13 0.04604421 STAT3
91 regulation of response to interferon-gamma (GO:0060330) 1/14 0.04646722 PTPN2
92 pyrimidine nucleoside biosynthetic process (GO:0046134) 1/14 0.04646722 TYMP
93 growth hormone receptor signaling pathway via JAK-STAT (GO:0060397) 1/14 0.04646722 STAT3
94 positive regulation of glucose metabolic process (GO:0010907) 1/14 0.04646722 PTPN2
95 response to UV-A (GO:0070141) 1/14 0.04646722 MMP9
96 negative regulation of pri-miRNA transcription by RNA polymerase II (GO:1902894) 1/14 0.04646722 POU5F1
97 protein localization to membrane (GO:0072657) 2/195 0.04691905 TSPAN14;ITGAL
98 pyrimidine nucleoside metabolic process (GO:0006213) 1/15 0.04691905 TYMP
99 macrophage differentiation (GO:0030225) 1/15 0.04691905 MMP9
100 regulation of macrophage differentiation (GO:0045649) 1/15 0.04691905 PTPN2
101 interleukin-27-mediated signaling pathway (GO:0070106) 1/15 0.04691905 STAT3
102 regulation of signal transduction (GO:0009966) 2/198 0.04691905 RGS14;PTPN2
103 negative regulation of type I interferon-mediated signaling pathway (GO:0060339) 1/16 0.04760555 PTPN2
104 negative regulation of epithelial cell differentiation (GO:0030857) 1/16 0.04760555 MMP9
105 nuclear transport (GO:0051169) 1/16 0.04760555 RGS14
106 platelet-derived growth factor receptor signaling pathway (GO:0048008) 1/16 0.04760555 RGS14
107 negative regulation of receptor signaling pathway via JAK-STAT (GO:0046426) 1/16 0.04760555 PTPN2
108 regulation of inflammatory response (GO:0050727) 2/206 0.04777197 MMP9;PTPN2
109 pyrimidine-containing compound catabolic process (GO:0072529) 1/17 0.04918056 TYMP
110 positive regulation of cytokine production involved in inflammatory response (GO:1900017) 1/17 0.04918056 STAT3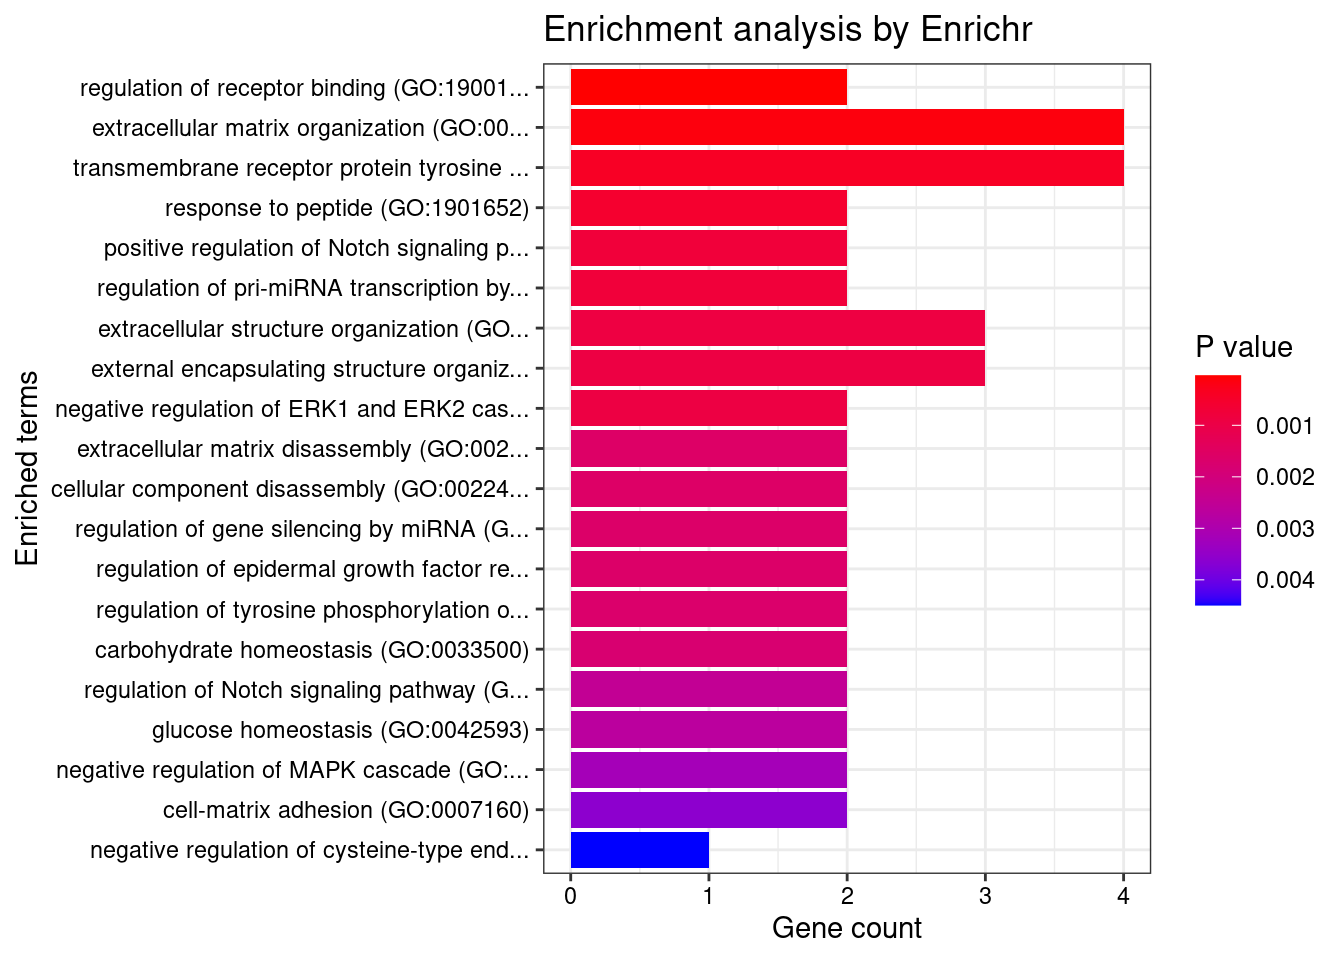
| Version | Author | Date |
|---|---|---|
| d46127d | wesleycrouse | 2022-05-24 |
Blood or Immune
Number of cTWAS Genes in Tissue Group: 18
Uploading data to Enrichr... Done.
Querying GO_Biological_Process_2021... Done.
Parsing results... Done.
GO_Biological_Process_2021
Term Overlap Adjusted.P.value Genes
1 positive regulation of cytokine production involved in inflammatory response (GO:1900017) 2/17 0.03445057 CARD9;STAT3
2 positive regulation of histone acetylation (GO:0035066) 2/23 0.03445057 MUC1;BRD7
3 regulation of cytokine production involved in inflammatory response (GO:1900015) 2/43 0.04604989 CARD9;STAT3
4 cellular response to cytokine stimulus (GO:0071345) 4/482 0.04604989 MUC1;STAT3;CCR5;ZFP36L2
5 cellular defense response (GO:0006968) 2/49 0.04604989 LSP1;CCR5
6 cytokine-mediated signaling pathway (GO:0019221) 4/621 0.04604989 MUC1;TNFSF15;STAT3;CCR5
7 positive regulation of interleukin-6 production (GO:0032755) 2/76 0.04604989 CARD9;STAT3
8 metal ion transport (GO:0030001) 2/88 0.04604989 NDFIP1;CCR5
9 negative regulation of mitotic cell cycle phase transition (GO:1901991) 2/92 0.04604989 BRD7;ZFP36L2
10 regulation of interleukin-6 production (GO:0032675) 2/110 0.04604989 CARD9;STAT3
11 positive regulation of metallopeptidase activity (GO:1905050) 1/5 0.04604989 STAT3
12 cellular response to lectin (GO:1990858) 2/115 0.04604989 MUC1;CARD9
13 stimulatory C-type lectin receptor signaling pathway (GO:0002223) 2/115 0.04604989 MUC1;CARD9
14 positive regulation of cysteine-type endopeptidase activity involved in apoptotic process (GO:0043280) 2/119 0.04604989 TNFSF15;CARD9
15 innate immune response activating cell surface receptor signaling pathway (GO:0002220) 2/119 0.04604989 MUC1;CARD9
16 cellular response to granulocyte macrophage colony-stimulating factor stimulus (GO:0097011) 1/6 0.04604989 ZFP36L2
17 negative regulation of transporter activity (GO:0032410) 1/6 0.04604989 NDFIP1
18 radial glial cell differentiation (GO:0060019) 1/6 0.04604989 STAT3
19 T-helper 17 cell lineage commitment (GO:0072540) 1/6 0.04604989 STAT3
20 regulation of transmission of nerve impulse (GO:0051969) 1/6 0.04604989 TYMP
21 release of sequestered calcium ion into cytosol by sarcoplasmic reticulum (GO:0014808) 1/6 0.04604989 CCR5
22 response to granulocyte macrophage colony-stimulating factor (GO:0097012) 1/6 0.04604989 ZFP36L2
23 regulation of digestive system process (GO:0044058) 1/6 0.04604989 TYMP
24 skin morphogenesis (GO:0043589) 1/7 0.04604989 ERRFI1
25 negative regulation of cell cycle phase transition (GO:1901988) 1/7 0.04604989 ZFP36L2
26 negative regulation of cytoplasmic translation (GO:2000766) 1/7 0.04604989 CPEB4
27 T-helper 17 cell differentiation (GO:0072539) 1/7 0.04604989 STAT3
28 astrocyte differentiation (GO:0048708) 1/7 0.04604989 STAT3
29 release of sequestered calcium ion into cytosol by endoplasmic reticulum (GO:1903514) 1/7 0.04604989 CCR5
30 regulation of miRNA mediated inhibition of translation (GO:1905616) 1/7 0.04604989 STAT3
31 definitive hemopoiesis (GO:0060216) 1/7 0.04604989 ZFP36L2
32 positive regulation of histone H4 acetylation (GO:0090240) 1/7 0.04604989 MUC1
33 photoreceptor cell differentiation (GO:0046530) 1/7 0.04604989 STAT3
34 positive regulation of miRNA mediated inhibition of translation (GO:1905618) 1/7 0.04604989 STAT3
35 cellular response to interleukin-21 (GO:0098757) 1/8 0.04604989 STAT3
36 fusion of virus membrane with host plasma membrane (GO:0019064) 1/8 0.04604989 CCR5
37 T-helper cell lineage commitment (GO:0002295) 1/8 0.04604989 STAT3
38 membrane fusion involved in viral entry into host cell (GO:0039663) 1/8 0.04604989 CCR5
39 myeloid leukocyte mediated immunity (GO:0002444) 1/8 0.04604989 CARD9
40 interleukin-21-mediated signaling pathway (GO:0038114) 1/8 0.04604989 STAT3
41 cellular response to interleukin-9 (GO:0071355) 1/9 0.04604989 STAT3
42 cellular response to leptin stimulus (GO:0044320) 1/9 0.04604989 STAT3
43 regulation of histone H4 acetylation (GO:0090239) 1/9 0.04604989 MUC1
44 response to leptin (GO:0044321) 1/9 0.04604989 STAT3
45 regulation of DNA-templated transcription in response to stress (GO:0043620) 1/9 0.04604989 MUC1
46 interleukin-23-mediated signaling pathway (GO:0038155) 1/9 0.04604989 STAT3
47 interleukin-9-mediated signaling pathway (GO:0038113) 1/9 0.04604989 STAT3
48 positive regulation of NF-kappaB transcription factor activity (GO:0051092) 2/155 0.04604989 CARD9;STAT3
49 ionotropic glutamate receptor signaling pathway (GO:0035235) 1/10 0.04604989 CPEB4
50 regulation of receptor binding (GO:1900120) 1/10 0.04604989 ADAM15
51 negative regulation of cell adhesion mediated by integrin (GO:0033629) 1/10 0.04604989 MUC1
52 leptin-mediated signaling pathway (GO:0033210) 1/10 0.04604989 STAT3
53 cellular response to oxygen levels (GO:0071453) 1/10 0.04604989 CPEB4
54 negative regulation of transcription by competitive promoter binding (GO:0010944) 1/10 0.04604989 MUC1
55 lung epithelium development (GO:0060428) 1/10 0.04604989 ERRFI1
56 regulation of T-helper 17 type immune response (GO:2000316) 1/10 0.04604989 CARD9
57 negative regulation of establishment of protein localization (GO:1904950) 1/10 0.04604989 NDFIP1
58 nucleoside metabolic process (GO:0009116) 1/10 0.04604989 TYMP
59 DNA damage response, signal transduction by p53 class mediator resulting in transcription of p21 class mediator (GO:0006978) 1/10 0.04604989 MUC1
60 immunoglobulin mediated immune response (GO:0016064) 1/10 0.04604989 CARD9
61 negative regulation of protein autophosphorylation (GO:0031953) 1/10 0.04604989 ERRFI1
62 sarcoplasmic reticulum calcium ion transport (GO:0070296) 1/10 0.04604989 CCR5
63 negative regulation of receptor binding (GO:1900121) 1/10 0.04604989 ADAM15
64 positive regulation of posttranscriptional gene silencing (GO:0060148) 1/11 0.04604989 STAT3
65 pyrimidine nucleoside catabolic process (GO:0046135) 1/11 0.04604989 TYMP
66 pyrimidine nucleoside salvage (GO:0043097) 1/11 0.04604989 TYMP
67 pyrimidine-containing compound salvage (GO:0008655) 1/11 0.04604989 TYMP
68 B cell mediated immunity (GO:0019724) 1/11 0.04604989 CARD9
69 DNA damage response, signal transduction resulting in transcription (GO:0042772) 1/11 0.04604989 MUC1
70 response to sterol (GO:0036314) 1/11 0.04604989 CCR5
71 interleukin-35-mediated signaling pathway (GO:0070757) 1/11 0.04604989 STAT3
72 positive regulation of I-kappaB kinase/NF-kappaB signaling (GO:0043123) 2/171 0.04604989 NDFIP1;CARD9
73 mitochondrion organization (GO:0007005) 2/175 0.04604989 BIK;TYMP
74 cellular response to growth hormone stimulus (GO:0071378) 1/12 0.04604989 STAT3
75 regulation of feeding behavior (GO:0060259) 1/12 0.04604989 STAT3
76 eye photoreceptor cell differentiation (GO:0001754) 1/12 0.04604989 STAT3
77 pyrimidine-containing compound metabolic process (GO:0072527) 1/12 0.04604989 TYMP
78 nucleoside catabolic process (GO:0009164) 1/12 0.04604989 TYMP
79 nucleoside salvage (GO:0043174) 1/12 0.04604989 TYMP
80 positive regulation of T-helper 17 type immune response (GO:2000318) 1/12 0.04604989 CARD9
81 mitochondrial genome maintenance (GO:0000002) 1/12 0.04604989 TYMP
82 negative regulation of production of miRNAs involved in gene silencing by miRNA (GO:1903799) 1/12 0.04604989 STAT3
83 positive regulation of adaptive immune response based on somatic recombination of immune receptors built from immunoglobulin superfamily domains (GO:0002824) 1/13 0.04604989 CARD9
84 cellular response to interleukin-15 (GO:0071350) 1/13 0.04604989 STAT3
85 negative regulation of stem cell differentiation (GO:2000737) 1/13 0.04604989 ZFP36L2
86 antifungal innate immune response (GO:0061760) 1/13 0.04604989 CARD9
87 negative regulation of epidermal growth factor-activated receptor activity (GO:0007175) 1/13 0.04604989 ERRFI1
88 negative regulation of intrinsic apoptotic signaling pathway in response to DNA damage by p53 class mediator (GO:1902166) 1/13 0.04604989 MUC1
89 homeostasis of number of cells (GO:0048872) 1/13 0.04604989 CARD9
90 interleukin-15-mediated signaling pathway (GO:0035723) 1/13 0.04604989 STAT3
91 entry into host (GO:0044409) 1/13 0.04604989 CCR5
92 pyrimidine nucleoside biosynthetic process (GO:0046134) 1/14 0.04698932 TYMP
93 regulation of intrinsic apoptotic signaling pathway in response to DNA damage by p53 class mediator (GO:1902165) 1/14 0.04698932 MUC1
94 T cell differentiation in thymus (GO:0033077) 1/14 0.04698932 ZFP36L2
95 growth hormone receptor signaling pathway via JAK-STAT (GO:0060397) 1/14 0.04698932 STAT3
96 positive regulation of granulocyte macrophage colony-stimulating factor production (GO:0032725) 1/14 0.04698932 CARD9
97 cellular response to tumor necrosis factor (GO:0071356) 2/194 0.04736409 TNFSF15;ZFP36L2
98 positive regulation of nuclear-transcribed mRNA catabolic process, deadenylation-dependent decay (GO:1900153) 1/15 0.04736409 ZFP36L2
99 pyrimidine nucleoside metabolic process (GO:0006213) 1/15 0.04736409 TYMP
100 regulation of nuclear-transcribed mRNA catabolic process, deadenylation-dependent decay (GO:1900151) 1/15 0.04736409 ZFP36L2
101 regulation of cytoplasmic translation (GO:2000765) 1/15 0.04736409 CPEB4
102 interleukin-27-mediated signaling pathway (GO:0070106) 1/15 0.04736409 STAT3
103 3'-UTR-mediated mRNA destabilization (GO:0061158) 1/16 0.04814045 ZFP36L2
104 activation of NF-kappaB-inducing kinase activity (GO:0007250) 1/16 0.04814045 TNFSF15
105 regulation of granulocyte macrophage colony-stimulating factor production (GO:0032645) 1/16 0.04814045 CARD9
106 dendritic cell chemotaxis (GO:0002407) 1/16 0.04814045 CCR5
107 cellular response to corticosteroid stimulus (GO:0071384) 1/16 0.04814045 ZFP36L2
108 pyrimidine-containing compound catabolic process (GO:0072529) 1/17 0.04973315 TYMP
109 negative regulation of intrinsic apoptotic signaling pathway by p53 class mediator (GO:1902254) 1/17 0.04973315 MUC1
110 vasculature development (GO:0001944) 1/17 0.04973315 ERRFI1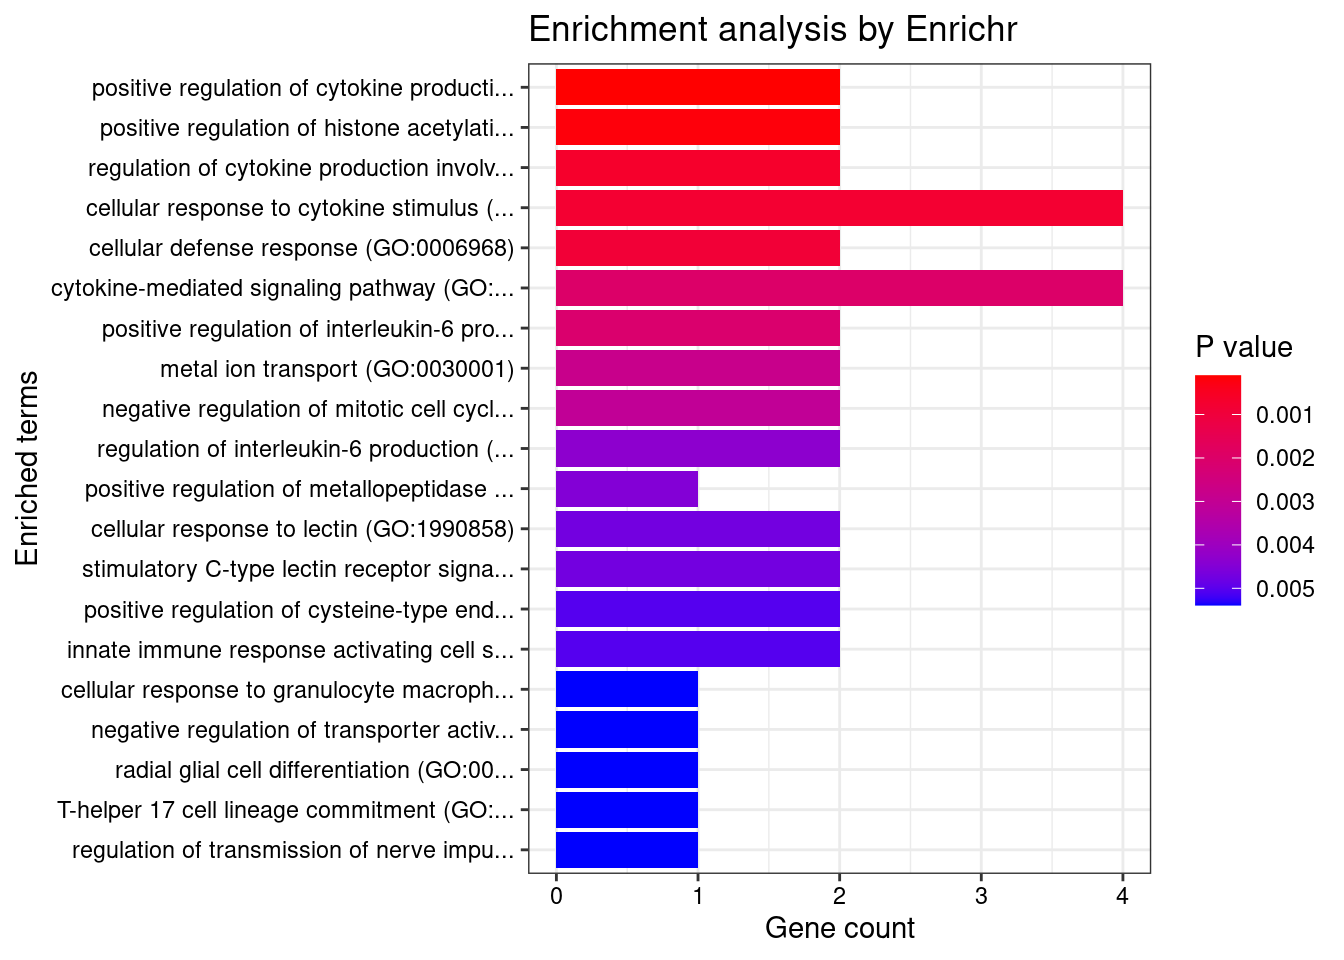
| Version | Author | Date |
|---|---|---|
| d46127d | wesleycrouse | 2022-05-24 |
Digestive

Number of cTWAS Genes in Tissue Group: 33

Uploading data to Enrichr... Done.
  Querying GO_Biological_Process_2021... Done.
Parsing results... Done.

GO_Biological_Process_2021

                                                  Term Overlap Adjusted.P.value      Genes
1          regulation of receptor binding (GO:1900120)    2/10       0.02662798 ADAM15;HFE
2 negative regulation of receptor binding (GO:1900121)    2/10       0.02662798 ADAM15;HFE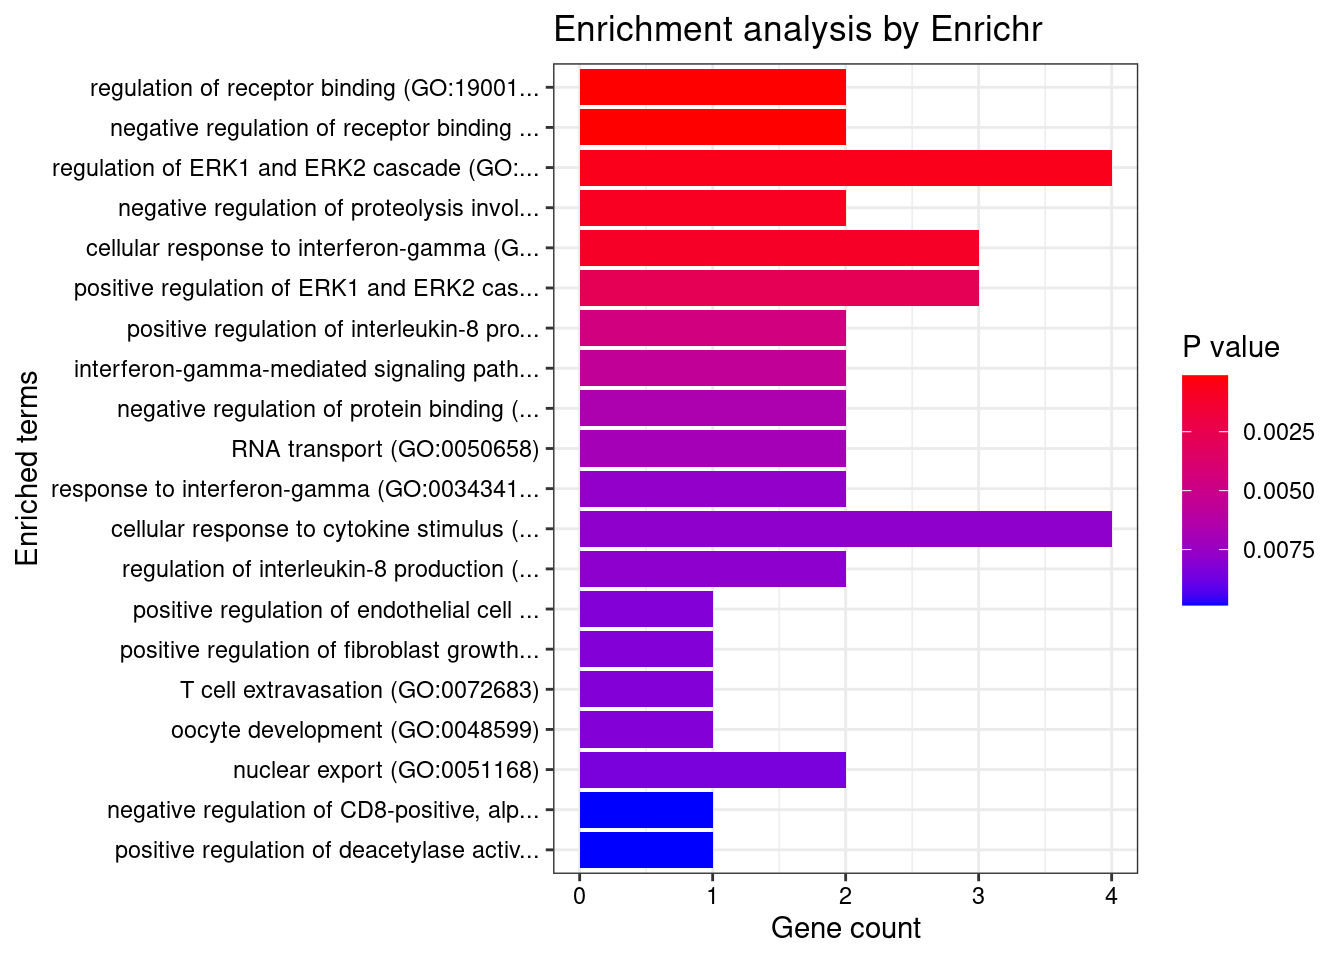
| Version | Author | Date |
|---|---|---|
| d46127d | wesleycrouse | 2022-05-24 |
if (exists("group_enrichment_results")){
  save(group_enrichment_results, file="group_enrichment_results.RData")
}
KEGG
for (group in names(df_group)){
  cat(paste0(group, "\n\n"))

  ctwas_genes_group <- df_group[[group]]$ctwas
  background_group <- df_group[[group]]$background

  cat(paste0("Number of cTWAS Genes in Tissue Group: ", length(ctwas_genes_group), "\n\n"))

  databases <- c("pathway_KEGG")

  enrichResult <- WebGestaltR(enrichMethod="ORA", organism="hsapiens",
                              interestGene=ctwas_genes_group, referenceGene=background_group,
                              enrichDatabase=databases, interestGeneType="genesymbol",
                              referenceGeneType="genesymbol", isOutput=F)

  if (!is.null(enrichResult)){
    print(enrichResult[,c("description", "size", "overlap", "FDR", "userId")])
  }

  cat("\n")
}
Adipose
Number of cTWAS Genes in Tissue Group: 14
Loading the functional categories...
Loading the ID list...
Loading the reference list...
Performing the enrichment analysis...
description size overlap FDR userId
1 Tuberculosis 122 4 0.01401752 HLA-DQA1;CARD9;LSP1;CIITA
Endocrine
Number of cTWAS Genes in Tissue Group: 24
Loading the functional categories...
Loading the ID list...
Loading the reference list...
Performing the enrichment analysis...
description size overlap FDR userId
1 Leishmaniasis 53 4 0.001271743 PRKCB;IFNGR2;FCGR2A;HLA-DMB
2 Tuberculosis 135 5 0.001271743 CARD9;LSP1;IFNGR2;FCGR2A;HLA-DMB
3 Inflammatory bowel disease (IBD) 46 3 0.013346545 IFNGR2;HLA-DMB;SMAD3
4 Influenza A 131 4 0.013346545 PRKCB;IFNGR2;HLA-DMB;IRF3
5 Th17 cell differentiation 81 3 0.046503794 IFNGR2;HLA-DMB;SMAD3
Cardiovascular
Number of cTWAS Genes in Tissue Group: 17
Loading the functional categories...
Loading the ID list...
Loading the reference list...
Performing the enrichment analysis...Warning in oraEnrichment(interestGeneList, referenceGeneList, geneSet, minNum = minNum, : No significant gene set is identified based on FDR 0.05!
CNS

Number of cTWAS Genes in Tissue Group: 30

Loading the functional categories...
Loading the ID list...
Loading the reference list...
Performing the enrichment analysis...
    description size overlap         FDR                             userId
1 Leishmaniasis   61       4 0.002826132       FCGR2A;HLA-DQA1;MAPK13;PRKCB
2  Tuberculosis  147       5 0.002826132 LSP1;FCGR2A;HLA-DQA1;MAPK13;FCER1G

None

Number of cTWAS Genes in Tissue Group: 25

Loading the functional categories...
Loading the ID list...
Loading the reference list...
Performing the enrichment analysis...
Warning in oraEnrichment(interestGeneList, referenceGeneList, geneSet, minNum = minNum, : No significant gene set is identified based on FDR 0.05!
Skin

Number of cTWAS Genes in Tissue Group: 18

Loading the functional categories...
Loading the ID list...
Loading the reference list...
Performing the enrichment analysis...
Warning in oraEnrichment(interestGeneList, referenceGeneList, geneSet, minNum = minNum, : No significant gene set is identified based on FDR 0.05!
Blood or Immune

Number of cTWAS Genes in Tissue Group: 18

Loading the functional categories...
Loading the ID list...
Loading the reference list...
Performing the enrichment analysis...
Warning in oraEnrichment(interestGeneList, referenceGeneList, geneSet, minNum = minNum, : No significant gene set is identified based on FDR 0.05!
Digestive

Number of cTWAS Genes in Tissue Group: 33

Loading the functional categories...
Loading the ID list...
Loading the reference list...
Performing the enrichment analysis...
Warning in oraEnrichment(interestGeneList, referenceGeneList, geneSet, minNum = minNum, : No significant gene set is identified based on FDR 0.05!DisGeNET
for (group in names(df_group)){
  cat(paste0(group, "\n\n"))

  ctwas_genes_group <- df_group[[group]]$ctwas

  cat(paste0("Number of cTWAS Genes in Tissue Group: ", length(ctwas_genes_group), "\n\n"))

  res_enrich <- disease_enrichment(entities=ctwas_genes_group, vocabulary = "HGNC", database = "CURATED")

  if (any(res_enrich@qresult$FDR < 0.05)){
    print(res_enrich@qresult[res_enrich@qresult$FDR < 0.05, c("Description", "FDR", "Ratio",  "BgRatio")])
  }

  cat("\n")
}
Adipose
Number of cTWAS Genes in Tissue Group: 14ADAM15 gene(s) from the input list not found in DisGeNET CURATEDCDH24 gene(s) from the input list not found in DisGeNET CURATEDSDCCAG3 gene(s) from the input list not found in DisGeNET CURATEDFGFR1OP gene(s) from the input list not found in DisGeNET CURATED Description FDR Ratio BgRatio
30 Inflammatory Bowel Diseases 0.0005126855 3/10 35/9703
13 Ulcerative Colitis 0.0015318738 3/10 63/9703
2 Anovulation 0.0115669163 1/10 1/9703
11 Celiac Disease 0.0115669163 2/10 47/9703
20 Enteritis 0.0115669163 1/10 1/9703
79 Deep seated dermatophytosis 0.0115669163 1/10 1/9703
86 Bare Lymphocyte Syndrome, Type II, Complementation Group A 0.0115669163 1/10 1/9703
88 Inflammatory Bowel Disease 10 0.0115669163 1/10 1/9703
93 Mycobacterium tuberculosis, susceptibility to infection by 0.0115669163 1/10 1/9703
35 Megaesophagus 0.0130067446 1/10 2/9703
46 Eosinophilia-Myalgia Syndrome 0.0130067446 1/10 2/9703
71 Eosinophilia-Myalgia Syndrome, L-Tryptophan-Related 0.0130067446 1/10 2/9703
84 Visceral myopathy familial external ophthalmoplegia 0.0130067446 1/10 2/9703
85 Candidiasis, Familial, 2 0.0130067446 1/10 2/9703
90 MITOCHONDRIAL DNA DEPLETION SYNDROME 5 (ENCEPHALOMYOPATHIC WITH OR WITHOUT METHYLMALONIC ACIDURIA) 0.0130067446 1/10 2/9703
99 Mitochondrial DNA Depletion Syndrome 1 0.0130067446 1/10 2/9703
1 Addison Disease 0.0173342823 1/10 3/9703
74 MITOCHONDRIAL NEUROGASTROINTESTINAL ENCEPHALOPATHY SYNDROME 0.0173342823 1/10 3/9703
21 Esophageal Achalasia 0.0180795577 1/10 4/9703
37 Oropharyngeal Neoplasms 0.0180795577 1/10 4/9703
72 Idiopathic achalasia of esophagus 0.0180795577 1/10 4/9703
89 Oropharyngeal Carcinoma 0.0180795577 1/10 4/9703
92 Bare lymphocyte syndrome 2 0.0180795577 1/10 4/9703
39 Pancreatic Neoplasm 0.0188377970 2/10 100/9703
64 Malignant neoplasm of pancreas 0.0188377970 2/10 102/9703
23 Membranous glomerulonephritis 0.0222559421 1/10 6/9703
47 Idiopathic Membranous Glomerulonephritis 0.0222559421 1/10 6/9703
82 Heymann Nephritis 0.0222559421 1/10 6/9703
43 Ankylosing spondylitis 0.0379941985 1/10 11/9703
59 Leukoencephalopathy 0.0379941985 1/10 11/9703
3 Rheumatoid Arthritis 0.0420568353 2/10 174/9703
31 Leishmaniasis, Visceral 0.0420568353 1/10 13/9703
91 Gastro-enteropancreatic neuroendocrine tumor 0.0470129998 1/10 15/9703
18 Dermatitis 0.0486497318 1/10 16/9703
Endocrine
Number of cTWAS Genes in Tissue Group: 24ZNF300 gene(s) from the input list not found in DisGeNET CURATEDGPR132 gene(s) from the input list not found in DisGeNET CURATEDRP11-386E5.1 gene(s) from the input list not found in DisGeNET CURATEDPRM3 gene(s) from the input list not found in DisGeNET CURATEDADAM15 gene(s) from the input list not found in DisGeNET CURATEDRP11-973H7.1 gene(s) from the input list not found in DisGeNET CURATEDRGS14 gene(s) from the input list not found in DisGeNET CURATEDHLA-DMB gene(s) from the input list not found in DisGeNET CURATEDCDH24 gene(s) from the input list not found in DisGeNET CURATED Description FDR Ratio BgRatio
14 Ulcerative Colitis 5.467549e-08 6/15 63/9703
24 Enteritis 1.972420e-02 1/15 1/9703
38 Inflammatory Bowel Diseases 1.972420e-02 2/15 35/9703
51 Mesothelioma 1.972420e-02 2/15 41/9703
56 Niemann-Pick Diseases 1.972420e-02 1/15 1/9703
75 Ureteral obstruction 1.972420e-02 2/15 24/9703
86 Crohn's disease of large bowel 1.972420e-02 2/15 44/9703
97 Crohn's disease of the ileum 1.972420e-02 2/15 44/9703
98 Niemann-Pick Disease, Type A 1.972420e-02 1/15 1/9703
99 Niemann-Pick Disease, Type B 1.972420e-02 1/15 1/9703
100 Niemann-Pick Disease, Type E 1.972420e-02 1/15 1/9703
134 Regional enteritis 1.972420e-02 2/15 44/9703
153 IIeocolitis 1.972420e-02 2/15 44/9703
158 Deep seated dermatophytosis 1.972420e-02 1/15 1/9703
168 Medullary cystic kidney disease 1 1.972420e-02 1/15 1/9703
172 LOEYS-DIETZ SYNDROME 3 1.972420e-02 1/15 1/9703
179 IMMUNODEFICIENCY 28 1.972420e-02 1/15 1/9703
181 EPILEPSY, IDIOPATHIC GENERALIZED, SUSCEPTIBILITY TO, 14 1.972420e-02 1/15 1/9703
182 EPILEPTIC ENCEPHALOPATHY, EARLY INFANTILE, 34 1.972420e-02 1/15 1/9703
183 ENCEPHALOPATHY, ACUTE, INFECTION-INDUCED (HERPES-SPECIFIC), SUSCEPTIBILITY TO, 7 1.972420e-02 1/15 1/9703
19 Crohn Disease 2.419521e-02 2/15 50/9703
167 Candidiasis, Familial, 2 2.724743e-02 1/15 2/9703
50 Meniere Disease 3.906593e-02 1/15 3/9703
1 Herpetic Acute Necrotizing Encephalitis 4.984560e-02 1/15 5/9703
3 Aneurysm, Dissecting 4.984560e-02 1/15 5/9703
52 Mucocutaneous Lymph Node Syndrome 4.984560e-02 1/15 4/9703
112 Dissection of aorta 4.984560e-02 1/15 5/9703
165 Loeys-Dietz Aortic Aneurysm Syndrome 4.984560e-02 1/15 5/9703
184 Dissection, Blood Vessel 4.984560e-02 1/15 5/9703
189 Loeys-Dietz Syndrome, Type 1a 4.984560e-02 1/15 5/9703
Cardiovascular
Number of cTWAS Genes in Tissue Group: 17ADAM15 gene(s) from the input list not found in DisGeNET CURATEDBRD7 gene(s) from the input list not found in DisGeNET CURATEDRP11-973H7.1 gene(s) from the input list not found in DisGeNET CURATEDRGS14 gene(s) from the input list not found in DisGeNET CURATEDRP11-373D23.3 gene(s) from the input list not found in DisGeNET CURATED Description FDR Ratio BgRatio
29 Ulcerative Colitis 0.0002162403 4/12 63/9703
4 Aortic Aneurysm 0.0041246609 2/12 7/9703
19 Calcinosis 0.0115852402 2/12 42/9703
21 Malignant tumor of colon 0.0115852402 3/12 159/9703
30 Colonic Neoplasms 0.0115852402 3/12 152/9703
39 Enteritis 0.0115852402 1/12 1/9703
49 Huntington Disease 0.0115852402 2/12 17/9703
52 Inflammation 0.0115852402 3/12 127/9703
89 Pancreatic Neoplasm 0.0115852402 3/12 100/9703
142 Middle Cerebral Artery Syndrome 0.0115852402 2/12 34/9703
144 Tumoral calcinosis 0.0115852402 2/12 42/9703
175 Malignant neoplasm of pancreas 0.0115852402 3/12 102/9703
185 Microcalcification 0.0115852402 2/12 42/9703
191 Middle Cerebral Artery Thrombosis 0.0115852402 2/12 34/9703
192 Middle Cerebral Artery Occlusion 0.0115852402 2/12 34/9703
193 Infarction, Middle Cerebral Artery 0.0115852402 2/12 34/9703
209 Middle Cerebral Artery Embolus 0.0115852402 2/12 34/9703
210 Left Middle Cerebral Artery Infarction 0.0115852402 2/12 34/9703
211 Embolic Infarction, Middle Cerebral Artery 0.0115852402 2/12 34/9703
212 Thrombotic Infarction, Middle Cerebral Artery 0.0115852402 2/12 34/9703
213 Right Middle Cerebral Artery Infarction 0.0115852402 2/12 34/9703
233 Chronic Lymphoproliferative Disorder of NK-Cells 0.0115852402 1/12 1/9703
252 Metaphyseal Anadysplasia 2 0.0115852402 1/12 1/9703
253 Neutropenia and hyperlymphocytosis with large granular lymphocytes 0.0115852402 1/12 1/9703
257 Cerebral Hemorrhage 0.0115852402 2/12 28/9703
258 CUTIS LAXA, AUTOSOMAL RECESSIVE, TYPE IB 0.0115852402 1/12 1/9703
259 Hyper-Ige Recurrent Infection Syndrome, Autosomal Dominant 0.0115852402 1/12 1/9703
265 IMMUNODEFICIENCY 28 0.0115852402 1/12 1/9703
266 AUTOIMMUNE DISEASE, MULTISYSTEM, INFANTILE-ONSET, 1 0.0115852402 1/12 1/9703
279 HYPER-IgE RECURRENT INFECTION SYNDROME 1, AUTOSOMAL DOMINANT 0.0115852402 1/12 1/9703
26 Brain Ischemia 0.0169443979 2/12 60/9703
81 Neoplasm Metastasis 0.0169443979 3/12 217/9703
148 Cutis Laxa, Autosomal Recessive, Type I 0.0169443979 1/12 2/9703
179 Metaphyseal anadysplasia 0.0169443979 1/12 2/9703
180 Mandibuloacral dysostosis 0.0169443979 1/12 2/9703
181 Cutis laxa, recessive, type I 0.0169443979 1/12 2/9703
219 Cerebral Ischemia 0.0169443979 2/12 60/9703
244 Visceral myopathy familial external ophthalmoplegia 0.0169443979 1/12 2/9703
247 T-Cell Large Granular Lymphocyte Leukemia 0.0169443979 1/12 2/9703
251 MITOCHONDRIAL DNA DEPLETION SYNDROME 5 (ENCEPHALOMYOPATHIC WITH OR WITHOUT METHYLMALONIC ACIDURIA) 0.0169443979 1/12 2/9703
270 Mitochondrial DNA Depletion Syndrome 1 0.0169443979 1/12 2/9703
90 Pericementitis 0.0226410811 1/12 3/9703
171 Stable angina 0.0226410811 1/12 3/9703
216 MITOCHONDRIAL NEUROGASTROINTESTINAL ENCEPHALOPATHY SYNDROME 0.0226410811 1/12 3/9703
248 Hyper-Immunoglobulin E Syndrome, Autosomal Recessive 0.0226410811 1/12 3/9703
256 Hyper-Immunoglobulin E Syndrome, Autosomal Dominant 0.0226410811 1/12 3/9703
66 Lung diseases 0.0239035600 2/12 78/9703
68 Lupus Nephritis 0.0261861484 1/12 4/9703
91 Periodontitis 0.0261861484 1/12 4/9703
98 Pulmonary Fibrosis 0.0261861484 2/12 85/9703
138 Ki-1+ Anaplastic Large Cell Lymphoma 0.0261861484 1/12 4/9703
264 Job Syndrome 0.0261861484 1/12 4/9703
276 Alveolitis, Fibrosing 0.0261861484 2/12 83/9703
100 Reperfusion Injury 0.0269260026 2/12 89/9703
6 Aortic Rupture 0.0304184056 1/12 5/9703
59 Leukemia, T-Cell 0.0304184056 1/12 5/9703
194 Aortic Aneurysm, Ruptured 0.0304184056 1/12 5/9703
5 Aortic Diseases 0.0340891787 1/12 6/9703
34 Cutis Laxa 0.0340891787 1/12 6/9703
254 Neointima 0.0340891787 1/12 6/9703
255 Neointima Formation 0.0340891787 1/12 6/9703
16 Bone neoplasms 0.0359668268 1/12 8/9703
17 Cerebral Edema 0.0359668268 1/12 8/9703
24 Squamous cell carcinoma 0.0359668268 2/12 124/9703
54 Lead Poisoning 0.0359668268 1/12 7/9703
76 Morphine Dependence 0.0359668268 1/12 7/9703
77 Multiple Organ Failure 0.0359668268 1/12 8/9703
123 Aortic Aneurysm, Thoracic 0.0359668268 1/12 7/9703
158 Malignant Bone Neoplasm 0.0359668268 1/12 8/9703
172 Aortic Aneurysm, Thoracoabdominal 0.0359668268 1/12 7/9703
182 Vasogenic Cerebral Edema 0.0359668268 1/12 8/9703
183 Cytotoxic Cerebral Edema 0.0359668268 1/12 8/9703
188 Morphine Abuse 0.0359668268 1/12 7/9703
197 Vasogenic Brain Edema 0.0359668268 1/12 8/9703
198 Cytotoxic Brain Edema 0.0359668268 1/12 8/9703
235 Brain Edema 0.0359668268 1/12 8/9703
243 DIABETES MELLITUS, PERMANENT NEONATAL 0.0359668268 1/12 7/9703
260 Juvenile arthritis 0.0379222968 2/12 131/9703
262 Juvenile psoriatic arthritis 0.0379222968 2/12 131/9703
271 Polyarthritis, Juvenile, Rheumatoid Factor Negative 0.0379222968 2/12 131/9703
273 Polyarthritis, Juvenile, Rheumatoid Factor Positive 0.0379222968 2/12 131/9703
280 Marfan Syndrome, Type I 0.0379739201 1/12 9/9703
116 Juvenile-Onset Still Disease 0.0392042074 2/12 135/9703
15 Bladder Neoplasm 0.0400963530 2/12 140/9703
25 Neoplastic Cell Transformation 0.0400963530 2/12 139/9703
122 Aortic Aneurysm, Abdominal 0.0400963530 1/12 10/9703
163 Atrophic 0.0400963530 1/12 10/9703
14 Malignant neoplasm of urinary bladder 0.0401834846 2/12 141/9703
73 Marfan Syndrome 0.0413208789 1/12 11/9703
119 Premature Birth 0.0413208789 1/12 11/9703
149 Leukoencephalopathy 0.0413208789 1/12 11/9703
245 Copper-Overload Cirrhosis 0.0413208789 1/12 11/9703
57 Precursor B-Cell Lymphoblastic Leukemia-Lymphoma 0.0418663161 1/12 12/9703
139 Centriacinar Emphysema 0.0418663161 1/12 12/9703
145 Panacinar Emphysema 0.0418663161 1/12 12/9703
177 Huntington Disease, Late Onset 0.0418663161 1/12 12/9703
200 Akinetic-Rigid Variant of Huntington Disease 0.0418663161 1/12 12/9703
201 Juvenile Huntington Disease 0.0418663161 1/12 12/9703
250 Focal Emphysema 0.0418663161 1/12 12/9703
20 Carcinoma 0.0420007444 2/12 164/9703
23 Non-Small Cell Lung Carcinoma 0.0420007444 2/12 156/9703
38 Diabetic Neuropathies 0.0420007444 1/12 14/9703
72 Mammary Neoplasms, Experimental 0.0420007444 2/12 155/9703
129 Anaplastic carcinoma 0.0420007444 2/12 163/9703
130 Carcinoma, Spindle-Cell 0.0420007444 2/12 163/9703
131 Undifferentiated carcinoma 0.0420007444 2/12 163/9703
132 Carcinomatosis 0.0420007444 2/12 163/9703
150 Symmetric Diabetic Proximal Motor Neuropathy 0.0420007444 1/12 14/9703
151 Asymmetric Diabetic Proximal Motor Neuropathy 0.0420007444 1/12 14/9703
152 Diabetic Mononeuropathy 0.0420007444 1/12 14/9703
153 Diabetic Polyneuropathies 0.0420007444 1/12 14/9703
154 Diabetic Amyotrophy 0.0420007444 1/12 14/9703
155 Diabetic Autonomic Neuropathy 0.0420007444 1/12 14/9703
178 Diabetic Asymmetric Polyneuropathy 0.0420007444 1/12 14/9703
199 Diabetic Neuralgia 0.0420007444 1/12 14/9703
82 Embryonal Neoplasm 0.0423947729 1/12 15/9703
83 Neoplasms, Germ Cell and Embryonal 0.0423947729 1/12 15/9703
136 Germ cell tumor 0.0423947729 1/12 15/9703
137 Neoplasms, Embryonal and Mixed 0.0423947729 1/12 15/9703
190 Germ Cell Cancer 0.0423947729 1/12 15/9703
207 Cancer, Embryonal 0.0423947729 1/12 15/9703
208 Cancer, Embryonal and Mixed 0.0423947729 1/12 15/9703
111 T-Cell Lymphoma 0.0448280532 1/12 16/9703
97 Pulmonary Emphysema 0.0472189576 1/12 17/9703
86 Oral Submucous Fibrosis 0.0491751056 1/12 18/9703
107 Gastric ulcer 0.0491751056 1/12 18/9703
61 Lipoidosis 0.0498976232 1/12 19/9703
146 Congenital hernia of foramen of Morgagni 0.0498976232 1/12 19/9703
147 Congenital hernia of foramen of Bochdalek 0.0498976232 1/12 19/9703
277 Hamman-Rich Disease 0.0498976232 1/12 19/9703
278 Usual Interstitial Pneumonia 0.0498976232 1/12 19/9703
CNS
Number of cTWAS Genes in Tissue Group: 30TTPAL gene(s) from the input list not found in DisGeNET CURATEDRGS14 gene(s) from the input list not found in DisGeNET CURATEDTSPAN14 gene(s) from the input list not found in DisGeNET CURATEDLINC01126 gene(s) from the input list not found in DisGeNET CURATEDRAB29 gene(s) from the input list not found in DisGeNET CURATEDRP11-973H7.1 gene(s) from the input list not found in DisGeNET CURATEDADAM15 gene(s) from the input list not found in DisGeNET CURATEDLINC01700 gene(s) from the input list not found in DisGeNET CURATEDPLEKHH2 gene(s) from the input list not found in DisGeNET CURATEDSDCCAG3 gene(s) from the input list not found in DisGeNET CURATEDAP006621.5 gene(s) from the input list not found in DisGeNET CURATEDCASC3 gene(s) from the input list not found in DisGeNET CURATEDAPEH gene(s) from the input list not found in DisGeNET CURATED Description FDR Ratio BgRatio
13 Ulcerative Colitis 0.00071135 4/17 63/9703
22 Diabetes Mellitus, Insulin-Dependent 0.03284780 2/17 45/9703
25 Enteritis 0.03284780 1/17 1/9703
52 Megaesophagus 0.03284780 1/17 2/9703
83 Eosinophilia-Myalgia Syndrome 0.03284780 1/17 2/9703
94 Diabetes, Autoimmune 0.03284780 2/17 44/9703
102 Cutis Laxa, Autosomal Recessive, Type I 0.03284780 1/17 2/9703
114 Brittle diabetes 0.03284780 2/17 44/9703
129 Cutis laxa, recessive, type I 0.03284780 1/17 2/9703
149 Eosinophilia-Myalgia Syndrome, L-Tryptophan-Related 0.03284780 1/17 2/9703
168 Mainzer-Saldino Disease 0.03284780 1/17 2/9703
171 Medullary cystic kidney disease 1 0.03284780 1/17 1/9703
174 Mycobacterium tuberculosis, susceptibility to infection by 0.03284780 1/17 1/9703
176 CUTIS LAXA, AUTOSOMAL RECESSIVE, TYPE IB 0.03284780 1/17 1/9703
181 SHORT-RIB THORACIC DYSPLASIA 10 WITH OR WITHOUT POLYDACTYLY 0.03284780 1/17 1/9703
182 Diabetes Mellitus, Ketosis-Prone 0.03284780 2/17 44/9703
184 EPILEPSY, IDIOPATHIC GENERALIZED, SUSCEPTIBILITY TO, 14 0.03284780 1/17 1/9703
185 EPILEPTIC ENCEPHALOPATHY, EARLY INFANTILE, 34 0.03284780 1/17 1/9703
186 RETINITIS PIGMENTOSA 71 0.03284780 1/17 1/9703
187 SPASTIC PARAPLEGIA 73, AUTOSOMAL DOMINANT 0.03284780 1/17 1/9703
193 Diabetes Mellitus, Sudden-Onset 0.03284780 2/17 44/9703
99 Libman-Sacks Disease 0.04038735 2/17 58/9703
37 Hypersensitivity 0.04142216 2/17 64/9703
54 Meniere Disease 0.04142216 1/17 3/9703
162 Allergic Reaction 0.04142216 2/17 63/9703
170 Rheumatoid Arthritis, Systemic Juvenile 0.04142216 1/17 3/9703
29 Esophageal Achalasia 0.04173739 1/17 4/9703
48 Lupus Erythematosus, Systemic 0.04173739 2/17 71/9703
56 Mucocutaneous Lymph Node Syndrome 0.04173739 1/17 4/9703
59 Oropharyngeal Neoplasms 0.04173739 1/17 4/9703
153 Idiopathic achalasia of esophagus 0.04173739 1/17 4/9703
160 Systemic onset juvenile chronic arthritis 0.04173739 1/17 4/9703
172 Oropharyngeal Carcinoma 0.04173739 1/17 4/9703
None
Number of cTWAS Genes in Tissue Group: 25DDX39B gene(s) from the input list not found in DisGeNET CURATEDADAM15 gene(s) from the input list not found in DisGeNET CURATEDAPEH gene(s) from the input list not found in DisGeNET CURATEDRP11-973H7.1 gene(s) from the input list not found in DisGeNET CURATEDRP11-107M16.2 gene(s) from the input list not found in DisGeNET CURATEDRGS14 gene(s) from the input list not found in DisGeNET CURATEDOAZ3 gene(s) from the input list not found in DisGeNET CURATEDCDH24 gene(s) from the input list not found in DisGeNET CURATED Description FDR Ratio BgRatio
19 Ulcerative Colitis 1.571019e-09 7/17 63/9703
30 Enteritis 2.259436e-02 1/17 1/9703
46 Inflammatory Bowel Diseases 2.259436e-02 2/17 35/9703
56 Lung diseases 2.259436e-02 3/17 78/9703
127 Congenital chloride diarrhea 2.259436e-02 1/17 1/9703
194 Deep seated dermatophytosis 2.259436e-02 1/17 1/9703
196 Chronic Lymphoproliferative Disorder of NK-Cells 2.259436e-02 1/17 1/9703
205 PARKINSON DISEASE 8 (disorder) 2.259436e-02 1/17 1/9703
209 Medullary cystic kidney disease 1 2.259436e-02 1/17 1/9703
216 Waardenburg Syndrome, Type 4b 2.259436e-02 1/17 1/9703
217 Neutropenia and hyperlymphocytosis with large granular lymphocytes 2.259436e-02 1/17 1/9703
219 HIRSCHSPRUNG DISEASE, SUSCEPTIBILITY TO, 4 2.259436e-02 1/17 1/9703
221 CUTIS LAXA, AUTOSOMAL RECESSIVE, TYPE IB 2.259436e-02 1/17 1/9703
222 Hyper-Ige Recurrent Infection Syndrome, Autosomal Dominant 2.259436e-02 1/17 1/9703
228 IMMUNODEFICIENCY 32A 2.259436e-02 1/17 1/9703
231 IMMUNODEFICIENCY 28 2.259436e-02 1/17 1/9703
232 AUTOIMMUNE DISEASE, MULTISYSTEM, INFANTILE-ONSET, 1 2.259436e-02 1/17 1/9703
233 IMMUNODEFICIENCY 32B 2.259436e-02 1/17 1/9703
244 HYPER-IgE RECURRENT INFECTION SYNDROME 1, AUTOSOMAL DOMINANT 2.259436e-02 1/17 1/9703
68 Multiple Myeloma 2.673196e-02 2/17 42/9703
115 Diabetes, Autoimmune 2.673196e-02 2/17 44/9703
138 Brittle diabetes 2.673196e-02 2/17 44/9703
229 Diabetes Mellitus, Ketosis-Prone 2.673196e-02 2/17 44/9703
237 Diabetes Mellitus, Sudden-Onset 2.673196e-02 2/17 44/9703
28 Diabetes Mellitus, Insulin-Dependent 2.682867e-02 2/17 45/9703
23 Crohn Disease 2.859593e-02 2/17 50/9703
128 Cutis Laxa, Autosomal Recessive, Type I 2.859593e-02 1/17 2/9703
146 Cutis laxa, recessive, type I 2.859593e-02 1/17 2/9703
208 Candidiasis, Familial, 2 2.859593e-02 1/17 2/9703
213 T-Cell Large Granular Lymphocyte Leukemia 2.859593e-02 1/17 2/9703
215 Hyper-Immunoglobulin E Syndrome, Autosomal Recessive 4.017987e-02 1/17 3/9703
218 Hyper-Immunoglobulin E Syndrome, Autosomal Dominant 4.017987e-02 1/17 3/9703
67 Mucocutaneous Lymph Node Syndrome 4.758133e-02 1/17 4/9703
117 Ki-1+ Anaplastic Large Cell Lymphoma 4.758133e-02 1/17 4/9703
206 WAARDENBURG SYNDROME, TYPE 4A 4.758133e-02 1/17 4/9703
230 Job Syndrome 4.758133e-02 1/17 4/9703
Skin
Number of cTWAS Genes in Tissue Group: 18HLA-DOB gene(s) from the input list not found in DisGeNET CURATEDADAM15 gene(s) from the input list not found in DisGeNET CURATEDTSPAN14 gene(s) from the input list not found in DisGeNET CURATEDNPEPPS gene(s) from the input list not found in DisGeNET CURATEDNDFIP1 gene(s) from the input list not found in DisGeNET CURATEDRGS14 gene(s) from the input list not found in DisGeNET CURATEDLINC01126 gene(s) from the input list not found in DisGeNET CURATEDOAZ3 gene(s) from the input list not found in DisGeNET CURATEDAC007383.3 gene(s) from the input list not found in DisGeNET CURATEDTNFRSF6B gene(s) from the input list not found in DisGeNET CURATED Description FDR Ratio BgRatio
57 Leukemia, T-Cell 0.001658313 2/8 5/9703
30 Ulcerative Colitis 0.001993185 3/8 63/9703
86 Pancreatic Neoplasm 0.004244206 3/8 100/9703
174 Malignant neoplasm of pancreas 0.004244206 3/8 102/9703
23 Malignant tumor of colon 0.006128309 3/8 159/9703
31 Colonic Neoplasms 0.006128309 3/8 152/9703
140 Middle Cerebral Artery Syndrome 0.006128309 2/8 34/9703
189 Middle Cerebral Artery Thrombosis 0.006128309 2/8 34/9703
190 Middle Cerebral Artery Occlusion 0.006128309 2/8 34/9703
191 Infarction, Middle Cerebral Artery 0.006128309 2/8 34/9703
205 Middle Cerebral Artery Embolus 0.006128309 2/8 34/9703
206 Left Middle Cerebral Artery Infarction 0.006128309 2/8 34/9703
207 Embolic Infarction, Middle Cerebral Artery 0.006128309 2/8 34/9703
208 Thrombotic Infarction, Middle Cerebral Artery 0.006128309 2/8 34/9703
209 Right Middle Cerebral Artery Infarction 0.006128309 2/8 34/9703
34 Crohn Disease 0.008520580 2/8 50/9703
56 Acute Promyelocytic Leukemia 0.008520580 2/8 46/9703
79 Neoplasm Metastasis 0.008520580 3/8 217/9703
220 Gestational Trophoblastic Neoplasms 0.008520580 1/8 1/9703
229 Chronic Lymphoproliferative Disorder of NK-Cells 0.008520580 1/8 1/9703
250 Metaphyseal Anadysplasia 2 0.008520580 1/8 1/9703
251 Neutropenia and hyperlymphocytosis with large granular lymphocytes 0.008520580 1/8 1/9703
253 Gestational trophoblastic disease 0.008520580 1/8 1/9703
258 Hyper-Ige Recurrent Infection Syndrome, Autosomal Dominant 0.008520580 1/8 1/9703
264 AUTOIMMUNE DISEASE, MULTISYSTEM, INFANTILE-ONSET, 1 0.008520580 1/8 1/9703
268 MYOPIA 25, AUTOSOMAL DOMINANT 0.008520580 1/8 1/9703
277 HYPER-IgE RECURRENT INFECTION SYNDROME 1, AUTOSOMAL DOMINANT 0.008520580 1/8 1/9703
28 Brain Ischemia 0.009894212 2/8 60/9703
214 Cerebral Ischemia 0.009894212 2/8 60/9703
177 Metaphyseal anadysplasia 0.013141295 1/8 2/9703
178 Mandibuloacral dysostosis 0.013141295 1/8 2/9703
240 Visceral myopathy familial external ophthalmoplegia 0.013141295 1/8 2/9703
243 T-Cell Large Granular Lymphocyte Leukemia 0.013141295 1/8 2/9703
249 MITOCHONDRIAL DNA DEPLETION SYNDROME 5 (ENCEPHALOMYOPATHIC WITH OR WITHOUT METHYLMALONIC ACIDURIA) 0.013141295 1/8 2/9703
269 Mitochondrial DNA Depletion Syndrome 1 0.013141295 1/8 2/9703
41 Glioblastoma 0.013765297 2/8 79/9703
94 Pulmonary Fibrosis 0.014686658 2/8 85/9703
168 Giant Cell Glioblastoma 0.014686658 2/8 84/9703
274 Alveolitis, Fibrosing 0.014686658 2/8 83/9703
87 Pericementitis 0.015325979 1/8 3/9703
96 Reperfusion Injury 0.015325979 2/8 89/9703
170 Stable angina 0.015325979 1/8 3/9703
211 MITOCHONDRIAL NEUROGASTROINTESTINAL ENCEPHALOPATHY SYNDROME 0.015325979 1/8 3/9703
245 Hyper-Immunoglobulin E Syndrome, Autosomal Recessive 0.015325979 1/8 3/9703
256 Hyper-Immunoglobulin E Syndrome, Autosomal Dominant 0.015325979 1/8 3/9703
66 Lupus Nephritis 0.018759735 1/8 4/9703
88 Periodontitis 0.018759735 1/8 4/9703
133 Ki-1+ Anaplastic Large Cell Lymphoma 0.018759735 1/8 4/9703
263 Job Syndrome 0.018759735 1/8 4/9703
233 Glioblastoma Multiforme 0.019380546 2/8 111/9703
4 Aortic Aneurysm 0.021714962 1/8 7/9703
5 Aortic Diseases 0.021714962 1/8 6/9703
6 Aortic Rupture 0.021714962 1/8 5/9703
16 Malignant neoplasm of urinary bladder 0.021714962 2/8 141/9703
17 Bladder Neoplasm 0.021714962 2/8 140/9703
26 Squamous cell carcinoma 0.021714962 2/8 124/9703
27 Neoplastic Cell Transformation 0.021714962 2/8 139/9703
50 Inflammation 0.021714962 2/8 127/9703
52 Lead Poisoning 0.021714962 1/8 7/9703
74 Morphine Dependence 0.021714962 1/8 7/9703
111 Juvenile-Onset Still Disease 0.021714962 2/8 135/9703
118 Aortic Aneurysm, Thoracic 0.021714962 1/8 7/9703
171 Aortic Aneurysm, Thoracoabdominal 0.021714962 1/8 7/9703
185 Morphine Abuse 0.021714962 1/8 7/9703
192 Aortic Aneurysm, Ruptured 0.021714962 1/8 5/9703
239 DIABETES MELLITUS, PERMANENT NEONATAL 0.021714962 1/8 7/9703
248 clinical depression 0.021714962 1/8 6/9703
252 Juvenile pauciarticular chronic arthritis 0.021714962 1/8 7/9703
254 Neointima 0.021714962 1/8 6/9703
255 Neointima Formation 0.021714962 1/8 6/9703
259 Juvenile arthritis 0.021714962 2/8 131/9703
261 Juvenile psoriatic arthritis 0.021714962 2/8 131/9703
270 Polyarthritis, Juvenile, Rheumatoid Factor Negative 0.021714962 2/8 131/9703
272 Polyarthritis, Juvenile, Rheumatoid Factor Positive 0.021714962 2/8 131/9703
18 Bone neoplasms 0.022118108 1/8 8/9703
19 Cerebral Edema 0.022118108 1/8 8/9703
75 Multiple Organ Failure 0.022118108 1/8 8/9703
157 Malignant Bone Neoplasm 0.022118108 1/8 8/9703
179 Vasogenic Cerebral Edema 0.022118108 1/8 8/9703
180 Cytotoxic Cerebral Edema 0.022118108 1/8 8/9703
195 Vasogenic Brain Edema 0.022118108 1/8 8/9703
196 Cytotoxic Brain Edema 0.022118108 1/8 8/9703
231 Brain Edema 0.022118108 1/8 8/9703
70 Mammary Neoplasms, Experimental 0.022145490 2/8 155/9703
25 Non-Small Cell Lung Carcinoma 0.022159998 2/8 156/9703
22 Carcinoma 0.022807811 2/8 164/9703
124 Anaplastic carcinoma 0.022807811 2/8 163/9703
125 Carcinoma, Spindle-Cell 0.022807811 2/8 163/9703
126 Undifferentiated carcinoma 0.022807811 2/8 163/9703
127 Carcinomatosis 0.022807811 2/8 163/9703
278 Marfan Syndrome, Type I 0.022807811 1/8 9/9703
117 Aortic Aneurysm, Abdominal 0.024656976 1/8 10/9703
162 Atrophic 0.024656976 1/8 10/9703
71 Marfan Syndrome 0.025994835 1/8 11/9703
114 Premature Birth 0.025994835 1/8 11/9703
148 Leukoencephalopathy 0.025994835 1/8 11/9703
241 Copper-Overload Cirrhosis 0.025994835 1/8 11/9703
55 Precursor B-Cell Lymphoblastic Leukemia-Lymphoma 0.027225092 1/8 12/9703
134 Centriacinar Emphysema 0.027225092 1/8 12/9703
144 Panacinar Emphysema 0.027225092 1/8 12/9703
247 Focal Emphysema 0.027225092 1/8 12/9703
38 Diabetic Neuropathies 0.029142821 1/8 14/9703
149 Symmetric Diabetic Proximal Motor Neuropathy 0.029142821 1/8 14/9703
150 Asymmetric Diabetic Proximal Motor Neuropathy 0.029142821 1/8 14/9703
151 Diabetic Mononeuropathy 0.029142821 1/8 14/9703
152 Diabetic Polyneuropathies 0.029142821 1/8 14/9703
153 Diabetic Amyotrophy 0.029142821 1/8 14/9703
154 Diabetic Autonomic Neuropathy 0.029142821 1/8 14/9703
176 Diabetic Asymmetric Polyneuropathy 0.029142821 1/8 14/9703
197 Diabetic Neuralgia 0.029142821 1/8 14/9703
80 Embryonal Neoplasm 0.029345737 1/8 15/9703
81 Neoplasms, Germ Cell and Embryonal 0.029345737 1/8 15/9703
131 Germ cell tumor 0.029345737 1/8 15/9703
132 Neoplasms, Embryonal and Mixed 0.029345737 1/8 15/9703
188 Germ Cell Cancer 0.029345737 1/8 15/9703
203 Cancer, Embryonal 0.029345737 1/8 15/9703
204 Cancer, Embryonal and Mixed 0.029345737 1/8 15/9703
106 T-Cell Lymphoma 0.031025658 1/8 16/9703
93 Pulmonary Emphysema 0.032675963 1/8 17/9703
84 Oral Submucous Fibrosis 0.034013943 1/8 18/9703
103 Gastric ulcer 0.034013943 1/8 18/9703
145 Congenital hernia of foramen of Morgagni 0.034742163 1/8 19/9703
146 Congenital hernia of foramen of Bochdalek 0.034742163 1/8 19/9703
275 Hamman-Rich Disease 0.034742163 1/8 19/9703
276 Usual Interstitial Pneumonia 0.034742163 1/8 19/9703
279 Familial Idiopathic Pulmonary Fibrosis 0.036267377 1/8 20/9703
107 Ovarian Failure, Premature 0.037181741 1/8 21/9703
136 Congenital diaphragmatic hernia 0.037181741 1/8 21/9703
238 Idiopathic Pulmonary Fibrosis 0.037181741 1/8 21/9703
44 Hepatitis, Chronic 0.037767185 1/8 22/9703
113 Chronic Persistent Hepatitis 0.037767185 1/8 22/9703
181 Chronic active hepatitis 0.037767185 1/8 22/9703
183 Cryptogenic Chronic Hepatitis 0.037767185 1/8 22/9703
10 Astrocytoma 0.038267290 1/8 25/9703
13 Behcet Syndrome 0.038267290 1/8 24/9703
95 Pyemia 0.038267290 1/8 24/9703
100 Septicemia 0.038267290 1/8 24/9703
116 Neonatal diabetes mellitus 0.038267290 1/8 25/9703
129 Subependymal Giant Cell Astrocytoma 0.038267290 1/8 25/9703
142 Sepsis 0.038267290 1/8 24/9703
159 Juvenile Pilocytic Astrocytoma 0.038267290 1/8 25/9703
160 Diffuse Astrocytoma 0.038267290 1/8 25/9703
167 Pilocytic Astrocytoma 0.038267290 1/8 25/9703
169 Childhood Cerebral Astrocytoma 0.038267290 1/8 25/9703
184 Mixed oligoastrocytoma 0.038267290 1/8 25/9703
193 Cerebral Astrocytoma 0.038267290 1/8 25/9703
194 Intracranial Astrocytoma 0.038267290 1/8 25/9703
235 Grade I Astrocytoma 0.038267290 1/8 25/9703
237 Severe Sepsis 0.038267290 1/8 24/9703
67 Lymphatic Metastasis 0.038743546 1/8 26/9703
164 Protoplasmic astrocytoma 0.038743546 1/8 26/9703
165 Gemistocytic astrocytoma 0.038743546 1/8 26/9703
166 Fibrillary Astrocytoma 0.038743546 1/8 26/9703
39 Fever 0.039445739 1/8 27/9703
97 Retinal Diseases 0.039445739 1/8 27/9703
163 Anaplastic astrocytoma 0.039445739 1/8 27/9703
236 Hereditary Diffuse Gastric Cancer 0.040105760 2/8 293/9703
48 Hyperplasia 0.040120408 1/8 28/9703
257 Cerebral Hemorrhage 0.040120408 1/8 28/9703
102 Stomach Neoplasms 0.040370346 2/8 297/9703
68 Malignant neoplasm of stomach 0.040884585 2/8 300/9703
58 Adult T-Cell Lymphoma/Leukemia 0.043549347 1/8 31/9703
14 Cholestasis, Extrahepatic 0.044662278 1/8 32/9703
64 Chronic Obstructive Airway Disease 0.045209310 1/8 33/9703
216 Acute Coronary Syndrome 0.045209310 1/8 33/9703
230 Chronic Airflow Obstruction 0.045209310 1/8 33/9703
265 cervical cancer 0.046283695 1/8 34/9703
29 Uterine Cervical Neoplasm 0.047064177 1/8 35/9703
51 Inflammatory Bowel Diseases 0.047064177 1/8 35/9703
Blood or Immune
Number of cTWAS Genes in Tissue Group: 18C10orf105 gene(s) from the input list not found in DisGeNET CURATEDBRD7 gene(s) from the input list not found in DisGeNET CURATEDNPIPB3 gene(s) from the input list not found in DisGeNET CURATEDADAM15 gene(s) from the input list not found in DisGeNET CURATEDOSER1 gene(s) from the input list not found in DisGeNET CURATEDBIK gene(s) from the input list not found in DisGeNET CURATEDCPEB4 gene(s) from the input list not found in DisGeNET CURATEDNDFIP1 gene(s) from the input list not found in DisGeNET CURATED Description FDR Ratio BgRatio
17 Ulcerative Colitis 6.131872e-05 4/10 63/9703
13 Neoplastic Cell Transformation 1.127724e-02 3/10 139/9703
26 Enteritis 1.127724e-02 1/10 1/9703
37 Inflammatory Bowel Diseases 1.127724e-02 2/10 35/9703
75 West Nile Fever 1.127724e-02 1/10 1/9703
126 Encephalitis, West Nile Fever 1.127724e-02 1/10 1/9703
127 West Nile Fever Meningitis 1.127724e-02 1/10 1/9703
128 West Nile Fever Meningoencephalitis 1.127724e-02 1/10 1/9703
129 West Nile Fever Myelitis 1.127724e-02 1/10 1/9703
148 Deep seated dermatophytosis 1.127724e-02 1/10 1/9703
150 Chronic Lymphoproliferative Disorder of NK-Cells 1.127724e-02 1/10 1/9703
159 Medullary cystic kidney disease 1 1.127724e-02 1/10 1/9703
166 DIABETES MELLITUS, INSULIN-DEPENDENT, 22 (disorder) 1.127724e-02 1/10 1/9703
168 Neutropenia and hyperlymphocytosis with large granular lymphocytes 1.127724e-02 1/10 1/9703
170 Hyper-Ige Recurrent Infection Syndrome, Autosomal Dominant 1.127724e-02 1/10 1/9703
175 AUTOIMMUNE DISEASE, MULTISYSTEM, INFANTILE-ONSET, 1 1.127724e-02 1/10 1/9703
185 HYPER-IgE RECURRENT INFECTION SYNDROME 1, AUTOSOMAL DOMINANT 1.127724e-02 1/10 1/9703
157 Visceral myopathy familial external ophthalmoplegia 1.742037e-02 1/10 2/9703
158 Candidiasis, Familial, 2 1.742037e-02 1/10 2/9703
162 T-Cell Large Granular Lymphocyte Leukemia 1.742037e-02 1/10 2/9703
167 MITOCHONDRIAL DNA DEPLETION SYNDROME 5 (ENCEPHALOMYOPATHIC WITH OR WITHOUT METHYLMALONIC ACIDURIA) 1.742037e-02 1/10 2/9703
177 Mitochondrial DNA Depletion Syndrome 1 1.742037e-02 1/10 2/9703
49 Malignant neoplasm of stomach 2.052163e-02 3/10 300/9703
74 Stomach Neoplasms 2.052163e-02 3/10 297/9703
135 MITOCHONDRIAL NEUROGASTROINTESTINAL ENCEPHALOPATHY SYNDROME 2.052163e-02 1/10 3/9703
154 Hereditary Diffuse Gastric Cancer 2.052163e-02 3/10 293/9703
164 Hyper-Immunoglobulin E Syndrome, Autosomal Recessive 2.052163e-02 1/10 3/9703
169 Hyper-Immunoglobulin E Syndrome, Autosomal Dominant 2.052163e-02 1/10 3/9703
94 Ki-1+ Anaplastic Large Cell Lymphoma 2.552619e-02 1/10 4/9703
174 Job Syndrome 2.552619e-02 1/10 4/9703
62 Pancreatic Neoplasm 2.691484e-02 2/10 100/9703
111 Malignant neoplasm of pancreas 2.710265e-02 2/10 102/9703
43 Leukemia, T-Cell 2.871301e-02 1/10 5/9703
65 Precancerous Conditions 2.871301e-02 2/10 110/9703
106 Condition, Preneoplastic 2.871301e-02 2/10 110/9703
36 Inflammation 3.616923e-02 2/10 127/9703
156 DIABETES MELLITUS, PERMANENT NEONATAL 3.616923e-02 1/10 7/9703
9 Carcinoma 4.264589e-02 2/10 164/9703
10 Malignant tumor of colon 4.264589e-02 2/10 159/9703
18 Colonic Neoplasms 4.264589e-02 2/10 152/9703
59 Nephritis 4.264589e-02 1/10 9/9703
63 Peritoneal Neoplasms 4.264589e-02 1/10 10/9703
73 Ankylosing spondylitis 4.264589e-02 1/10 11/9703
88 Anaplastic carcinoma 4.264589e-02 2/10 163/9703
89 Carcinoma, Spindle-Cell 4.264589e-02 2/10 163/9703
90 Undifferentiated carcinoma 4.264589e-02 2/10 163/9703
91 Carcinomatosis 4.264589e-02 2/10 163/9703
102 Leukoencephalopathy 4.264589e-02 1/10 11/9703
107 Atrophic 4.264589e-02 1/10 10/9703
112 Carcinomatosis of peritoneal cavity 4.264589e-02 1/10 10/9703
160 Copper-Overload Cirrhosis 4.264589e-02 1/10 11/9703
41 Precursor B-Cell Lymphoblastic Leukemia-Lymphoma 4.401635e-02 1/10 12/9703
Digestive
Number of cTWAS Genes in Tissue Group: 33UBE2W gene(s) from the input list not found in DisGeNET CURATEDRP11-386E5.1 gene(s) from the input list not found in DisGeNET CURATEDADAM15 gene(s) from the input list not found in DisGeNET CURATEDRNF186 gene(s) from the input list not found in DisGeNET CURATEDRP11-973H7.1 gene(s) from the input list not found in DisGeNET CURATEDRGS14 gene(s) from the input list not found in DisGeNET CURATEDRP11-542M13.2 gene(s) from the input list not found in DisGeNET CURATEDCASC3 gene(s) from the input list not found in DisGeNET CURATEDPOM121C gene(s) from the input list not found in DisGeNET CURATEDZGLP1 gene(s) from the input list not found in DisGeNET CURATEDLINC01126 gene(s) from the input list not found in DisGeNET CURATEDOSER1 gene(s) from the input list not found in DisGeNET CURATED Description FDR Ratio BgRatio
15 Ulcerative Colitis 3.106228e-05 5/21 63/9703
35 Inflammatory Bowel Diseases 6.839248e-05 4/21 35/9703
4 Rheumatoid Arthritis 2.641598e-02 4/21 174/9703
25 Enteritis 3.030303e-02 1/21 1/9703
129 Deep seated dermatophytosis 3.030303e-02 1/21 1/9703
141 Inflammatory Bowel Disease 10 3.030303e-02 1/21 1/9703
144 MICROVASCULAR COMPLICATIONS OF DIABETES, SUSCEPTIBILITY TO, 7 (finding) 3.030303e-02 1/21 1/9703
150 CUTIS LAXA, AUTOSOMAL RECESSIVE, TYPE IB 3.030303e-02 1/21 1/9703
157 IMMUNODEFICIENCY 32A 3.030303e-02 1/21 1/9703
159 IMMUNODEFICIENCY 28 3.030303e-02 1/21 1/9703
160 IMMUNODEFICIENCY 32B 3.030303e-02 1/21 1/9703
161 MITOCHONDRIAL DNA DEPLETION SYNDROME 15 (HEPATOCEREBRAL TYPE) 3.030303e-02 1/21 1/9703
78 Variegate Porphyria 3.632615e-02 1/21 2/9703
92 Cutis Laxa, Autosomal Recessive, Type I 3.632615e-02 1/21 2/9703
108 Cutis laxa, recessive, type I 3.632615e-02 1/21 2/9703
139 Visceral myopathy familial external ophthalmoplegia 3.632615e-02 1/21 2/9703
140 Candidiasis, Familial, 2 3.632615e-02 1/21 2/9703
146 MITOCHONDRIAL DNA DEPLETION SYNDROME 5 (ENCEPHALOMYOPATHIC WITH OR WITHOUT METHYLMALONIC ACIDURIA) 3.632615e-02 1/21 2/9703
149 Porphyria, South African type 3.632615e-02 1/21 2/9703
163 Mitochondrial DNA Depletion Syndrome 1 3.632615e-02 1/21 2/9703
122 MITOCHONDRIAL NEUROGASTROINTESTINAL ENCEPHALOPATHY SYNDROME 4.948461e-02 1/21 3/9703
152 HEMOCHROMATOSIS, TYPE 1 4.948461e-02 1/21 3/9703Gene sets curated by Macarthur Lab
gene_set_dir <- "/project2/mstephens/wcrouse/gene_sets/"
gene_set_files <- c("gwascatalog.tsv",
                    "mgi_essential.tsv",
                    "core_essentials_hart.tsv",
                    "clinvar_path_likelypath.tsv",
                    "fda_approved_drug_targets.tsv")

for (group in names(df_group)){
  cat(paste0(group, "\n\n"))

  ctwas_genes_group <- df_group[[group]]$ctwas
  background_group <- df_group[[group]]$background

  cat(paste0("Number of cTWAS Genes in Tissue Group: ", length(ctwas_genes_group), "\n\n"))

  gene_sets <- lapply(gene_set_files, function(x){as.character(read.table(paste0(gene_set_dir, x))[,1])})
  names(gene_sets) <- sapply(gene_set_files, function(x){unlist(strsplit(x, "[.]"))[1]})

  gene_lists <- list(ctwas_genes_group=ctwas_genes_group)

  #genes in gene_sets filtered to ensure inclusion in background
  gene_sets <- lapply(gene_sets, function(x){x[x %in% background_group]})

  #hypergeometric test
  hyp_score <- data.frame()
  size <- c()
  ngenes <- c()

  for (i in 1:length(gene_sets)) {
    for (j in 1:length(gene_lists)){
      group1 <- length(gene_sets[[i]])
      group2 <- length(as.vector(gene_lists[[j]]))
      size <- c(size, group1)
      Overlap <- length(intersect(gene_sets[[i]],as.vector(gene_lists[[j]])))
      ngenes <- c(ngenes, Overlap)
      Total <- length(background_group)
      hyp_score[i,j] <- phyper(Overlap-1, group2, Total-group2, group1,lower.tail=F)
    }
  }
  rownames(hyp_score) <- names(gene_sets)
  colnames(hyp_score) <- names(gene_lists)

  #multiple testing correction
  hyp_score_padj <- apply(hyp_score,2, p.adjust, method="BH", n=(nrow(hyp_score)*ncol(hyp_score)))
  hyp_score_padj <- as.data.frame(hyp_score_padj)
  hyp_score_padj$gene_set <- rownames(hyp_score_padj)
  hyp_score_padj$nset <- size
  hyp_score_padj$ngenes <- ngenes
  hyp_score_padj$percent <- ngenes/size

  hyp_score_padj <- hyp_score_padj[order(hyp_score_padj$ctwas_genes),]
  colnames(hyp_score_padj)[1] <- "padj"
  hyp_score_padj <- hyp_score_padj[,c(2:5,1)]
  rownames(hyp_score_padj)<- NULL

  print(hyp_score_padj)

  cat("\n")
}
Adipose
Number of cTWAS Genes in Tissue Group: 14
gene_set nset ngenes percent padj
1 gwascatalog 4577 11 0.002403321 0.001943028
2 mgi_essential 1715 3 0.001749271 0.371781664
3 fda_approved_drug_targets 258 1 0.003875969 0.371781664
4 clinvar_path_likelypath 2136 3 0.001404494 0.423320436
5 core_essentials_hart 207 0 0.000000000 1.000000000
Endocrine
Number of cTWAS Genes in Tissue Group: 24
gene_set nset ngenes percent padj
1 gwascatalog 5394 15 0.002780868 0.002753121
2 clinvar_path_likelypath 2486 5 0.002011263 0.502370257
3 mgi_essential 2020 3 0.001485149 0.802485503
4 core_essentials_hart 234 0 0.000000000 1.000000000
5 fda_approved_drug_targets 304 0 0.000000000 1.000000000
Cardiovascular
Number of cTWAS Genes in Tissue Group: 17
gene_set nset ngenes percent padj
1 mgi_essential 1971 5 0.002536783 0.1131356
2 fda_approved_drug_targets 287 2 0.006968641 0.1131356
3 clinvar_path_likelypath 2404 5 0.002079867 0.1534949
4 gwascatalog 5194 8 0.001540239 0.1720494
5 core_essentials_hart 242 0 0.000000000 1.0000000
CNS
Number of cTWAS Genes in Tissue Group: 30
gene_set nset ngenes percent padj
1 gwascatalog 5428 16 0.002947679 0.03703404
2 mgi_essential 2090 5 0.002392344 0.67874681
3 fda_approved_drug_targets 316 1 0.003164557 0.69246018
4 clinvar_path_likelypath 2530 4 0.001581028 0.79117446
5 core_essentials_hart 244 0 0.000000000 1.00000000
None
Number of cTWAS Genes in Tissue Group: 25
gene_set nset ngenes percent padj
1 gwascatalog 5633 15 0.002662879 0.009850268
2 clinvar_path_likelypath 2608 9 0.003450920 0.012660740
3 mgi_essential 2145 7 0.003263403 0.033063846
4 core_essentials_hart 255 1 0.003921569 0.365122621
5 fda_approved_drug_targets 323 0 0.000000000 1.000000000
Skin
Number of cTWAS Genes in Tissue Group: 18
gene_set nset ngenes percent padj
1 gwascatalog 5104 12 0.002351097 0.00821867
2 fda_approved_drug_targets 276 3 0.010869565 0.00821867
3 mgi_essential 1923 5 0.002600104 0.08875854
4 clinvar_path_likelypath 2341 3 0.001281504 0.61566657
5 core_essentials_hart 227 0 0.000000000 1.00000000
Blood or Immune
Number of cTWAS Genes in Tissue Group: 18
gene_set nset ngenes percent padj
1 gwascatalog 4762 10 0.002099958 0.09202987
2 fda_approved_drug_targets 255 2 0.007843137 0.09202987
3 clinvar_path_likelypath 2188 5 0.002285192 0.18296722
4 mgi_essential 1774 3 0.001691094 0.44992367
5 core_essentials_hart 217 0 0.000000000 1.00000000
Digestive
Number of cTWAS Genes in Tissue Group: 33
gene_set nset ngenes percent padj
1 gwascatalog 5398 22 0.004075584 0.0001346175
2 clinvar_path_likelypath 2489 8 0.003214142 0.1914989719
3 fda_approved_drug_targets 307 2 0.006514658 0.1914989719
4 mgi_essential 2053 6 0.002922552 0.2347261994
5 core_essentials_hart 243 0 0.000000000 1.0000000000Analysis of TWAS False Positives by Region
library(ggplot2)

pip_threshold <- 0.5

df_plot <- data.frame(Outcome=c("SNPs", "Genes", "Both", "Neither"), Frequency=rep(0,4))

for (i in 1:length(df)){
  gene_pips <- df[[i]]$gene_pips[df[[i]]$gene_pips$genename %in% df[[i]]$twas,,drop=F]
  gene_pips <- gene_pips[gene_pips$susie_pip < pip_threshold,,drop=F]

  region_pips <- df[[i]]$region_pips
  rownames(region_pips) <- region_pips$region

  gene_pips <- cbind(gene_pips, t(sapply(gene_pips$region_tag, function(x){unlist(region_pips[x,c("gene_pip", "snp_pip")])})))
  gene_pips$gene_pip <- gene_pips$gene_pip - gene_pips$susie_pip #subtract gene pip from region total to get combined pip for other genes in region

  df_plot$Frequency[df_plot$Outcome=="Neither"] <- df_plot$Frequency[df_plot$Outcome=="Neither"] + sum(gene_pips$gene_pip < 0.5 & gene_pips$snp_pip < 0.5)
  df_plot$Frequency[df_plot$Outcome=="Both"] <- df_plot$Frequency[df_plot$Outcome=="Both"] + sum(gene_pips$gene_pip > 0.5 & gene_pips$snp_pip > 0.5)
  df_plot$Frequency[df_plot$Outcome=="SNPs"] <- df_plot$Frequency[df_plot$Outcome=="SNPs"] + sum(gene_pips$gene_pip < 0.5 & gene_pips$snp_pip > 0.5)
  df_plot$Frequency[df_plot$Outcome=="Genes"] <- df_plot$Frequency[df_plot$Outcome=="Genes"] + sum(gene_pips$gene_pip > 0.5 & gene_pips$snp_pip < 0.5)
}

pie <- ggplot(df_plot, aes(x="", y=Frequency, fill=Outcome)) + geom_bar(width = 1, stat = "identity")
pie <- pie + coord_polar("y", start=0) + theme_minimal() + theme(axis.title.y=element_blank())
pie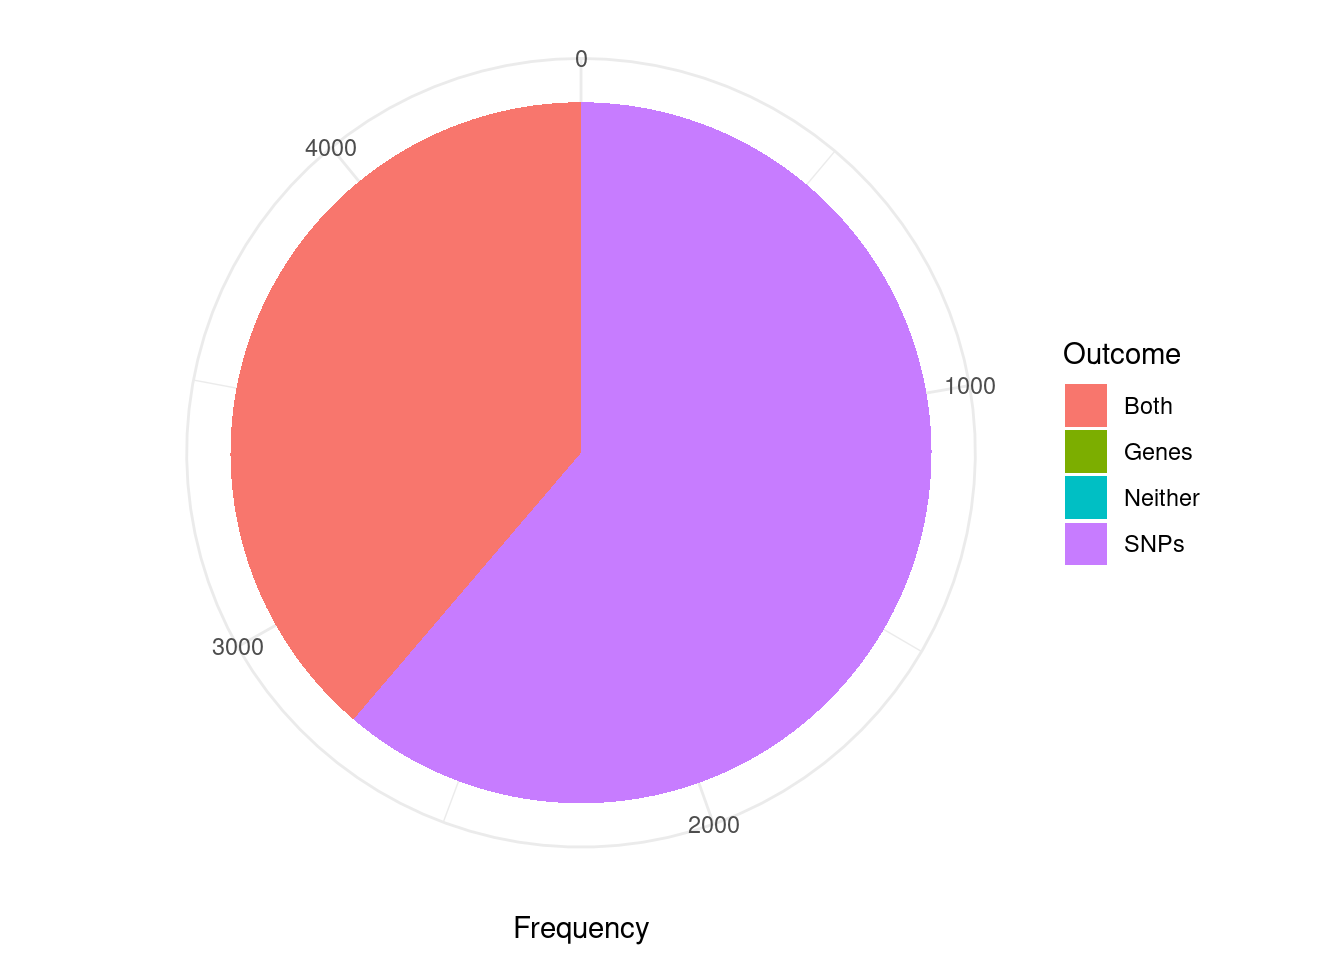
| Version | Author | Date |
|---|---|---|
| d46127d | wesleycrouse | 2022-05-24 |
Analysis of TWAS False Positives by Credible Set
cTWAS is using susie settings that mask credible sets consisting of variables with minimum pairwise correlations below a specified threshold. The default threshold is 0.5. I think this is intended to mask credible sets with “diffuse” support. As a consequence, many of the genes considered here (TWAS false positives; significant z score but low PIP) are not assigned to a credible set (have cs_index=0). For this reason, the first figure is not really appropriate for answering the question “are TWAS false positives due to SNPs or genes”.
The second figure includes only TWAS genes that are assigned to a reported causal set (i.e. they are in a “pure” causal set with high pairwise correlations). I think that this figure is closer to the intended analysis. However, it may be biased in some way because we have excluded many TWAS false positive genes that are in “impure” credible sets.
Some alternatives to these figures include the region-based analysis in the previous section; or re-analysis with lower/no minimum pairwise correlation threshold (“min_abs_corr” option in susie_get_cs) for reporting credible sets.
library(ggplot2)

####################
#using only genes assigned to a credible set

pip_threshold <- 0.5

df_plot <- data.frame(Outcome=c("SNPs", "Genes", "Both", "Neither"), Frequency=rep(0,4))

for (i in 1:length(df)){
  gene_pips <- df[[i]]$gene_pips[df[[i]]$gene_pips$genename %in% df[[i]]$twas,,drop=F]
  gene_pips <- gene_pips[gene_pips$susie_pip < pip_threshold,,drop=F]

  #exclude genes that are not assigned to a credible set, cs_index==0
  gene_pips <- gene_pips[as.numeric(sapply(gene_pips$region_cs_tag, function(x){rev(unlist(strsplit(x, "_")))[1]}))!=0,]

  region_cs_pips <- df[[i]]$region_cs_pips
  rownames(region_cs_pips) <- region_cs_pips$region_cs

  gene_pips <- cbind(gene_pips, t(sapply(gene_pips$region_cs_tag, function(x){unlist(region_cs_pips[x,c("gene_pip", "snp_pip")])})))
  gene_pips$gene_pip <- gene_pips$gene_pip - gene_pips$susie_pip #subtract gene pip from causal set total to get combined pip for other genes in causal set

  plot_cutoff <- 0.5

  df_plot$Frequency[df_plot$Outcome=="Neither"] <- df_plot$Frequency[df_plot$Outcome=="Neither"] + sum(gene_pips$gene_pip < plot_cutoff & gene_pips$snp_pip < plot_cutoff)
  df_plot$Frequency[df_plot$Outcome=="Both"] <- df_plot$Frequency[df_plot$Outcome=="Both"] + sum(gene_pips$gene_pip > plot_cutoff & gene_pips$snp_pip > plot_cutoff)
  df_plot$Frequency[df_plot$Outcome=="SNPs"] <- df_plot$Frequency[df_plot$Outcome=="SNPs"] + sum(gene_pips$gene_pip < plot_cutoff & gene_pips$snp_pip > plot_cutoff)
  df_plot$Frequency[df_plot$Outcome=="Genes"] <- df_plot$Frequency[df_plot$Outcome=="Genes"] + sum(gene_pips$gene_pip > plot_cutoff & gene_pips$snp_pip < plot_cutoff)
}

pie <- ggplot(df_plot, aes(x="", y=Frequency, fill=Outcome)) + geom_bar(width = 1, stat = "identity")
pie <- pie + coord_polar("y", start=0) + theme_minimal() + theme(axis.title.y=element_blank())
pie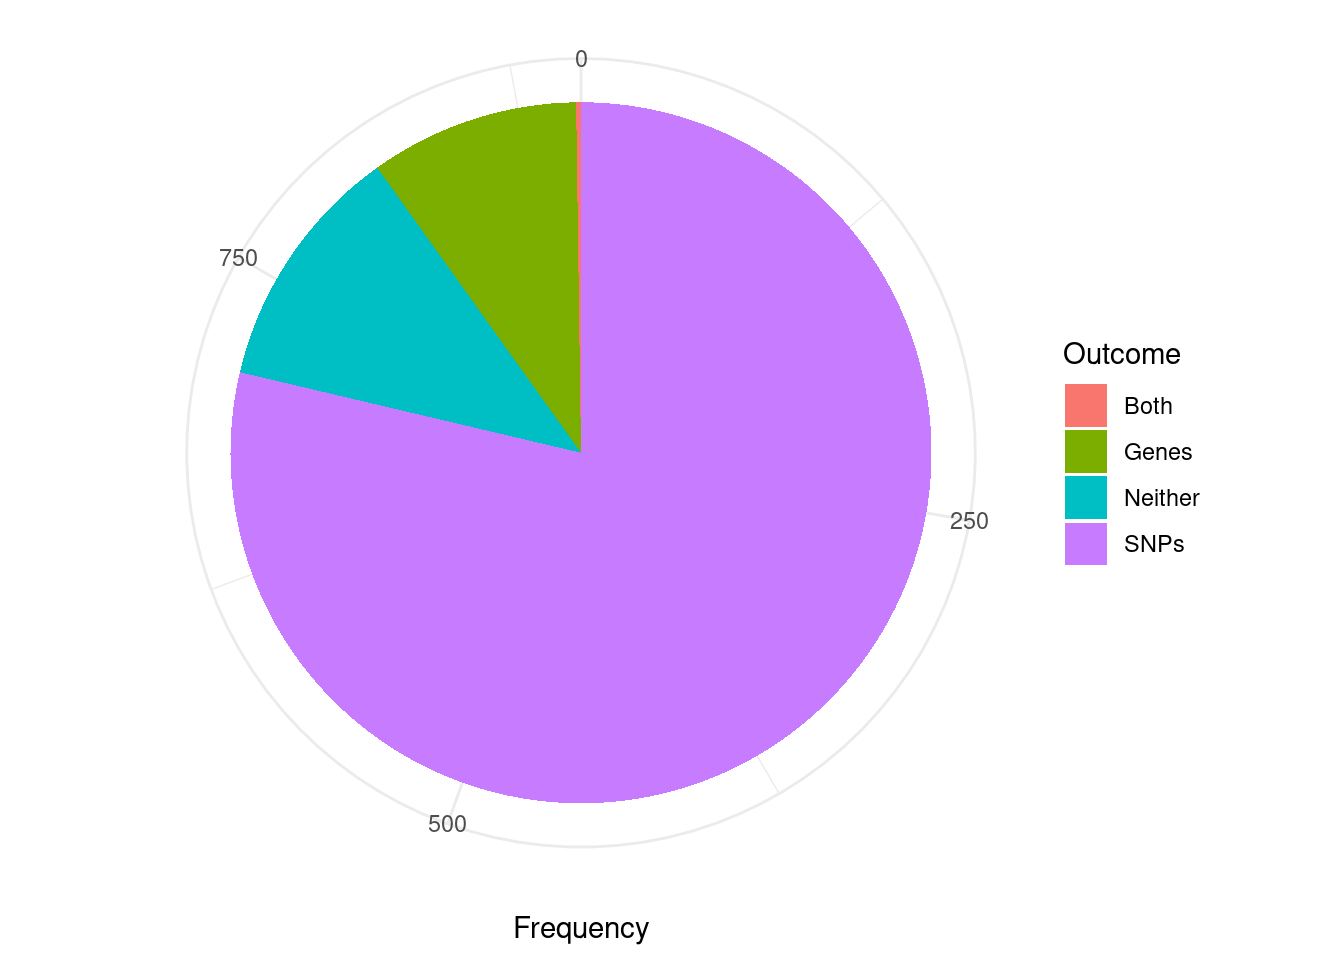
| Version | Author | Date |
|---|---|---|
| d46127d | wesleycrouse | 2022-05-24 |
cTWAS genes without genome-wide significant SNP nearby
novel_genes <- data.frame(genename=as.character(), weight=as.character(), susie_pip=as.numeric(), snp_maxz=as.numeric())

for (i in 1:length(df)){
  gene_pips <- df[[i]]$gene_pips[df[[i]]$gene_pips$genename %in% df[[i]]$ctwas,,drop=F]

  region_pips <- df[[i]]$region_pips
  rownames(region_pips) <- region_pips$region

  gene_pips <- cbind(gene_pips, sapply(gene_pips$region_tag, function(x){region_pips[x,"snp_maxz"]}))
  names(gene_pips)[ncol(gene_pips)] <- "snp_maxz"

  if (nrow(gene_pips)>0){
    gene_pips$weight <- names(df)[i]
    gene_pips <- gene_pips[gene_pips$snp_maxz < qnorm(1-(5E-8/2), lower=T),c("genename", "weight", "susie_pip", "snp_maxz")]

    novel_genes <- rbind(novel_genes, gene_pips)
  }
}

novel_genes_summary <- data.frame(genename=unique(novel_genes$genename))
novel_genes_summary$nweights <- sapply(novel_genes_summary$genename, function(x){length(novel_genes$weight[novel_genes$genename==x])})
novel_genes_summary$weights <- sapply(novel_genes_summary$genename, function(x){paste(novel_genes$weight[novel_genes$genename==x],collapse=", ")})

novel_genes_summary <- novel_genes_summary[order(-novel_genes_summary$nweights),]
novel_genes_summary[,c("genename","nweights")]
genename nweights
1 LSP1 18
5 CCL20 9
3 TYMP 6
4 EFEMP2 6
2 CDH24 4
21 RASA2 3
7 PRKD2 2
9 MAPK13 2
15 ITGAL 2
22 TMEM151B 2
6 RAB29 1
8 IFT172 1
10 LINC01700 1
11 AP006621.5 1
12 NEAT1 1
13 CPT1C 1
14 AC007383.3 1
16 NPEPPS 1
17 SH2D3A 1
18 HFE 1
19 POM121C 1
20 UBE2W 1
23 SLC2A3 1
24 CNKSR1 1
25 PSMA6 1
26 ANKRD55 1
27 TFAM 1
28 SIX5 1
29 SMPD1 1
30 GPR132 1
31 IRF3 1
32 CCR5 1
33 CPEB4 1
34 C10orf105 1
35 NPIPB3 1
36 BIK 1Tissue-specificity for cTWAS genes
gene_pips_by_weight <- data.frame(genename=as.character(ctwas_genes))

for (i in 1:length(df)){
  gene_pips <- df[[i]]$gene_pips
  gene_pips <- gene_pips[match(ctwas_genes, gene_pips$genename),,drop=F]

  gene_pips_by_weight <- cbind(gene_pips_by_weight, gene_pips$susie_pip)
  names(gene_pips_by_weight)[ncol(gene_pips_by_weight)] <- names(df)[i]
}

gene_pips_by_weight <- as.matrix(gene_pips_by_weight[,-1])
rownames(gene_pips_by_weight) <- ctwas_genes

#handing missing values
gene_pips_by_weight_bkup <- gene_pips_by_weight
gene_pips_by_weight[is.na(gene_pips_by_weight)] <- 0

#number of tissues with PIP>0.5 for cTWAS genes
ctwas_frequency <- rowSums(gene_pips_by_weight>0.5)
hist(ctwas_frequency, col="grey", breaks=0:max(ctwas_frequency), xlim=c(0,ncol(gene_pips_by_weight)),
     xlab="Number of Tissues with PIP>0.5",
     ylab="Number of cTWAS Genes",
     main="Tissue Specificity for cTWAS Genes")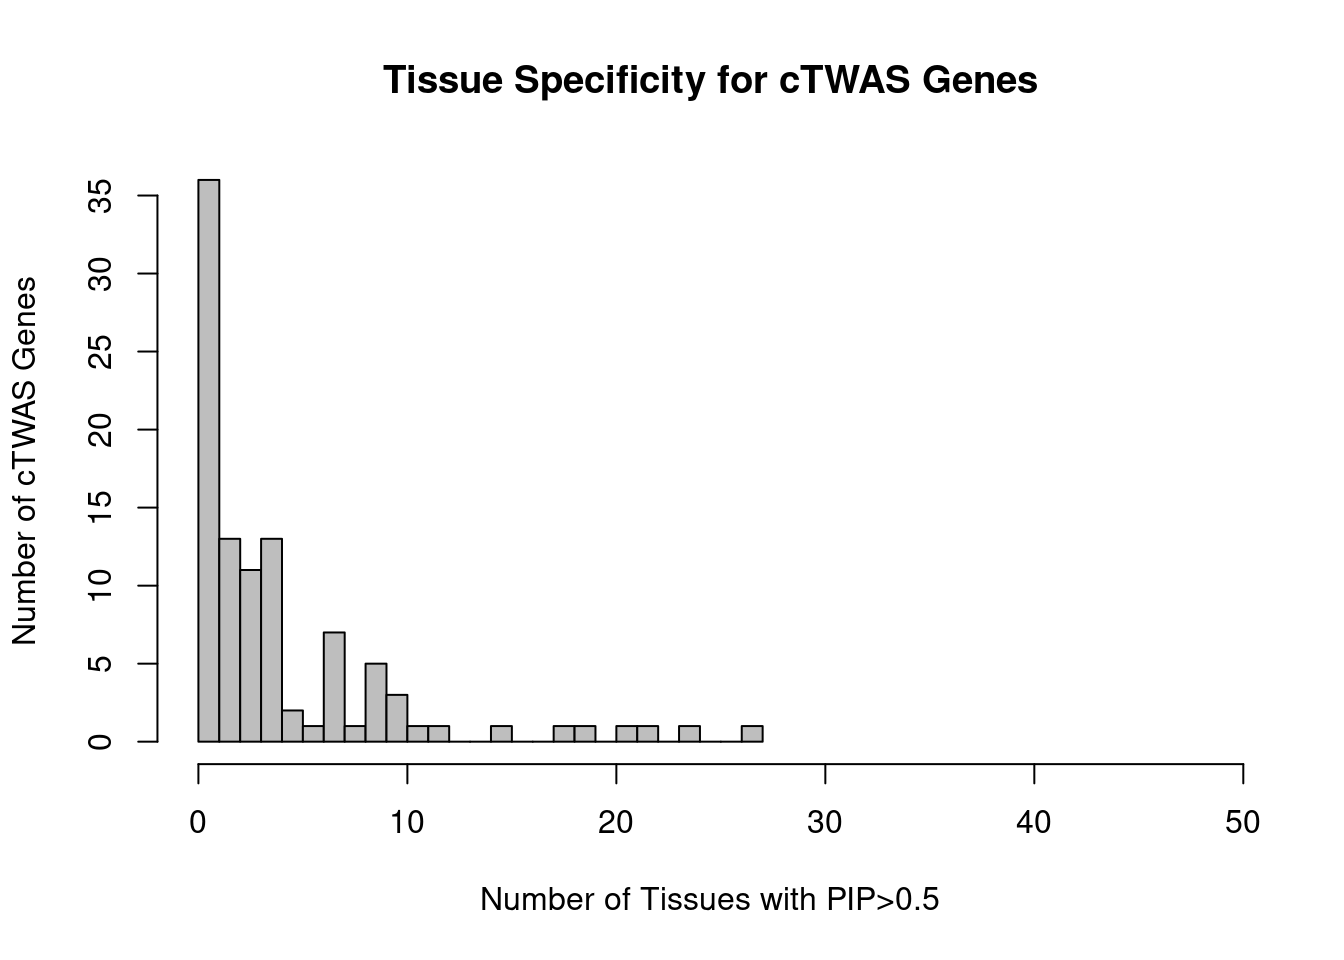
| Version | Author | Date |
|---|---|---|
| d46127d | wesleycrouse | 2022-05-24 |
#heatmap of gene PIPs
cluster_ctwas_genes <- hclust(dist(gene_pips_by_weight))
cluster_ctwas_weights <- hclust(dist(t(gene_pips_by_weight)))

plot(cluster_ctwas_weights, cex=0.6)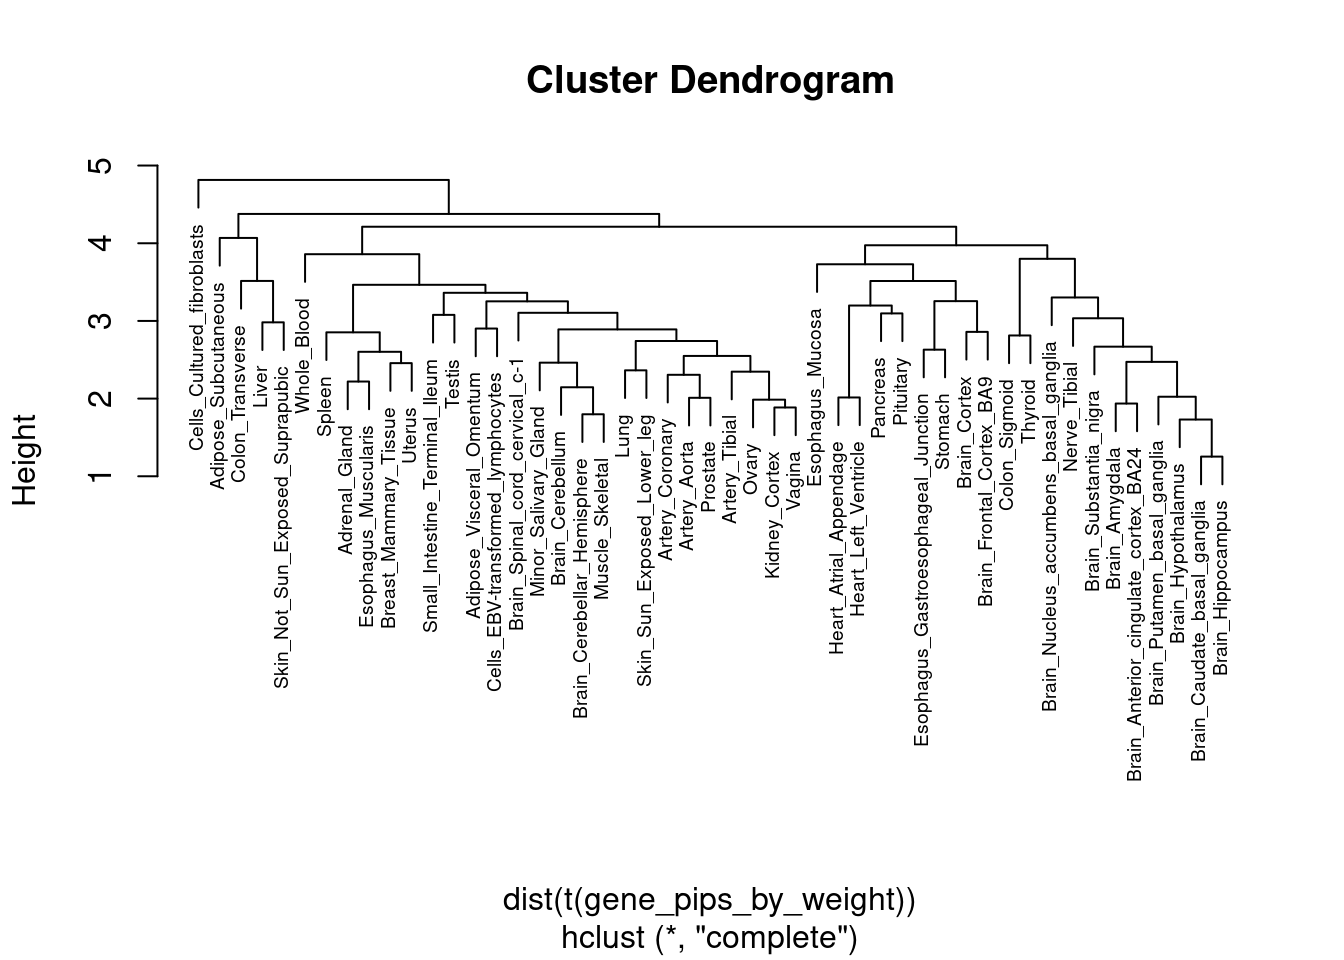
| Version | Author | Date |
|---|---|---|
| d46127d | wesleycrouse | 2022-05-24 |
plot(cluster_ctwas_genes, cex=0.6, labels=F)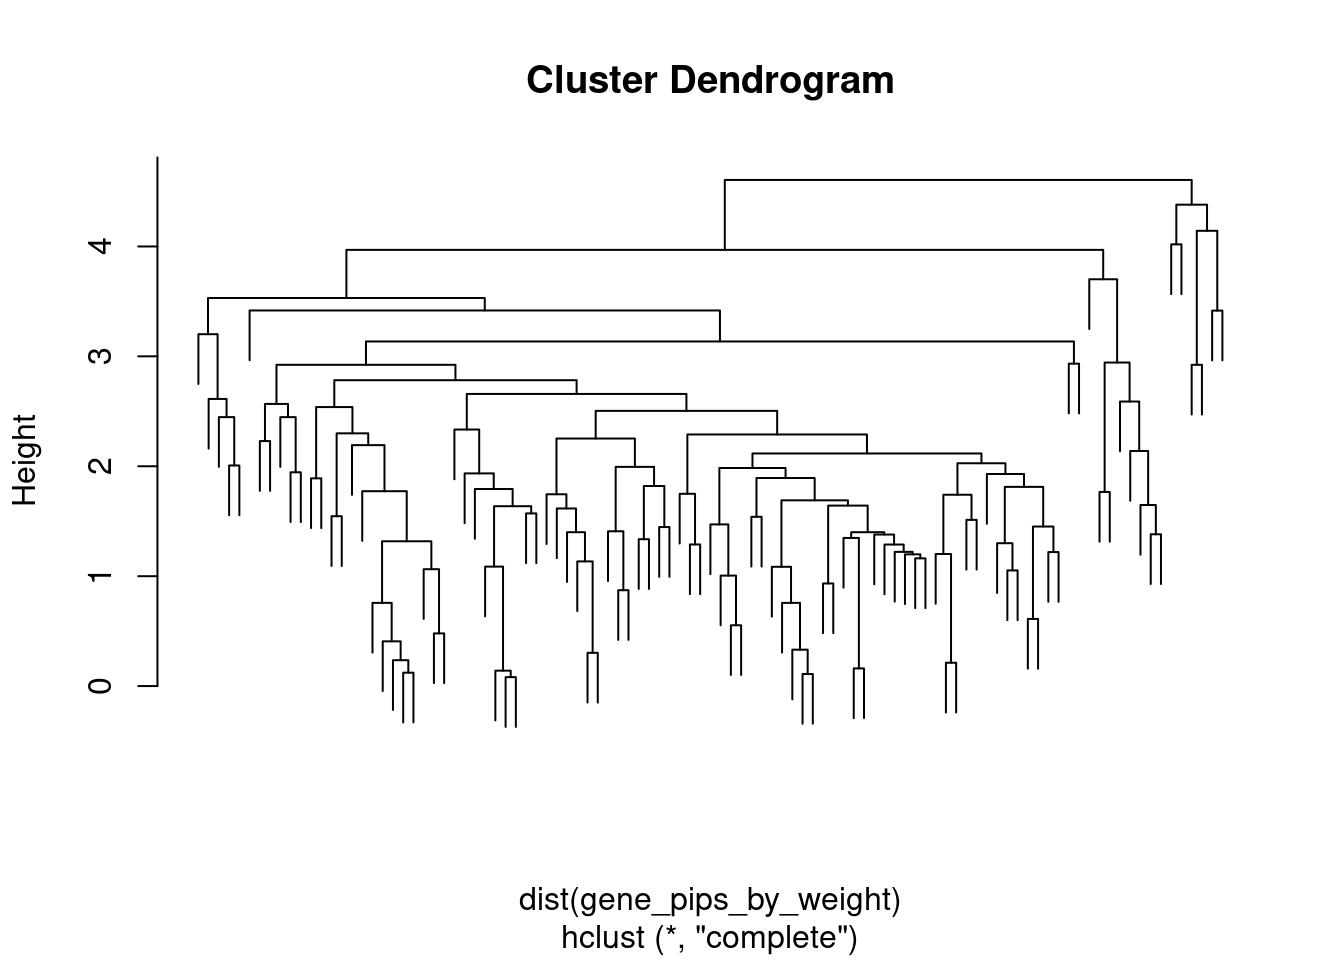
| Version | Author | Date |
|---|---|---|
| d46127d | wesleycrouse | 2022-05-24 |
par(mar=c(14.1, 4.1, 4.1, 2.1))

image(t(gene_pips_by_weight[rev(cluster_ctwas_genes$order),rev(cluster_ctwas_weights$order)]),
      axes=F)
mtext(text=colnames(gene_pips_by_weight)[cluster_ctwas_weights$order], side=1, line=0.3, at=seq(0,1,1/(ncol(gene_pips_by_weight)-1)), las=2, cex=0.8)
mtext(text=rownames(gene_pips_by_weight)[cluster_ctwas_genes$order], side=2, line=0.3, at=seq(0,1,1/(nrow(gene_pips_by_weight)-1)), las=1, cex=0.4)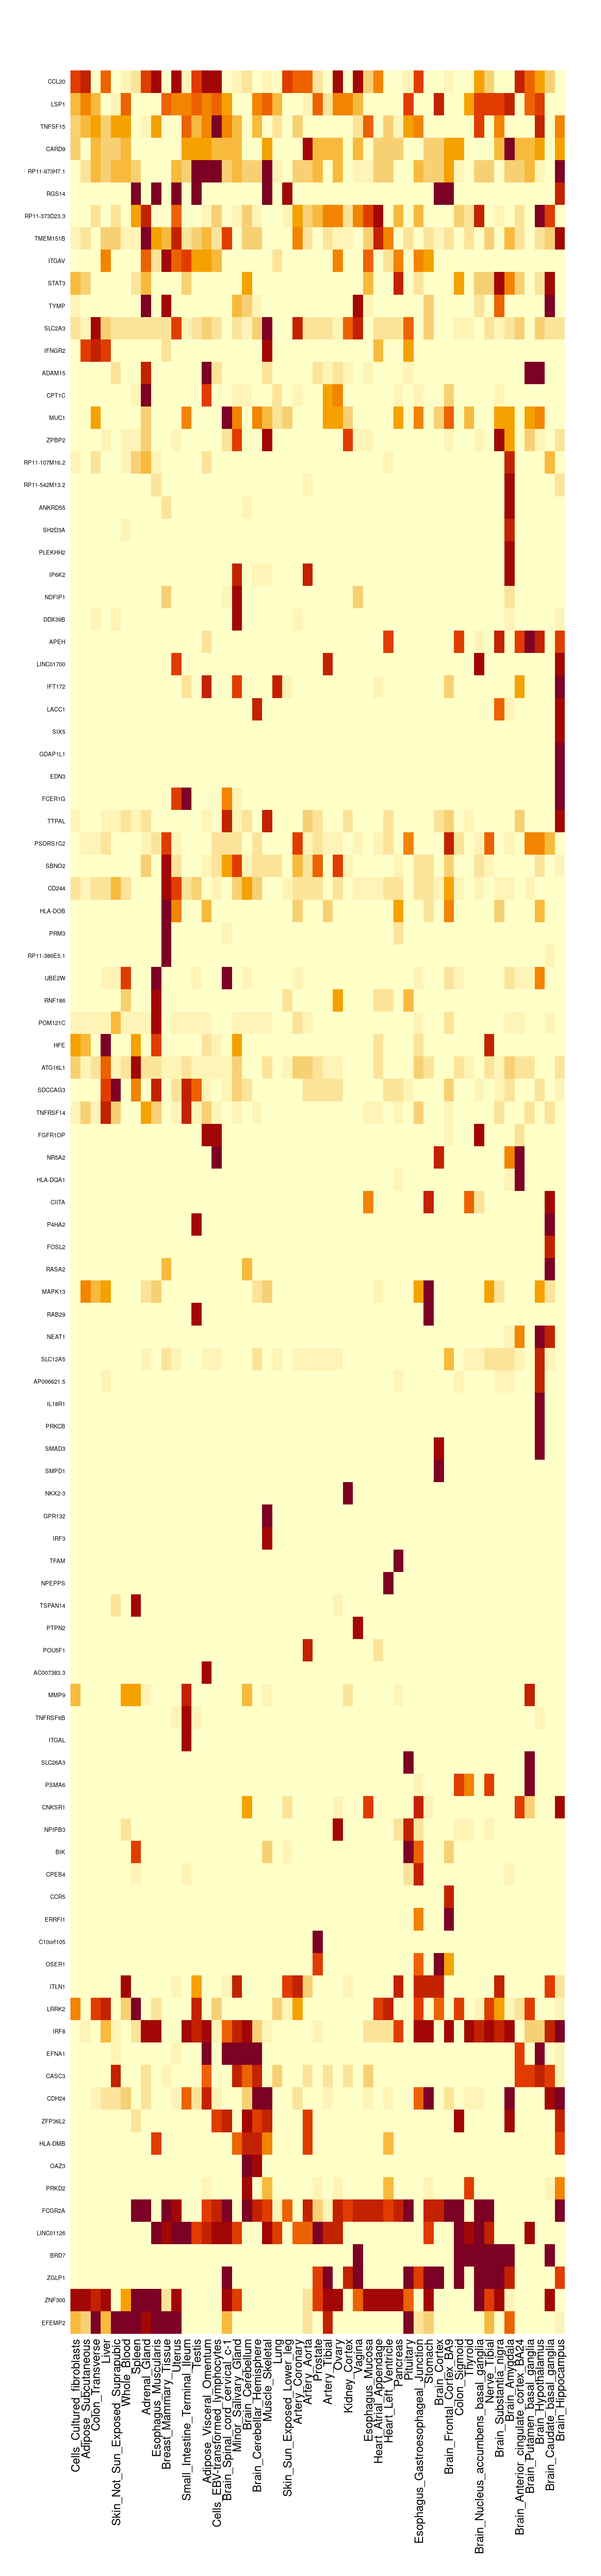
| Version | Author | Date |
|---|---|---|
| d46127d | wesleycrouse | 2022-05-24 |
cTWAS genes with highest proportion of total PIP on a single tissue
#genes with highest proportion of PIP on a single tissue
gene_pips_proportion <- gene_pips_by_weight/rowSums(gene_pips_by_weight)

proportion_table <- data.frame(genename=as.character(rownames(gene_pips_proportion)))
proportion_table$max_pip_prop <- apply(gene_pips_proportion,1,max)
proportion_table$max_weight <- colnames(gene_pips_proportion)[apply(gene_pips_proportion,1,which.max)]

proportion_table[order(-proportion_table$max_pip_prop),]
genename max_pip_prop max_weight
88 PRM3 1.00000000 Testis
75 PSORS1C2 0.99912599 Minor_Salivary_Gland
54 RNF186 0.99010027 Colon_Transverse
80 RP11-107M16.2 0.98383865 Prostate
46 POU5F1 0.96894746 Cells_Cultured_fibroblasts
82 HLA-DOB 0.95556214 Skin_Sun_Exposed_Lower_leg
26 TTPAL 0.87293590 Brain_Cerebellum
66 SBNO2 0.86923832 Esophagus_Mucosa
50 PTPN2 0.85170306 Cells_Cultured_fibroblasts
33 LINC01700 0.85001025 Brain_Frontal_Cortex_BA9
2 NR5A2 0.82097960 Adipose_Subcutaneous
58 UBE2W 0.78904742 Colon_Transverse
21 GDAP1L1 0.77044497 Artery_Tibial
65 CD244 0.73238985 Esophagus_Mucosa
86 SIX5 0.67548249 Stomach
74 EDN3 0.67499546 Lung
101 BIK 0.65734109 Whole_Blood
44 AC007383.3 0.63156694 Cells_Cultured_fibroblasts
85 RP11-542M13.2 0.62549033 Small_Intestine_Terminal_Ileum
98 CPEB4 0.57915881 Whole_Blood
40 FCER1G 0.56252559 Brain_Substantia_nigra
5 HLA-DQA1 0.54298198 Adipose_Subcutaneous
94 SMAD3 0.53203705 Thyroid
81 P4HA2 0.52934716 Skin_Not_Sun_Exposed_Suprapubic
29 IFT172 0.52436496 Brain_Frontal_Cortex_BA9
83 ANKRD55 0.51404750 Small_Intestine_Terminal_Ileum
55 RP11-386E5.1 0.50698837 Colon_Transverse
69 TMEM151B 0.47633177 Heart_Left_Ventricle
97 CCR5 0.47624600 Whole_Blood
14 SDCCAG3 0.46846815 Adipose_Visceral_Omentum
6 FGFR1OP 0.46622401 Adipose_Subcutaneous
92 SMPD1 0.43625598 Thyroid
57 POM121C 0.40715318 Colon_Transverse
77 CNKSR1 0.37067244 Pancreas
53 SH2D3A 0.36838701 Cells_EBV-transformed_lymphocytes
96 ERRFI1 0.35900000 Whole_Blood
39 APEH 0.35231467 Brain_Spinal_cord_cervical_c-1
89 ZPBP2 0.34054965 Testis
4 ATG16L1 0.33826576 Colon_Transverse
72 DDX39B 0.32253987 Liver
78 PSMA6 0.31245659 Pancreas
100 NPIPB3 0.30621659 Whole_Blood
62 FOSL2 0.28395500 Skin_Not_Sun_Exposed_Suprapubic
35 IL18R1 0.27959536 Brain_Nucleus_accumbens_basal_ganglia
10 CIITA 0.27426590 Adipose_Subcutaneous
31 TSPAN14 0.25891793 Cells_Cultured_fibroblasts
17 IP6K2 0.25824594 Artery_Coronary
38 PLEKHH2 0.25231357 Brain_Spinal_cord_cervical_c-1
99 C10orf105 0.24850850 Whole_Blood
47 ITGAL 0.24327349 Cells_Cultured_fibroblasts
71 RP11-373D23.3 0.23466872 Heart_Left_Ventricle
91 NKX2-3 0.22950818 Thyroid
52 TNFRSF6B 0.21534833 Cells_Cultured_fibroblasts
63 RASA2 0.21267603 Stomach
51 MMP9 0.20905872 Cells_Cultured_fibroblasts
76 LRRK2 0.20680187 Nerve_Tibial
32 LACC1 0.19356375 Brain_Frontal_Cortex_BA9
56 HFE 0.18790302 Colon_Transverse
37 PRKCB 0.17905643 Brain_Nucleus_accumbens_basal_ganglia
45 NDFIP1 0.17626326 Cells_Cultured_fibroblasts
12 TNFRSF14 0.17367878 Adipose_Visceral_Omentum
36 AP006621.5 0.16988780 Brain_Nucleus_accumbens_basal_ganglia
59 IRF8 0.16813125 Colon_Transverse
64 EFNA1 0.16569943 Esophagus_Mucosa
16 SLC12A5 0.16150185 Brain_Putamen_basal_ganglia
73 SLC26A3 0.15931422 Liver
49 NPEPPS 0.14480804 Cells_Cultured_fibroblasts
9 CDH24 0.14396658 Nerve_Tibial
68 ITGAV 0.14268342 Heart_Atrial_Appendage
30 MAPK13 0.13725716 Brain_Frontal_Cortex_BA9
61 IFNGR2 0.13574671 Heart_Left_Ventricle
67 OSER1 0.13302821 Esophagus_Mucosa
3 ZFP36L2 0.11957361 Spleen
48 STAT3 0.11862299 Whole_Blood
7 CARD9 0.11835621 Spleen
90 HLA-DMB 0.11132169 Thyroid
95 IRF3 0.11095081 Thyroid
27 FCGR2A 0.10990043 Testis
41 NEAT1 0.10829763 Brain_Substantia_nigra
24 RAB29 0.10719310 Brain_Anterior_cingulate_cortex_BA24
93 GPR132 0.10466427 Thyroid
79 ITLN1 0.09977309 Pituitary
70 SLC2A3 0.09691692 Heart_Atrial_Appendage
22 MUC1 0.09518066 Brain_Amygdala
84 TFAM 0.09157407 Small_Intestine_Terminal_Ileum
11 TYMP 0.08930805 Esophagus_Mucosa
42 CPT1C 0.08393114 Brain_Substantia_nigra
60 ZGLP1 0.08304385 Esophagus_Gastroesophageal_Junction
43 OAZ3 0.08176613 Nerve_Tibial
34 CASC3 0.08167219 Esophagus_Mucosa
20 BRD7 0.07781185 Whole_Blood
25 PRKD2 0.07679669 Colon_Transverse
23 CCL20 0.07609604 Brain_Nucleus_accumbens_basal_ganglia
13 TNFSF15 0.07429497 Esophagus_Muscularis
28 LINC01126 0.07019229 Esophagus_Mucosa
18 EFEMP2 0.05399909 Colon_Sigmoid
19 RP11-973H7.1 0.05382760 Prostate
1 ADAM15 0.05327216 Cells_Cultured_fibroblasts
87 ZNF300 0.05116333 Testis
8 LSP1 0.04313459 Brain_Substantia_nigra
15 RGS14 0.04103422 Heart_Left_VentricleGenes nearby and nearest to GWAS peaks
#####load positions for all genes on autosomes in ENSEMBL, subset to only protein coding and lncRNA with non-missing HGNC symbol
# library(biomaRt)
#
# ensembl <- useEnsembl(biomart="ENSEMBL_MART_ENSEMBL", dataset="hsapiens_gene_ensembl")
# G_list <- getBM(filters= "chromosome_name", attributes= c("hgnc_symbol","chromosome_name","start_position","end_position","gene_biotype", "ensembl_gene_id"), values=1:22, mart=ensembl)
#
# save(G_list, file=paste0("G_list_", trait_id, ".RData"))
load(paste0("G_list_", trait_id, ".RData"))

G_list <- G_list[G_list$gene_biotype %in% c("protein_coding","lncRNA"),]

#####load z scores from the analysis and add positions from the LD reference
results_dir <- results_dirs[1]
weight <- rev(unlist(strsplit(results_dir, "/")))[1]
analysis_id <- paste(trait_id, weight, sep="_")

load(paste0(results_dir, "/", analysis_id, "_expr_z_snp.Rd"))

# LDR_dir <- "/project2/mstephens/wcrouse/UKB_LDR_0.1/"
# LDR_files <- list.files(LDR_dir)
# LDR_files <- LDR_files[grep(".Rvar" ,LDR_files)]
#
# z_snp$chrom <- as.integer(NA)
# z_snp$pos <- as.integer(NA)
#
# for (i in 1:length(LDR_files)){
#   print(i)
#
#   LDR_info <- read.table(paste0(LDR_dir, LDR_files[i]), header=T)
#   z_snp_index <- which(z_snp$id %in% LDR_info$id)
#   z_snp[z_snp_index,c("chrom", "pos")] <- t(sapply(z_snp_index, function(x){unlist(LDR_info[match(z_snp$id[x], LDR_info$id),c("chrom", "pos")])}))
# }
#
# z_snp <- z_snp[,c("id", "z", "chrom","pos")]
# save(z_snp, file=paste0("z_snp_pos_", trait_id, ".RData"))
load(paste0("z_snp_pos_", trait_id, ".RData"))

####################
#identify genes within 500kb of genome-wide significant variant ("nearby")
G_list$nearby <- NA

window_size <- 500000

for (chr in 1:22){
  #index genes on chromosome
  G_list_index <- which(G_list$chromosome_name==chr)

  #subset z_snp to chromosome, then subset to significant genome-wide significant variants
  z_snp_chr <- z_snp[z_snp$chrom==chr,,drop=F]
  z_snp_chr <- z_snp_chr[abs(z_snp_chr$z)>qnorm(1-(5E-8/2), lower=T),,drop=F]

  #iterate over genes on chromsome and check if a genome-wide significant SNP is within the window
  for (i in G_list_index){
    window_start <- G_list$start_position[i] - window_size
    window_end <- G_list$end_position[i] + window_size
    G_list$nearby[i] <- any(z_snp_chr$pos>=window_start & z_snp_chr$pos<=window_end)
  }
}

####################
#identify genes that are nearest to lead genome-wide significant variant ("nearest")
G_list$nearest <- F
G_list$distance <- Inf

window_size <- 500000

for (chr in 1:22){
  #index genes on chromosome
  G_list_index <- which(G_list$chromosome_name==chr & G_list$gene_biotype=="protein_coding")

  #subset z_snp to chromosome, then subset to significant genome-wide significant variants
  z_snp_chr <- z_snp[z_snp$chrom==chr,,drop=F]
  z_snp_chr <- z_snp_chr[abs(z_snp_chr$z)>qnorm(1-(5E-8/2), lower=T),,drop=F]

  while (nrow(z_snp_chr)>0){
    lead_index <- which.max(abs(z_snp_chr$z))
    lead_position <- z_snp_chr$pos[lead_index]

    distances <- sapply(G_list_index, function(i){
      if (lead_position >= G_list$start_position[i] & lead_position <= G_list$end_position[i]){
        distance <- 0
      } else {
        distance <- min(abs(G_list$start_position[i] - lead_position), abs(G_list$end_position[i] - lead_position))
      }
      distance
    })

    min_distance <- min(distances)

    G_list$nearest[G_list_index[distances==min_distance]] <- T

    update_index <- which(G_list$distance[G_list_index] > distances)
    G_list$distance[G_list_index][update_index] <- distances[update_index]

    window_start <- lead_position - window_size
    window_end <- lead_position + window_size
    z_snp_chr <- z_snp_chr[!(z_snp_chr$pos>=window_start & z_snp_chr$pos<=window_end),,drop=F]
  }
}

G_list$distance[G_list$distance==Inf] <- NA

#report number of GWAS peaks
sum(G_list$nearest)
[1] 139Enrichment analysis using known IBD genes from ABC paper
known_genes <- data.table::fread("nasser_2021_ABC_IBD_genes.txt")
known_genes <- unique(known_genes$KnownGene)

# dbs <- c("GO_Biological_Process_2021")
# GO_enrichment <- enrichr(known_genes, dbs)
#
# for (db in dbs){
#   cat(paste0(db, "\n\n"))
#   enrich_results <- GO_enrichment[[db]]
#   enrich_results <- enrich_results[enrich_results$Adjusted.P.value<0.05,c("Term", "Overlap", "Adjusted.P.value", "Genes")]
#   print(enrich_results)
#   print(plotEnrich(GO_enrichment[[db]]))
# }
#
# save(enrich_results, file="ABC_IBD_genes_enrichment.RData")
# write.csv(enrich_results, file="ABC_IBD_genes_enrichment.csv")

enrich_results <- as.data.frame(data.table::fread("ABC_IBD_genes_enrichment.csv"))

#report number of known IBD genes in annotations
length(known_genes)
[1] 26Summary table for selected tissue groups
#mapping genename to ensembl
genename_mapping <- data.frame(genename=as.character(), ensembl_id=as.character(), weight=as.character())

for (i in 1:length(results_dirs)){
  results_dir <- results_dirs[i]
  weight <- rev(unlist(strsplit(results_dir, "/")))[1]
  analysis_id <- paste(trait_id, weight, sep="_")

  sqlite <- RSQLite::dbDriver("SQLite")
  db = RSQLite::dbConnect(sqlite, paste0("/project2/compbio/predictdb/mashr_models/mashr_", weight, ".db"))
  query <- function(...) RSQLite::dbGetQuery(db, ...)
  gene_info <- query("select gene, genename, gene_type from extra")
  RSQLite::dbDisconnect(db)

  genename_mapping <- rbind(genename_mapping, cbind(gene_info[,c("gene","genename")],weight))
}

genename_mapping <- genename_mapping[,c("gene","genename"),drop=F]
genename_mapping <- genename_mapping[!duplicated(genename_mapping),]
selected_groups <- c("Blood or Immune", "Digestive")
selected_genes <- unique(unlist(sapply(df_group[selected_groups], function(x){x$ctwas})))
weight_groups <- weight_groups[order(weight_groups$group),]
selected_weights <- weight_groups$weight[weight_groups$group %in% selected_groups]
gene_pips_by_weight <- gene_pips_by_weight_bkup
results_table <- as.data.frame(round(gene_pips_by_weight[selected_genes,selected_weights],3))
results_table$n_discovered <- apply(results_table>0.8,1,sum,na.rm=T)
results_table$n_imputed <- apply(results_table, 1, function(x){sum(!is.na(x))-1})
results_table$ensembl_gene_id <- genename_mapping$gene[sapply(rownames(results_table), match, table=genename_mapping$genename)]
results_table$ensembl_gene_id <- sapply(results_table$ensembl_gene_id, function(x){unlist(strsplit(x, "[.]"))[1]})
results_table <- cbind(results_table, G_list[sapply(results_table$ensembl_gene_id, match, table=G_list$ensembl_gene_id),c("chromosome_name","start_position","end_position","nearby","nearest")])
results_table$known <- rownames(results_table) %in% known_genes
load("group_enrichment_results.RData")
group_enrichment_results$group <- as.character(group_enrichment_results$group)
group_enrichment_results$db <- as.character(group_enrichment_results$db)
group_enrichment_results <- group_enrichment_results[group_enrichment_results$group %in% selected_groups,,drop=F]
results_table$enriched_terms <- sapply(rownames(results_table), function(x){paste(group_enrichment_results$Term[grep(x, group_enrichment_results$Genes)],collapse="; ")})
write.csv(results_table, file=paste0("summary_table_inflammatory_bowel_disease.csv"))Overlap of enrichment analysis
#collect GO terms for selected genes
db <- "GO_Biological_Process_2021"
GO_enrichment <- enrichr(selected_genes, db)
Uploading data to Enrichr... Done.
Querying GO_Biological_Process_2021... Done.
Parsing results... Done.enrich_results_selected_genes <- GO_enrichment[[db]]
load("ABC_IBD_genes_enrichment.RData")
enrich_results_known_genes <- enrich_results
overlap_table <- as.data.frame(matrix(F, nrow(enrich_results_known_genes), length(selected_genes)))
overlap_table <- cbind(enrich_results_known_genes$Term, overlap_table)
colnames(overlap_table) <- c("Term", selected_genes)
for (i in 1:nrow(overlap_table)){
Term <- overlap_table$Term[i]
if (Term %in% enrich_results_selected_genes$Term){
Term_genes <- enrich_results_selected_genes$Genes[enrich_results_selected_genes$Term==Term]
overlap_table[i, unlist(strsplit(Term_genes, ";"))] <- T
}
}
write.csv(overlap_table, file="GO_overlap_inflammatory_bowel_disease.csv")Results and figures for the paper
Gene expression explains a small proportion of heritability
Note that the published MESC results in Yao et al. analyzed the same traits from Finucane 2015, which used ulcerative colitis summary statistics from Jostin’s 2012. We used more recent results from de Lange 2017. MESC also used prediction models from GTEx v7 while we used prediction models from GTEx v8.
Trend lines are fit with (red) and without (blue) an intercept.
library(ggrepel)

mesc_results <- as.data.frame(readxl::read_xlsx("MESC_published_results.xlsx", sheet="Table S4", skip=1))
mesc_results <- mesc_results[mesc_results$Trait %in% "Ulcerative Colitis",]
rownames(mesc_results) <- mesc_results$`Expression score tissue`
mesc_results <- mesc_results[sapply(selected_weights, function(x){paste(unlist(strsplit(x,"_")),collapse=" ")}),]


output$pve_med <- output$pve_g / (output$pve_g + output$pve_s)
rownames(output) <- output$weight
df_plot <- output[selected_weights,]

df_plot <- data.frame(tissue=as.character(mesc_results$`Expression score tissue`),  mesc=as.numeric(mesc_results$`h2med/h2g`), ctwas=(df_plot$pve_med))

p <- ggplot(df_plot, aes(mesc, ctwas, label = tissue)) + geom_point(color = "blue", size=3)
p <- p + geom_text_repel() + labs(title = "Heritability Explained by Gene Expression in Tissues") + ylab("(Gene PVE) / (Total PVE) using cTWAS") + xlab("(h2med) / (h2g) using MESC")
p <- p + geom_abline(slope=1, intercept=0, linetype=3)
p <- p + xlim(0,0.2) + ylim(0,0.2)

fit <- lm(ctwas~0+mesc, data=df_plot)
p <- p + geom_abline(slope=summary(fit)$coefficients["mesc","Estimate"], intercept=0, linetype=2, color="blue")

fit <- lm(ctwas~mesc, data=df_plot)
p <- p + geom_abline(slope=summary(fit)$coefficients["mesc","Estimate"], intercept=summary(fit)$coefficients["(Intercept)","Estimate"], linetype=3, color="red")

p <- p + theme_bw()

p

#report correlation between cTWAS and MESC
cor(df_plot$mesc, df_plot$ctwas)
cTWAS finds fewer genes than TWAS
Trend lines are fit with (red) and without (blue) an intercept.
library(ggrepel)

df_plot <- output
#df_plot <- df_plot[selected_weights,,drop=F]
df_plot$tissue <- sapply(df_plot$weight, function(x){paste(unlist(strsplit(x,"_")),collapse=" ")})

p <- ggplot(df_plot, aes(n_twas, n_ctwas, label = tissue)) + geom_point(color = "blue", size=3)
p <- p + geom_text_repel(size=3) + labs(title = "Number of Genes Discovered using cTWAS and TWAS by Tissue") + ylab("Number of cTWAS genes") + xlab("Number of TWAS genes")
p <- p + scale_y_continuous(breaks=seq(0,max(df_plot$n_ctwas),2))
p <- p + scale_x_continuous(breaks=seq(0,max(df_plot$n_twas),5))
p <- p + theme_bw()

fit <- lm(n_ctwas~0+n_twas, data=df_plot)
p <- p + geom_abline(slope=summary(fit)$coefficients["n_twas","Estimate"], intercept=0, linetype=2, color="blue")

p
Warning: ggrepel: 6 unlabeled data points (too many overlaps). Consider increasing max.overlaps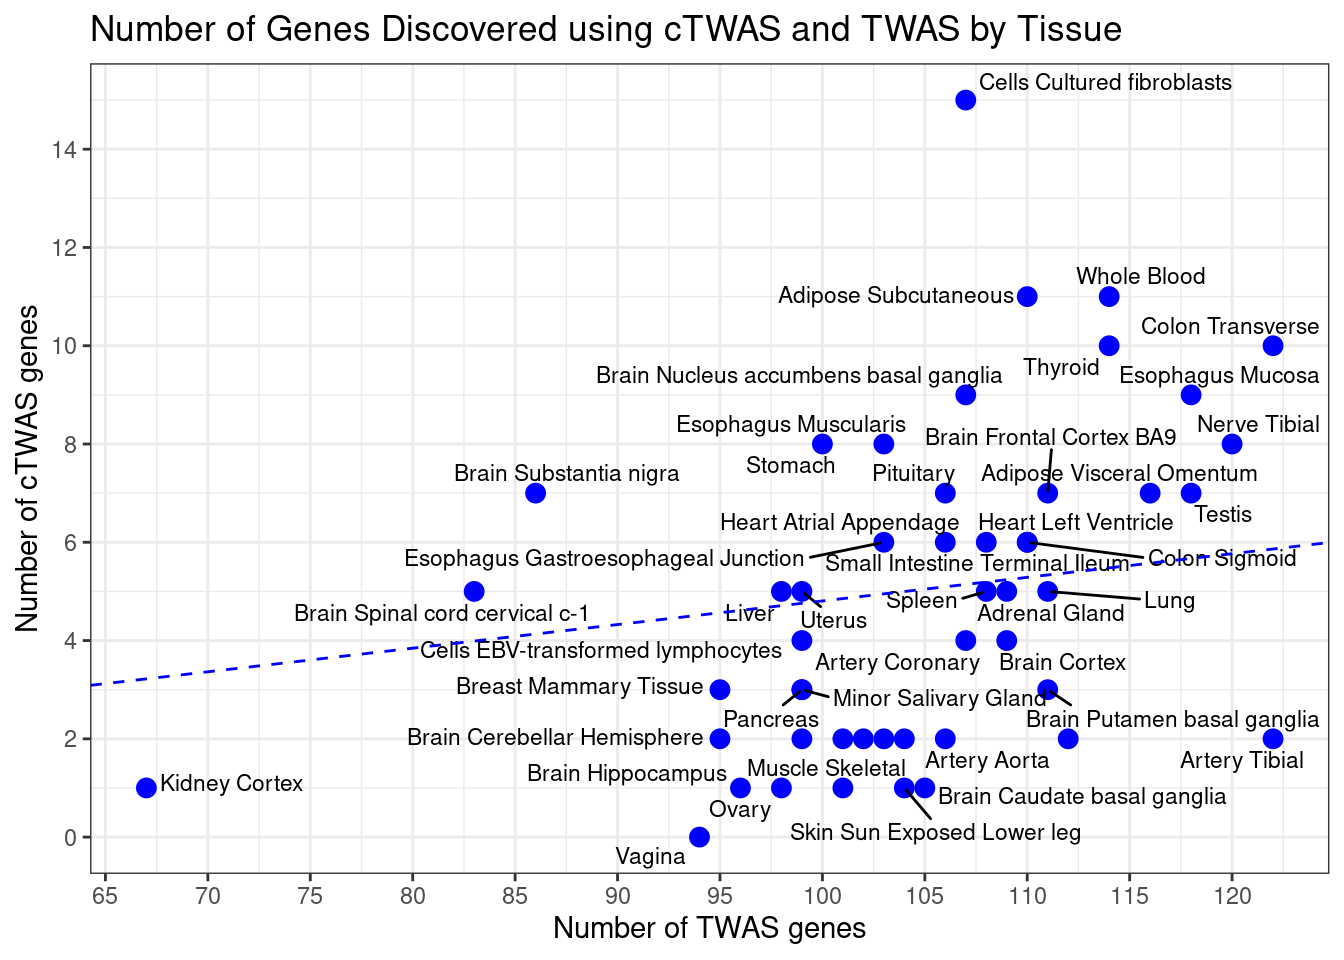
#report correlation between cTWAS and TWAS
cor(df_plot$n_ctwas, df_plot$n_twas)
[1] 0.4285577####################
#using cutpoint for number of ctwas and twas genes to determine which tissues to label
df_plot <- output
df_plot$tissue <- sapply(df_plot$weight, function(x){paste(unlist(strsplit(x,"_")),collapse=" ")})
df_plot$tissue[df_plot$n_ctwas < 7.5 & df_plot$n_twas < 115] <- ""
p <- ggplot(df_plot, aes(n_twas, n_ctwas, label = tissue)) + geom_point(color = "blue", size=3)
p <- p + geom_text_repel(size=3) + labs(title = "Number of Genes Discovered using cTWAS and TWAS by Tissue") + ylab("Number of cTWAS genes") + xlab("Number of TWAS genes")
p <- p + scale_y_continuous(breaks=seq(0,max(df_plot$n_ctwas),2))
p <- p + scale_x_continuous(breaks=seq(0,max(df_plot$n_twas),5))
p <- p + theme_bw()
fit <- lm(n_ctwas~0+n_twas, data=df_plot)
p <- p + geom_abline(slope=summary(fit)$coefficients["n_twas","Estimate"], intercept=0, linetype=2, color="blue")
p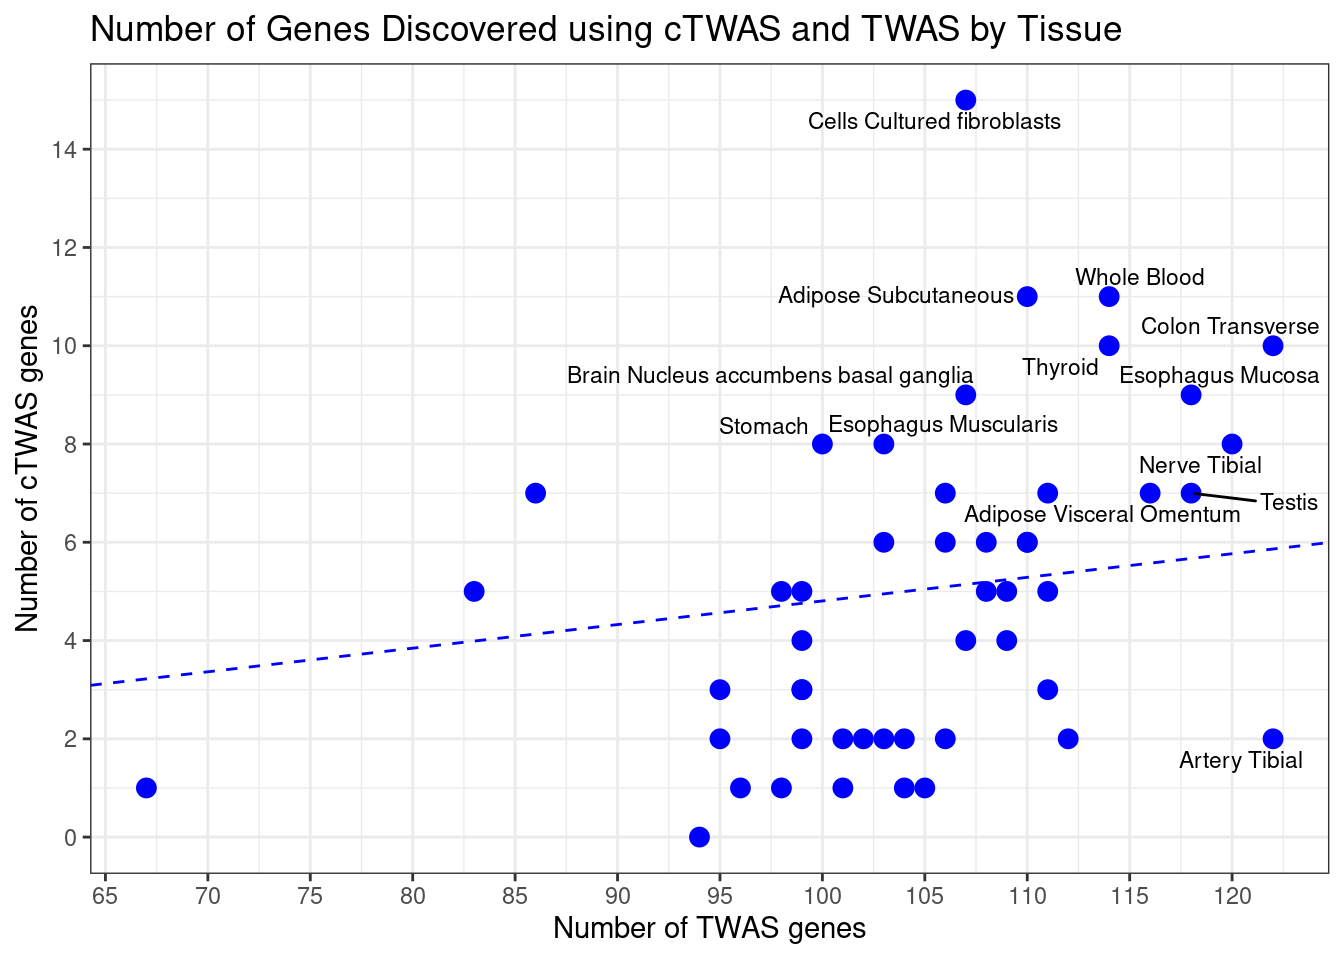
####################
#only labeling genes in "Blood or Immune" or "Digestive" groups

df_plot <- output
df_plot$tissue <- sapply(df_plot$weight, function(x){paste(unlist(strsplit(x,"_")),collapse=" ")})

df_plot[!(df_plot$weight %in% selected_weights),"tissue"] <- ""

p <- ggplot(df_plot, aes(n_twas, n_ctwas, label = tissue)) + geom_point(color = "blue", size=3)
p <- p + geom_text_repel(size=3) + labs(title = "Number of Genes Discovered using cTWAS and TWAS by Tissue") + ylab("Number of cTWAS genes") + xlab("Number of TWAS genes")
p <- p + scale_y_continuous(breaks=seq(0,max(df_plot$n_ctwas),2))
p <- p + scale_x_continuous(breaks=seq(0,max(df_plot$n_twas),5))
p <- p + theme_bw()

fit <- lm(n_ctwas~0+n_twas, data=df_plot)
p <- p + geom_abline(slope=summary(fit)$coefficients["n_twas","Estimate"], intercept=0, linetype=2, color="blue")

p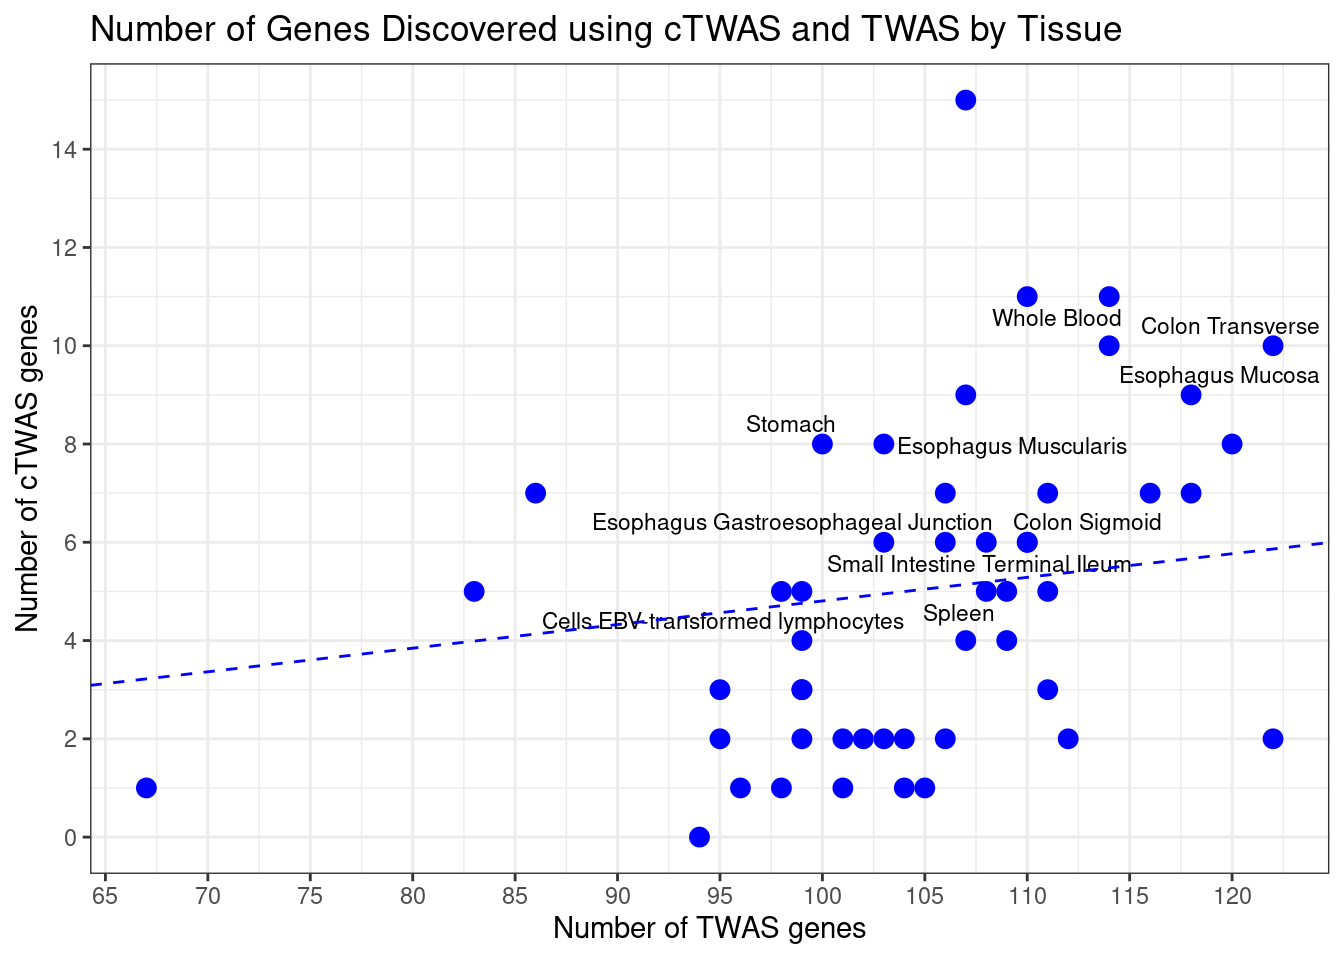
Most cTWAS genes were found in a small number of tissues
#number of tissues with PIP>0.5 for cTWAS genes
gene_pips_by_weight_bkup <- gene_pips_by_weight
gene_pips_by_weight[is.na(gene_pips_by_weight)] <- 0

#gene_pips_by_weight <- gene_pips_by_weight[,selected_weights,drop=F]

ctwas_frequency <- rowSums(gene_pips_by_weight>0.5)
hist(ctwas_frequency, col="grey", breaks=0:max(ctwas_frequency), xlim=c(0,ncol(gene_pips_by_weight)),
     xlab="Number of Tissues with PIP>0.5",
     ylab="Number of cTWAS Genes",
     main="Tissue Specificity for cTWAS Genes")
#report number of genes in each tissue bin
table(ctwas_frequency)
ctwas_frequency
1 2 3 4 5 6 7 8 9 10 11 12 15 18 19 21 22 24 27
36 13 11 13 2 1 7 1 5 3 1 1 1 1 1 1 1 1 1 Many cTWAS genes are novel
“Novel” is defined as 1) not in the silver standard, and 2) not the gene nearest to a genome-wide significant GWAS peak
#barplot of number of cTWAS genes in each tissue
output <- output[output$weight %in% selected_weights,,drop=F]
output <- output[order(-output$n_ctwas),,drop=F]

output$tissue <- sapply(output$weight, function(x){paste(unlist(strsplit(x,"_")),collapse=" ")})

par(mar=c(10.1, 4.1, 4.1, 2.1))
barplot(output$n_ctwas, names.arg=output$tissue, las=2, ylab="Number of cTWAS Genes", cex.names=0.6, main="Number of cTWAS Genes by Tissue")


results_table$novel <- !(results_table$nearest | results_table$known)
output$n_novel <- sapply(output$weight, function(x){sum(results_table[df[[x]]$ctwas,"novel"], na.rm=T)})

barplot(output$n_novel, names.arg=output$tissue, las=2, col="blue", add=T, xaxt='n', yaxt='n')

legend("topright",
       legend = c("Silver Standard or\nNearest to GWAS Peak", "Novel"),
       fill = c("grey", "blue"))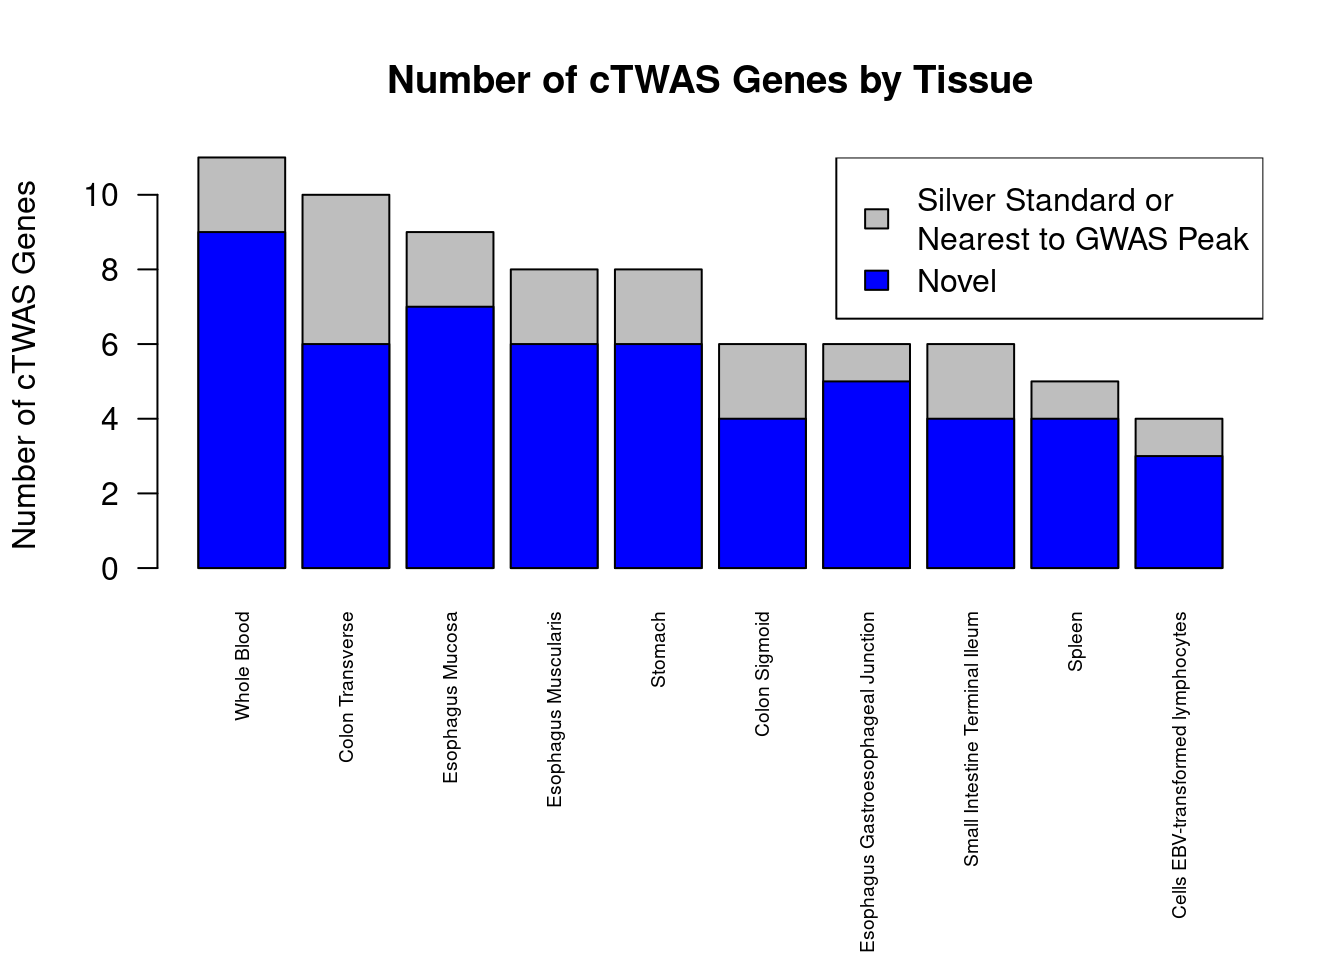
Summary table of results
selected_weights_whitespace <- sapply(selected_weights, function(x){paste(unlist(strsplit(x, "_")), collapse=" ")})

results_summary <- data.frame(genename=as.character(rownames(results_table)),
                              ensembl_gene_id=results_table$ensembl_gene_id,
                              gene_biotype=G_list$gene_biotype[sapply(results_table$ensembl_gene_id, match, table=G_list$ensembl_gene_id)],
                              chromosome=results_table$chromosome_name,
                              start_position=results_table$start_position,
                              max_pip_tissue=selected_weights_whitespace[apply(results_table[,selected_weights], 1, which.max)],
                              max_pip=apply(results_table[,selected_weights], 1, max, na.rm=T),
                              other_tissues_detected=apply(results_table[,selected_weights],1,function(x){paste(selected_weights_whitespace[which(x>0.8 & x!=max(x,na.rm=T))], collapse="; ")}),
                              nearby=results_table$nearby,
                              nearest=results_table$nearest,
                              distance=G_list$distance[sapply(results_table$ensembl_gene_id, match, table=G_list$ensembl_gene_id)],
                              known=results_table$known,
                              enriched_terms=results_table$enriched_terms)

results_summary <- results_summary[order(results_summary$chromosome, results_summary$start_position),]

write.csv(results_summary, file=paste0("results_summary_inflammatory_bowel_disease.csv"))
GO enrichment for genes in selected tissues
#enrichment for cTWAS genes using enrichR
library(enrichR)

dbs <- c("GO_Biological_Process_2021")

GO_enrichment <- enrichr(selected_genes, dbs)
Uploading data to Enrichr... Done.
Querying GO_Biological_Process_2021... Done.
Parsing results... Done.for (db in dbs){
cat(paste0(db, "\n\n"))
enrich_results <- GO_enrichment[[db]]
enrich_results <- enrich_results[enrich_results$Adjusted.P.value<0.05,c("Term", "Overlap", "Adjusted.P.value", "Genes")]
print(enrich_results)
print(plotEnrich(GO_enrichment[[db]]))
}GO_Biological_Process_2021
Term Overlap Adjusted.P.value Genes
1 cellular response to cytokine stimulus (GO:0071345) 8/482 0.006997841 MUC1;SBNO2;CCL20;IFNGR2;STAT3;IRF8;CCR5;ZFP36L2
2 regulation of DNA-templated transcription in response to stress (GO:0043620) 2/9 0.036445263 MUC1;RGS14
3 regulation of receptor binding (GO:1900120) 2/10 0.036445263 ADAM15;HFE
4 negative regulation of receptor binding (GO:1900121) 2/10 0.036445263 ADAM15;HFE
5 positive regulation of interleukin-8 production (GO:0032757) 3/61 0.046294558 STAT3;PRKD2;CD244
6 cytokine-mediated signaling pathway (GO:0019221) 7/621 0.048274103 MUC1;TNFSF15;CCL20;IFNGR2;STAT3;IRF8;CCR5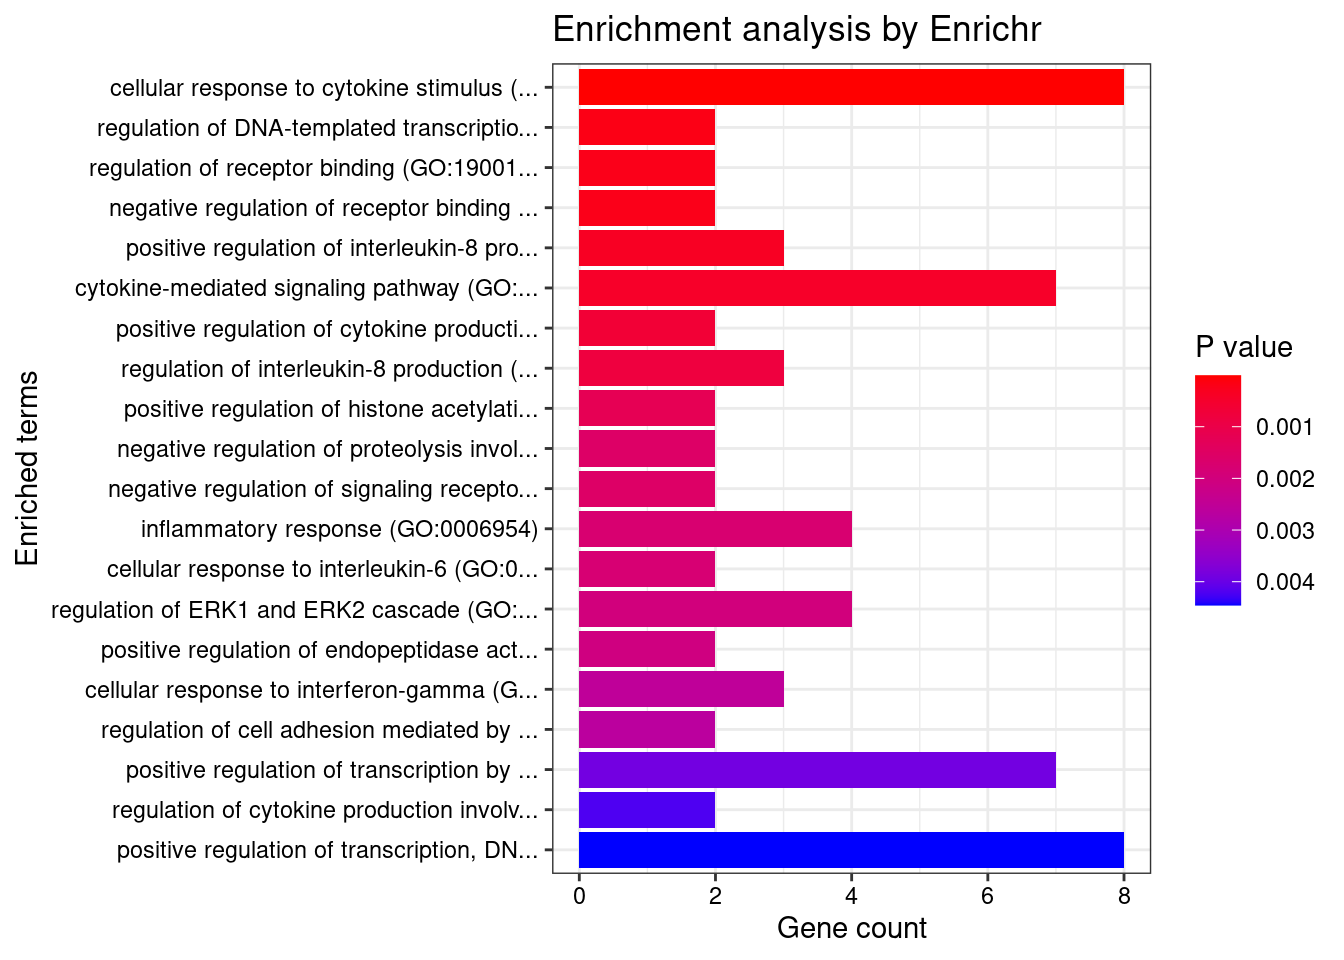
| Version | Author | Date |
|---|---|---|
| d46127d | wesleycrouse | 2022-05-24 |
Locus plots for HSPA6
locus_plot <- function(genename, tissue, plot_eqtl = T, label="cTWAS", xlim=NULL){
  results_dir <- results_dirs[grep(tissue, results_dirs)]
  weight <- rev(unlist(strsplit(results_dir, "/")))[1]
  analysis_id <- paste(trait_id, weight, sep="_")

  #load ctwas results
  ctwas_res <- data.table::fread(paste0(results_dir, "/", analysis_id, "_ctwas.susieIrss.txt"))

  #make unique identifier for regions and effects
  ctwas_res$region_tag <- paste(ctwas_res$region_tag1, ctwas_res$region_tag2, sep="_")
  ctwas_res$region_cs_tag <- paste(ctwas_res$region_tag, ctwas_res$cs_index, sep="_")

  #load z scores for SNPs
  load(paste0(results_dir, "/", analysis_id, "_expr_z_snp.Rd"))

  #separate gene and SNP results
  ctwas_gene_res <- ctwas_res[ctwas_res$type == "gene", ]
  ctwas_gene_res <- data.frame(ctwas_gene_res)
  ctwas_snp_res <- ctwas_res[ctwas_res$type == "SNP", ]
  ctwas_snp_res <- data.frame(ctwas_snp_res)

  #add gene information to results
  sqlite <- RSQLite::dbDriver("SQLite")
  db = RSQLite::dbConnect(sqlite, paste0("/project2/compbio/predictdb/mashr_models/mashr_", weight, ".db"))
  query <- function(...) RSQLite::dbGetQuery(db, ...)
  gene_info <- query("select gene, genename, gene_type from extra")
  RSQLite::dbDisconnect(db)

  ctwas_gene_res <- cbind(ctwas_gene_res, gene_info[sapply(ctwas_gene_res$id, match, gene_info$gene), c("genename", "gene_type")])

  #add z scores to results
  load(paste0(results_dir, "/", analysis_id, "_expr_z_gene.Rd"))
  ctwas_gene_res$z <- z_gene[ctwas_gene_res$id,]$z

  z_snp <- z_snp[z_snp$id %in% ctwas_snp_res$id,]
  ctwas_snp_res$z <- z_snp$z[match(ctwas_snp_res$id, z_snp$id)]

  #merge gene and snp results with added information
  ctwas_snp_res$genename=NA
  ctwas_snp_res$gene_type=NA

  ctwas_res <- rbind(ctwas_gene_res, ctwas_snp_res[,colnames(ctwas_gene_res)])

  region_tag <- ctwas_res$region_tag[which(ctwas_res$genename==genename)]

  region_tag1 <- unlist(strsplit(region_tag, "_"))[1]
  region_tag2 <- unlist(strsplit(region_tag, "_"))[2]

  a <- ctwas_res[ctwas_res$region_tag==region_tag,]

  rm(ctwas_res)

  regionlist <- readRDS(paste0(results_dir, "/", analysis_id, "_ctwas.regionlist.RDS"))
  region <- regionlist[[as.numeric(region_tag1)]][[region_tag2]]

  R_snp_info <- do.call(rbind, lapply(region$regRDS, function(x){data.table::fread(paste0(tools::file_path_sans_ext(x), ".Rvar"))}))

  a$pos[a$type=="gene"] <- G_list$start_position[match(sapply(a$id[a$type=="gene"], function(x){unlist(strsplit(x, "[.]"))[1]}) ,G_list$ensembl_gene_id)]
  a$pos <- a$pos/1000000

  if (!is.null(xlim)){
    if (is.na(xlim[1])){
      xlim[1] <- min(a$pos)
    }
    if (is.na(xlim[2])){
      xlim[2] <- max(a$pos)
    }
    a <- a[a$pos>=xlim[1] & a$pos<=xlim[2],,drop=F]
  }

  focus <- a$id[which(a$genename==genename)]
  a$iffocus <- as.numeric(a$id==focus)

  a$PVALUE <- (-log(2) - pnorm(abs(a$z), lower.tail=F, log.p=T))/log(10)

  R_gene <- readRDS(region$R_g_file)
  R_snp_gene <- readRDS(region$R_sg_file)
  R_snp <- as.matrix(Matrix::bdiag(lapply(region$regRDS, readRDS)))

  rownames(R_gene) <- region$gid
  colnames(R_gene) <- region$gid
  rownames(R_snp_gene) <- R_snp_info$id
  colnames(R_snp_gene) <- region$gid
  rownames(R_snp) <- R_snp_info$id
  colnames(R_snp) <- R_snp_info$id

  a$r2max <- NA

  a$r2max[a$type=="gene"] <- R_gene[focus,a$id[a$type=="gene"]]
  a$r2max[a$type=="SNP"] <- R_snp_gene[a$id[a$type=="SNP"],focus]

  r2cut <- 0.4
  colorsall <- c("#7fc97f", "#beaed4", "#fdc086")

  layout(matrix(1:2, ncol = 1), widths = 1, heights = c(1.5,1.5), respect = FALSE)
  par(mar = c(0, 4.1, 4.1, 2.1))

  plot(a$pos[a$type=="SNP"], a$PVALUE[a$type == "SNP"], pch = 21, xlab=paste0("Chromosome ", region_tag1, " position (Mb)"), frame.plot=FALSE, bg = colorsall[1], ylab = "-log10(p value)", panel.first = grid(), ylim =c(-(1/6)*max(a$PVALUE), max(a$PVALUE)*1.2), xaxt = 'n')

  points(a$pos[a$type=="SNP" & a$r2max > r2cut], a$PVALUE[a$type == "SNP"  & a$r2max > r2cut], pch = 21, bg = "purple")
  points(a$pos[a$type=="SNP" & a$iffocus == 1], a$PVALUE[a$type == "SNP" & a$iffocus == 1], pch = 21, bg = "salmon")
  points(a$pos[a$type=="gene"], a$PVALUE[a$type == "gene"], pch = 22, bg = colorsall[1], cex = 2)
  points(a$pos[a$type=="gene" & a$r2max > r2cut], a$PVALUE[a$type == "gene"  & a$r2max > r2cut], pch = 22, bg = "purple", cex = 2)
  points(a$pos[a$type=="gene" & a$iffocus == 1], a$PVALUE[a$type == "gene" & a$iffocus == 1], pch = 22, bg = "salmon", cex = 2)

  alpha=0.05
  abline(h=-log10(alpha/nrow(ctwas_gene_res)), col ="red", lty = 2)

  if (isTRUE(plot_eqtl)){
    for (cgene in a[a$type=="gene" & a$iffocus == 1, ]$id){
      load(paste0(results_dir, "/",analysis_id, "_expr_chr", region_tag1, ".exprqc.Rd"))
      eqtls <- rownames(wgtlist[[cgene]])
      points(a[a$id %in% eqtls,]$pos, rep( -(1/6)*max(a$PVALUE), nrow(a[a$id %in% eqtls,])), pch = "|", col = "salmon", cex = 1.5)
    }
  }

  if (label=="TWAS"){
    text(a$pos[a$id==focus], a$PVALUE[a$id==focus], labels=ctwas_gene_res$genename[ctwas_gene_res$id==focus], pos=3, cex=0.6)
  }

  par(mar = c(4.1, 4.1, 0.5, 2.1))

  plot(a$pos[a$type=="SNP"], a$PVALUE[a$type == "SNP"], pch = 19, xlab=paste0("Chromosome ", region_tag1, " position (Mb)"),frame.plot=FALSE, col = "white", ylim= c(0,1.1), ylab = "cTWAS PIP")

  grid()
  points(a$pos[a$type=="SNP"], a$susie_pip[a$type == "SNP"], pch = 21, xlab="Genomic position", bg = colorsall[1])
  points(a$pos[a$type=="SNP" & a$r2max > r2cut], a$susie_pip[a$type == "SNP"  & a$r2max >r2cut], pch = 21, bg = "purple")
  points(a$pos[a$type=="SNP" & a$iffocus == 1], a$susie_pip[a$type == "SNP" & a$iffocus == 1], pch = 21, bg = "salmon")
  points(a$pos[a$type=="gene"], a$susie_pip[a$type == "gene"], pch = 22, bg = colorsall[1], cex = 2)
  points(a$pos[a$type=="gene" & a$r2max > r2cut], a$susie_pip[a$type == "gene"  & a$r2max > r2cut], pch = 22, bg = "purple", cex = 2)
  points(a$pos[a$type=="gene" & a$iffocus == 1], a$susie_pip[a$type == "gene" & a$iffocus == 1], pch = 22, bg = "salmon", cex = 2)

  legend(max(a$pos)-0.2*(max(a$pos)-min(a$pos)), y= 1 ,c("Gene", "SNP","Lead TWAS Gene", "R2 > 0.4", "R2 <= 0.4"), pch = c(22,21,19,19,19), col = c("black", "black", "salmon", "purple", colorsall[1]), cex=0.7, title.adj = 0)

  if (label=="cTWAS"){
    text(a$pos[a$id==focus], a$susie_pip[a$id==focus], labels=ctwas_gene_res$genename[ctwas_gene_res$id==focus], pos=3, cex=0.6)
  }

  return(a)
}
genename <- "HSPA6"
tissue <- "Esophagus_Muscularis"
a <- locus_plot(genename, tissue, xlim=c(161.25, 161.75))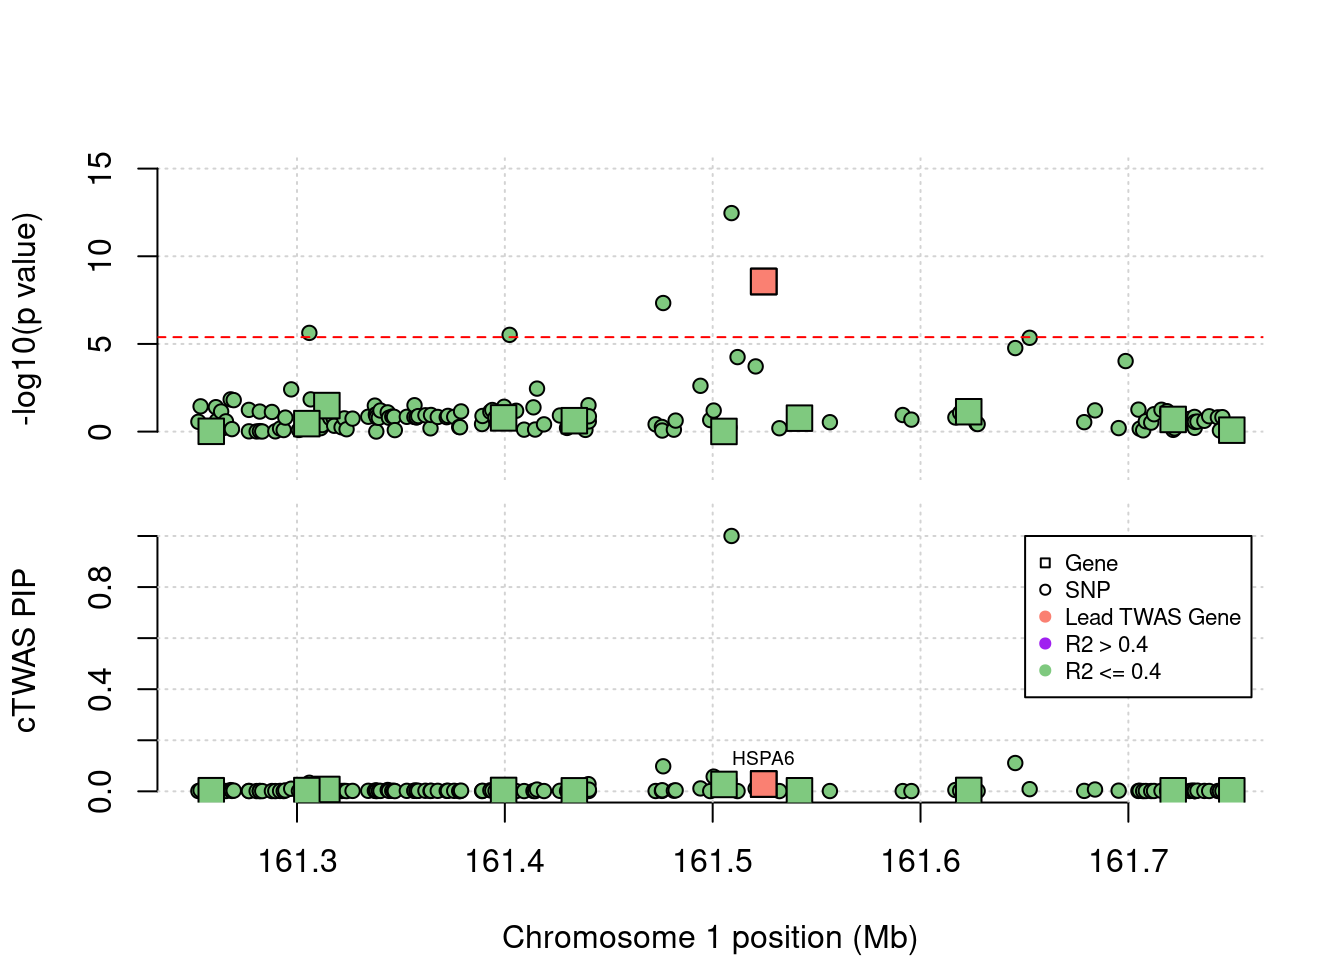
| Version | Author | Date |
|---|---|---|
| 1a96504 | wesleycrouse | 2022-05-24 |
#ctwas results
head(a[order(-a$susie_pip), c("chrom", "pos", "id", "genename", "type", "susie_pip", "PVALUE") ], 10)
chrom pos id genename type susie_pip PVALUE
33375 1 161.5091 rs4657041 <NA> SNP 0.99999649 12.462296
33391 1 161.6987 rs4656330 <NA> SNP 0.58713000 4.024233
33386 1 161.6456 rs12131017 <NA> SNP 0.11083863 4.765265
33368 1 161.4762 rs4638103 <NA> SNP 0.09802037 7.333641
33373 1 161.5005 rs111994823 <NA> SNP 0.05745979 1.201777
33374 1 161.5080 rs7518087 <NA> SNP 0.04331566 0.236473
33299 1 161.3059 rs34307129 <NA> SNP 0.03346644 5.630683
9640 1 161.5245 ENSG00000173110.7 HSPA6 gene 0.02860955 8.560449
33362 1 161.4402 rs113917836 <NA> SNP 0.02810565 1.505707
6140 1 161.5054 ENSG00000143226.13 FCGR2A gene 0.02707822 0.011447#nearest gene to GWAS peak
G_list[G_list$chromosome_name==unique(a$chrom) & G_list$start_position > min(a$pos*1000000) & G_list$end_position < max(a$pos*1000000),] hgnc_symbol chromosome_name start_position end_position gene_biotype ensembl_gene_id nearby nearest distance
1124 1 161403409 161470523 lncRNA ENSG00000283360 TRUE FALSE NA
2681 PCP4L1 1 161258745 161285450 protein_coding ENSG00000248485 TRUE FALSE 216918
2682 CFAP126 1 161364733 161367876 protein_coding ENSG00000188931 TRUE FALSE 134492
2684 1 161399409 161422424 lncRNA ENSG00000283696 TRUE FALSE NA
2685 1 161399998 161401868 lncRNA ENSG00000288093 TRUE FALSE NA
2689 1 161433444 161440996 lncRNA ENSG00000283317 TRUE FALSE NA
2724 MPZ 1 161304735 161309968 protein_coding ENSG00000158887 TRUE FALSE 192400
2951 1 161513176 161605099 lncRNA ENSG00000273112 TRUE FALSE NA
2952 HSPA6 1 161524540 161526894 protein_coding ENSG00000173110 TRUE FALSE 22172
2954 1 161556290 161557078 lncRNA ENSG00000224515 TRUE FALSE NA
2957 FCGR3B 1 161623196 161631963 protein_coding ENSG00000162747 TRUE FALSE 120828
2958 1 161671978 161674824 lncRNA ENSG00000234211 TRUE FALSE NA
2960 FCGR2A 1 161505430 161524013 protein_coding ENSG00000143226 TRUE TRUE 3062
3203 FCGR3A 1 161541759 161550737 protein_coding ENSG00000203747 TRUE FALSE 39391
3426 SDHC 1 161314381 161363206 protein_coding ENSG00000143252 TRUE FALSE 139162
3427 1 161368022 161371964 lncRNA ENSG00000288670 TRUE FALSE NA
3603 FCRLA 1 161706972 161714352 protein_coding ENSG00000132185 TRUE FALSE 204604
3604 FCRLB 1 161721563 161728143 protein_coding ENSG00000162746 TRUE FALSE 219195
5049 FCGR2B 1 161663143 161678654 protein_coding ENSG00000072694 TRUE FALSE 160775
5087 1 161518705 161519568 lncRNA ENSG00000289273 TRUE FALSE NA
5500 1 161364227 161364751 lncRNA ENSG00000289106 TRUE FALSE NA
5501 1 161389547 161389950 lncRNA ENSG00000289141 TRUE FALSE NA####################
#checking additional tissue
a <- locus_plot(genename, "Esophagus_Mucosa", xlim=c(161.25, 161.75))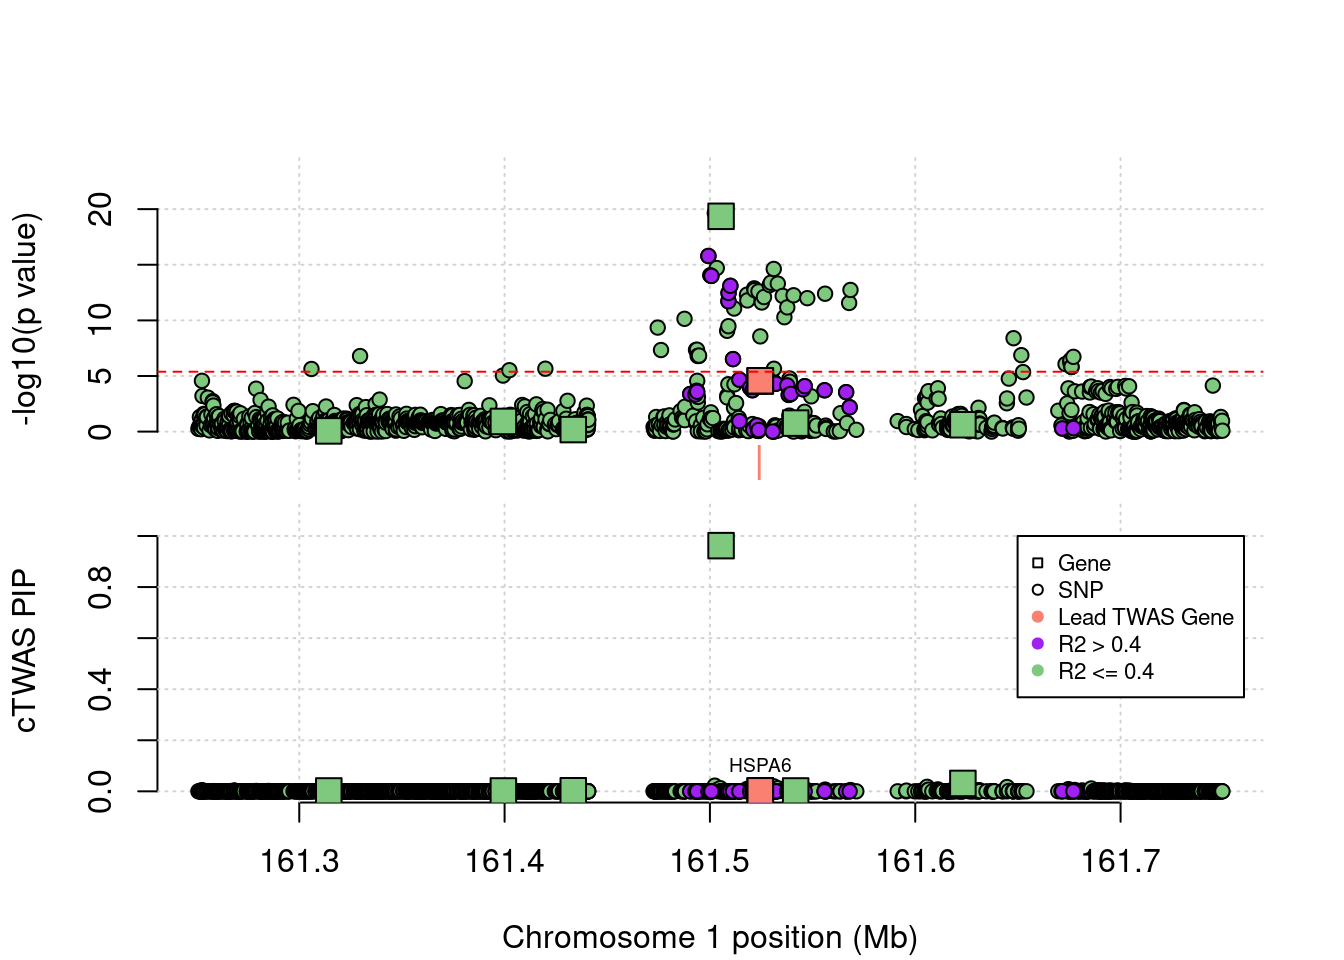
| Version | Author | Date |
|---|---|---|
| 1a96504 | wesleycrouse | 2022-05-24 |
#ctwas results
head(a[order(-a$susie_pip), c("chrom", "pos", "id", "genename", "type", "susie_pip", "PVALUE") ], 10)
chrom pos id genename type susie_pip PVALUE
6145 1 161.5054 ENSG00000143226.13 FCGR2A gene 0.96218602 19.3511989
7894 1 161.6232 ENSG00000162747.9 FCGR3B gene 0.03093833 0.6194339
753253 1 161.5024 rs10800309 <NA> SNP 0.02211631 19.6411611
753332 1 161.5311 rs10919347 <NA> SNP 0.01968287 14.6209907
753409 1 161.6057 rs34754216 <NA> SNP 0.01765824 3.2812399
753483 1 161.6447 rs1771582 <NA> SNP 0.01673461 2.9815743
753321 1 161.5245 rs9427403 <NA> SNP 0.01630958 8.5604491
753327 1 161.5297 rs11578245 <NA> SNP 0.01277265 13.3834383
753257 1 161.5050 rs7522794 <NA> SNP 0.01209890 19.3511989
753341 1 161.5331 rs79568124 <NA> SNP 0.01196164 13.3003260Locus plots for IRF8
genename <- "IRF8"
tissue <- names(which.max(results_table[genename,selected_weights]))

print(tissue)
[1] "Colon_Transverse"a <- locus_plot(genename, tissue, xlim=c(85.75, 86.25))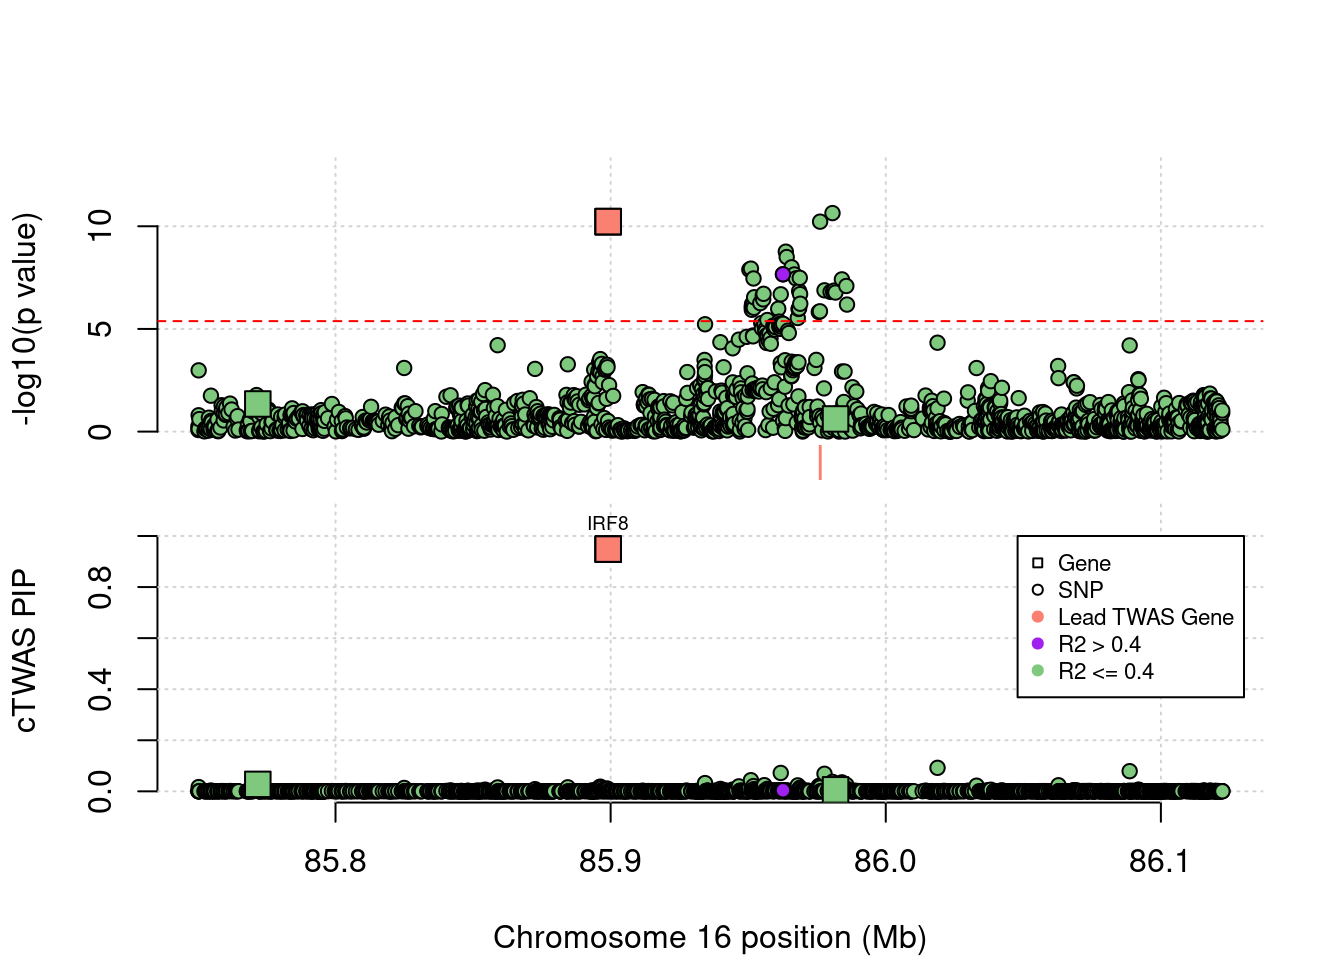
| Version | Author | Date |
|---|---|---|
| d46127d | wesleycrouse | 2022-05-24 |
#ctwas results
head(a[order(-a$susie_pip), c("chrom", "pos", "id", "genename", "type", "susie_pip", "PVALUE") ], 10)
chrom pos id genename type susie_pip PVALUE
5809 16 85.89912 ENSG00000140968.10 IRF8 gene 0.94860241 10.223711
797265 16 86.01881 rs7191245 <NA> SNP 0.09204633 4.329918
797623 16 86.08865 rs112761782 <NA> SNP 0.07892684 4.198305
797052 16 85.96183 rs113646461 <NA> SNP 0.07198270 6.687281
797134 16 85.97773 rs10521318 <NA> SNP 0.06869872 6.880062
796985 16 85.95099 rs908988 <NA> SNP 0.04355687 7.936509
797140 16 85.98064 rs16940202 <NA> SNP 0.03694880 10.640654
797153 16 85.98406 rs17445836 <NA> SNP 0.03498671 7.412613
796883 16 85.93431 rs56239618 <NA> SNP 0.03230689 5.228059
4598 16 85.77176 ENSG00000131148.8 EMC8 gene 0.02738497 1.345656#nearest gene to GWAS peak
G_list[G_list$chromosome_name==unique(a$chrom) & G_list$start_position > min(a$pos*1000000) & G_list$end_position < max(a$pos*1000000),] hgnc_symbol chromosome_name start_position end_position gene_biotype ensembl_gene_id nearby nearest distance
23002 EMC8 16 85771758 85799608 protein_coding ENSG00000131148 TRUE FALSE 181027
23004 16 85784382 85787617 lncRNA ENSG00000270184 TRUE FALSE NA
23005 16 85792415 85792933 lncRNA ENSG00000270159 TRUE FALSE NA
23006 COX4I1 16 85798633 85807068 protein_coding ENSG00000131143 TRUE FALSE 173567
23009 16 85846309 85848138 lncRNA ENSG00000286510 TRUE FALSE NA
23011 IRF8 16 85899116 85922606 protein_coding ENSG00000140968 TRUE TRUE 58029
23013 16 85924984 85948824 lncRNA ENSG00000285163 TRUE FALSE NA
23014 LINC02132 16 85935276 85936223 lncRNA ENSG00000268804 TRUE FALSE NA
23015 16 85963328 85985386 lncRNA ENSG00000285040 TRUE FALSE NA
23016 16 85981750 85984881 lncRNA ENSG00000269667 TRUE FALSE NA
23017 16 85986764 85995899 lncRNA ENSG00000285012 TRUE FALSE NA
23019 16 86081409 86089526 lncRNA ENSG00000261177 TRUE FALSE NALocus plots for CERKL
genename <- "CERKL"

tissue <- "Colon_Transverse"

print(tissue)
[1] "Colon_Transverse"a <- locus_plot(genename, tissue, xlim=c(NA, 181.75))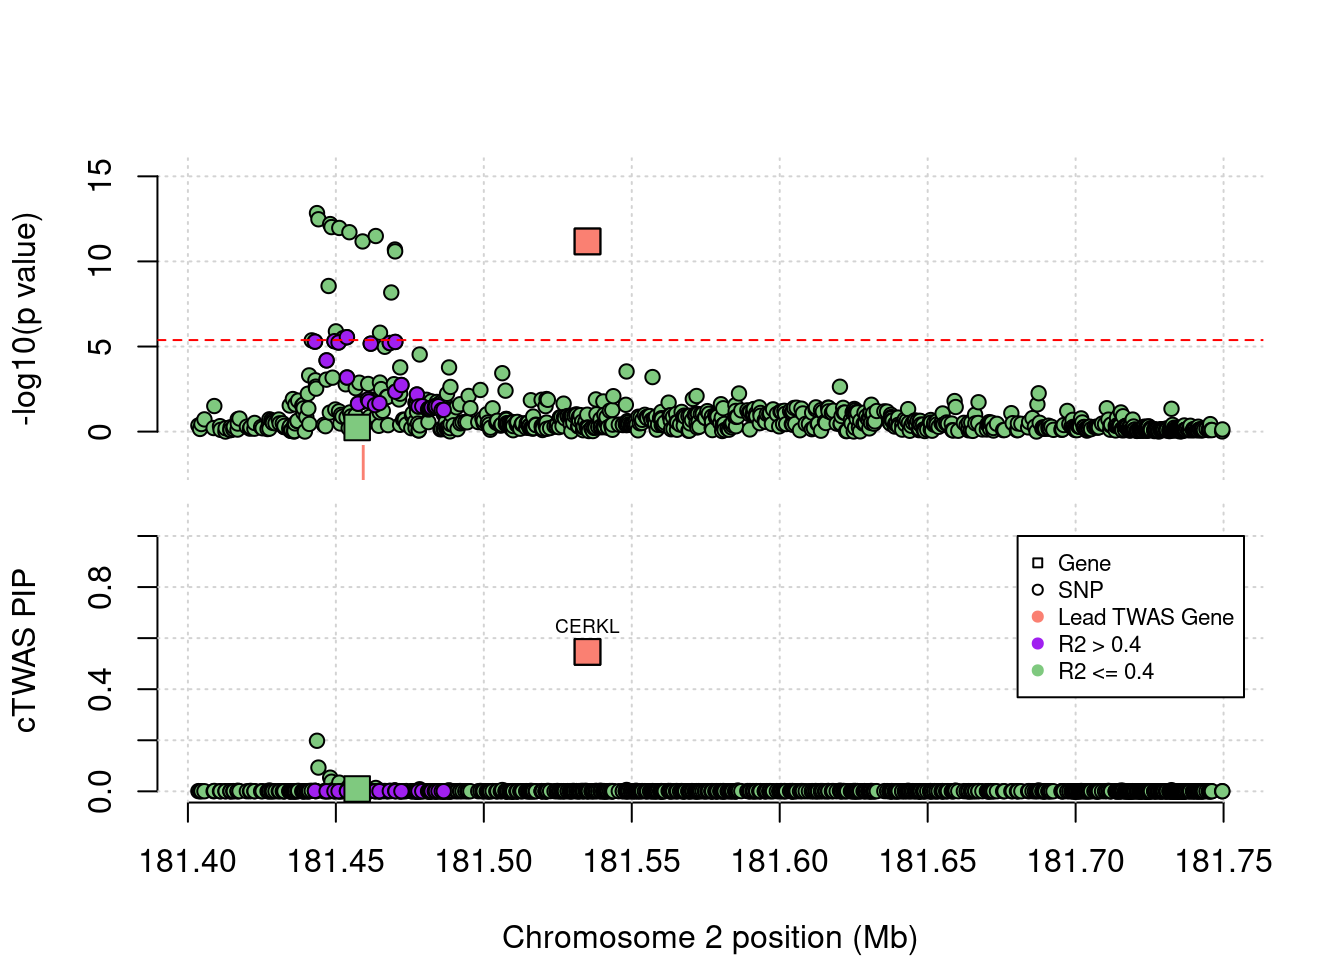
| Version | Author | Date |
|---|---|---|
| 1a96504 | wesleycrouse | 2022-05-24 |
#ctwas results
head(a[order(-a$susie_pip), c("chrom", "pos", "id", "genename", "type", "susie_pip", "PVALUE") ], 10)
chrom pos id genename type susie_pip PVALUE
11148 2 181.5350 ENSG00000188452.13 CERKL gene 0.546047435 11.1741934
752135 2 181.4436 rs6740847 <NA> SNP 0.198011913 12.8397220
752136 2 181.4441 rs6731125 <NA> SNP 0.093024511 12.4764874
752143 2 181.4481 rs4667282 <NA> SNP 0.053568214 12.1948457
752144 2 181.4485 rs4667283 <NA> SNP 0.037569617 12.0173398
752151 2 181.4512 rs7573465 <NA> SNP 0.033911779 11.9668696
752161 2 181.4546 rs1449263 <NA> SNP 0.020547562 11.7161566
752180 2 181.4635 rs2124440 <NA> SNP 0.013154151 11.4928484
3182 2 181.4572 ENSG00000115232.13 ITGA4 gene 0.009318307 0.2435671
752223 2 181.4783 rs77263992 <NA> SNP 0.008054448 4.5323665#nearest gene to GWAS peak
G_list[G_list$chromosome_name==unique(a$chrom) & G_list$start_position > min(a$pos*1000000) & G_list$end_position < max(a$pos*1000000),] hgnc_symbol chromosome_name start_position end_position gene_biotype ensembl_gene_id nearby nearest distance
33550 2 181422154 181425749 lncRNA ENSG00000226681 TRUE FALSE NA
33551 ITGA4 2 181457202 181538940 protein_coding ENSG00000115232 TRUE TRUE 13577
33552 2 181683113 181685707 lncRNA ENSG00000234595 TRUE FALSE NA
33553 2 181690380 181693415 lncRNA ENSG00000225570 TRUE FALSE NA
33708 CERKL 2 181535041 181680665 protein_coding ENSG00000188452 TRUE FALSE 91416
33709 NEUROD1 2 181668295 181680827 protein_coding ENSG00000162992 TRUE FALSE 224670
sessionInfo()R version 3.6.1 (2019-07-05)
Platform: x86_64-pc-linux-gnu (64-bit)
Running under: Scientific Linux 7.4 (Nitrogen)
Matrix products: default
BLAS/LAPACK: /software/openblas-0.2.19-el7-x86_64/lib/libopenblas_haswellp-r0.2.19.so
locale:
[1] LC_CTYPE=en_US.UTF-8 LC_NUMERIC=C LC_TIME=en_US.UTF-8 LC_COLLATE=en_US.UTF-8 LC_MONETARY=en_US.UTF-8 LC_MESSAGES=en_US.UTF-8 LC_PAPER=en_US.UTF-8 LC_NAME=C LC_ADDRESS=C LC_TELEPHONE=C LC_MEASUREMENT=en_US.UTF-8 LC_IDENTIFICATION=C
attached base packages:
[1] stats graphics grDevices utils datasets methods base
other attached packages:
[1] ggrepel_0.9.1 ggplot2_3.3.5 disgenet2r_0.99.2 WebGestaltR_0.4.4 enrichR_3.0
loaded via a namespace (and not attached):
[1] Rcpp_1.0.6 svglite_1.2.2 lattice_0.20-38 rprojroot_2.0.2 digest_0.6.20 foreach_1.5.1 utf8_1.2.1 R6_2.5.0 plyr_1.8.4 RSQLite_2.2.7 evaluate_0.14 httr_1.4.1 pillar_1.6.1 gdtools_0.1.9 rlang_0.4.11 curl_3.3 data.table_1.14.0 blob_1.2.1 whisker_0.3-2 Matrix_1.2-18 rmarkdown_1.13 apcluster_1.4.8 labeling_0.3 readr_1.4.0 stringr_1.4.0 bit_4.0.4 igraph_1.2.4.1 munsell_0.5.0 compiler_3.6.1 httpuv_1.5.1 xfun_0.8 pkgconfig_2.0.3 htmltools_0.3.6 tidyselect_1.1.0 tibble_3.1.2 workflowr_1.6.2 codetools_0.2-16 fansi_0.5.0 crayon_1.4.1 dplyr_1.0.7 withr_2.4.1 later_0.8.0 grid_3.6.1 jsonlite_1.6 gtable_0.3.0 lifecycle_1.0.0 DBI_1.1.1 git2r_0.26.1 magrittr_2.0.1 scales_1.1.0 cachem_1.0.5 stringi_1.4.3 farver_2.1.0 reshape2_1.4.3 fs_1.3.1
[56] promises_1.0.1 doRNG_1.8.2 doParallel_1.0.16 ellipsis_0.3.2 generics_0.0.2 vctrs_0.3.8 rjson_0.2.20 iterators_1.0.13 tools_3.6.1 bit64_4.0.5 glue_1.4.2 purrr_0.3.4 hms_1.1.0 rngtools_1.5 fastmap_1.1.0 parallel_3.6.1 yaml_2.2.0 colorspace_1.4-1 memoise_2.0.0 knitr_1.23